
Non-Enzymatic Glucose Sensor Composed of Carbon-Coated Nano-Zinc Oxide


Abstract
:1. Introduction
2. Materials and Methods
3. Results and Discussion
4. Conclusions
Acknowledgments
Author Contributions
Conflicts of Interest
References
- Banica, F.G. Chemical Sensors and Biosensors: Fundamentals and Applications; John Wiley & Sons: New York, NY, USA, 2012; pp. 3–13. [Google Scholar]
- Toghill, E.K.; Richard, G.C. Electrochemical non-enzymatic glucose sensors: A perspective and an evaluation. Int. J. Electrochem. Sci. 2010, 5, 1246–1301. [Google Scholar]
- Yogeswaran, U.; Chen, S.M. A review on the electrochemical sensors and biosensors composed of nanowires as sensing material. Sensors 2008, 8, 290–313. [Google Scholar] [CrossRef] [PubMed]
- Chung, R.J.; Wang, H.Y.; Li, Y.C.; Yeh, P.H. Preparation and sensor application of carbon coated zinc oxide nanorods array. J. Aust. Ceram. Soc. 2013, 49, 81–88. [Google Scholar]
- Kavitha, T.; Gopalan, A.I.; Lee, K.P.; Park, S.Y. Glucose sensing, photocatalytic and antibacterial properties of graphene-ZnO nanoparticle hybrids. Carbon 2012, 50, 2994–3000. [Google Scholar] [CrossRef]
- Venditti, I.; Barbero, N.; Russo, M.V.; Carlo, A.D.; Decker, F.; Fratoddi, I.; Barolo, C.; Dini, D. Electrodeposited ZnO with squaraine sentisizers as photoactive anode of DSCs. Mater. Res. Exp. 2014, 1, 015040. [Google Scholar] [CrossRef]
- Carmona-Ribeiro, A.M. Biomimetic nanoparticles: Preparation, characterization and biomedical applications. Int. J. Nanomed. 2010, 5, 249–259. [Google Scholar] [CrossRef]
- Chung, R.J.; Lin, Z.C.; Yang, P.K.; Lai, K.Y.; Jen, S.F.; Chiu, P.W. Hybrid ZnO NR/graphene structures as advanced optoelectronic devices with high transmittance. Nanoscale Res. Lett. 2013, 8, 350. [Google Scholar] [CrossRef] [PubMed]
- Comini, E.; Sberveglieri, G. Metal oxide nanowires as chemical sensors. Mater. Today 2010, 13, 36–44. [Google Scholar] [CrossRef]
- Segev-Bar, M.; Haick, H. Flexible sensors based on nanoparticles. ACS Nano 2013, 7, 8366–8378. [Google Scholar] [CrossRef] [PubMed]
- Hajry, A.A.; Umar, A.; Hahn, Y.B.; Kim, D.H. Growth, properties and dye-sensitized solar cells-applications of ZnO nanorods grown by low-temperture solution process. Superlattice Microst. 2009, 45, 529–534. [Google Scholar] [CrossRef]
- Wei, A.; Pan, L.H.; Huang, W. Recent progress in the ZnO nanostructure-based sensors. Mater. Sci. Eng. B 2011, 176, 1409–1421. [Google Scholar] [CrossRef]
- Bearzotti, A.; Macagnano, A.; Pantalei, S.; Zampetti, E.; Venditti, I.; Fratoddi, I.; Russo, M.V. Alcohol vapors sensory properties of nanostructured conjugated polymer. J. Phys. Condens. Mat. 2008, 20, 474207. [Google Scholar] [CrossRef]
- Fratoddi, I.; Bearzotti, A.; Venditti, I.; Cametti, C.; Russo, M.V. Role of nanostructured polymers on the improvement of electrical response-based relative humidity sensors. Sens. Actuators B Chem. 2016, 225, 96–108. [Google Scholar] [CrossRef]
- He, J.H.; Ho, C.H.; Chen, C.Y. Polymer functionalized ZnO nanobelt as oxygen sensors with a significant response enhancement. Nanotechnology 2009, 20, 065503. [Google Scholar] [CrossRef] [PubMed]
- Hsu, Y.W.; Hsu, T.K.; Sun, C.L.; Nien, Y.T.; Pu, N.W.; Ger, M.D. Synthesis of CuO/graphene nanocomposites for nonenzymatic electrochemical glucose biosensor applications. Electrochim. Acta 2012, 8, 152–157. [Google Scholar] [CrossRef]
- Wu, J.; Yin, F. Easy fabrication of a sensitive non-enzymatic glucose sensor based on electrospinning CuO-ZnO nanocomposites. Integr. Ferroelectr. 2013, 147, 47–58. [Google Scholar] [CrossRef]
- Yoon, S.S.; Ramadoss, A.; Saravanakumar, B.; Kim, S.J. Novel Cu/CuO/ZnO hybrid hierarchical nanostructures for non-enzymatic glucose sensor application. J. Electroanal. Chem. 2014, 717–718, 90–95. [Google Scholar]
- Wei, A.; Sun, X.W.; Wang, J.X.; Lei, Y.; Cai, X.P.; Li, C.M.; Dong, Z.L.; Huang, W. Enzymatic glucose biosensor based on ZnO nanorod array grown by hydrothermal decomposition. Appl. Phys. Lett. 2006, 89, 123902. [Google Scholar] [CrossRef]
- Liu, J.P.; Guo, C.X.; Li, C.M.; Li, Y.Y.; Chi, Q.B.; Huang, X.T.; Liao, L.; Yu, T. Carbon-decorated ZnO nanowire array: A novel platform for direct electrochemistry of enzymes and biosensing applications. Electrochem. Commun. 2009, 11, 202–205. [Google Scholar] [CrossRef]
- Ren, X.L.; Chen, D.; Meng, X.W.; Tang, F.Q.; Hou, X.Q.; Han, D.; Zang, L. Zinc oxide nanoparticles/glucose oxidase photoelectrochemical system for the fabrication of biosensor. J. Colloid Inter. Sci. 2009, 334, 183–187. [Google Scholar] [CrossRef] [PubMed]
- Hwa, K.Y.; Subramani, B. Synthesis of zinc oxide nanoparticles on graphene–carbon nanotube hybrid for glucose biosensor applications. Biosens. Bioelectron. 2014, 62, 127–133. [Google Scholar] [CrossRef] [PubMed]
- Marie, M.; Mandal, S.; Manasreh, O. An electrochemical glucose sensor based on zinc oxide nanorods. Sensors 2015, 15, 18714–18723. [Google Scholar] [CrossRef] [PubMed]
- Aini, B.N.; Siddiquee, S.; Ampon, K.; Rodrigues, K.F.; Suryani, S. Development of glucose biosensor based on ZnO nanoparticles film and glucose oxidase-immobilized eggshell membrane. Sens. Biosensing. Res. 2015, 4, 46–56. [Google Scholar] [CrossRef]
- Cui, H.F.; Ye, J.S.; Zhang, W.D.; Li, C.M.; Luong, J.H.T.; Sheu, F.S. Selective and sensitive electro-chemical detection of glucose in neutral solution using platinum-lead alloy nanoparticle/carbon nanotube nanocomposites. Anal. Chim. Acta 2007, 594, 175–183. [Google Scholar] [CrossRef] [PubMed]
- Kang, X.H.; Mai, Z.B.; Zou, X.Y.; Cai, P.X.; Mo, J.Y. A sensitive nonenzymatic glucose sensor in alkaline media with a copper nanocluster/multiwall carbon nano tube-modified glassy carbon electrode. Anal. Biochem. 2007, 363, 143–150. [Google Scholar] [CrossRef] [PubMed]
- Singh, K.; Umar, A.; Kumar, A.; Chaudhary, G.R.; Singh, S.; Mehta, S.K. Non-enzymatic glucose sensor based on well-crystallized ZnO nanoparticles. Sci. Adv. Mater. 2012, 4, 994–1000. [Google Scholar] [CrossRef]
- Zhou, C.; Xu, L.; Song, J.; Xing, R.; Xu, S.; Liu, D.; Song, H. Ultrasensitive non-enzymatic glucose sensor based on three-dimensional network of ZnO-CuO hierarchical nanocomposites by electrospinning. Sci. Rep. 2014, 4, 7382. [Google Scholar] [CrossRef]
- Li, X.; Zhao, C.; Liu, X.Y. A paper-based microfluidic biosensor integrating zinc oxide nanowires for electrochemical glucose detection. Microsyst. Nanoeng. 2015, 1, 15014. [Google Scholar] [CrossRef]
- Zhang, X.H.; Zhang, Z.; Liao, Q.L.; Liu, S.; Kang, Z.; Zhang, Y. Nonenzymatic glucose sensor based on in situ reduction of Ni/NiO-graphene nanocomposite. Sensors 2016, 16, 1791. [Google Scholar] [CrossRef] [PubMed]
- Frackowiak, E. Carbon materials for supercapacitor application. Phys. Chem. Chem. Phys. 2007, 9, 1774–1785. [Google Scholar] [CrossRef] [PubMed]
- Ferrari, A.C.; Robertson, J. Interpretation of Raman spectra of disordered and amorphous carbon. Phys. Rev. B 2000, 61, 14095–14107. [Google Scholar] [CrossRef]


| Sensor | Detect Limit (mM) | Linear Range (mM) | Sensitivity (μA/cm2mM) | Reference |
|---|---|---|---|---|
| Enzymatic Glucose Sensor | ||||
| GOx/ZnO/Au | 10−2 | 0.01–3.45 | 23.1 | Wei et al. 2006 [19] |
| GOx/C@ZnO nanowire/Ti | 10−3 | 0.01–16 | 35.3 | Liu et al. 2009 [20] |
| GOx/ZnO | 5.6 × 10⁻³ | Not mentioned | 21 | Ren et al. 2009 [21] |
| GR–CNT/ZnO–GOx | 4.5 × 10⁻³ | 0.01–6.5 | 5.36 | Hwa et al. 2014 [22] |
| GOx/BSA/Nafion/ZnO nanorod/GE | 2.2 × 10⁻⁴ | 0.6–1.4 | 10.911 | Marie et al. 2015 [23] |
| GOx/ZnO nanoparticle/IL/ESM | 10−10 | 10−9–600 | Not mentioned | Noor et al. 2015 [24] |
| GOx/Pt-Pb/CNTs | 10−3 | Up to 11 | 17.8 | Cui et al. 2007 [25] |
| GOx/Cu/MWCNTs | 2.1 × 10⁻⁴ | 0.7–3.5 | 251.4 | Kang et al. 2007 [26] |
| Non-enzymatic glucose sensor | ||||
| ZnO nanoparticle | Not mentioned | 1–10 | 38.133 | Singh et al. 2012 [27] |
| ZnO–CuO | 2.1 × 10⁻⁴ | 0.47 × 10⁻³–1.6 | 3066.4 | Zhou et al. 2014 [28] |
| ZnO nanowire/EμPAD | 5.95 × 10⁻² | 0–15 | 8.24 | Zhao et al. 2015 [29] |
| Ni/NiO-rGO-Nafion/SPE | 1.8 × 10⁻³ | 0.03–6.44 | 1997 | Zhang et al. 2016 [30] |
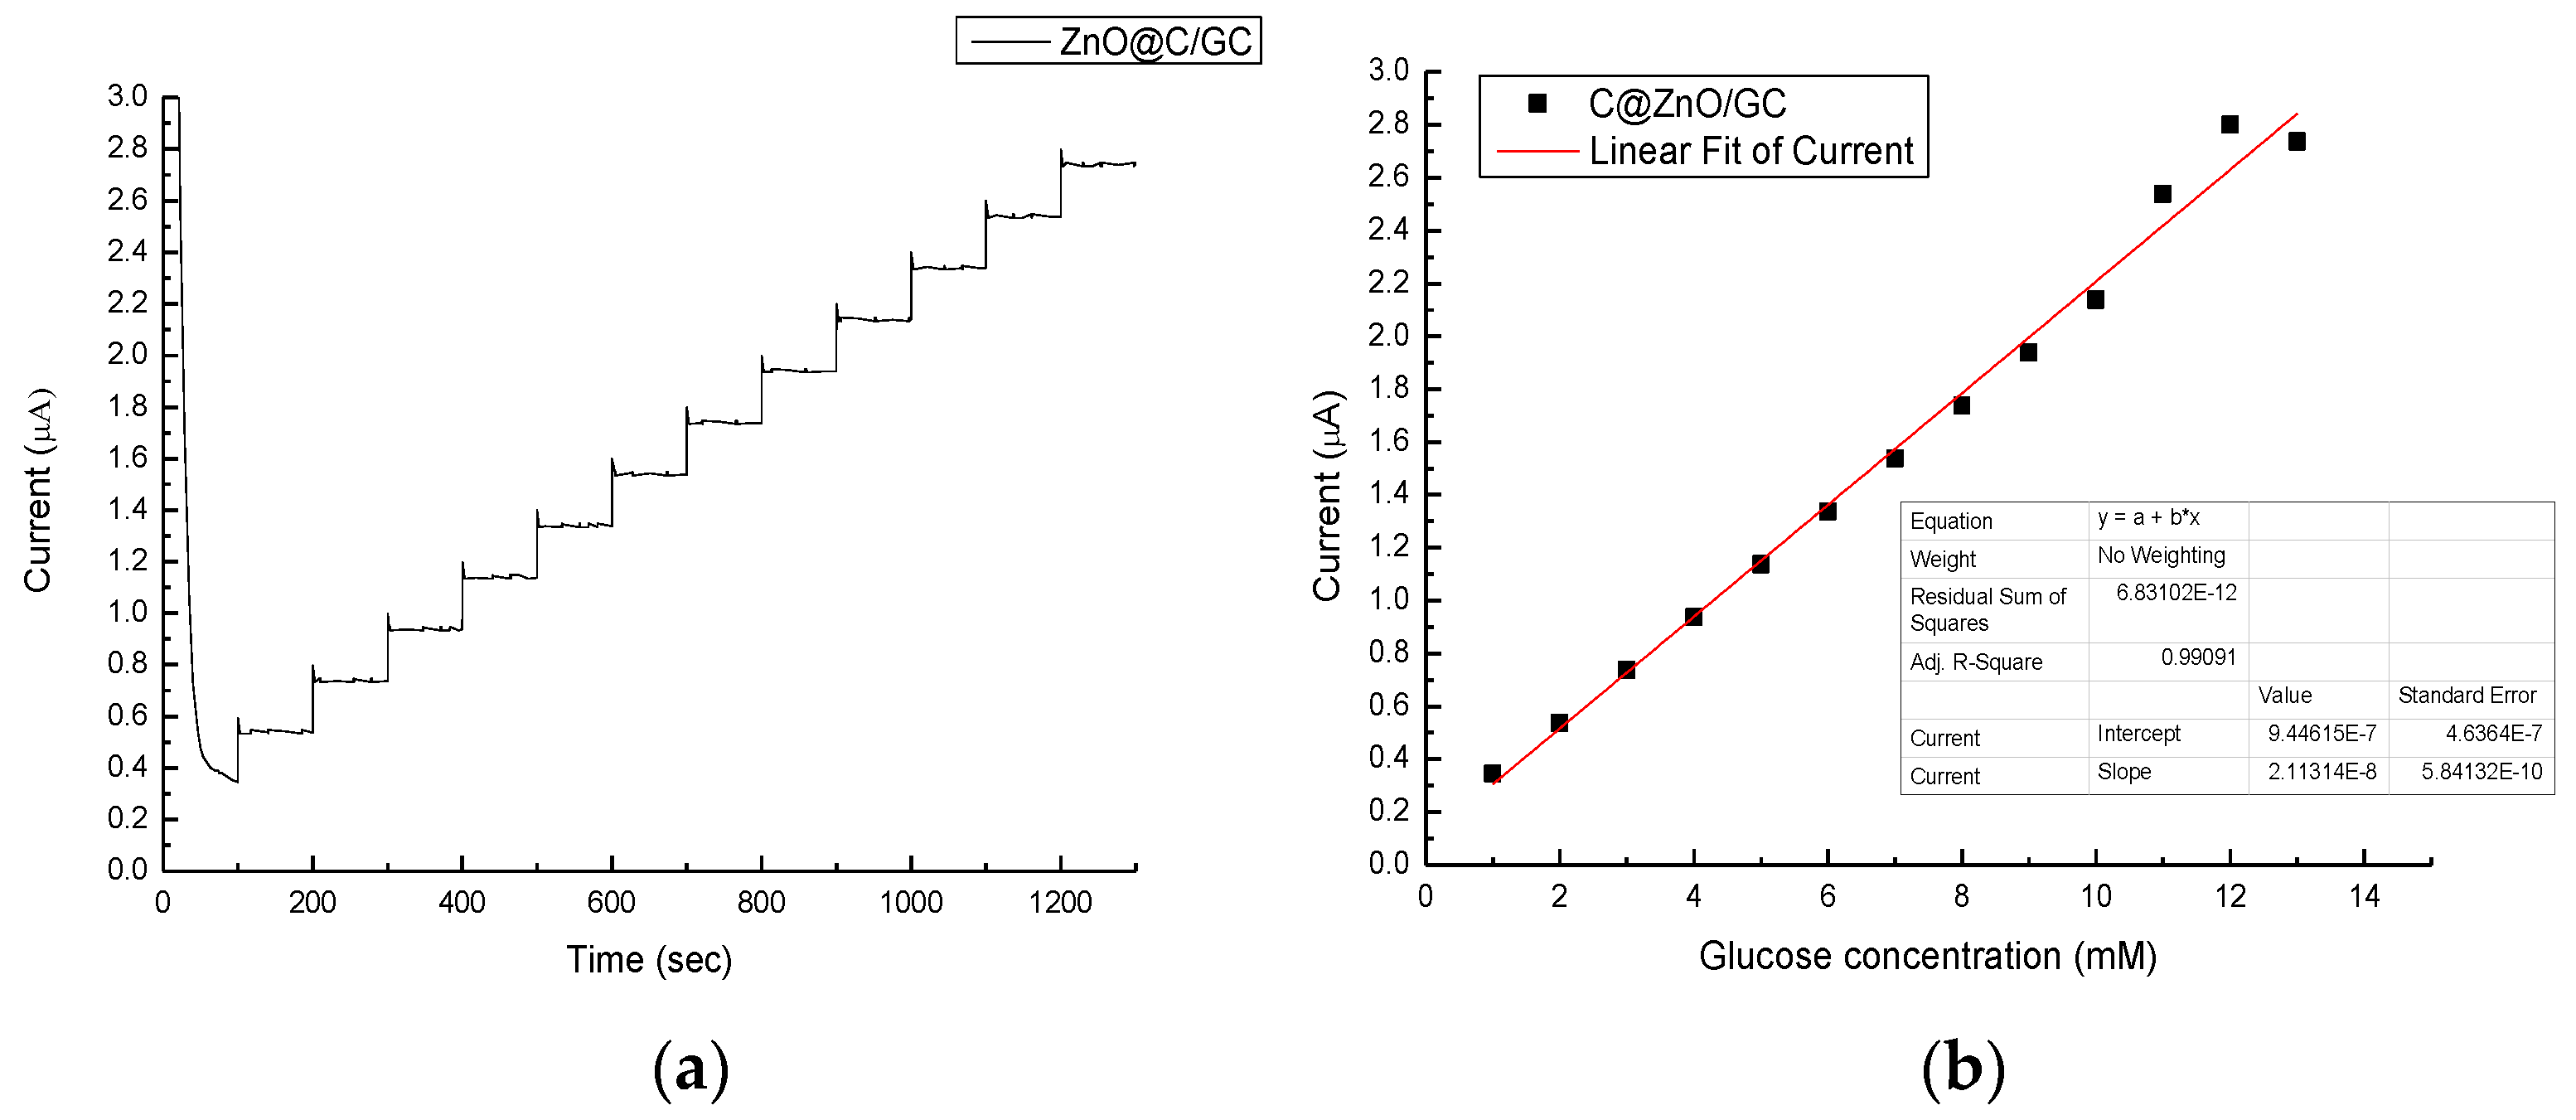
| C@ZnO/GC | 1 | 1–13.8 | 2.97 | This study |
© 2017 by the authors. Licensee MDPI, Basel, Switzerland. This article is an open access article distributed under the terms and conditions of the Creative Commons Attribution (CC BY) license ( http://creativecommons.org/licenses/by/4.0/).
Share and Cite
Chung, R.-J.; Wang, A.-N.; Liao, Q.-L.; Chuang, K.-Y. Non-Enzymatic Glucose Sensor Composed of Carbon-Coated Nano-Zinc Oxide. Nanomaterials 2017, 7, 36. https://doi.org/10.3390/nano7020036
Chung R-J, Wang A-N, Liao Q-L, Chuang K-Y. Non-Enzymatic Glucose Sensor Composed of Carbon-Coated Nano-Zinc Oxide. Nanomaterials. 2017; 7(2):36. https://doi.org/10.3390/nano7020036
Chicago/Turabian StyleChung, Ren-Jei, An-Ni Wang, Qing-Liang Liao, and Kai-Yu Chuang. 2017. "Non-Enzymatic Glucose Sensor Composed of Carbon-Coated Nano-Zinc Oxide" Nanomaterials 7, no. 2: 36. https://doi.org/10.3390/nano7020036
APA StyleChung, R.-J., Wang, A.-N., Liao, Q.-L., & Chuang, K.-Y. (2017). Non-Enzymatic Glucose Sensor Composed of Carbon-Coated Nano-Zinc Oxide. Nanomaterials, 7(2), 36. https://doi.org/10.3390/nano7020036