Accumulation and Toxicity of Copper Oxide Engineered Nanoparticles in a Marine Mussel
Abstract
:1. Introduction
2. Results


3. Discussion
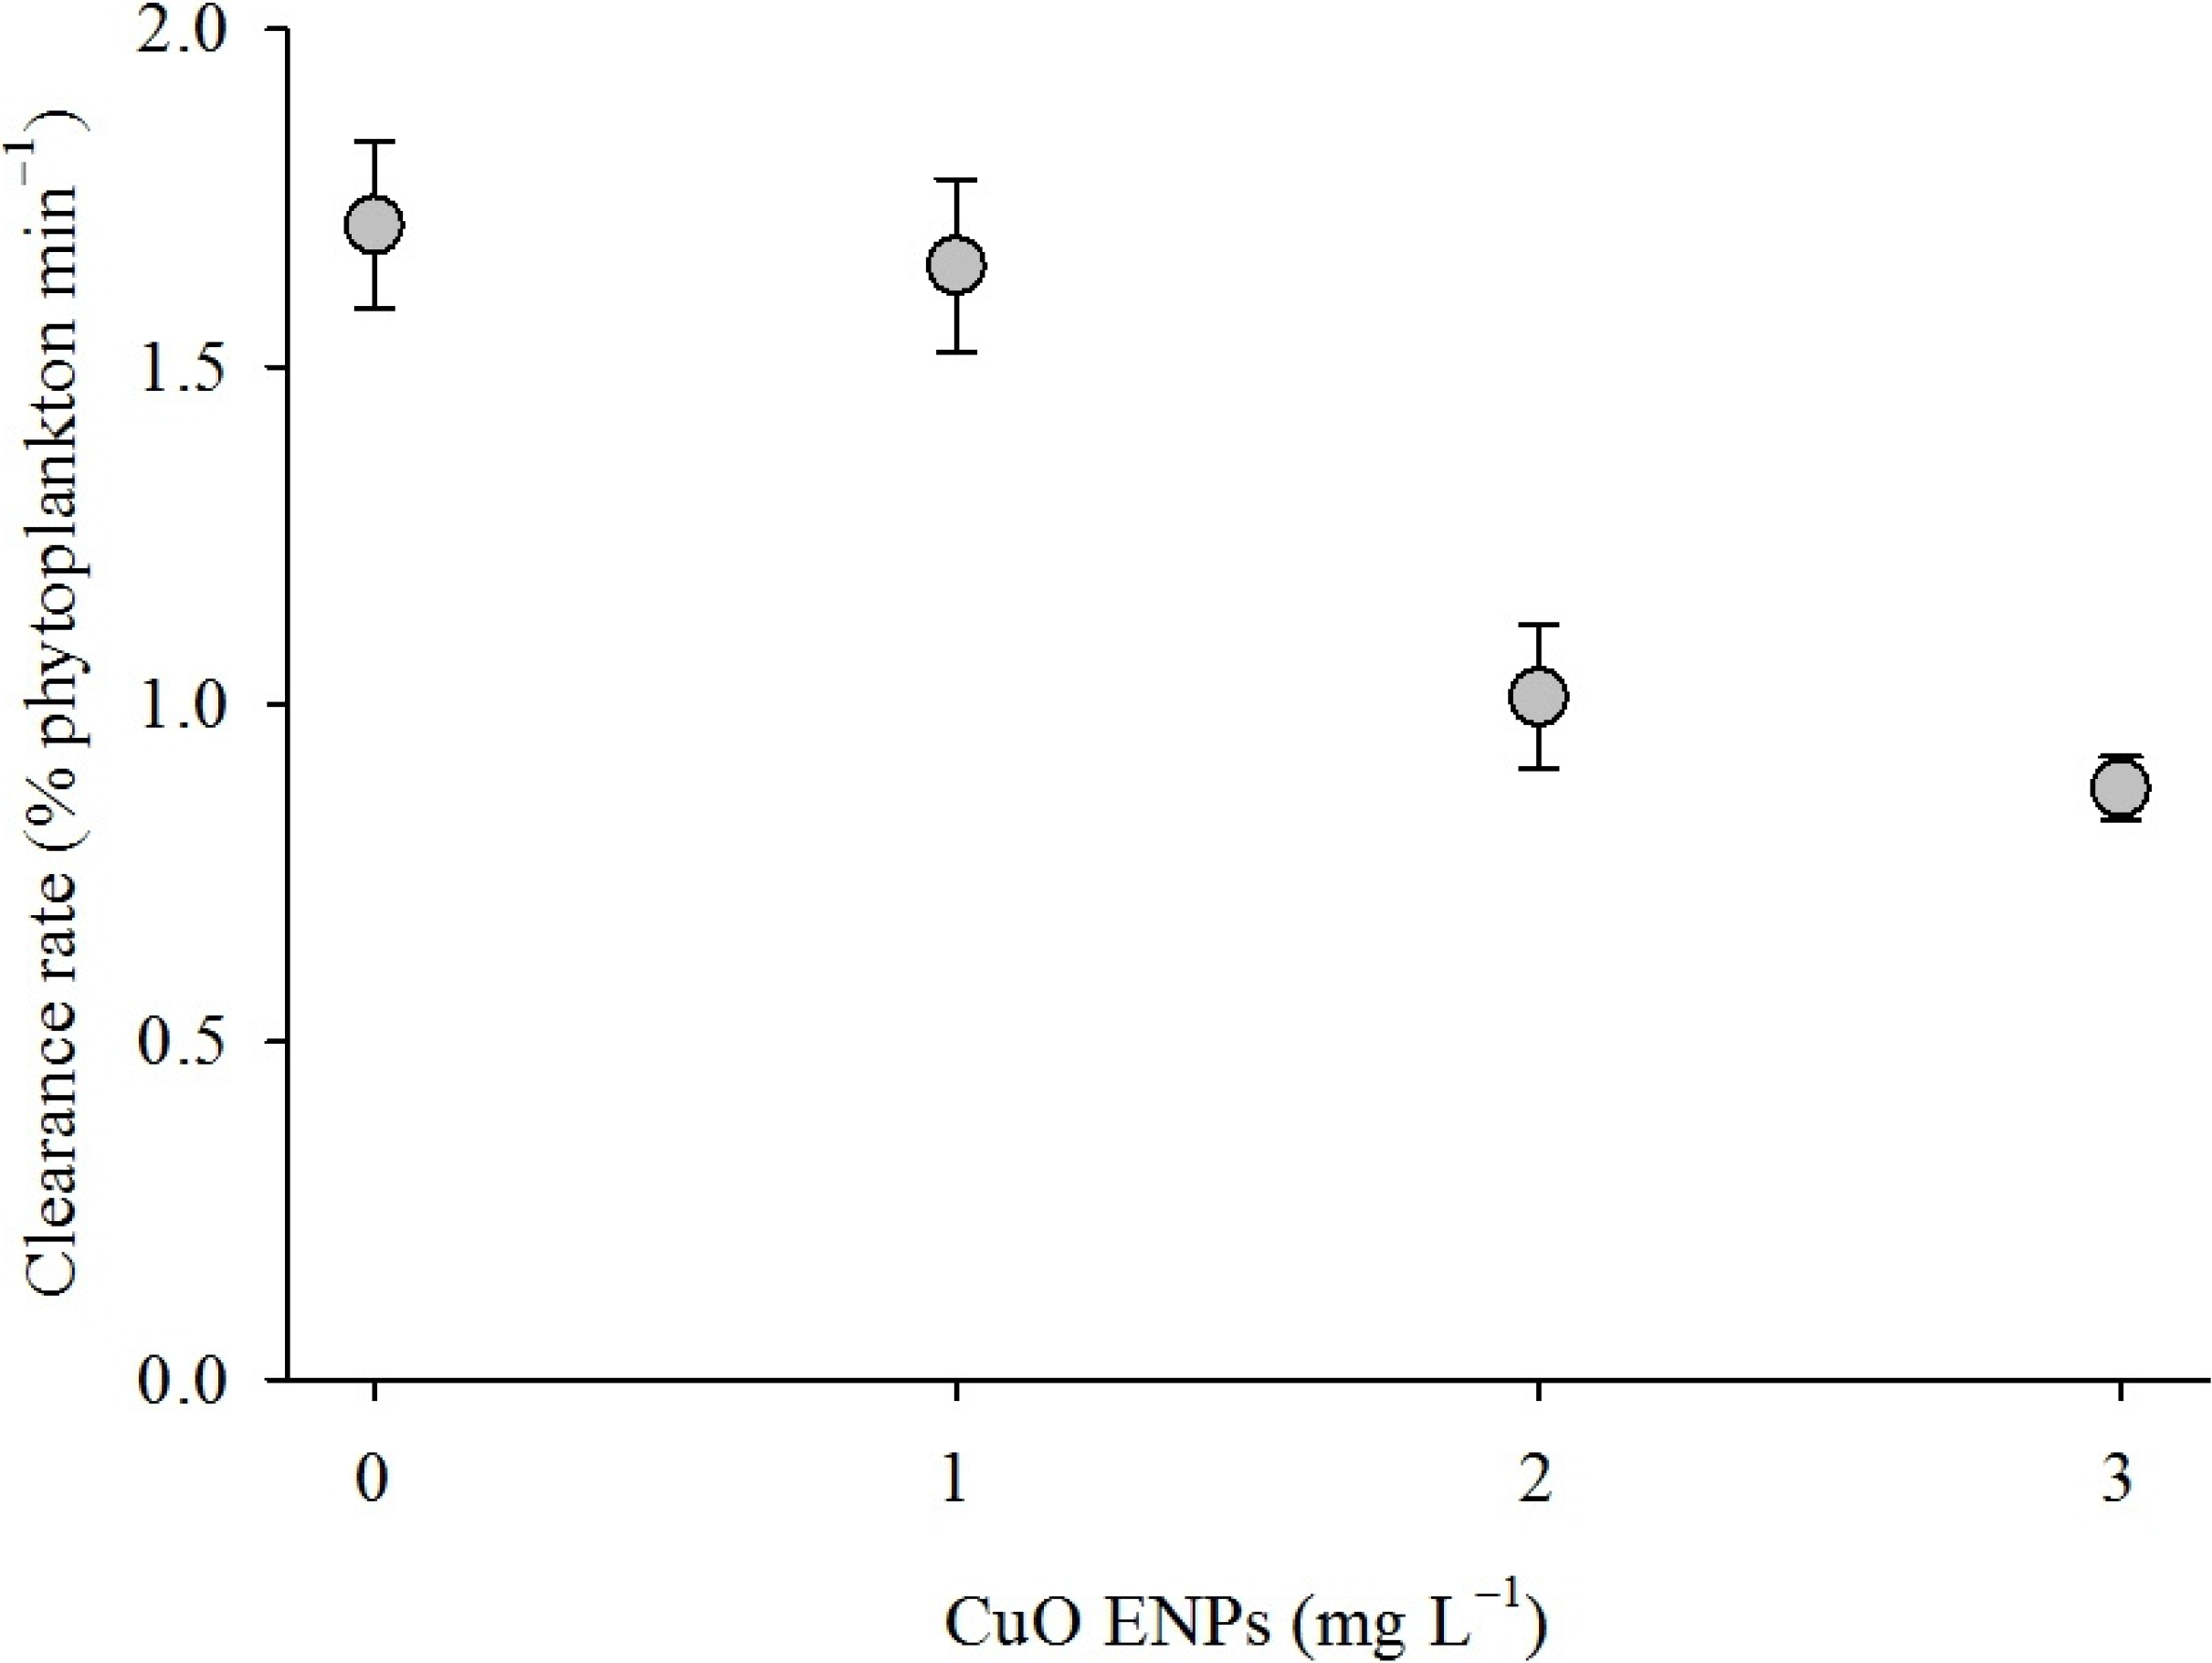
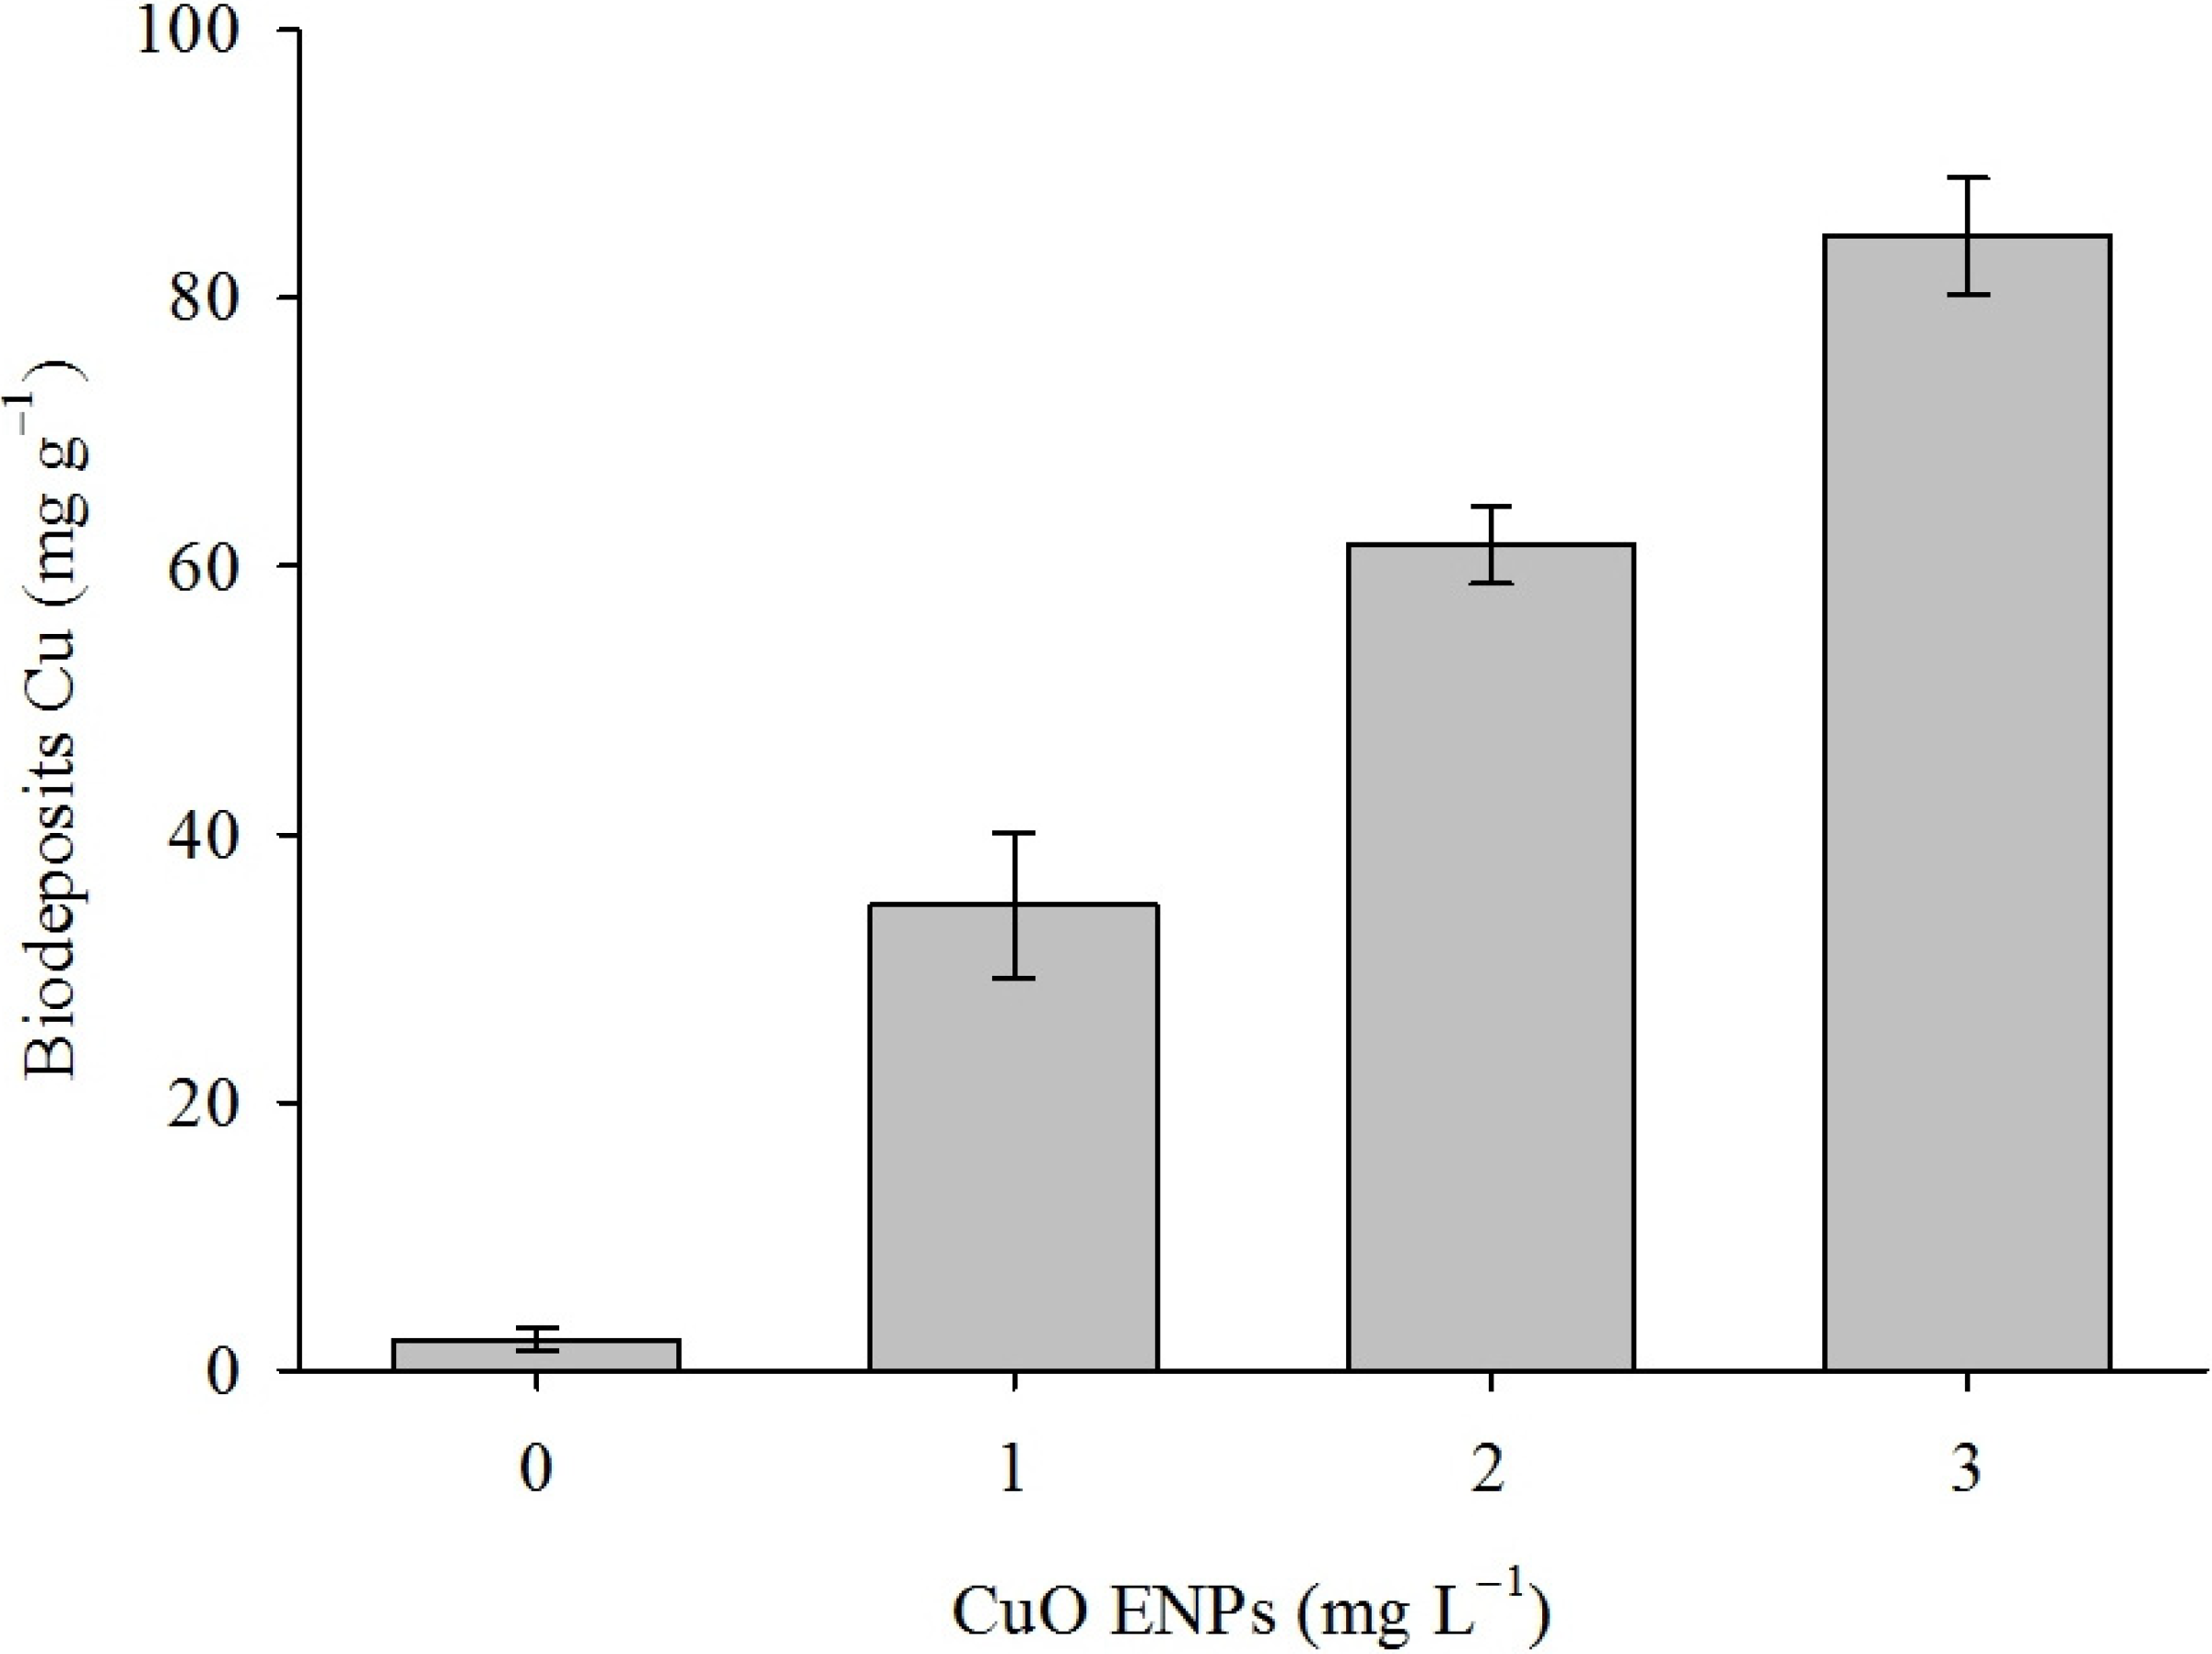
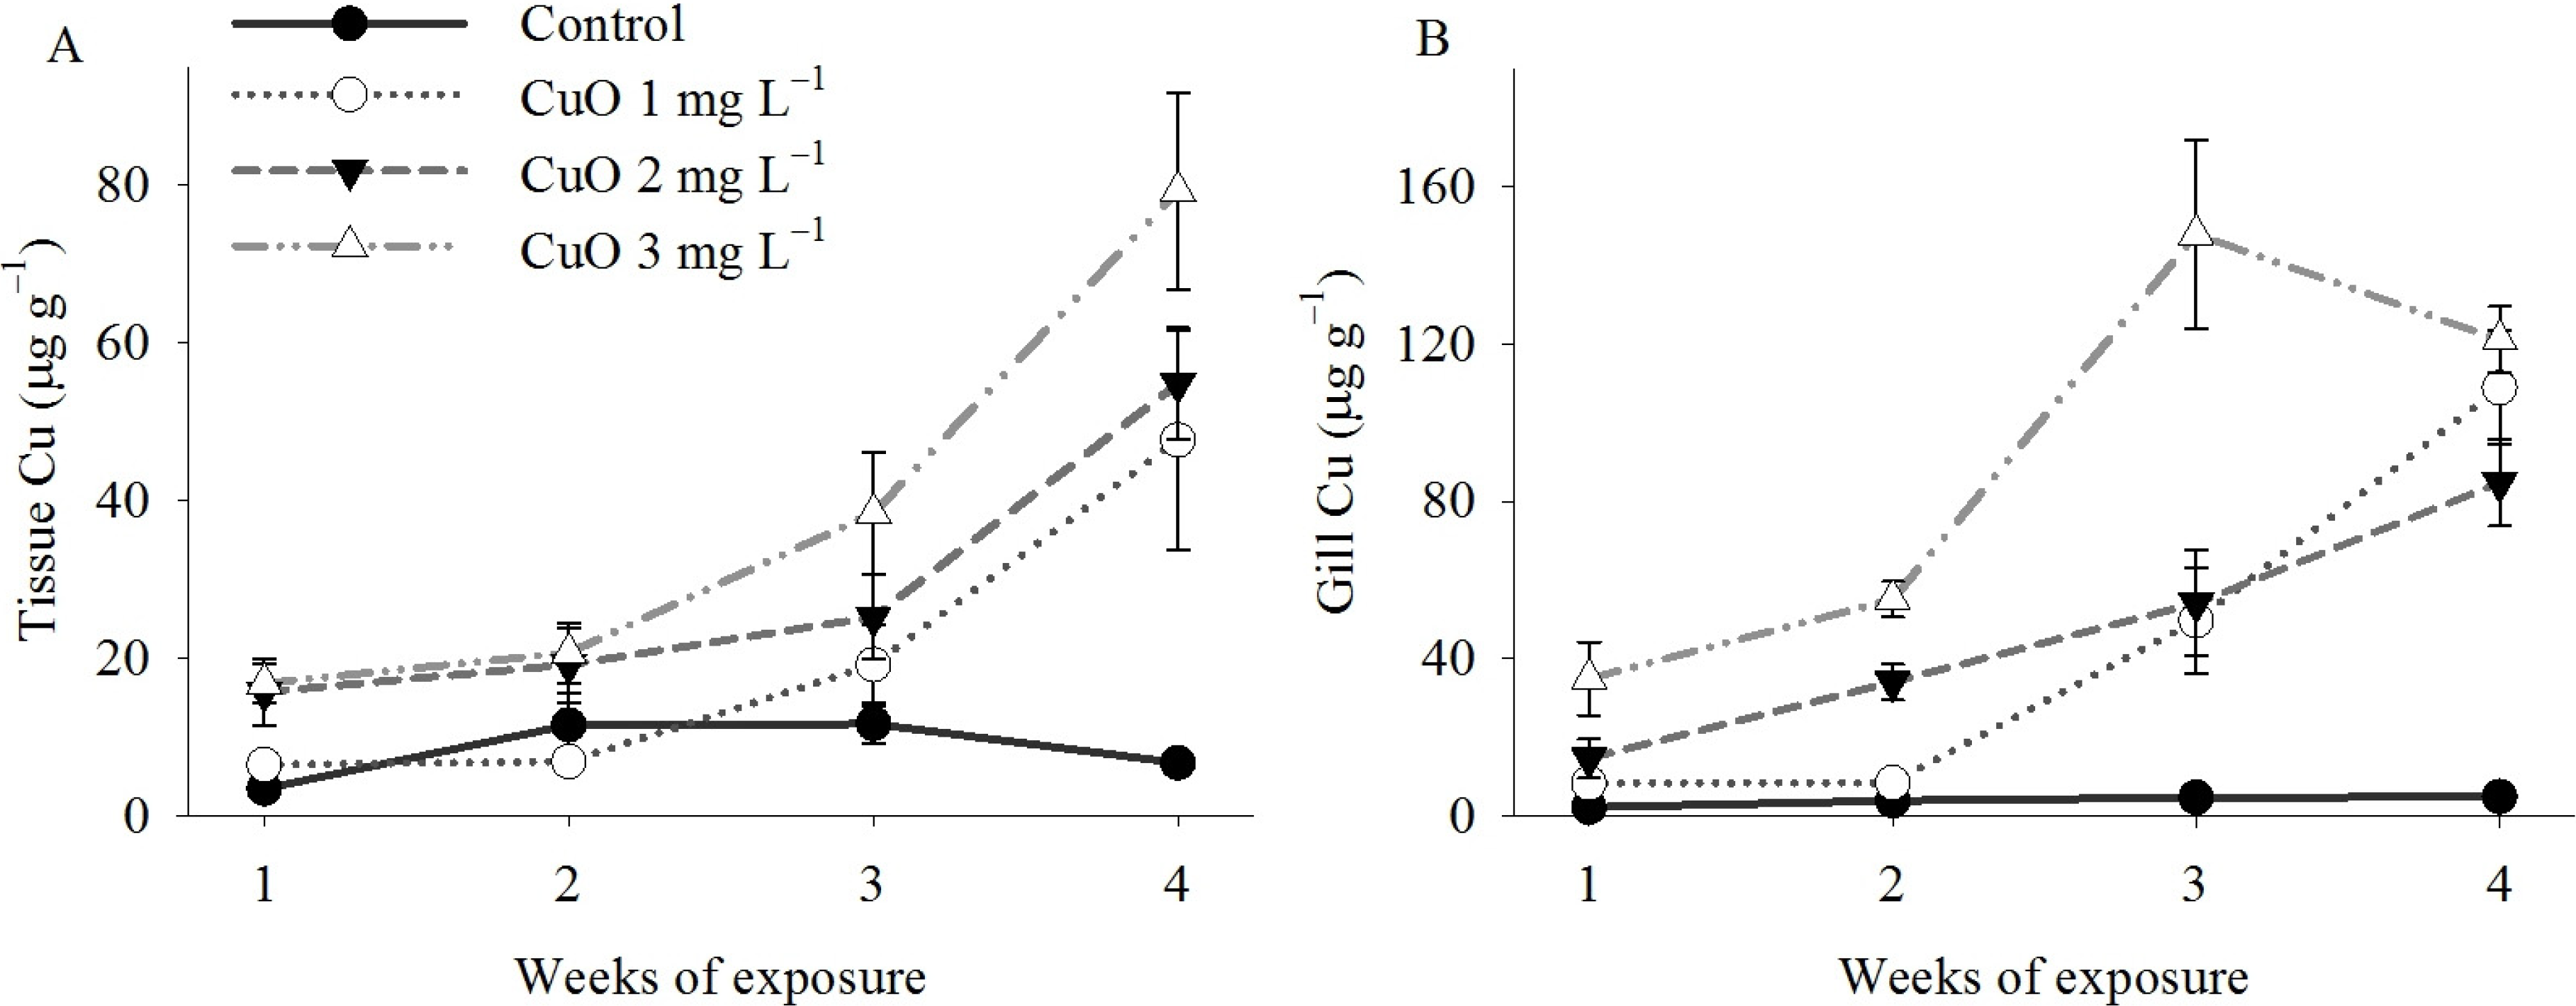
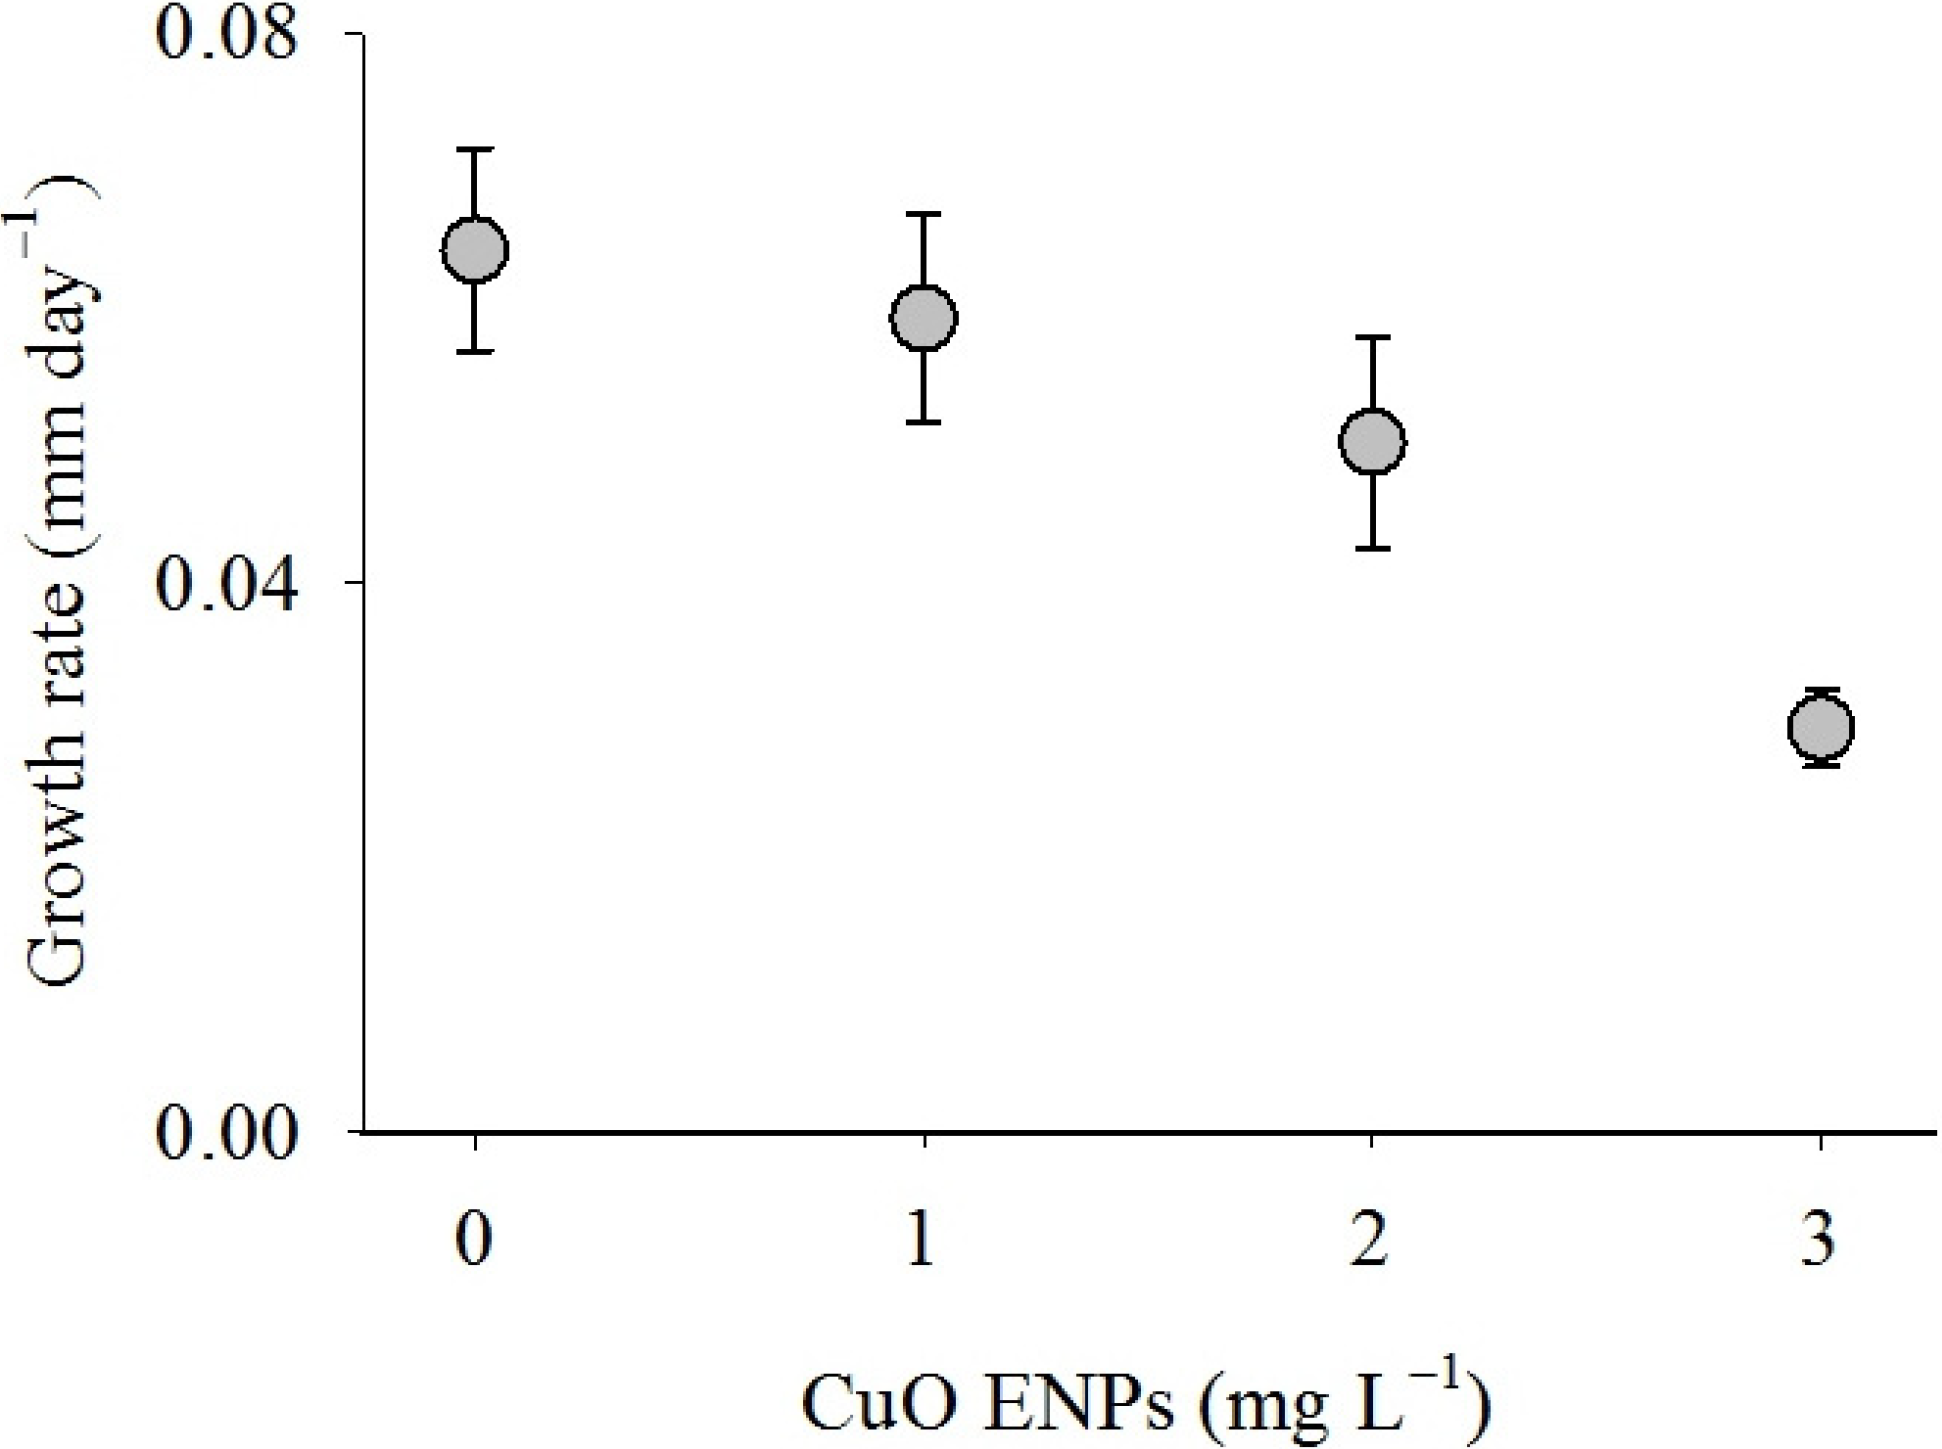
| Feeding × 102 | Excretion/Rejection | Bioaccumulation (Tissue) | Bioaccumulation (Gill) | Growth × 102 | |
|---|---|---|---|---|---|
| Intercept | 1.99 (0.15) *** | 0.83 (5.3) | 0.78 (7.15) | −17.01 (14.85) | 3.16 (1.34) * |
| [CuO] | −0.31 (0.05) *** | 27.48 (1.70) *** | −4.31 (3.82) | 3.17 (7.94) | 1.39 (0.72) |
| Exposure time | −0.08 (0.05) | 1.47 (1.70) | 3.26 (2.61) | 9.61 (5.42) | 1.03 (0.41) * |
| [CuO] × Time | 5.72 (1.40) *** | 9.15 (2.90) ** | −0.68 (0.22) ** | ||
| r2 | 0.37 | 0.85 | 0.72 | 0.74 | 0.20 |
| p value | 3.31 × 10⁻⁸ | 2.2 × 10⁻¹⁶ | 2.36 × 10⁻¹² | 5.41 × 10⁻¹³ | 0.0011 |
| F value | 21.86 | 131.6 | 38.42 | 42.13 | 5.92 |
| DF | 75 | 45 | 44 | 44 | 73 |
4. Experimental Section
5. Conclusions
Acknowledgments
Author Contributions
Conflicts of Interest
References
- Zhou, K.; Wang, R.; Xu, B.; Li, Y. Synthesis, characterization and catalytic properties of CuO nanocrystals with various shapes. Nanotechnology 2006, 17, 3939. [Google Scholar] [CrossRef]
- Zhu, H.; Han, D.; Meng, Z.; Wu, D.; Zhang, C. Preparation and thermal conductivity of CuO nanofluid via a wet chemical method. Nanoscale Res. Lett. 2011, 6, 181. [Google Scholar] [CrossRef]
- Ren, G.; Hu, D.; Cheng, E.W.C.; Vargas-Reus, M.A.; Reip, P.; Allaker, R.P. Characterisation of copper oxide nanoparticles for antimicrobial applications. Int. J. Antimicrob. Agents 2009, 33, 587–590. [Google Scholar] [CrossRef]
- Saison, C.; Perreault, F.; Daigle, J.-C.; Fortin, C.; Claverie, J.; Morin, M.; Popovic, R. Effect of core-shell copper oxide nanoparticles on cell culture morphology and photosynthesis (photosystem II energy distribution) in the green alga, Chlamydomonas reinhardtii. Aquat. Toxicol. 2010, 96, 109–114. [Google Scholar] [CrossRef]
- Sze, P.W.C.; Lee, S.Y. Effects of chronic copper exposure on the green mussel Perna viridis. Mar. Biol. 2000, 137, 379–392. [Google Scholar] [CrossRef]
- Wang, N.; Ingersoll, C.G.; Greer, I.E.; Hardesty, D.K.; Ivey, C.D.; Kunz, J.L.; Brumbaugh, W.G.; Dwyer, F.J.; Roberts, A.D.; Augspurger, T.; et al. Chronic toxicity of copper and ammonia to juvenile freshwater mussels (Unionidae). Environ. Toxicol. Chem. 2007, 26, 2048–2056. [Google Scholar] [CrossRef]
- Parry, H.E.; Pipe, R.K. Interactive effects of temperature and copper on immunocompetence and disease susceptibility in mussels (Mytilus edulis). Aquat. Toxicol. 2004, 69, 311–325. [Google Scholar] [CrossRef]
- Brown, B.E.; Newell, R.C. Effect of copper and zinc on metabolism of mussel Mytilus edulis. Mar. Biol. 1972, 16, 108–118. [Google Scholar]
- March, F.A.; Dwyer, F.J.; Augspurger, T.; Ingersoll, C.G.; Wang, N.; Mebane, C.A. An evaluation of freshwater mussel toxicity data in the derivation of water quality guidance and standards for copper. Environ. Toxicol. Chem. 2007, 26, 2066–2074. [Google Scholar]
- Moore, M.N.; Widdows, J.; Cleary, J.J.; Pipe, R.K.; Salkeld, P.N.; Donkin, P.; Farrar, S.V.; Evans, S.V.; Thomson, P.E. Responses of the mussel Mytilus edulis to copper and phenanthrene: Interactive effects. Mar. Environ. Res. 1984, 14, 167–183. [Google Scholar] [CrossRef]
- Krishnakumar, P.K.; Asokan, P.K.; Pillai, V.K. Physiological and cellular responses to copper and mercury in the green mussel Perna viridis (Linnaeus). Aquat. Toxicol. 1990, 18, 163–173. [Google Scholar] [CrossRef]
- Amiard, J.C.; Amiard-Triquet, C.; Berthet, B.; Métayer, C. Contribution to the ecotoxicological study of cadmium, lead, copper and zinc in the mussel Mytilus edulis. Mar. Biol. 1986, 90, 425–431. [Google Scholar] [CrossRef]
- Larsen, B.K.; Pörtner, H.O.; Jensen, F.B. Extra- and intracellular acid-base balance and ionic regulation in cod (Gadus morhua) during combined and isolated exposures to hypercapnia and copper. Mar. Biol. 1997, 128, 337–346. [Google Scholar] [CrossRef]
- Cardeilhac, P.T.; Simpson, C.F.; Lovelock, R.L.; Yosha, S.F.; Calderwood, H.W.; Gudat, J.C. Failure of osmoregulation with apparent potassium intoxication in marine teleosts: A primary toxic effect of copper. Aquaculture 1979, 17, 231–239. [Google Scholar] [CrossRef]
- Stagg, R.M.; Shuttleworth, T.J. The accumulation of copper in Platichthys flesus L. and its effects on plasma electrolyte concentrations. J. Fish Biol. 1982, 20, 491–500. [Google Scholar] [CrossRef]
- Ahsanullah, M.; Williams, A.R. Sublethal effects and bioaccumulation of cadmium, chromium, copper and zinc in the marine amphipod Allorchestes compressa. Mar. Biol. 1991, 108, 59–65. [Google Scholar] [CrossRef]
- Conradi, M.; Depledge, M.H. Population responses of the marine amphipod Corophium volutator (Pallas, 1766) to copper. Aquat. Toxicol. 1998, 44, 31–45. [Google Scholar] [CrossRef]
- Viarengo, A.; Pertica, M.; Mancinelli, G.; Burlando, B.; Canesi, L.; Orunesu, M. In vivo effects of copper on the calcium homeostasis mechanisms of mussel gill cell plasma membranes. Comp. Biochem. Physt. C 1996, 113, 421–425. [Google Scholar] [CrossRef]
- McCullough, F.S.; Gayral, P.; Duncan, J.; Christie, J.D. Molluscicides in schistosomiasis control. Bull. World Health Organ. 1980, 58, 681–689. [Google Scholar]
- Rao, D.G.V.P.; Khan, M.A.Q. Zebra mussels: Enhancement of copper toxicity by high temperature and its relationship with respiration and metabolism. Water Environ. Res. 2000, 72, 175–178. [Google Scholar] [CrossRef]
- Baek, Y.-W.; An, Y.-J. Microbial toxicity of metal oxide nanoparticles (CuO, NiO, ZnO, and Sb2O3) to Escherichia coli, Bacillus subtilis, and Streptococcus aureus. Sci. Total Environ. 2011, 409, 1603–1608. [Google Scholar] [CrossRef]
- Mortimer, M.; Kasemets, K.; Kahru, A. Toxicity of ZnO and CuO nanoparticles to ciliated protozoa Tetrahymena thermophila. Toxicology 2010, 269, 182–189. [Google Scholar] [CrossRef]
- Aruoja, V.; Dubourguier, H.C.; Kasemets, K.; Kahru, A. Toxicity of nanoparticles of CuO, ZnO and TiO2 to microalgae Pseudokirchneriella subcapitata. Sci. Total Environ. 2009, 407, 1461–1468. [Google Scholar] [CrossRef]
- Kasemets, K.; Ivask, A.; Dubourguier, H.-C.; Kahru, A. Toxicity of nanoparticles of ZnO, CuO and TiO2 to yeast Saccharomyces cerevisiae. Toxicol. In Vitro 2009, 23, 1116–1122. [Google Scholar] [CrossRef]
- Midander, K.; Cronholm, P.; Karlsson, H.L.; Elihn, K.; Möller, L.; Leygraf, C.; Wallinder, I.O. Surface characteristics, copper release, and toxicity of nano- and micrometer-sized copper and copper(ii) oxide particles: A cross-disciplinary study. Small 2009, 5, 389–399. [Google Scholar] [CrossRef]
- Hanna, S.K.; Miller, R.J.; Zhou, D.; Keller, A.A.; Lenihan, H.S. Accumulation and toxicity of metal oxide nanoparticles in a soft-sediment estuarine amphipod. Aquat. Toxicol. 2013, 142–143, 441–446. [Google Scholar] [CrossRef]
- Canesi, L.; Ciacci, C.; Fabbri, R.; Marcomini, A.; Pojana, G.; Gallo, G. Bivalve molluscs as a unique target group for nanoparticle toxicity. Mar. Environ. Res. 2012, 76, 16–21. [Google Scholar] [CrossRef]
- Foster-Smith, R.L. The effect of concentration of suspension of the filtration rates and pseudofaecal production for Mytilus edulis L., Cerastoderma edule (L.) and Venerupis pullastra (Montagu). J. Exp. Mar. Biol. Ecol. 1975, 17, 1–22. [Google Scholar] [CrossRef]
- Dayton, P.G. Toward and understanding of community resilience and the potential effects of enrichments to the benthos at Mcmurdo Sound, Antarctica. In Proceedings of the Colloquium on Conservation Problems in Antarctica; Parker, B., Ed.; Allen Press: Lawrence, KS, USA, 1972. [Google Scholar]
- Haven, D.S.; Morales-Alamo, R. Aspects of biodeposition by oysters and other invertebrate filter feeders. Limnol. Oceanogr. 1966, 11, 487–498. [Google Scholar] [CrossRef]
- Suchanek, T.H. Mussels and their role in structuring rocky shore communities. In The Ecology of Rocky Coasts; Moore, P.G., Seed, R., Eds.; Columbia University Press: New York, NY, USA, 1986. [Google Scholar]
- D’Silva, C.; Kureishy, T.W. Experimental studies on the accumulation of copper and zinc in the green mussel. Mar. Pollut. Bull. 1978, 9, 187–190. [Google Scholar] [CrossRef]
- Viarengo, A.; Zanicchi, G.; Moore, M.N.; Orunesu, M. Accumulation and detoxication of copper by the mussel Mytilus galloprovincialis Lam: A study of the subcellular distribution in the digestive gland cells. Aquat. Toxicol. 1981, 1, 147–157. [Google Scholar] [CrossRef]
- Griffitt, R.J.; Weil, R.; Hyndman, K.A.; Denslow, N.D.; Powers, K.; Taylor, D.; Barber, D.S. Exposure to copper nanoparticles causes gill injury and acute lethality in zebrafish (Danio rerio). Environ. Sci. Technol. 2007, 41, 8178–8186. [Google Scholar]
- Montes, M.O.; Hanna, S.K.; Lenihan, H.S.; Keller, A.A. Uptake, accumulation, and biotransformation of metal oxide nanoparticles by a marine suspension-feeder. J. Hazard. Mater. 2012, 225–226, 139–145. [Google Scholar] [CrossRef]
- Conway, J.R.; Hanna, S.K.; Lenihan, H.S.; Keller, A.A. Effects and implications of trophic transfer and accumulation of CeO2 nanoparticles in a marine mussel. Environ. Sci. Technol. 2014, 48, 1517–1524. [Google Scholar] [CrossRef]
- Hanna, S.K.; Miller, R.J.; Muller, E.B.; Nisbet, R.M.; Lenihan, H.S. Impact of engineered zinc oxide nanoparticles on the individual performance of Mytilus galloprovincialis. PLoS One 2013, 8, e61800. [Google Scholar]
- Scott, D.M.; Major, C.W. The effect of copper (ii) on survival, respiration, and heart rate in the common blue mussel, Mytilus edulis. Biol. Bull. 1972, 143, 679–688. [Google Scholar] [CrossRef]
- Mudunkotuwa, I.A.; Pettibone, J.M.; Grassian, V.H. Environmental implications of nanoparticle aging in the processing and fate of copper-based nanomaterials. Environ. Sci. Technol. 2012, 46, 7001–7010. [Google Scholar] [CrossRef]
- Anandraj, A.; Marshall, D.J.; Gregory, M.A.; McClurg, T.P. Metal accumulation, filtration and O2 uptake rates in the mussel Perna perna (mollusca: Bivalvia) exposed to Hg2+, Cu2+ and Zn2+. Comp. Biochem. Phys. C 2002, 132, 355–363. [Google Scholar]
- Keller, A.A.; Lazareva, A. Predicted releases of engineered nanomaterials: From global to regional to local. Environ. Sci. Technol. Lett. 2013, 1, 65–70. [Google Scholar]
- Ward, J.E.; Kach, D.J. Marine aggregates facilitate ingestion of nanoparticles by suspension-feeding bivalves. Mar. Environ. Res. 2009, 68, 137–142. [Google Scholar] [CrossRef]
- Hull, M.S.; Chaurand, P.; Rose, J.; Auffan, M.; Bottero, J.-Y.; Jones, J.C.; Schultz, I.R.; Vikesland, P.J. Filter-feeding bivalves store and biodeposit colloidally stable gold nanoparticles. Environ. Sci. Technol. 2011, 45, 6592–6599. [Google Scholar] [CrossRef]
- Ferry, J.L.; Craig, P.; Hexel, C.; Sisco, P.; Frey, R.; Pennington, P.L.; Fulton, M.H.; Scott, I.G.; Decho, A.W.; Kashiwada, S.; et al. Transfer of gold nanoparticles from the water column to the estuarine food web. Nat. Nanotechnol. 2009, 4, 441–444. [Google Scholar] [CrossRef]
- Canesi, L.; Ciacci, C.; Betti, M.; Fabbri, R.; Canonico, B.; Fantinati, A.; Marcomini, A.; Pojana, G. Immunotoxicity of carbon black nanoparticles to blue mussel hemocytes. Environ. Int. 2008, 34, 1114–1119. [Google Scholar] [CrossRef]
- Koehler, A.; Marx, U.; Broeg, K.; Bahns, S.; Bressling, J. Effects of nanoparticles in Mytilus edulis gills and hepatopancreas—A new threat to marine life? Mar. Environ. Res. 2008, 66, 12–14. [Google Scholar] [CrossRef]
- Calabrese, A.; MacInnes, J.R.; Nelson, D.A.; Greig, R.A.; Yevich, P.P. Effects of long-term exposure to silver or copper on growth, bioaccumulation and histopathology in the blue mussel Mytilus edulis. Mar. Environ. Res. 1984, 11, 253–274. [Google Scholar]
- Lores, E.M.; Pennock, J.R. Bioavailability and trophic transfer of humic-bound copper from bacteria to zooplankton. Mar. Ecol. Prog. Ser. 1999, 187, 67–75. [Google Scholar] [CrossRef]
- Jara-Marini, M.E.; Soto-Jiménez, M.F.; Páez-Osuna, F. Trophic relationships and transference of cadmium, copper, lead and zinc in a subtropical coastal lagoon food web from SE Gulf of California. Chemosphere 2009, 77, 1366–1373. [Google Scholar] [CrossRef]
- Chang, S.I.; Reinfelder, J.R. Bioaccumulation, subcellular distribution, and trophic transfer of copper in a coastal marine diatom. Environ. Sci. Technol. 2000, 34, 4931–4935. [Google Scholar] [CrossRef]
- Holbrook, R.D.; Murphy, K.E.; Morrow, J.B.; Cole, K.D. Trophic transfer of nanoparticles in a simplified invertebrate food web. Nat. Nanotechnol. 2008, 3, 352–355. [Google Scholar] [CrossRef]
- Ricciardi, A.; Whoriskey, F.G.; Rasmussen, J.B. The role of zebra mussel (Dreissena polymorpha) in structuring macroinvertebrate communities on hard substrata. Can. J. Fish. Aquat. Sci. 1997, 54, 2596–2608. [Google Scholar] [CrossRef]
- Dittmann, S. Mussel beds—Amensalism or amelioration for intertidal fauna? Helgol. Mar. Res. 1990, 44, 335–352. [Google Scholar]
- Commito, J.A.; Boncavage, E.M. Suspension-feeders and coexisting infauna: An enhancement counterexample. J. Exp. Mar. Biol. Ecol. 1989, 125, 33–42. [Google Scholar] [CrossRef]
- Galloway, T.; Lewis, C.; Dolciotti, I.; Johnston, B.D.; Moger, J.; Regoli, F. Sublethal toxicity of nano-titanium dioxide and carbon nanotubes in a sediment dwelling marine polychaete. Environ. Pollut. 2010, 158, 1748–1755. [Google Scholar] [CrossRef]
- Blaise, C.; Gagné, F.; Férard, J.F.; Eullaffroy, P. Ecotoxicity of selected nano-materials to aquatic organisms. Environ. Toxicol. 2008, 23, 591–598. [Google Scholar]
© 2014 by the authors; licensee MDPI, Basel, Switzerland. This article is an open access article distributed under the terms and conditions of the Creative Commons Attribution license (http://creativecommons.org/licenses/by/3.0/).
Share and Cite
Hanna, S.K.; Miller, R.J.; Lenihan, H.S. Accumulation and Toxicity of Copper Oxide Engineered Nanoparticles in a Marine Mussel. Nanomaterials 2014, 4, 535-547. https://doi.org/10.3390/nano4030535
Hanna SK, Miller RJ, Lenihan HS. Accumulation and Toxicity of Copper Oxide Engineered Nanoparticles in a Marine Mussel. Nanomaterials. 2014; 4(3):535-547. https://doi.org/10.3390/nano4030535
Chicago/Turabian StyleHanna, Shannon K., Robert J. Miller, and Hunter S. Lenihan. 2014. "Accumulation and Toxicity of Copper Oxide Engineered Nanoparticles in a Marine Mussel" Nanomaterials 4, no. 3: 535-547. https://doi.org/10.3390/nano4030535
APA StyleHanna, S. K., Miller, R. J., & Lenihan, H. S. (2014). Accumulation and Toxicity of Copper Oxide Engineered Nanoparticles in a Marine Mussel. Nanomaterials, 4(3), 535-547. https://doi.org/10.3390/nano4030535


