
Synthesis and Characterization of Polyaniline/Carbon Nanodots: Electrochemical Sensing of Alcohols for Freshness Monitoring for Application as Packaging Materials


 , ,
, , 
Abstract
1. Introduction
2. Materials and Methods
2.1. Synthesis of CNDs
2.2. Synthesis of PANI
2.3. Synthesis of CND/PANI Nanocomposites
2.4. Characterization
2.4.1. Spectral Studies
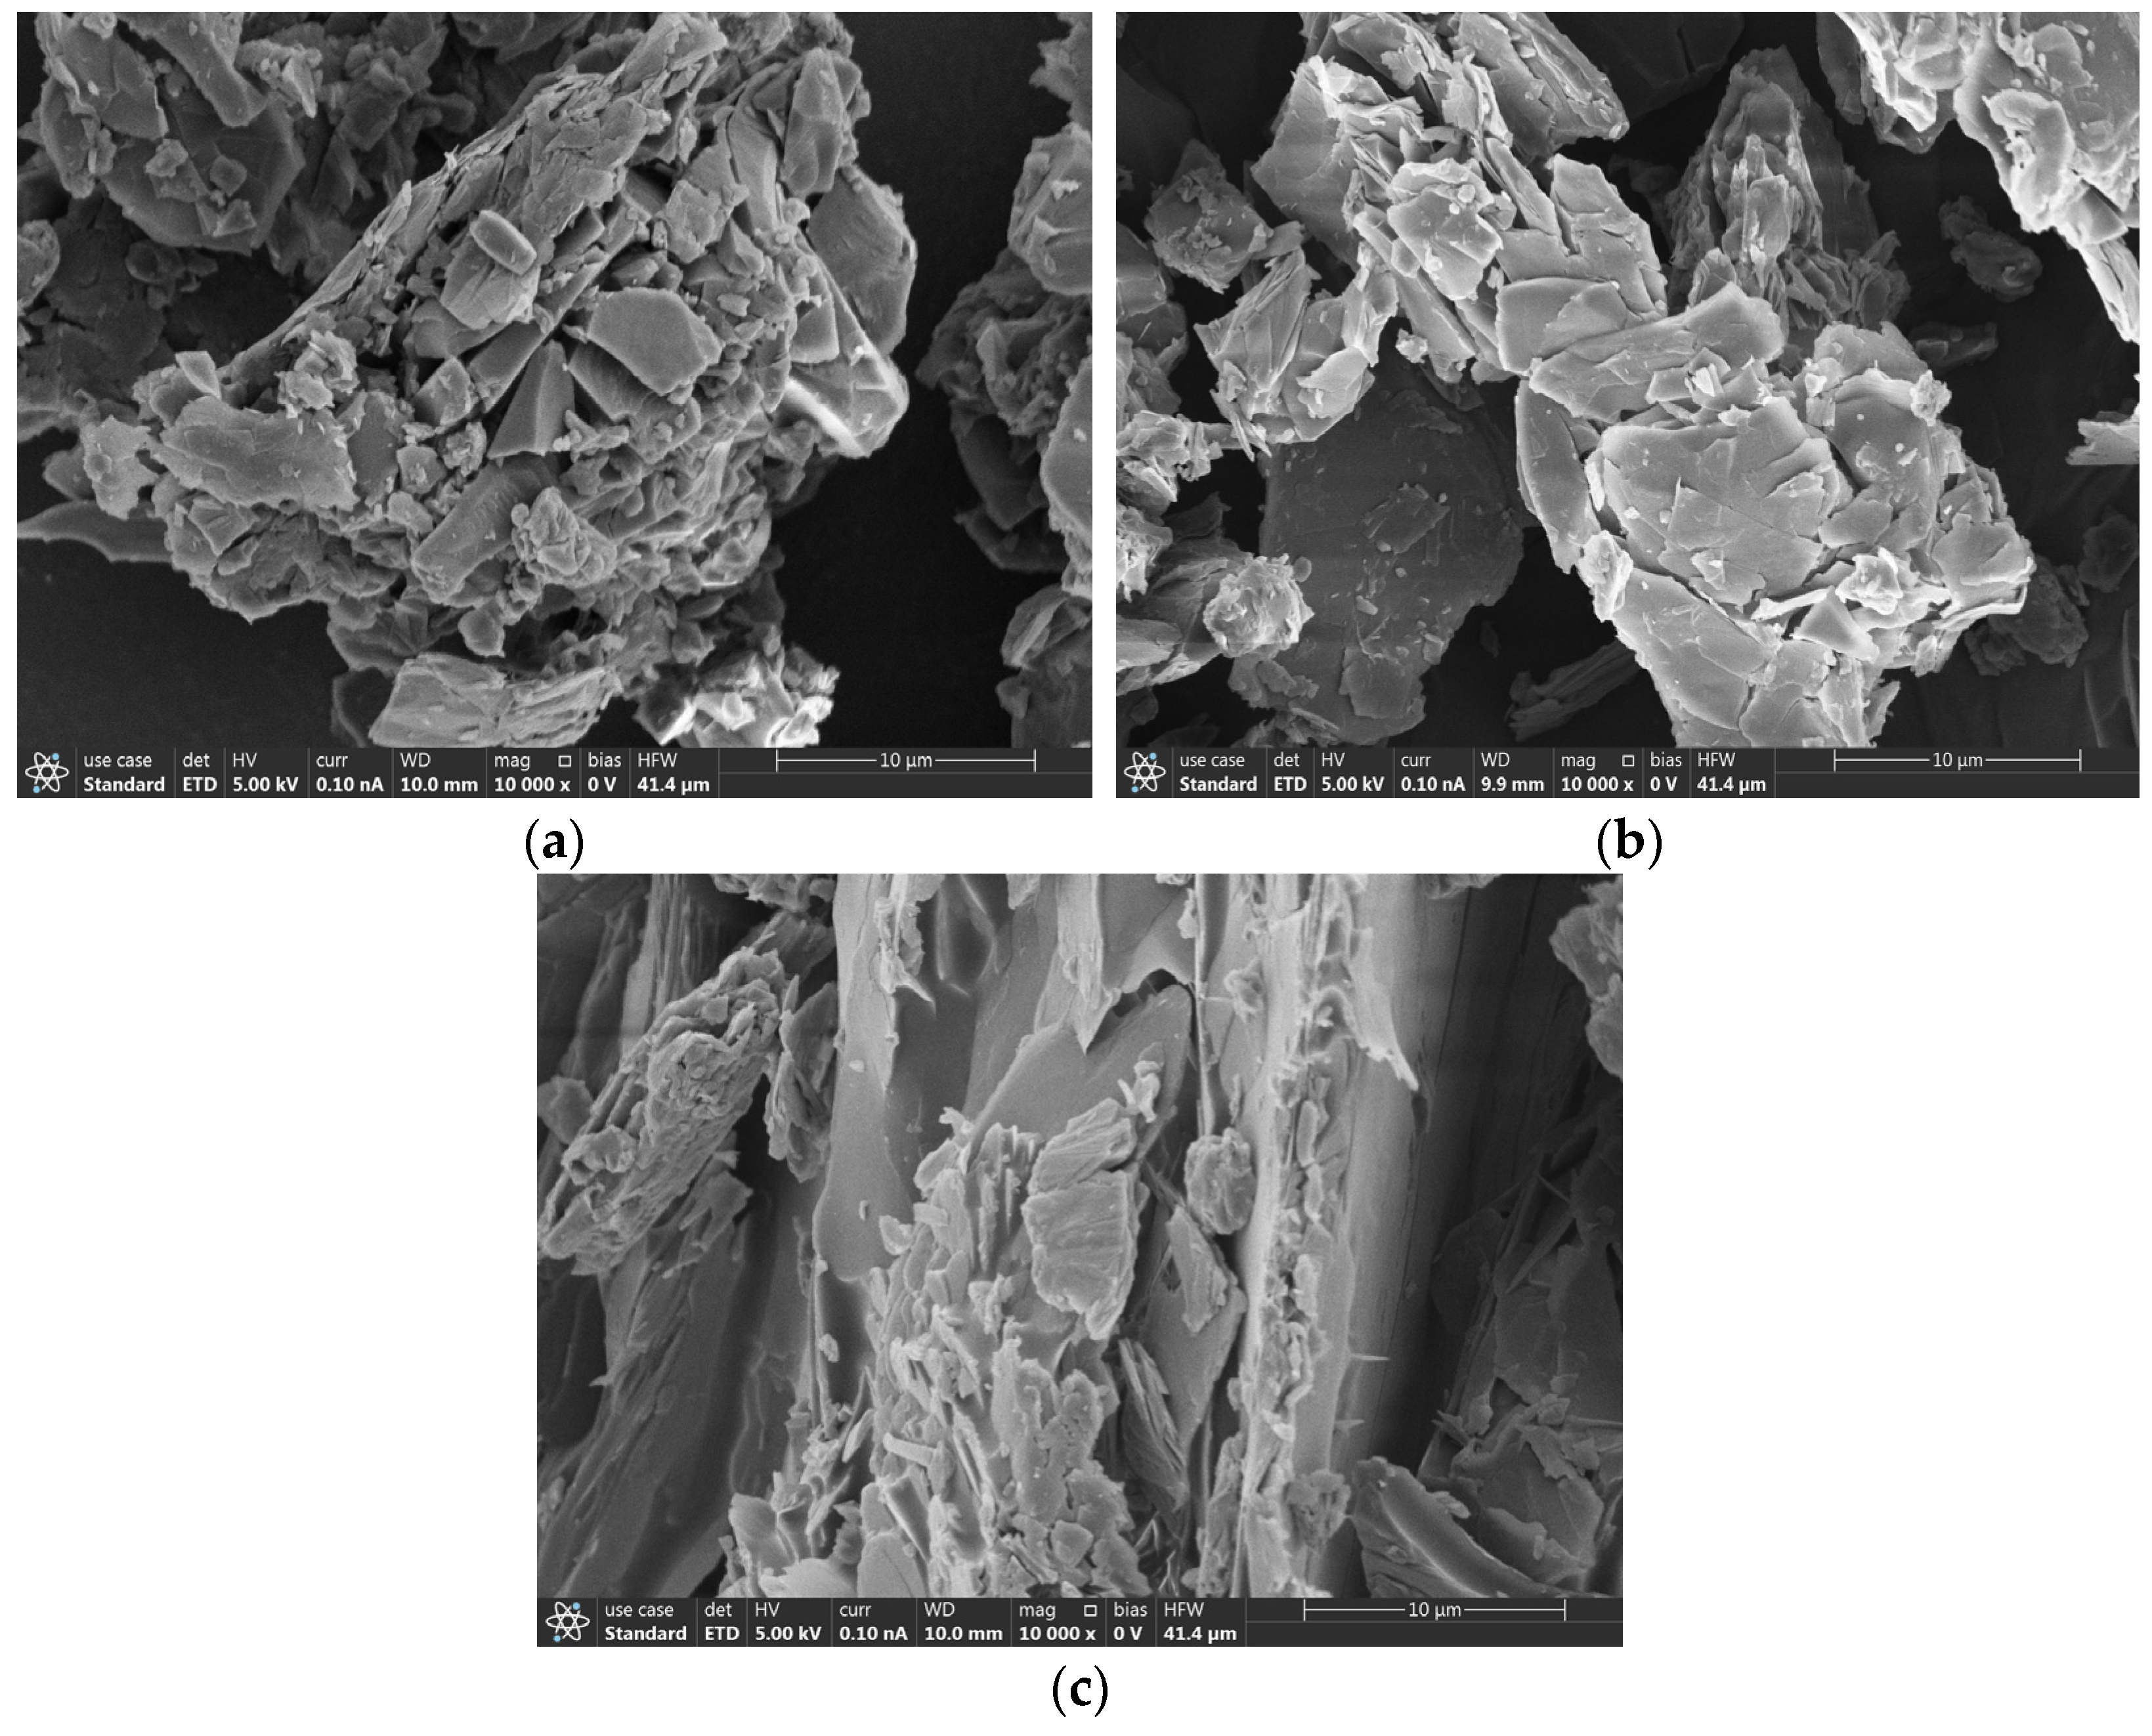
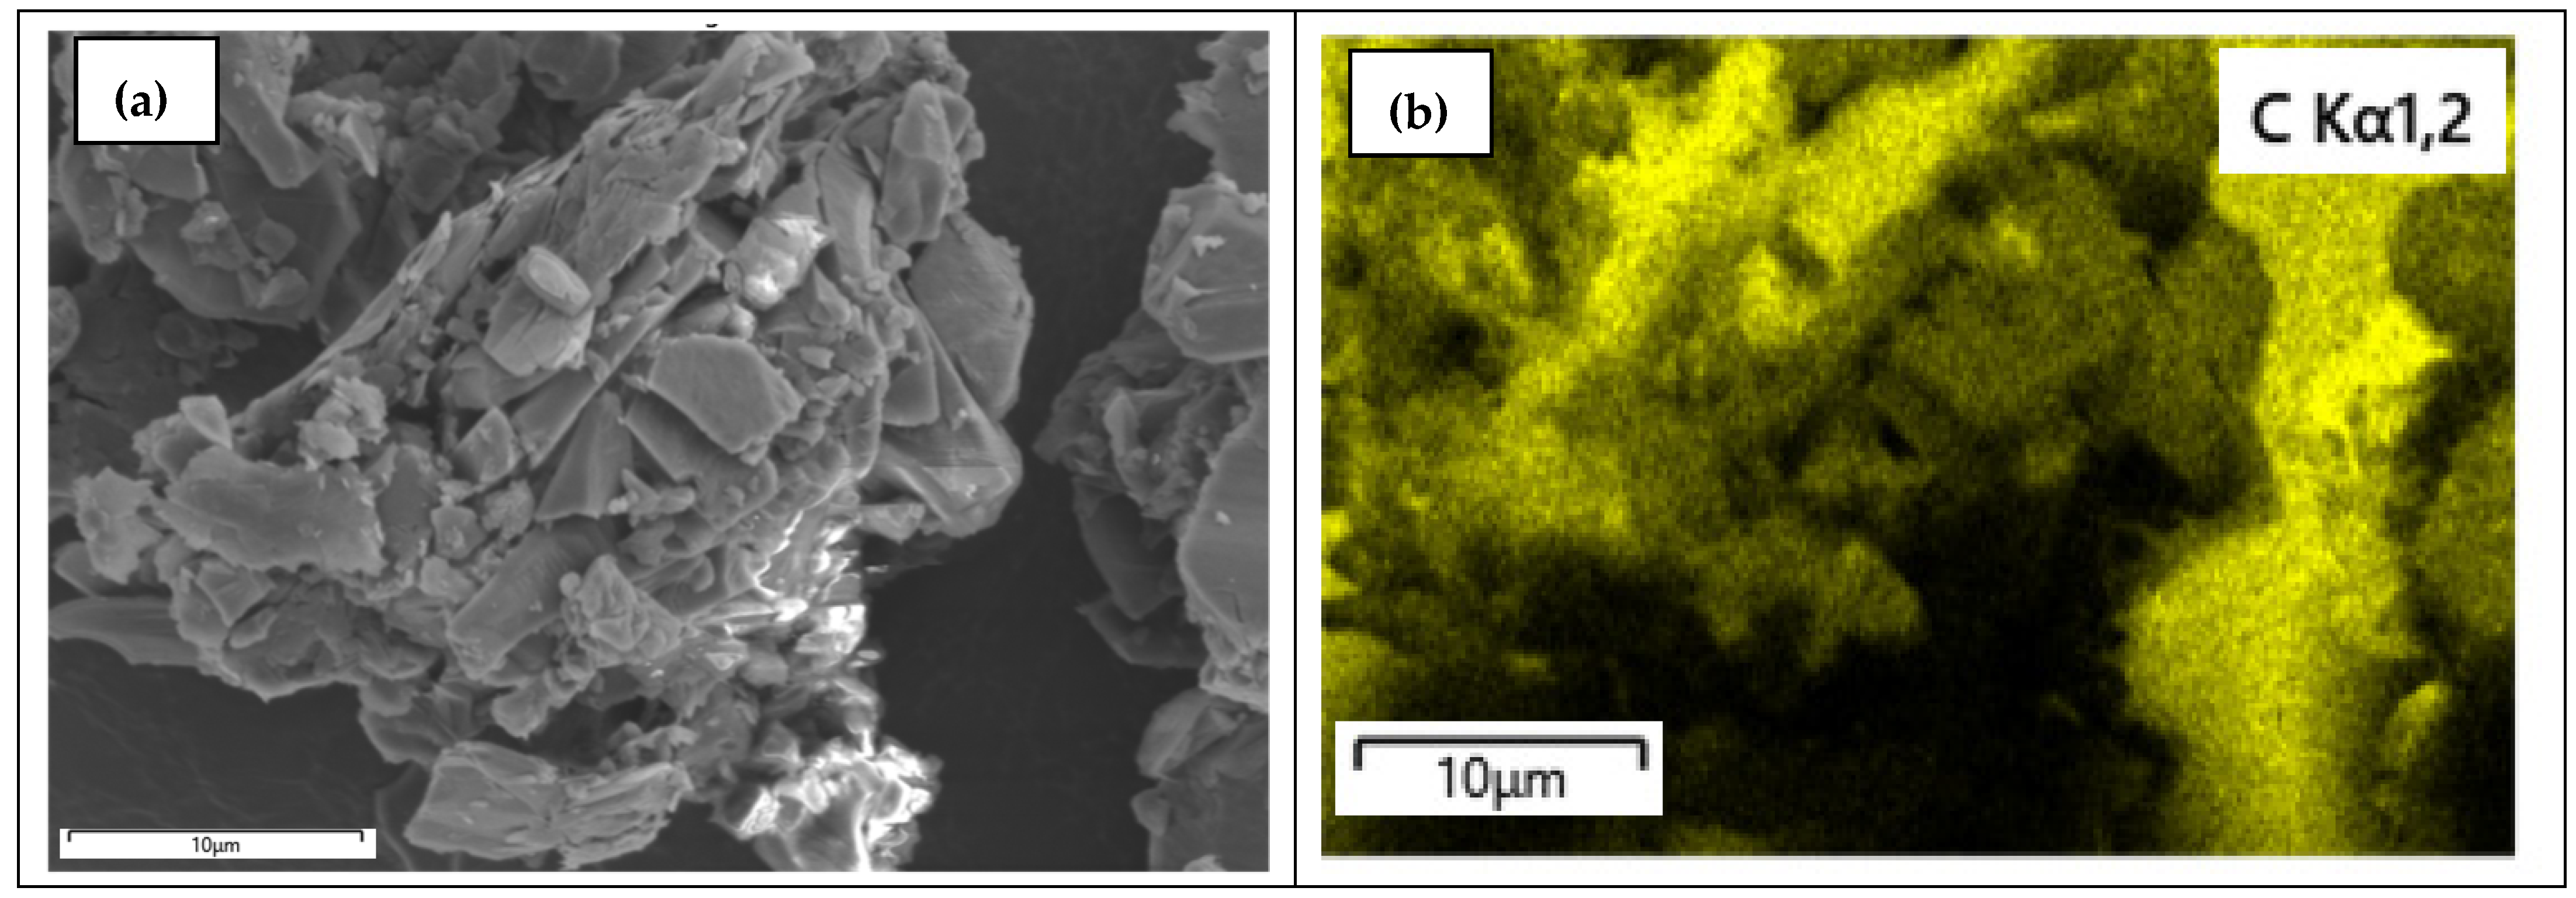
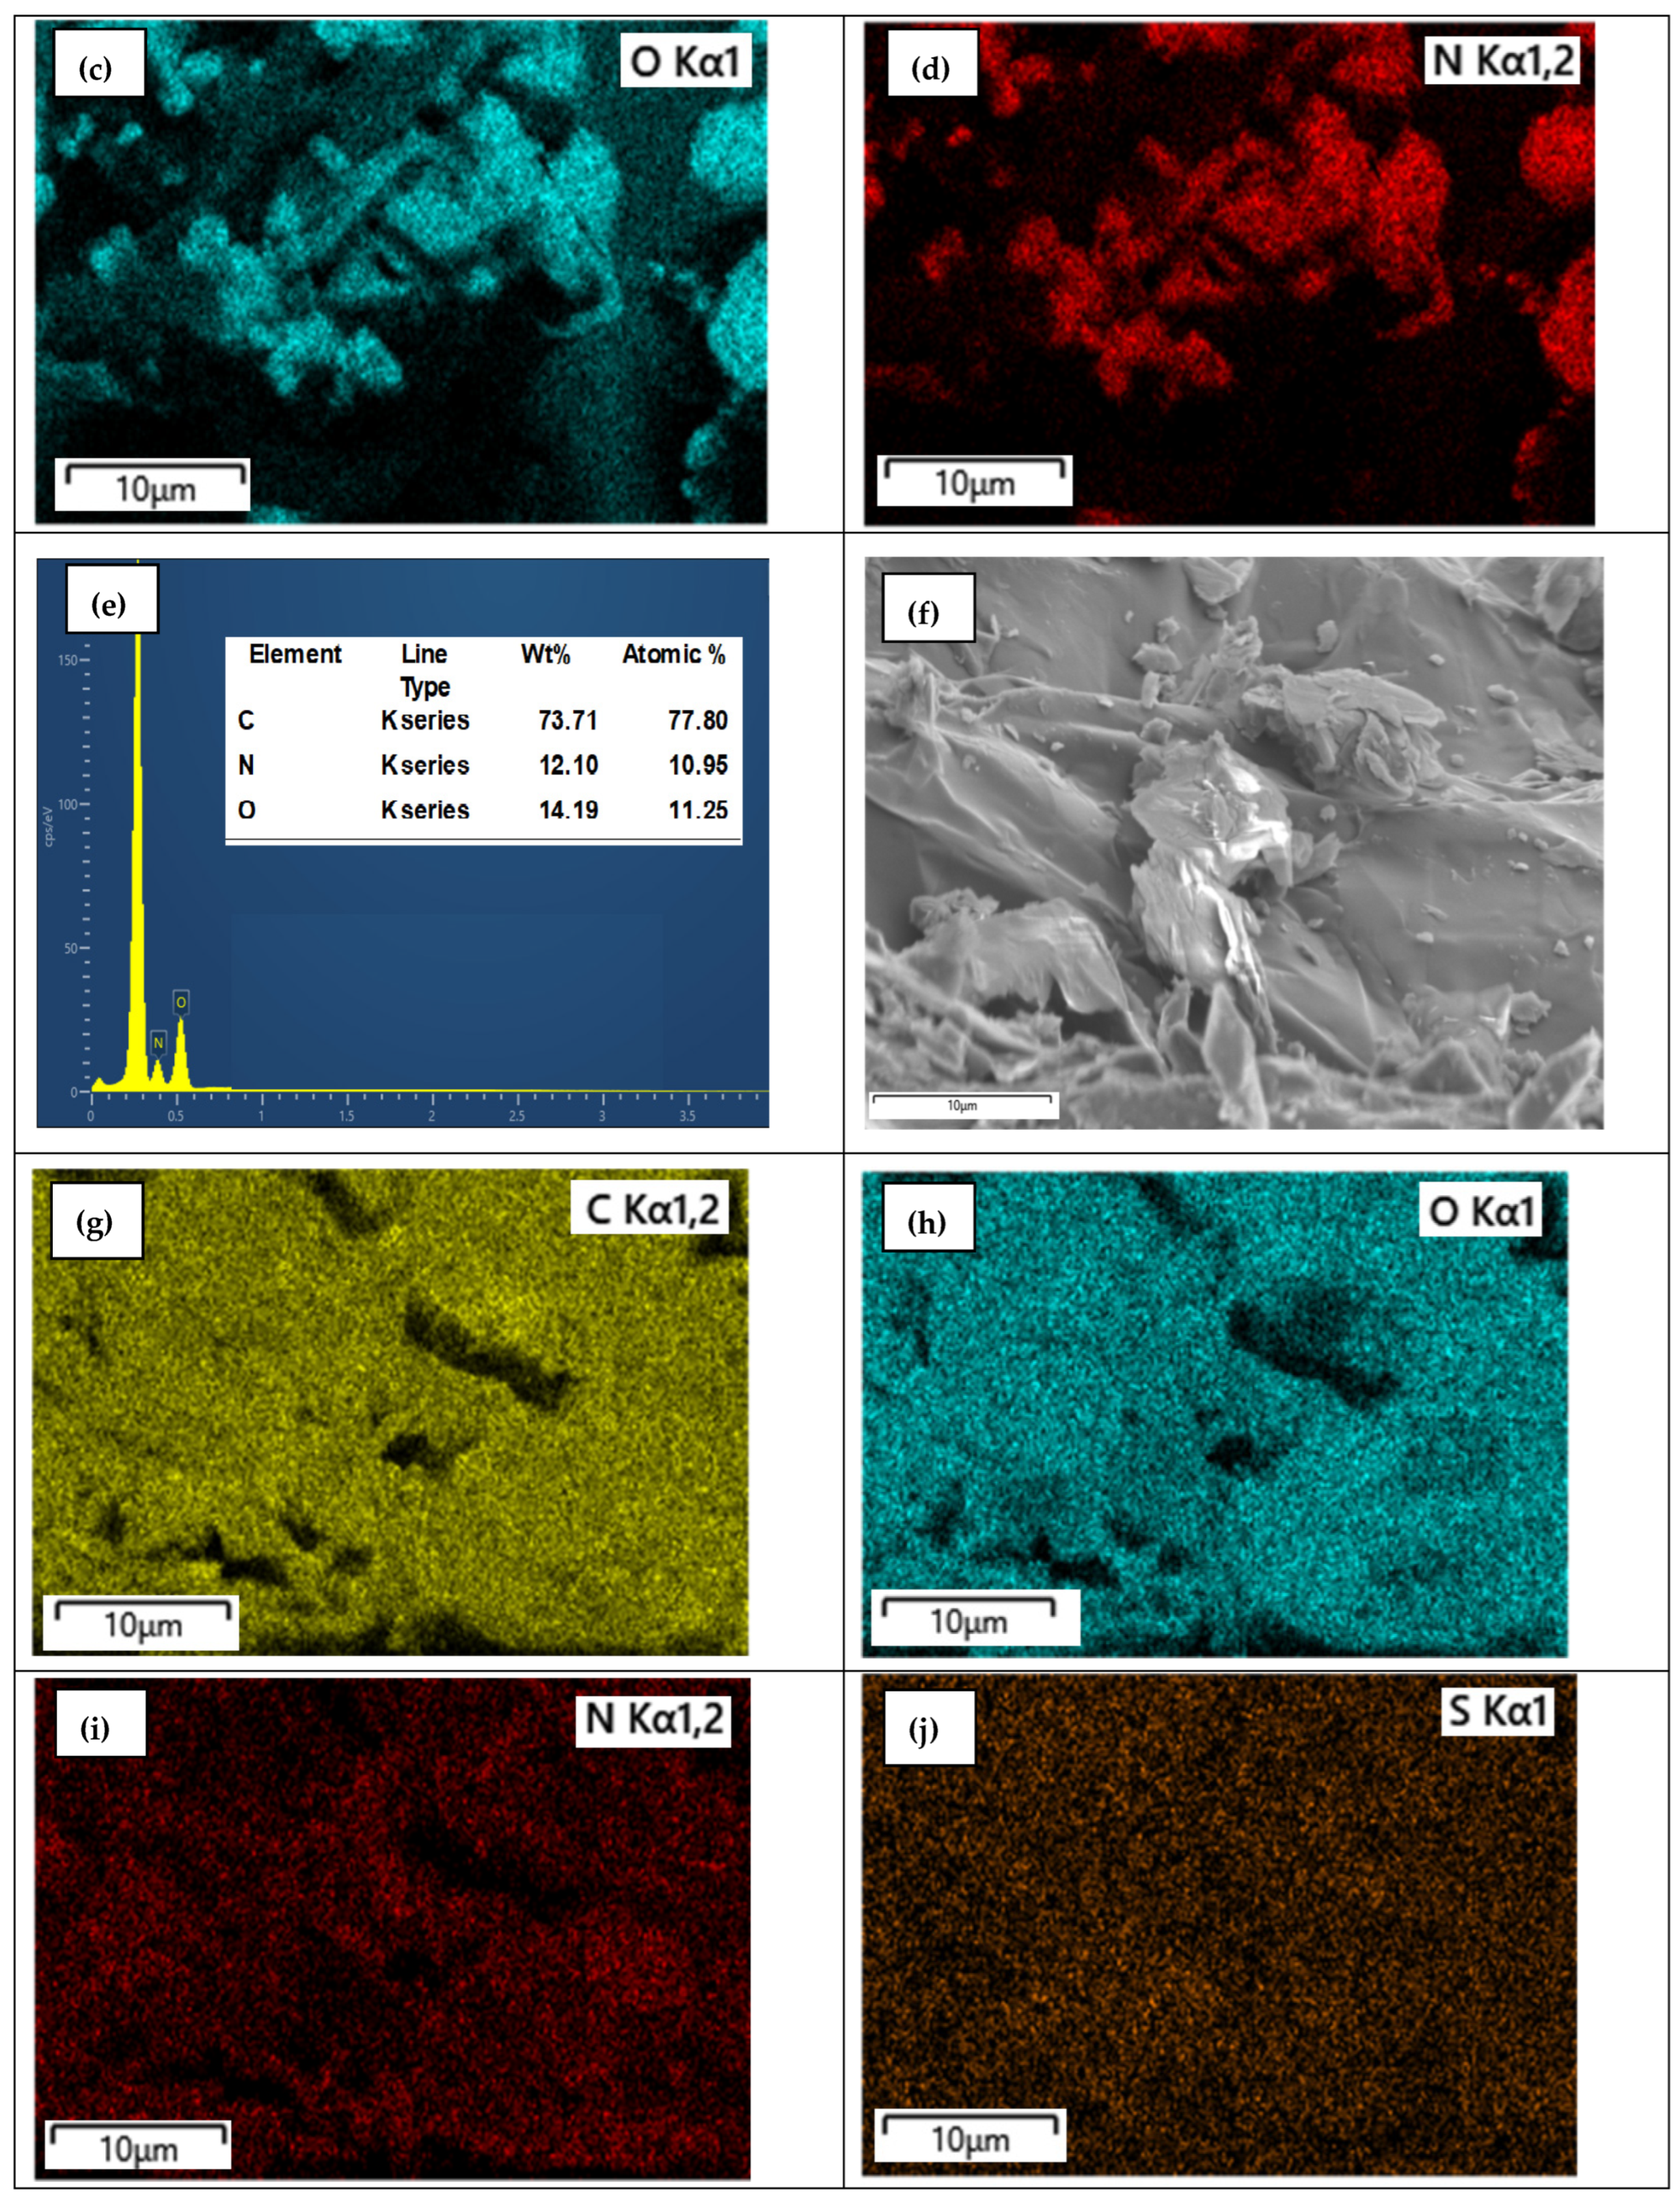
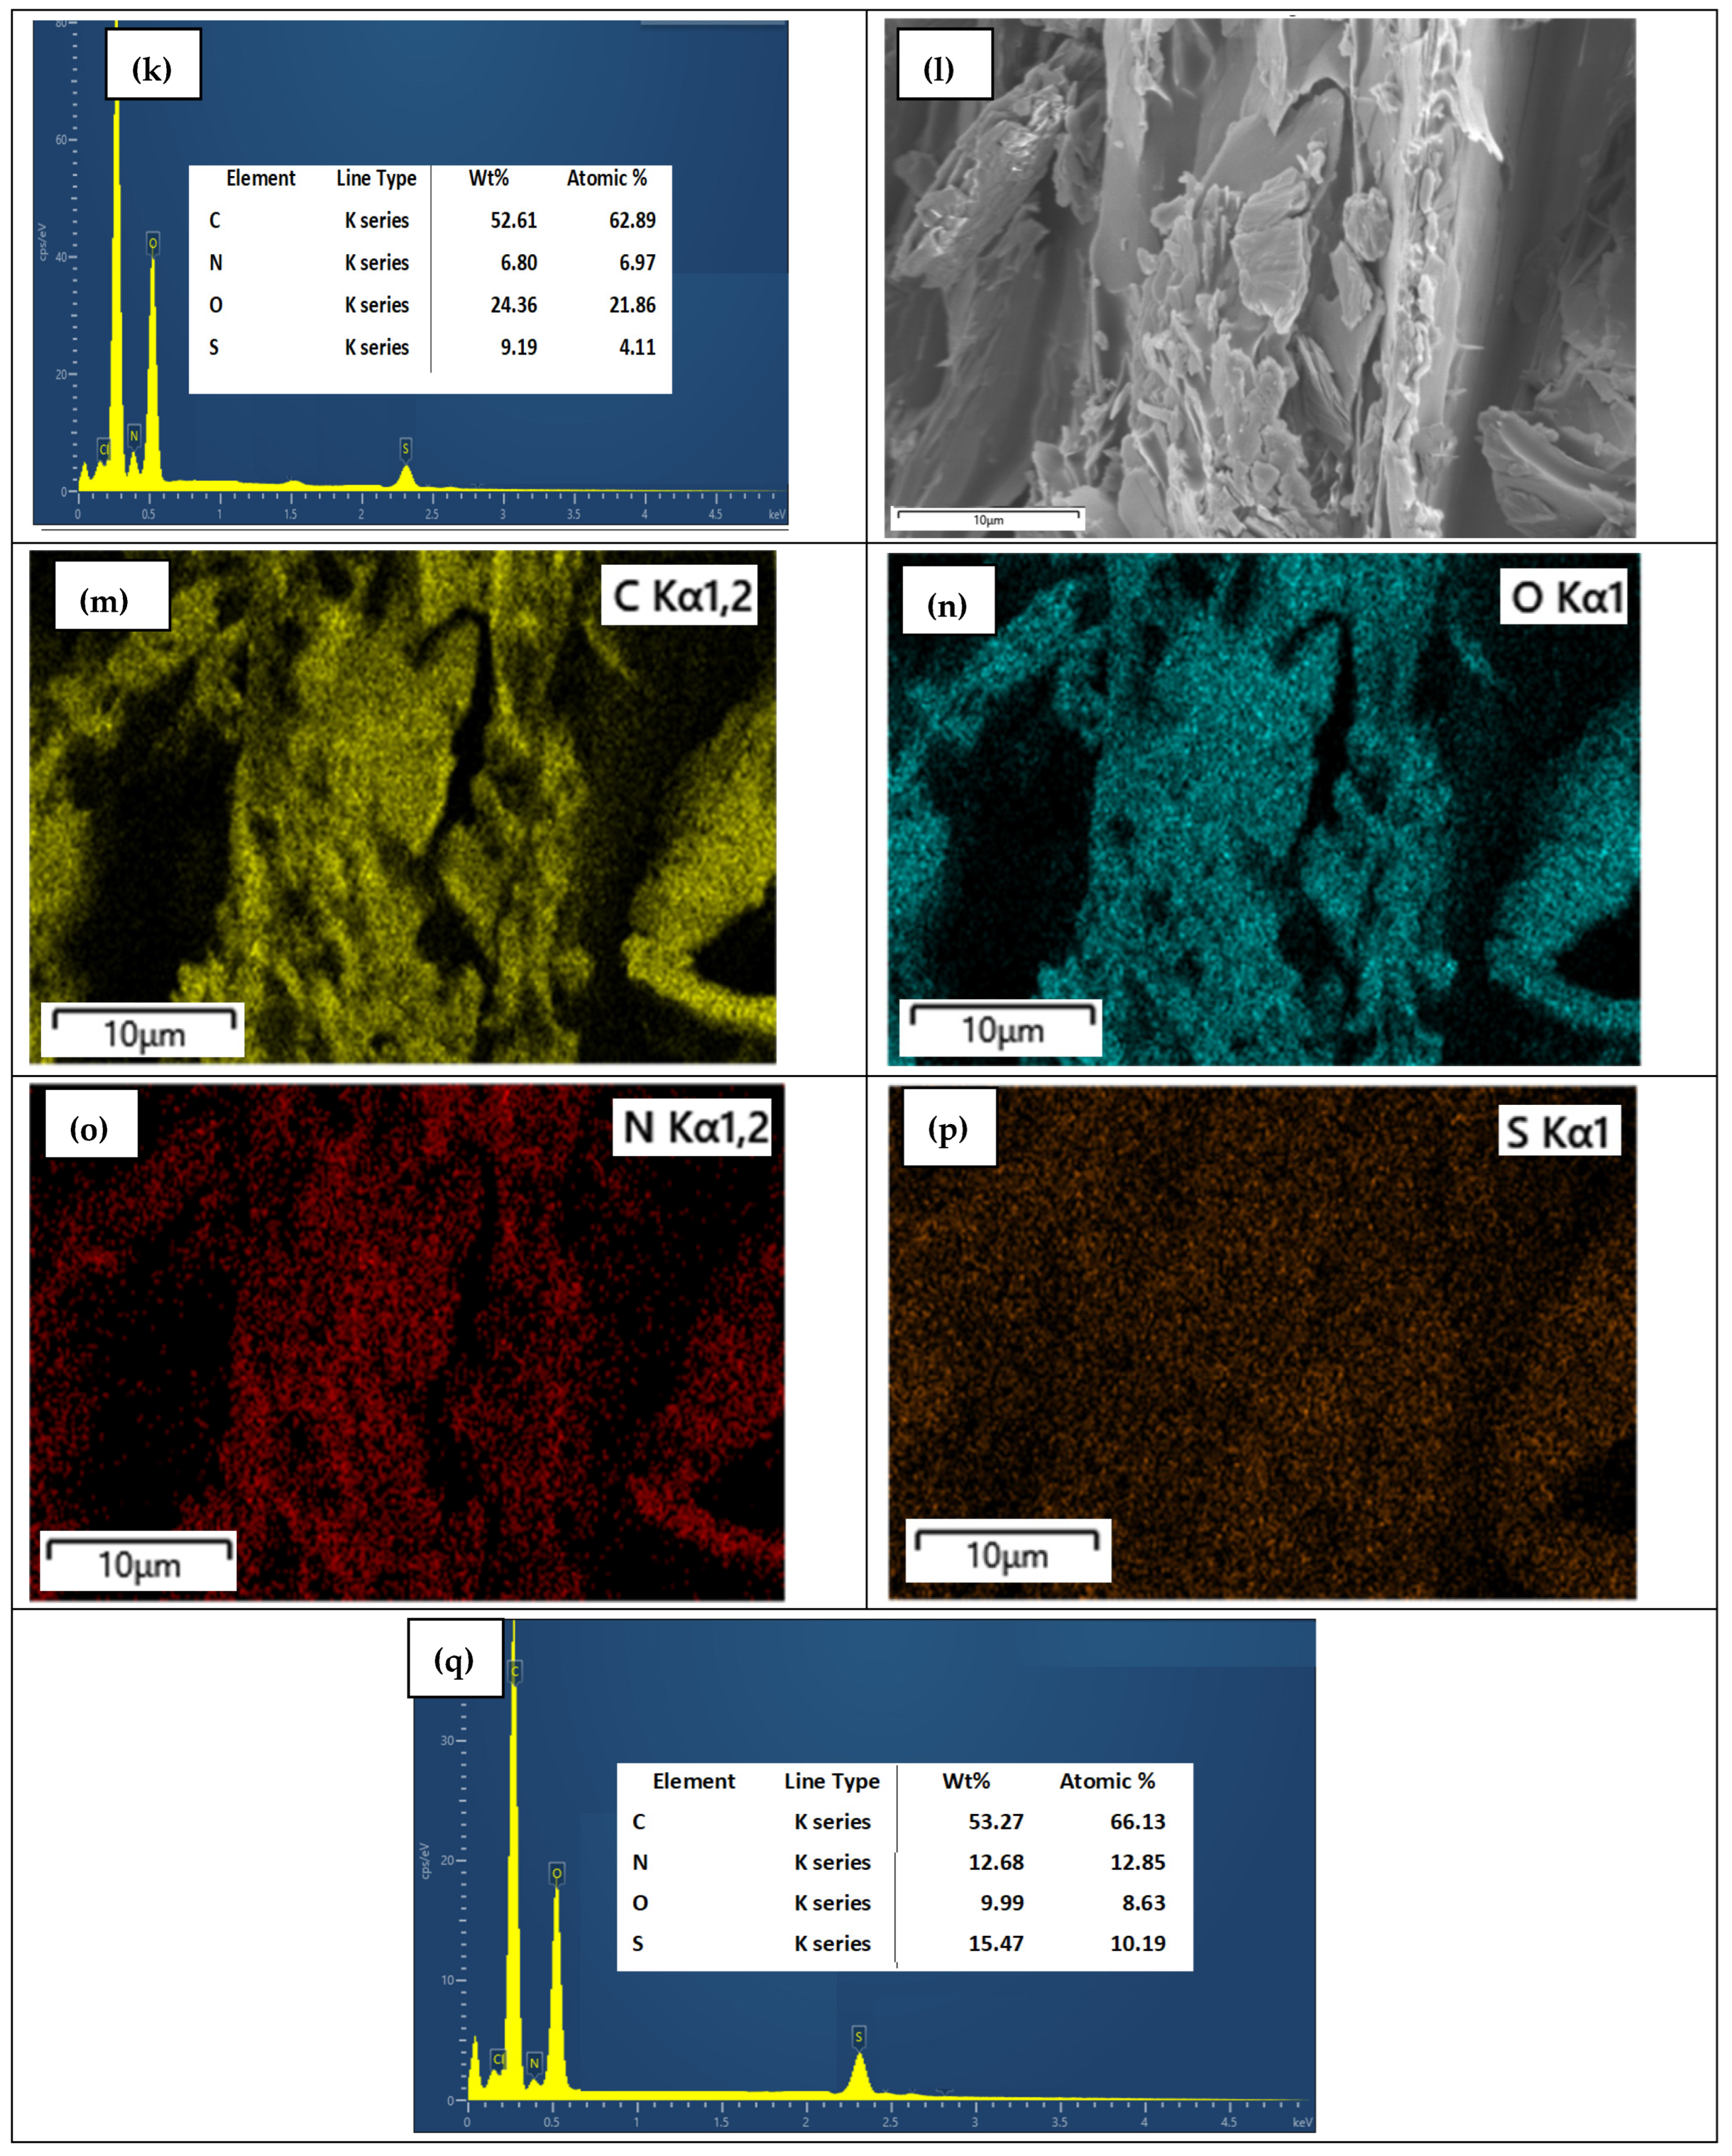
2.4.2. Morphological Analysis
2.4.3. Electrochemical Measurements
3. Results
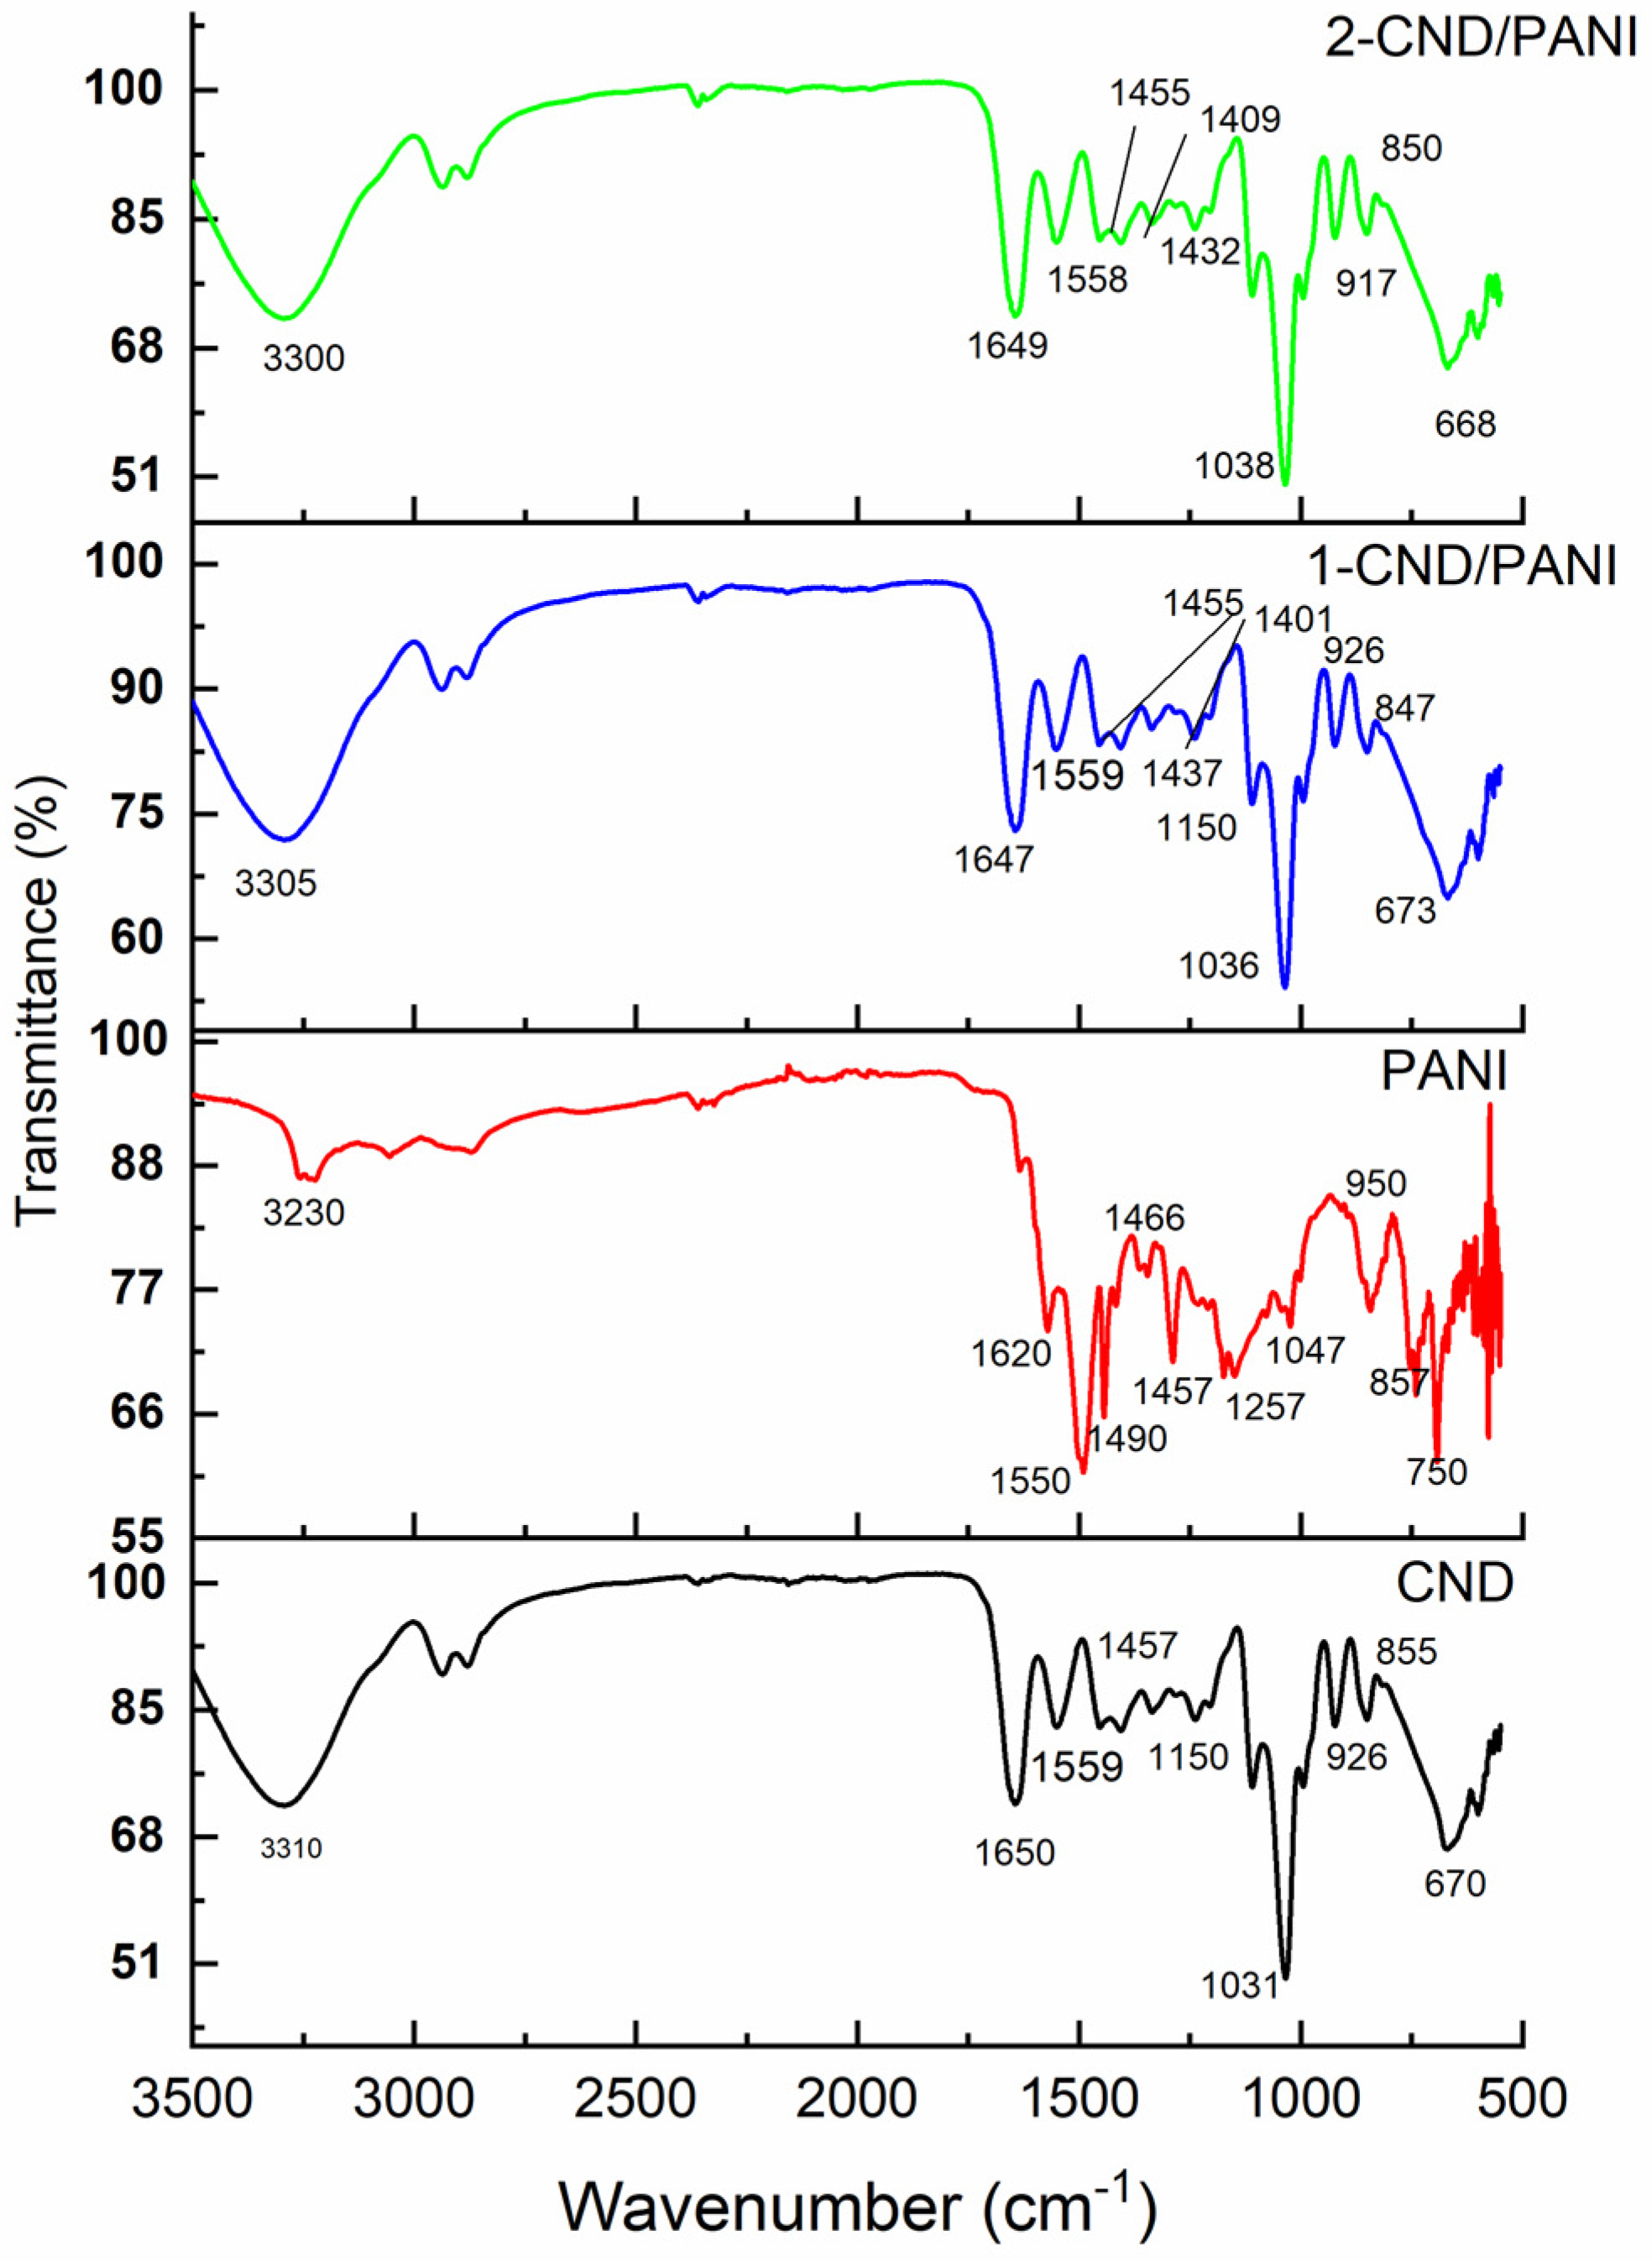
3.1. FTIR Analysis
3.2. UV-Visible Analysis
3.3. XRD Analysis
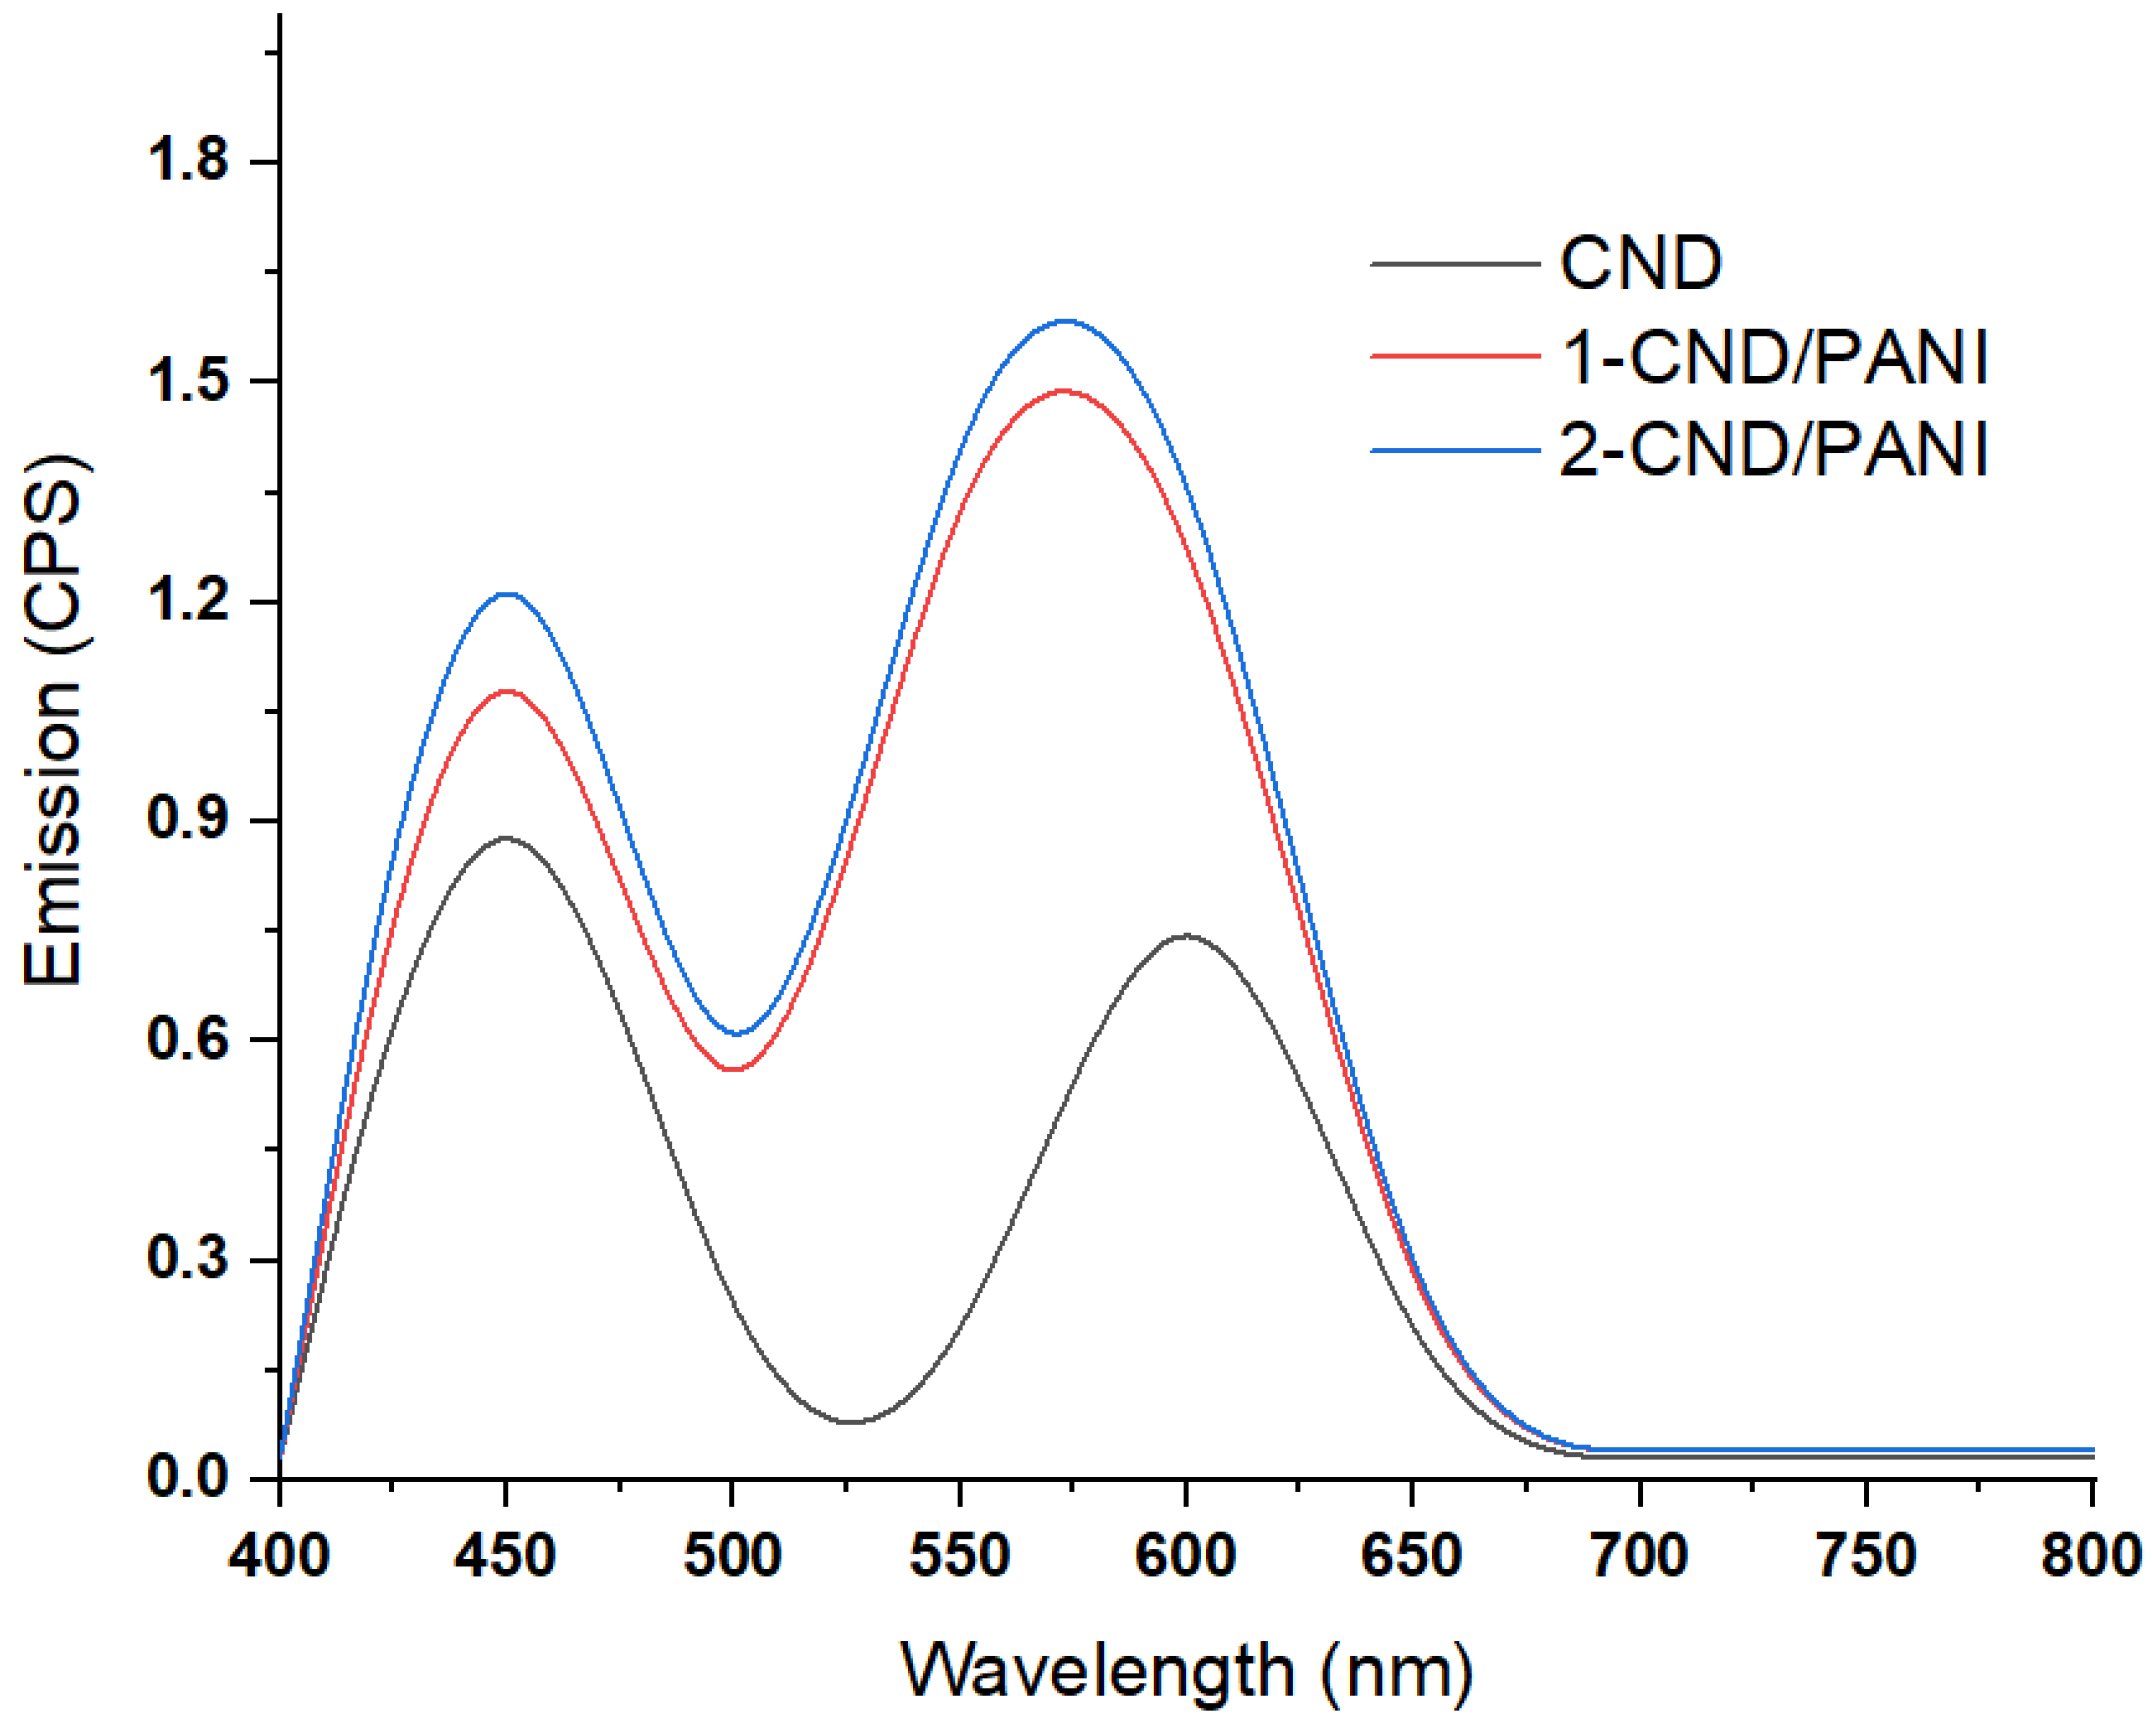
3.4. Fluorescence Studies
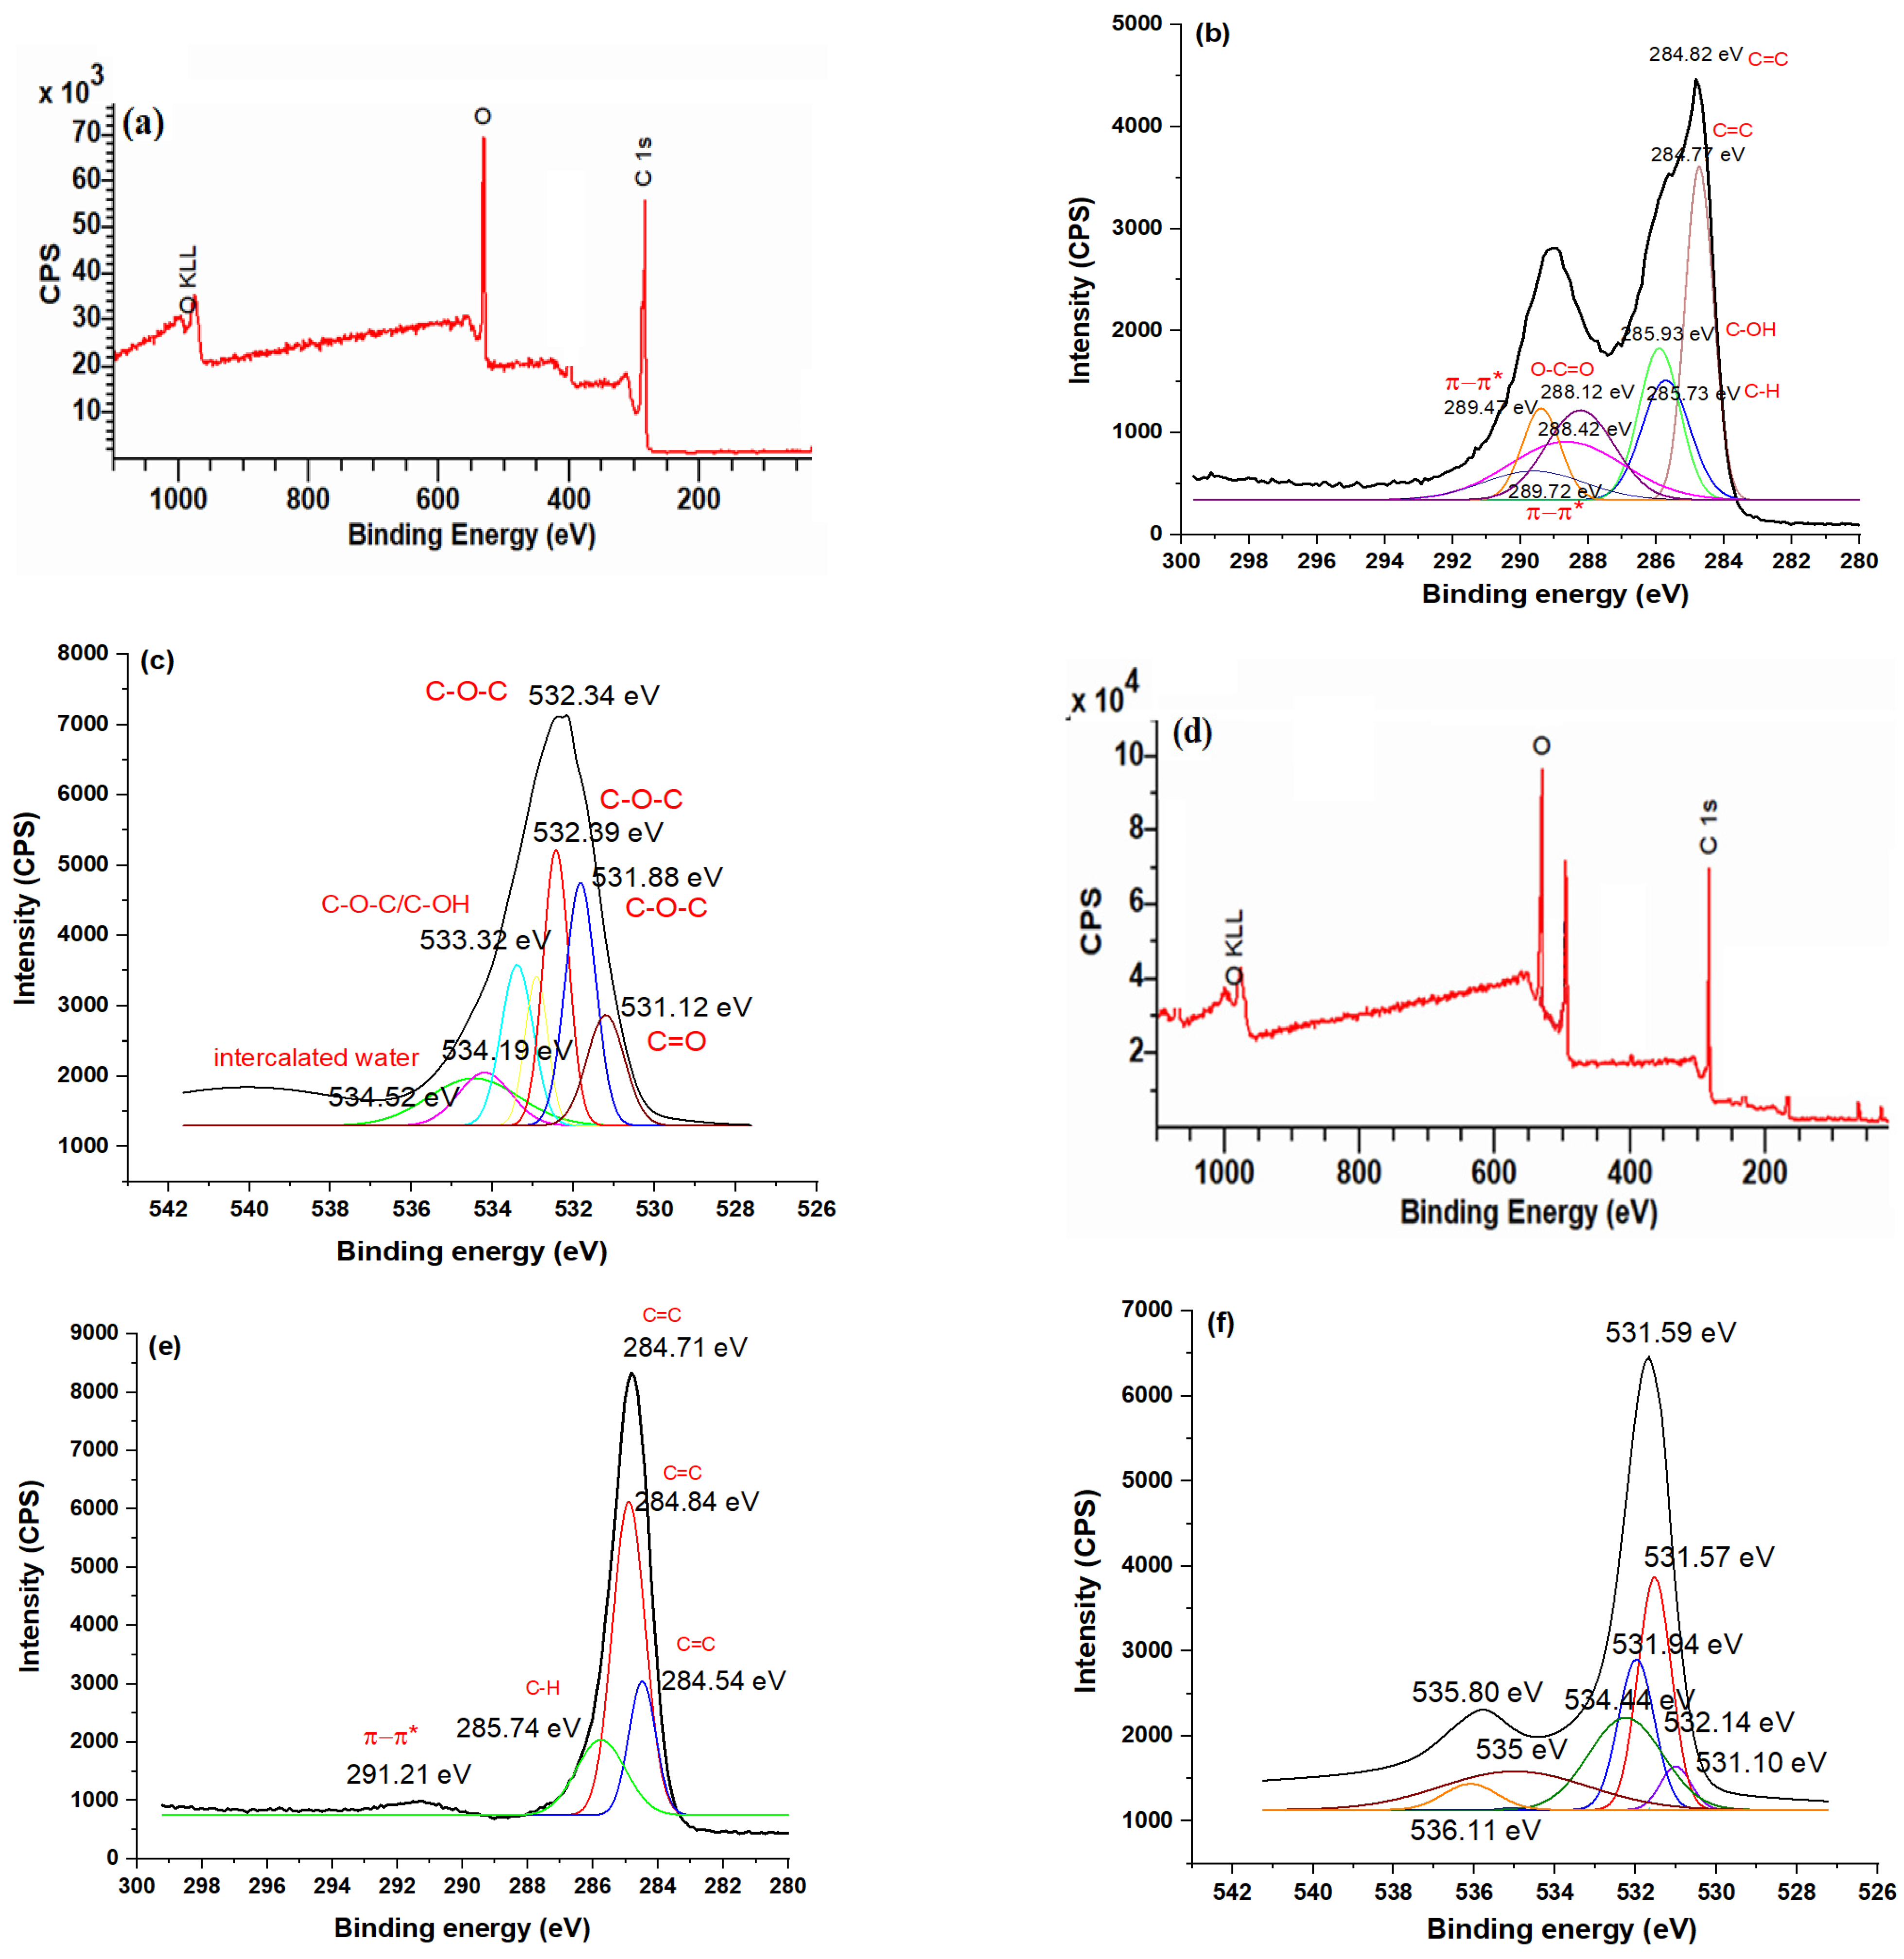
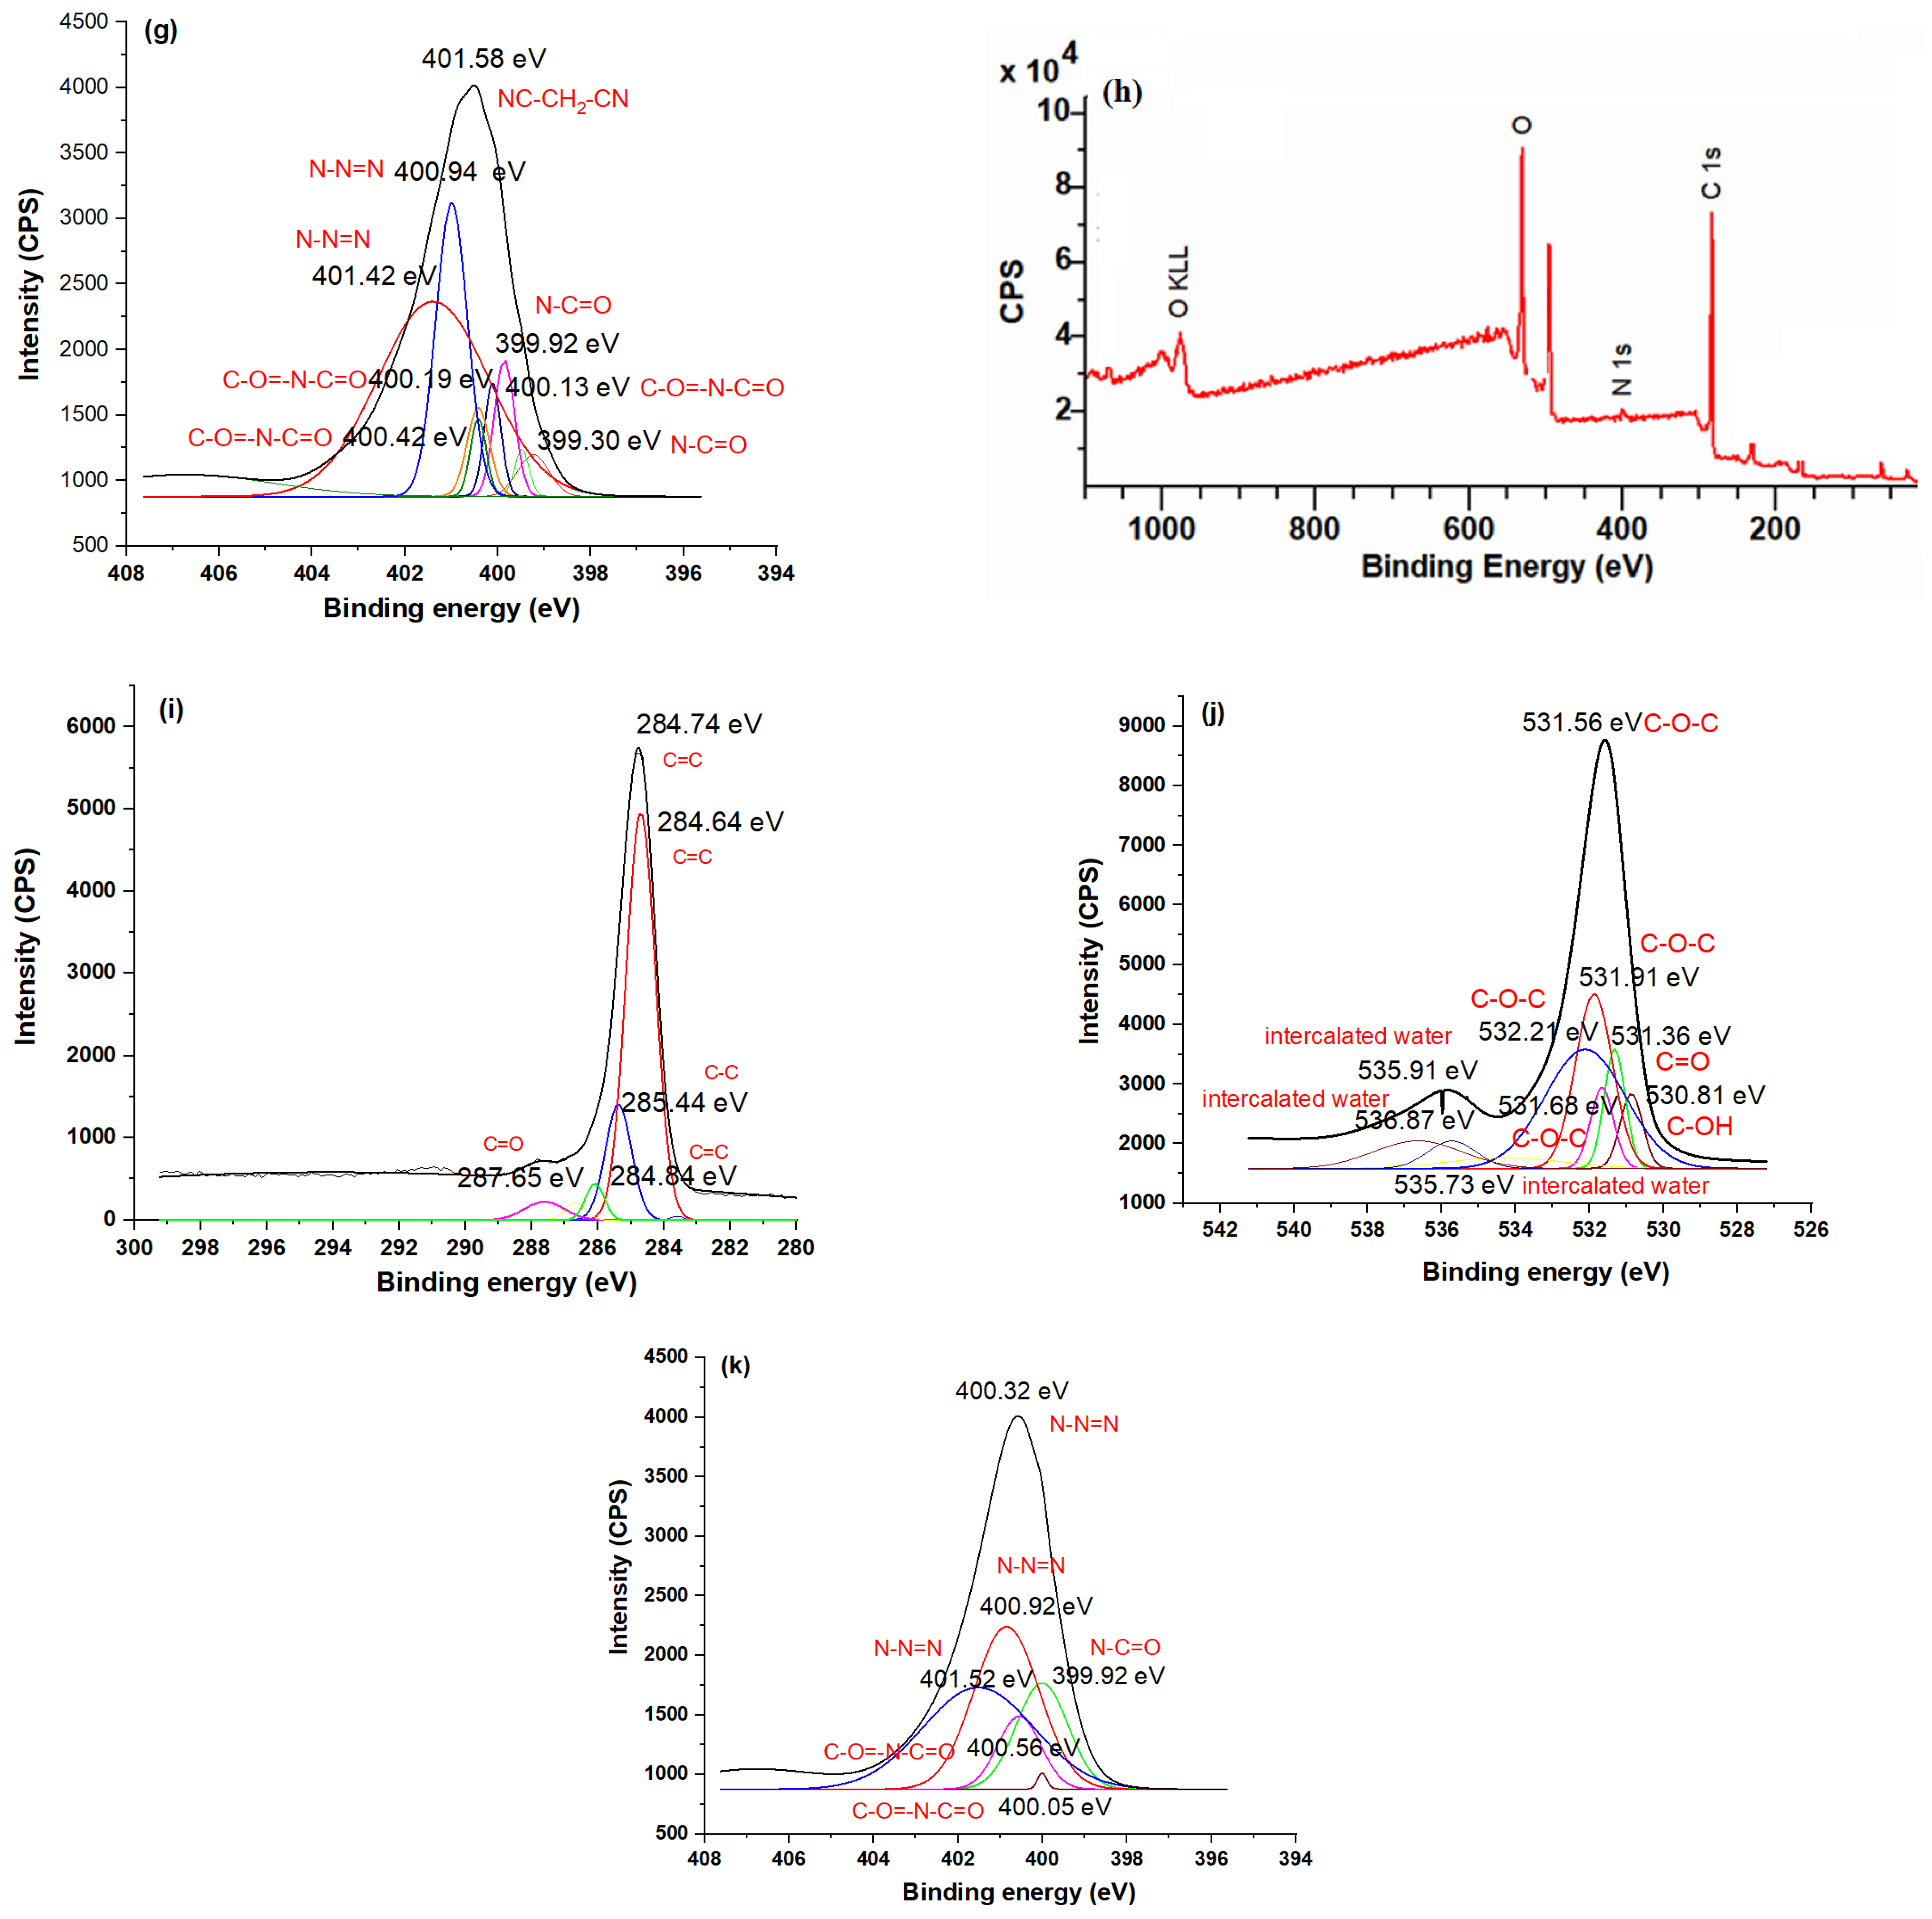
3.5. XPS Studies
3.6. SEM with Elemental Mapping Analysis
3.7. Cyclic Voltammetry and Electrochemical Sensing of CND/PANI Composites
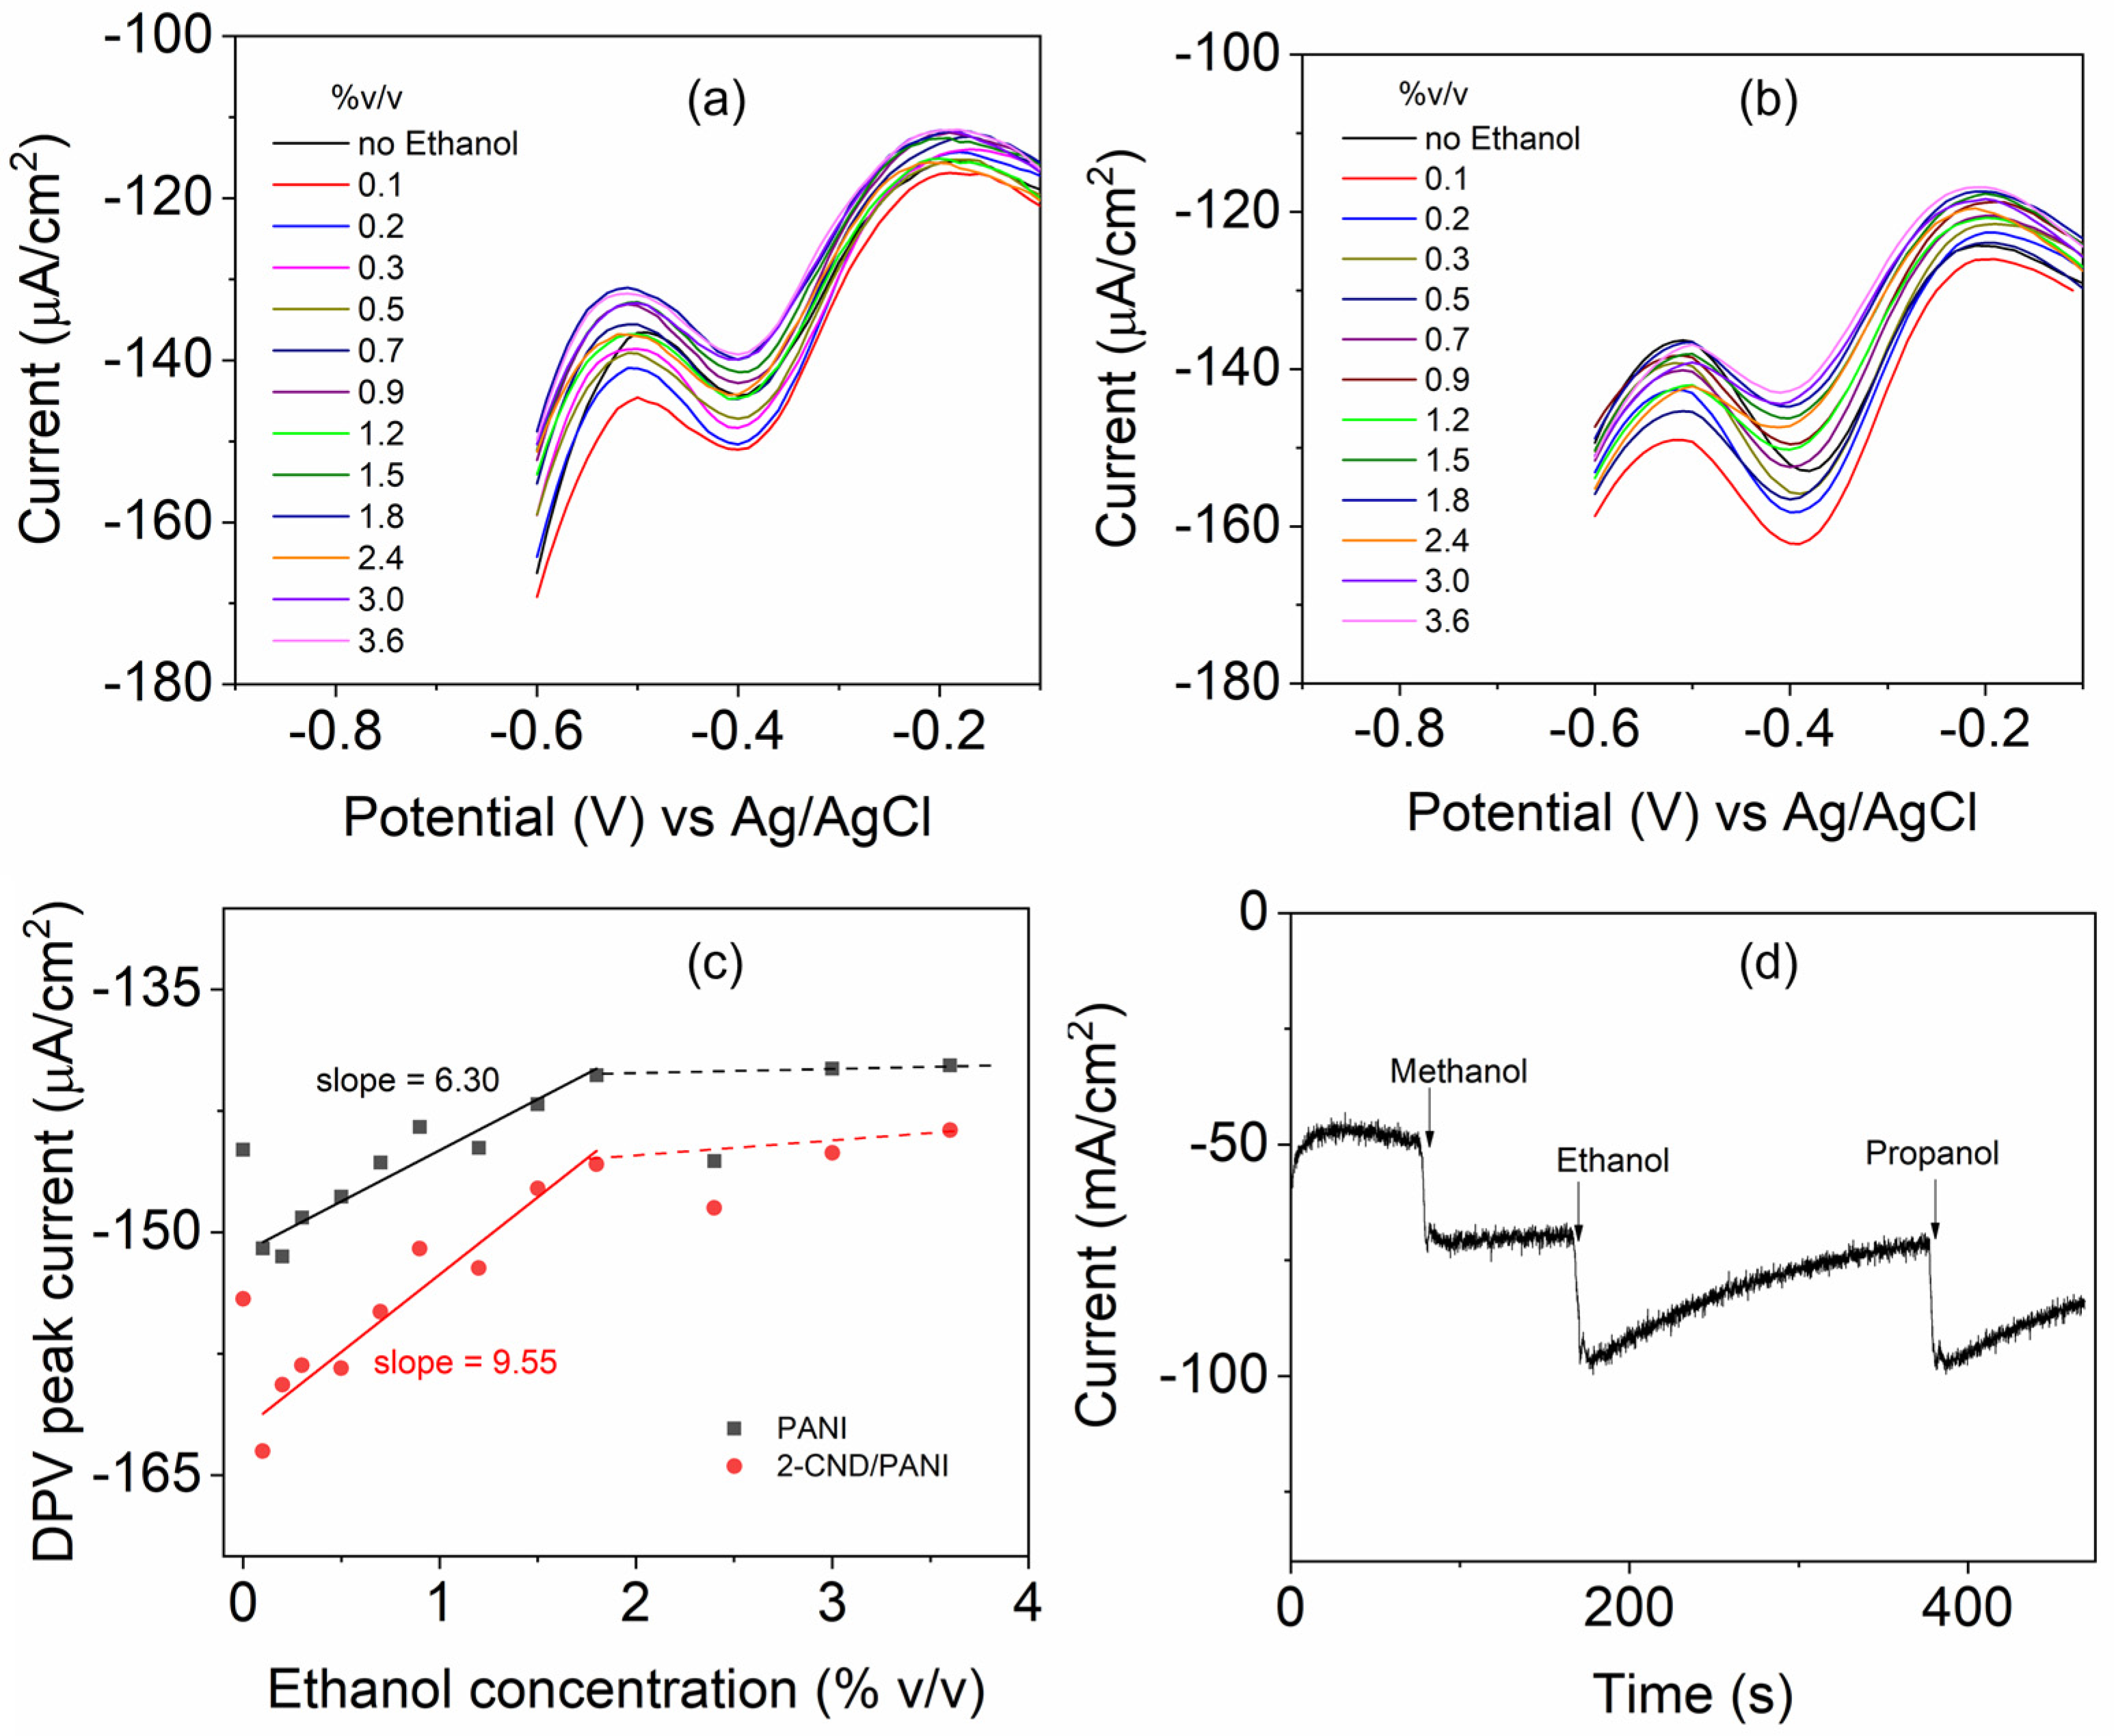
3.8. Electrochemical Sensing of Ethanol
4. Conclusions
Supplementary Materials
Author Contributions
Funding
Data Availability Statement
Conflicts of Interest
References
- Chia, M.-R.; Ahmad, I.; Phang, S.-W. Starch/Polyaniline Biopolymer Film as Potential Intelligent Food Packaging with Colourimetric Ammonia Sensor. Polymers 2022, 14, 1122. [Google Scholar] [CrossRef] [PubMed]
- Liu, X.; Tang, T.; Gao, X.; Tang, L.; Li, X.; Li, J. Dual-mode smart packaging based on tetraphenylethylene-functionalized polyaniline sensing label for monitoring the freshness of fish. Sens. Actuators B Chem. 2020, 323, 128694. [Google Scholar] [CrossRef]
- Abdolsattari, P.; Rezazadeh-Bari, M.; Pirsa, S. Smart Film Based on Polylactic Acid, Modified with Polyaniline/ZnO/CuO: Investigation of Physicochemical Properties and Its Use of Intelligent Packaging of Orange Juice. Food Bioprocess Technol. 2022, 15, 2803–2825. [Google Scholar] [CrossRef]
- de Oliveira, A.C.S.; Ugucioni, J.C.; da Rocha, R.A.; Santos, T.A.; Borges, S.V. Chitosan/Polyaniline Conductive Blends for Developing Packaging: Electrical, Morphological, Structural and Thermal Properties. J. Polym. Environ. 2019, 27, 2250–2258. [Google Scholar] [CrossRef]
- Abutalib, M.M.; Rajeh, A. Preparation and characterization of polyaniline/sodium alginate doped TiO2 nanoparticles with promising mechanical and electrical properties and antimicrobial activity for food packaging applications. J. Mater. Sci. Mater. Electron. 2020, 31, 9430–9442. [Google Scholar] [CrossRef]
- Rehim, M.H.A.; Yassin, M.A.; Zahran, H.; Kamel, S.; Turky, M.E.M.G. Rational design of active packaging films based on polyaniline-coated polymethyl methacrylate/nanocellulose composites. Polym. Bull. 2020, 77, 2485–2499. [Google Scholar] [CrossRef]
- Chia, M.-R.; Phang, S.-W.; Ahmad, I. Emerging Applications of Versatile Polyaniline-Based Polymers in the Food Industry. Polymers 2022, 14, 5168. [Google Scholar] [CrossRef]
- Beygisangchin, M. Recent progress in polyaniline and its composites; Synthesis, properties, and applications. Eur. Polym. J. 2024, 210, 112948. [Google Scholar] [CrossRef]
- Riaz, U.; Nwaoha, C.; Ashraf, S.M. Recent advances in corrosion protective composite coatings based on conducting polymers and natural resource derived polymers. Prog. Org. Coat. 2014, 77, 743–756. [Google Scholar] [CrossRef]
- Riaz, U.; Ashraf, S.M.; Ahmad, S. High performance corrosion protective DGEBA/polypyrrole composite coatings. Prog. Org. Coat. 2007, 59, 138–145. [Google Scholar] [CrossRef]
- Ashraf, S.M.; Ahmad, S.; Riaz, U. Development of novel conducting composites of linseed-oil-based poly (urethane amide) with nanostructured poly (1-naphthylamine). Polym. Int. 2007, 56, 1173–1181. [Google Scholar] [CrossRef]
- Singh, N.; Riaz, U. Recent trends on synthetic approaches and application studies of conducting polymers and copolymers: A review. Polym. Bull. 2022, 79, 10377–10408. [Google Scholar] [CrossRef]
- Zia, J.; Riaz, U. Photocatalytic degradation of anti-inflammatory drug using POPD/Sb2O3 organic-inorganic nanohybrid under solar light. J. Mater. Res. Technol. 2019, 8, 4079–4093. [Google Scholar] [CrossRef]
- Zia, J.; Aazam, E.S.; Riaz, U. Facile synthesis of MnO2 nanorods and ZnMn2O4 nano-hexagons: A comparison of microwave-assisted catalytic activity against 4-nitrophenol degradation. J. Mater. Res. Technol. 2020, 9, 9709–9719. [Google Scholar] [CrossRef]
- Riaz, U.; Nabi, N.; Nwanze, F.R.; Yan, F. Experimental and biophysical interaction studies of alanine modified polyaniline with bovine serum albumin and human serum albumin: Influence of alanine modification on the spectral, morphological and electronic properties. Synth. Met. 2023, 292, 117248. [Google Scholar] [CrossRef]
- Mir, A.; Fletcher, W.J.; Taylor, D.K.; Alam, J.; Riaz, U. Sustained Release Studies of Metformin Hydrochloride Drug Using Conducting Polymer/Gelatin-Based Composite Hydrogels. ACS Omega 2024, 9, 18766–18776. [Google Scholar] [CrossRef]
- Mir, A.; Aazam, E.S.; Riaz, U. Design of Phytic Acid Crosslinked Xerogels as Organic Photocatalysts for Visible Light-Assisted Degradation of Dyes. Adv. Mater. Interf. 2024, 11, 2400046. [Google Scholar] [CrossRef]
- Wang, L.; Fu, H.; Liu, H.; Yu, K.; Wang, Y.; Ma, J. In-situ packaging ultra-uniform 3D hematite nanotubes by polyaniline and their improved gas sensing properties. Mater. Res. Bull. 2018, 107, 46–53. [Google Scholar] [CrossRef]
- Taj, M.N.; Prasad, B.D.; Nagabhushana, H.; Reddy, A.; Ashwini, K.R.; Vinuta, K. Dielectric and structural properties of polyaniline-tungsten trioxide nanocomposites: For the packing of nanoelectronic devices and EMI shielding. Nano-Struct. Nano-Objects 2024, 39, 101219. [Google Scholar]
- Matindoust, S.; Farzi, A.; Nejad, M.B.; Abadi, M.H.S.; Zou, Z.; Zheng, L.-R. Ammonia gas sensor based on flexible polyaniline films for rapid detection of spoilage in protein-rich foods. J. Mater. Sci. Mater Electron. 2017, 28, 7760–7768. [Google Scholar] [CrossRef]
- Lee, K.; Cho, S.; Kim, M.; Kim, J.; Ryu, J.; Shina, K.-Y.; Jang, J. Highly porous nanostructured polyaniline/carbon nanodots as efficient counter electrodes for Pt-free dye-sensitized solar cells. J. Mater. Chem. A 2015, 3, 19018–19026. [Google Scholar] [CrossRef]
- Li, D.; Han, D.; Qu, S.N. Supra-(carbon nanodots) with a strong visible to near-infrared absorption band and efficient photothermal conversion. Light. Sci. Appl. 2016, 5, e16120. [Google Scholar] [CrossRef] [PubMed]
- Bajpai, S.K.; D’Souza, A.; Suhail, B. Blue light-emitting carbon dots (CDs) from a milk protein and their interaction with Spinacia oleracea leaf cells. Int. Nano. Lett. 2019, 9, 203–212. [Google Scholar] [CrossRef]
- Sukhorukov, G.B. Carbon nanodots: Mechanisms of photoluminescence and principles of application. Trac Trends Anal. Chem. 2017, 90, 27–37. [Google Scholar]
- Gu, X.; Chen, Z.; Li, Y.; Wu, J.; Wang, X.; Huang, H.; Liu, Y.; Dong, B.; Shao, M.; Kang, Z. Polyaniline/Carbon Dots Composite as a Highly Efficient Metal-Free Dual-Functional Photoassisted Electrocatalyst for Overall Water Splitting. ACS Appl. Mater. Interfaces 2021, 13, 24814–24823. [Google Scholar] [CrossRef]
- Strauss, V.; Wang, H.; Delacroix, S.; Ledendecker, M.; Wessig, P. Carbon nanodots revised: The thermal citric acid/urea reaction†. Chem. Sci. 2020, 11, 8256. [Google Scholar] [CrossRef]
- Rabchinskii, M.K.; Ryzhkov, S.A.; Besedina, N.A.; Brzhezinskaya, M.; Malkov, M.N.; Stolyarova, D.Y.; Arutyunyan, A.F.; Struchkov, N.S.; Saveliev, S.D.; Diankin, I.D.; et al. Guiding graphene derivatization for covalent immobilization of aptamers. Carbon 2022, 196, 264–279. [Google Scholar] [CrossRef]
- Brzhezinskaya, M.; Mishakov, I.V.; Bauman, Y.I.; Shubin, Y.V.; Maksimova, T.A.; Stoyanovskii, V.O.; Gerasimov, E.Y.; Vedyagin, A.A. One-pot functionalization of catalytically derived carbon nanostructures with heteroatoms for a toxic-free environment. Appl. Surf. Sci. 2022, 590, 153055. [Google Scholar] [CrossRef]
- Sobaszek, M.; Brzhezinskaya, M.; Olejnik, A.; Mortet, V.; Alam, M.; Sawczak, M.; Ficek, M.; Gazda, M.; Weiss, Z.; Bogdanowicz, R. Highly occupied surface states at deuterium-grown boron-doped diamond interfaces for efficient photoelectrochemistry. Small 2023, 19, 2208265. [Google Scholar] [CrossRef]
- Shringi, A.K.; Kumar, R.; Dennis, N.F.; Yan, F. Two-Dimensional Tellurium Nanosheets for the Efficient Nonenzymatic Electrochemical Detection of H2O2. Chemosensors 2024, 12, 17. [Google Scholar] [CrossRef]
- Walimbe, P.D.; Kumar, R.; Shringi, A.K.; Keelson, O.; Ouma, H.A.; Yan, F. Electrochemical Detection of H2O2 Using Bi2O3/Bi2O2Se Nanocomposites. Nanomaterials 2024, 14, 1592. [Google Scholar] [CrossRef] [PubMed]


Disclaimer/Publisher’s Note: The statements, opinions and data contained in all publications are solely those of the individual author(s) and contributor(s) and not of MDPI and/or the editor(s). MDPI and/or the editor(s) disclaim responsibility for any injury to people or property resulting from any ideas, methods, instructions or products referred to in the content. |
© 2025 by the authors. Licensee MDPI, Basel, Switzerland. This article is an open access article distributed under the terms and conditions of the Creative Commons Attribution (CC BY) license (https://creativecommons.org/licenses/by/4.0/).
Share and Cite
Jackson, S.; Taylor, M.; Kumar, R.; Shringi, A.K.; Leung, T.; Riaz, U. Synthesis and Characterization of Polyaniline/Carbon Nanodots: Electrochemical Sensing of Alcohols for Freshness Monitoring for Application as Packaging Materials. Nanomaterials 2025, 15, 593. https://doi.org/10.3390/nano15080593
Jackson S, Taylor M, Kumar R, Shringi AK, Leung T, Riaz U. Synthesis and Characterization of Polyaniline/Carbon Nanodots: Electrochemical Sensing of Alcohols for Freshness Monitoring for Application as Packaging Materials. Nanomaterials. 2025; 15(8):593. https://doi.org/10.3390/nano15080593
Chicago/Turabian StyleJackson, Shaila, Mary Taylor, Rajeev Kumar, Amit Kumar Shringi, TinChung Leung, and Ufana Riaz. 2025. "Synthesis and Characterization of Polyaniline/Carbon Nanodots: Electrochemical Sensing of Alcohols for Freshness Monitoring for Application as Packaging Materials" Nanomaterials 15, no. 8: 593. https://doi.org/10.3390/nano15080593
APA StyleJackson, S., Taylor, M., Kumar, R., Shringi, A. K., Leung, T., & Riaz, U. (2025). Synthesis and Characterization of Polyaniline/Carbon Nanodots: Electrochemical Sensing of Alcohols for Freshness Monitoring for Application as Packaging Materials. Nanomaterials, 15(8), 593. https://doi.org/10.3390/nano15080593