Abstract
Titanium dioxide is attractive for energy storage due to its abundance, stability, non-toxicity, low cost, and favorable electronic/optical properties. Colossal permittivity (CP) in co-doped TiO2 is mainly linked to defect structures rather than intrinsic bulk behavior. This work studies the dielectric properties of TiO2 co-doped with niobium and magnesium, synthesized by solid-state reaction. Grain size effects were examined by varying ball milling parameters of (½Mg½Nb)0.05Ti0.95O2 and then were correlated with structure, morphology, and dielectric response. X-ray diffraction (XRD), infrared spectroscopy (FTIR), scanning electron microscopy and energy-dispersive X-ray spectroscopy (SEM-EDS), X-ray photoelectron spectroscopy (XPS), and impedance spectroscopy (IS) (40 Hz–106 Hz, 150–370 K) were employed for structural, morphological, and electrical characterization. XRD confirmed the rutile phase. For co-doped samples, larger grains yielded higher dielectric constants, reaching high permittivity (ε′ = 429, T = 300 K, f = 10 kHz at 500 rpm for 2 h). Lower loss tangent (tan δ = 0.11, T = 300 K, f = 10 kHz at 200 rpm for 2 h) is linked to Mg segregation at grain boundaries. The most conductive sample showed the highest dielectric constant, suggesting an IBLC polarization mechanism driven by grain boundary effects. XPS confirmed Nb and Mg incorporation, with Ti4+ dominant and minor Ti3+ from oxygen vacancies and surface hydroxylation/defects.
1. Introduction
Electronic devices are embedded in our daily lives, and this trend is predicted to increase in the future. Thus, the demand for high-performance requirements for energy storage and conversion components is increasing, including capacitors and therefore also the dielectric materials that compose them. Due to this, a lot of research is undertaken on dielectric ceramics, bringing new materials with unprecedented properties. Among them, titanium dioxide (TiO2) has emerged as a promising candidate, being the simple metal oxide with a very high dielectric constant [1,2], but also owing to its abundance, chemical stability, non-toxicity, optical and electronic properties, low cost, and high photocatalytic efficiency. TiO2 has been extensively studied for a wide range of technological applications, from dielectric ceramics and energy storage devices to photocatalysis and solar cells, owing to its abundance, stability, and tunable electronic properties [3,4]. Notwithstanding great dielectric properties, bulk titanium dioxide does not reach colossal permittivity (CP), meaning a dielectric constant higher than 1000. Nevertheless, a huge number of studies are emerging on vastly increasing the dielectric properties by the addition of one or more dopants.
Interestingly, recent studies have reported colossal relative permittivity for co-doped TiO2 in the form (A, B)x Ti1−xO2, where A is pentavalent and B is tri- or bivalent cations [1,2,5,6,7,8,9]. The B cation corresponds to the acceptor, giving an electron and reducing Ti4+ to Ti3+, while the B cation corresponds to the donor. Many dopants have been tested and compared, with niobium and magnesium emerging as the best combination [2]. Indeed, using Nb as the A pentavalent appears to hugely improve the dielectric constant [5,6,7]. Whereas it is reported that Mg tends to reduce the dielectric loss by filling the grain boundary vacancies or even by creating its own phase in the grain boundaries [10].
The origin behind the CP effect In TiO2 is still debated, and several models have been proposed, including the internal barrier layer capacitor (IBLC) model [5,8], electron-pinned defect dipoles (EPDD) [7,11], interfacial and electrode polarization effects [9], and microscopic inhomogeneities or polaronic relaxation [12].
Despite there being no universal consensus regarding the dominant mechanism, IBLC is widely recognized. This model assumes the grains to be semiconductors and the grain boundaries as insulators, hence creating a capacitor inside the material, with grain boundaries as the dielectric and grains as electrodes. Recently, EPDD also made a breakthrough by being successful for (Nb5+, In3+) co-doped TiO2 [11,13,14].
However, regarding the mechanisms involved, it is widely accepted that CP is closely linked to defects in grains rather than the bulk material. Understanding the intricate polarization mechanisms associated with these defects is critical for advancing CP materials, particularly in co-doped TiO2.
In the present work, we focused on TiO2 co-doped with niobium and magnesium, prepared using the solid-state reaction method, to evaluate the influence of grain size on the dielectric properties by varying the ball milling parameters.
Structural analysis confirmed a pure rutile phase structure, with larger grain sizes associated with a higher dielectric constant, achieving a high permittivity of ε′ = 429 (at T = 300 K and f = 10 kHz) with dopant concentration x = 0.05, processed in a ball milling setup at 500 rpm for 2 h. Smaller grains, linked to Mg accumulation at grain boundaries, give a low loss tangent (tan δ = 0.11 at T = 300 K and f = 10 kHz).
2. Materials and Methods
(Nb+Mg) were prepared by the conventional solid-state reaction, using as raw material TiO2 (Alfa Aesar, rutile, 99.5%), MgO (Sigma-Aldrich, 99%), and Nb2O5 (Sigma-Aldrich, 99.5%) according to the following proportions (½Mg½Nb)x Ti1−xO2, being x = 0.05. The mixture was then ball-milled in a planetary ball-milling machine (Fritsch Pulverisette 7) with 25 balls (10 mm diameter), 15 g of mixture, and 5 mL of ethanol in an agate vessel. The rotation speed ranged from 200 to 500 rpm for both 2 h and 4 h at each speed. The latter samples are summarized in Table 1 below. For the pellet production, a drop of polyvinyl alcohol (PVA) 2% wt. is added to the powder as a binder, then pressed into cylindrical pellets with a 13 mm diameter in a uniaxial press with a pressure of 150 Mpa for 2 min. The PVA will be removed during the sintering. The sintering is realized at 1400 °C for 10 h with a heating rate of 5 °C/min in a platinum crucible. Moreover, powder corresponding to the pellet has been disposed at the bottom of the crucible as sacrificial powder to prevent the pellets from passing through the crucible. The complete synthesis route is summarized in Figure 1.

Table 1.
List of co-doped TiO2 samples studied and their various synthesis conditions.
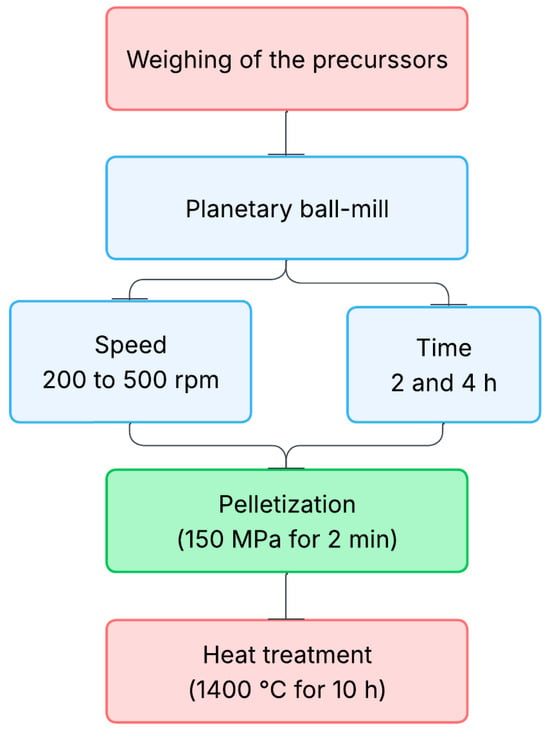
Figure 1.
Synthesis route flowchart of the TiO2 co-doped samples using different speeds and times of ball-milling.
The crystallographic structure and the phase formation of the samples were studied by X-ray diffraction (XRD). An AERIS X-ray diffractometer from PANalytical was used, using Cu-K1 radiation (λ = 1.54056 Å) at 40 kV and 15 mA, in the 2θ angle range of 10–70° for 30 min.
Fourier Transform Infrared Spectroscopy (FTIR) analysis was performed using a PerkinElmer Spectrum Two spectrometer equipped with a UATR Two (Universal Attenuated Total Reflectance) accessory. The measurements were conducted on powdered samples in transmittance mode, with 20 scans collected per spectrum over the range of 4000 to 400 cm−1. The resulting spectra were used to identify characteristic functional groups and molecular vibrations present in the samples.
The surface, bulk morphology, and chemical composition were evaluated by scanning electron microscopy (SEM) (Vega 3-TESCAN) and energy-dispersive spectroscopy (EDS) (Bruker). The samples were coated with carbon before microscopic observation.
The chemical composition of all samples was analyzed by X-ray photoelectron spectroscopy (XPS) using an ESCALAB Xi+ system (Thermo Scientific Surface Analysis, Waltham, MA, USA), using the Avantage Data System, equipped with a multichannel hemispherical analyzer and a dual X-ray source, operated with Al Kα radiation (hν = 1486.2 eV). The samples were mounted on the analysis stage with conductive carbon tape and subsequently outgassed in the pre-chamber at room temperature under a pressure below 2 × 10⁻⁸ Torr to eliminate chemisorbed water from their surfaces. The C 1s peak at 284.8 eV was used as the internal reference for energy calibration. Quantitative analysis of surface composition and oxidation states was performed by integrating the core-level peaks after Shirley-type background subtraction, applying the appropriate experimental sensitivity factors available in the Avantage software package (version 5.978). Peak assignments and interpretation of chemical states were further supported by reference data from the NIST XPS Database and the XPS Handbook.
For the electrical measurements, in the frequency range from 40 Hz to 1 MHz, pellets in disk form with a thickness of about 1 mm and a diameter of 10 mm were prepared, and their opposite sides were painted with silver conducting paste. During the electrical measurements, the samples were maintained in a helium atmosphere to improve the heat transfer and eliminate the moisture. These measurements were made using a precision impedance analyzer (Agilent 4294A) in the Cp-Rp configuration, in the temperature range of 150–370 K. The real part, ε′, and the imaginary part, ε″, of the complex permittivity were calculated [15] using Equations (1) and (2):
where A and d represent the sample area and thickness, respectively, , the free space permittivity, and ω the angular frequency. Impedance spectroscopy can distinguish grains and grain boundaries by analyzing their distinct electrical responses, especially in materials like ceramics.
3. Results and Discussion
3.1. Structural Analysis
The XRD pattern for pure and 5% co-doped samples, with both 2 h and 4 h milled time, is shown in Figure 2. All the samples describe a pure rutile TiO2 (JCPDS 04-006-9228); nonetheless, after 2θ of 50°, the increase in the speed appears to slightly split the peaks to higher values, without real impact on the structure or the phase as described in Table 2. It displays the crystalline parameters obtained after Rietveld refinement, and these results highlight the pure rutile phase for every 4 h sample, with the goodness-of-fit as an indicator of the phase matching between the sample and the theoretical shape. Thus, it can be affirmed that the ball milling speed as well as the time does not affect the rutile phase and that there is no formation of a major phase from the dopant in the material.
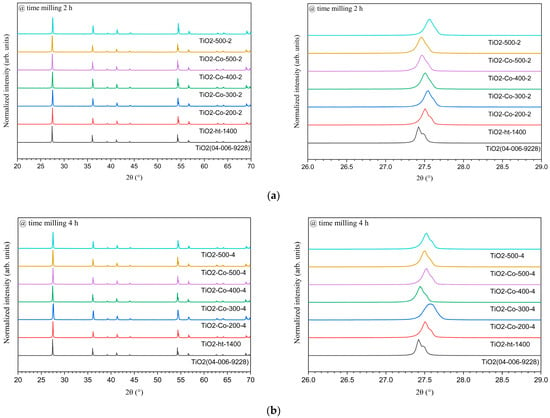
Figure 2.
XRD patterns of pure and 5% co-doped TiO2 after ball milling for (a) 2 h and (b) 4 h, compared with pure TiO2 heat-treated at 1400 °C (no milling) and the reference pattern from ICDD #04-006-9228. For each figure, on the right side, an inspection at 2θ ≈ 28° is shown.

Table 2.
Crystalline parameters obtained with Rietveld refinement on the 4 h, 5% co-doped TiO2.
A closer inspection of the main rutile (110) reflection located at approximately 2θ ≈ 28° (right side of Figure 2a,b) reveals a slight shift toward lower diffraction angles for the co-doped samples compared to pure TiO2. According to Bragg’s law, this shift corresponds to an increase in the interplanar spacing (dₕₖₗ) and is indicative of lattice expansion. This effect can be attributed to the substitution of Ti4+ ions (0.605 Å, CN = 6) by larger dopant cations such as Mg2+ (0.72 Å), while Nb5+ (0.64 Å) contributes to local distortion and defect compensation mechanisms. Similar peak shifts toward lower 2θ values upon co-doping have been reported in rutile TiO2 systems by Yang et al. [16] and Ke et al. [14], confirming dopant incorporation into the TiO2 lattice rather than the formation of separate crystalline phases. The subtle variation in unit cell volume observed by Rietveld refinement (Table 2) further supports successful substitutional incorporation of Mg and Nb into the rutile structure with minimal disturbance of the tetragonal symmetry.
The FTIR spectra of pure heat-treated TiO2 and co-doped TiO2 samples ground at different rotation speeds, for the longest grinding time, show characteristic vibration bands of Ti–O bonds and adsorbed CO2 (Figure 3). The band centered around 517 cm−1 is attributed to Ti–O stretching modes, and the weak band near 2360 cm−1 corresponds to the symmetric stretching of CO2 adsorbed on the surface of the samples. No additional absorption bands indicative of Mg–O or Nb–O bonds were observed in any of the co-doped samples, regardless of the grinding speed. This indicates that even at higher rotation speeds and after prolonged milling, no new vibrational modes involving the dopants were formed that were detectable by FTIR [17,18].
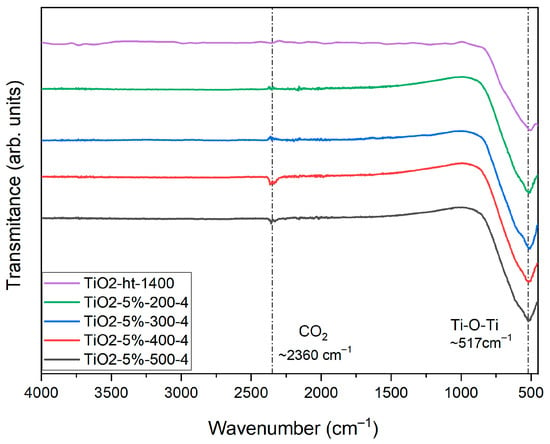
Figure 3.
FTIR spectra of pure heat-treated TiO2 and co-doped TiO2 milled at different speeds for 4 h.
3.2. Morphological and Composition Analysis
SEM micrographs (Figure 4) reveal dense microstructures for all samples, with grain morphology strongly influenced by both doping and milling conditions.
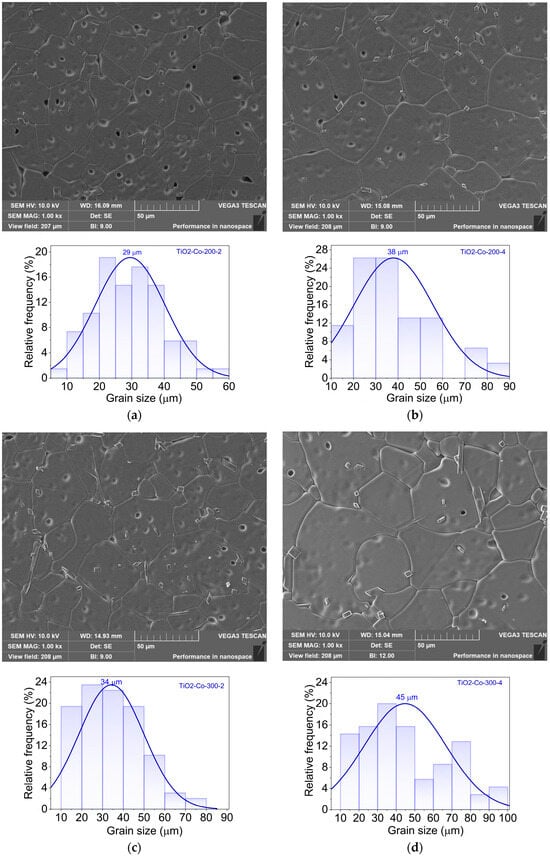
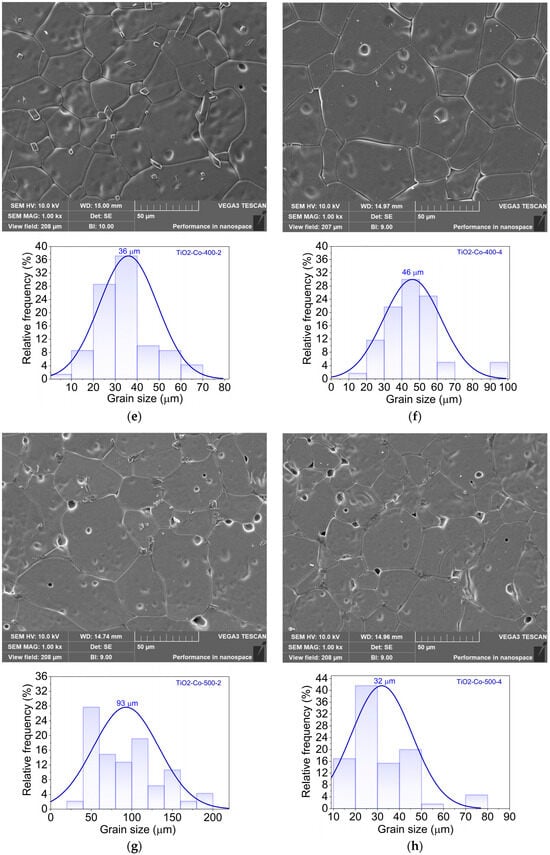
Figure 4.
SEM images of all the 5% co-doped samples (magnitude of 10,000×) for (a) TiO2-Co-200-2, (b) TiO2-Co-200-4, (c) TiO2-Co-300-2, (d) TiO2-Co-300-4, (e) TiO2-Co-400-2, (f) TiO2-Co-400-4, (g) TiO2-Co-500-2, and (h) TiO2-Co-500-4.
All samples exhibit a dense microstructure characterized by large TiO2 grains, with localized regions of porosity. In general, higher milling speed and longer milling duration promote the formation of ceramic samples with increased grain size. An exception is observed in the sample derived from powders milled at 500 rpm (Figure 4g,h).
Unlike the results of XRD analysis, SEM micrographs point to the existence of localized contrast at some grain boundaries, associated with the presence of an Mg-rich grain boundary phase, presenting a rectangular/rod-like form with less than 2 μm of size. Rather than forming a well-defined crystalline secondary phase, this Mg-rich region is most likely amorphous or nanocrystalline, remaining below the XRD detection limit. This interpretation is supported by EDS mapping, which reveals local enrichment of Mg at grain boundaries, suggesting dopant segregation instead of the formation of a bulk Mg-based oxide phase (e.g., MgO or MgTiO3). Similar Mg segregation effects have been reported in co-doped rutile ceramics and are known to contribute to the reduction in dielectric losses by increasing grain boundary resistivity [8,10,16]. The Hume-Rothery rule, which states that a substitutional solid solution is more likely to be formed if the mismatch of the ionic radii is less than 15% and the electronegativities of the two elements are similar, can explain this minor phase [16]. Once the ionic radii of the doping element in the TiO2 solution are beyond those limits (52 pm < r < 70 pm), an interstitial solid solution or a secondary phase could be formed. The ionic radii of the Nb5+ and Mg2+ are 64 pm and 72 pm, respectively. Due to the large ionic radii of the latter, an enriched phase of Mg could be formed. This Mg-rich amorphous or nanocrystalline phase cannot be detected by XRD, probably due to its low volume fraction and/or poor crystallinity, which place its signal below the detection limit of the technique. In addition, its preferential localization at grain boundaries further reduces its contribution to the overall diffraction pattern.
The ball-milling speed and duration also play a critical role. At lower speeds (200 rpm), grains remain relatively small and uniform, whereas increasing the milling speed progressively enlarges the grain size, reaching maximum values at 500 rpm. Interestingly, for 500 rpm, the difference between 2 h and 4 h milling is less pronounced, suggesting a saturation effect in particle refinement and subsequent grain growth during sintering. In contrast, at the lowest and intermediate speeds (200; 300–400 rpm), extending the milling time from 2 h to 4 h noticeably increases the mean grain size by approximately 30%, pointing to enhanced powder homogeneity and reactivity that facilitate grain coalescence during densification.
Figure 5 describes the elemental mapping of different samples, allowing us to better understand the distribution of the elements in our samples. Figure 5a exhibits the purity character of the non-doped sample, and Table 3 resumes the homogeneous distribution of titanium and oxygen elements. Figure 5b,c shows the co-doped samples for both 2 h and 4 h, firstly showing the presence of both dopants in the grains. Nevertheless, while niobium tends to increase the grain size [19], it confirms that magnesium creates its own secondary phase in the grain boundaries, subsequently reducing the dielectric loss [10,20]. Thus, Table 3 confirms the reduction in the titanium proportion due to the addition of the dopants. Despite this, the dopant proportions are not evenly distributed, obtaining Mg as a major part. The uneven ratio could be due to this dopant accumulation in the grain boundaries, inducing a higher concentration, raising the Mg reveal on the EDS mapping.
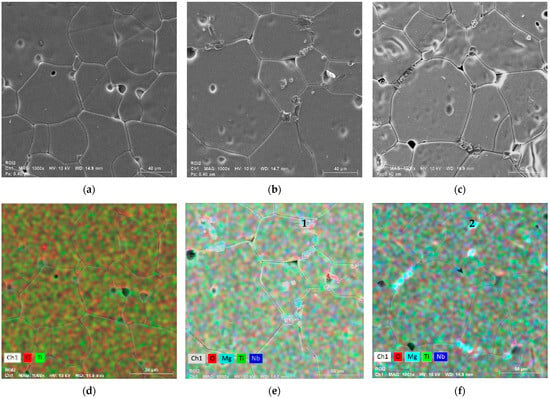
Figure 5.
(a–c) SEM images of undoped and doped samples (magnitude of 10,000×) for (a) TiO2-500-2, (b) TiO2-Co-500-2, (c) TiO2-Co-500-4, and (d–f) element mapping for samples (d) TiO2-500-2, (e) TiO2-Co-500-2, and (f) TiO2-Co-500-4.

Table 3.
EDS results for the samples TiO2-500-2, TiO2-Co-500-2, and TiO2-Co-500-4; points 1 and 2 also include the semi-quantitative analysis of magnesium accumulation in grain boundaries.
Moreover, as shown in Table 3, the semi-quantitative EDS analysis performed on two additional points (1 and 2) located at grain boundaries revealed a pronounced enrichment in magnesium (≈10–11 at %), confirming Mg segregation in these intergranular regions and supporting the presence of a Mg-rich grain-boundary phase. This result reinforces that no Mg-based crystalline phases were detected by XRD, nor were new Mg–O vibrational bands observed by FTIR, suggesting that the Mg-rich phase is amorphous or nanocrystalline and below the detection limit of conventional diffraction techniques.
X-ray photoelectron spectroscopy (XPS) was employed to analyze the chemical composition and elemental states present in the doped TiO2 pellets. The survey spectrum (Figure 6a) confirms the presence of titanium (Ti), oxygen (O), niobium (Nb), and magnesium (Mg) within the pellet. No significant impurities were detected, indicating a clean synthesis process. High-resolution spectra were acquired for the O 1s, Ti 2p, Nb 3d, and Mg 1s core levels to further investigate the oxidation states and chemical environments of these elements.
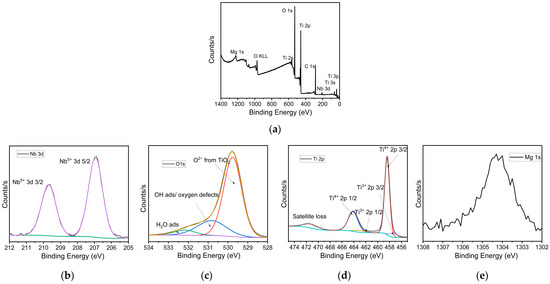
Figure 6.
XPS analysis of TiO2 co-doped with Nb and Mg: (a) survey spectrum and high-resolution spectra of (b) Nb 3d, (c) O 1s, (d) Ti 2p, and (e) Mg 1s.
The O 1s core-level spectrum (Figure 6c) shows a primary peak centered at approximately 530.0 eV, which is attributed to lattice oxygen (Ti–O) in the TiO2 structure. Additional components at higher binding energies (~531.5 eV and ~532.5 eV) are assigned to oxygen vacancies, hydroxyl groups, and possibly adsorbed molecular water or carbonates on the surface [21,22]. The multi-peak deconvolution suggests the coexistence of both stoichiometric TiO2 and defect-rich or hydroxylated regions, which can influence the electronic and catalytic properties of the pellet.
In the Ti 2p spectrum (Figure 6d), two distinct peaks are observed at binding energies of ~458.5 eV and ~464.2 eV, corresponding to the Ti 2p3/2 and Ti 2p1/2 spin–orbit components, respectively. These positions are consistent with Ti in the +4 oxidation state, confirming the presence of Ti4+ as expected in TiO2 [23]. Minor shoulders or slight asymmetries in the lower binding energy region hint at the presence of a small fraction of Ti3+ species, likely associated with oxygen vacancies or a slight reduction in the titanium environment.
The Nb 3d spectrum (Figure 6a) reveals a well-defined doublet with peaks at approximately 207.5 eV (Nb 3d5/2) and 210.2 eV (Nb 3d3/2), characteristic of Nb in the +5 oxidation state [24]. The sharp and symmetrical nature of the peaks suggests that Nb is uniformly incorporated into the TiO2 lattice, likely substituting Ti4+ sites, which can enhance electrical conductivity and modify the band structure through donor doping.
The Mg 1s core-level peak appears at ~1303 eV, corresponding to Mg2+ species [25]. The relatively weak intensity of this peak indicates a lower concentration of magnesium in the pellet, yet its clear presence confirms successful incorporation (Figure 6e). Magnesium may either be substituting for Ti4+ in the lattice or present at the surface, potentially influencing the surface charge distribution and photocatalytic behavior of the pellet.
Collectively, the XPS analysis demonstrates that the TiO2 film is successfully doped with both Nb and Mg, maintaining the primary Ti4+ oxidation state and showing features indicative of oxygen vacancies and surface hydroxylation. These modifications are expected to play a significant role in tuning the pellet’s optical, electronic, or catalytic properties.
3.3. Electrical Analysis
Impedance spectroscopy grants us the fundamental aspect of the material properties, notably the molecular motion therein. The complex permittivity has been calculated, ε* = ε′ − iε”, with both the real part, ε′, representing the ability of the material to store energy, and the imaginary part, ε″, related to the dissipated energy. Through the complex permittivity components, it is also possible to calculate the dielectric loss, tan δ, defined by (Equation (3)),
The frequency dependence (40 Hz to 1 MHz) of the dielectric properties of the 5% co-doped and non-doped rutile TiO2 at 300 K is shown in Figure 7. Figure 7a shows the dielectric constant, with all the doped samples appearing to have the same tendency. As observed, samples prepared with higher ball-milling speed present higher dielectric constant values, notably TiO2-Co-500-2 reaching the best dielectric constant (e’ = 429) at 10 kHz. At low frequencies, pure TiO2 samples display higher values than the co-doped ones. However, in the MHz region, where it is expected that extrinsic polarization mechanisms no longer have a place, the co-doped samples (except the TiO2-Co-200-2 sample) present higher e’ than the undoped TiO2. This effect can be related to the codoping process, which has a stronger influence on the intrinsic dielectric constant of the samples compared to the impact of the ball-milling conditions.
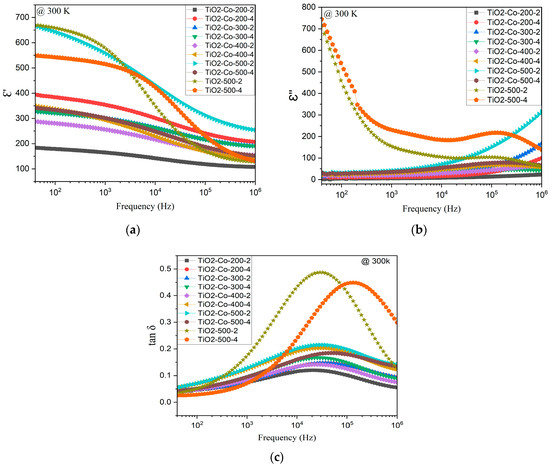
Figure 7.
Frequency dependence of the dielectric properties of undoped and 5% doped TiO2, (a) dielectric constant ε′, (b) imaginary part ε″ at 300 K, and (c) loss tangent, tan δ.
All the doped samples present the same frequency dependence for the dielectric losses as seen in Figure 7c, and for all co-doped samples, a strong decrease in tan δ is observed, compared with the undoped samples. In fact, the dopants affect the imaginary part of Figure 7b by reducing its proportion when compared to the non-doped samples. In addition to this, the ball-milling time also seems to have an impact on the frequency of the relaxation peak; indeed, for the non-doped samples, as can be seen in Figure 7c, 2 h of milling induces a peak at 30 kHz, while 4 h has a peak at 200 kHz. Moreover, the best tan δ result was measured for the sample TiO2-Co-200-2 with (tan δ = 0.11) at 10 kHz. Relating the dielectric response to the sample’s morphology, observed from SEM micrographs, we can state that samples with the lowest dielectric losses correspond to those with the lowest grain size. Based on the previous correlation between the grain size and the composition, it is possible to link the dopant and the dielectric properties. Certainly, niobium may influence the dielectric constant while magnesium influences the dielectric losses, as confirmed in other works on doping with Nb and Mg [5,6,7,10]. Indeed, the strong dielectric dispersion observed at low frequencies (Figure 7a), together with the simultaneous decrease in dielectric loss (tan δ) for co-doped samples (Figure 7c), is consistent with an Internal Barrier Layer Capacitance (IBLC) mechanism. This model assumes the coexistence of semiconducting grains and insulating grain boundaries, which leads to charge accumulation at interfaces and results in a Maxwell–Wagner-type relaxation. The improved dielectric response obtained upon co-doping can therefore be understood as a consequence of Nb5+ donor doping increasing bulk conductivity, while Mg2+ segregation enhances grain boundary resistivity, promoting interfacial polarization. Similar frequency-dependent dielectric behavior driven by IBLC has been widely reported in co-doped TiO2 ceramics and other colossal permittivity materials [5,8,26,27]. These results support the conclusion that the dielectric enhancement in the present work is predominantly extrinsic in origin and governed by grain boundary effects rather than intrinsic lattice polarization.
Overall, the dielectric results depend on the ceramics’ microstructure, which in turn depends on the ball-milling conditions. Indeed, the highest dielectric constant is observed for the samples with higher mean grain size, which corresponds to the samples prepared with the highest ball-milling speed (TiO2-Co-500-2). On the other hand, the lowest dielectric constant and losses correspond to the sample with the lowest mean grain size, and so the lowest milling speed (TiO2-Co-200-2). For context, Table 4 compares our highest ε′ and lowest tan δ at 10 kHz and 300 K with representative (Mg,Nb)- and (In,Nb)-co-doped rutile TiO2 from the literature. While literature colossal permittivity (CP) systems can exceed 104 with very low loss, our work focuses on correlating microstructure (grain size/grain boundary chemistry) with dielectric response under controlled milling and sintering conditions.

Table 4.
Room-temperature (300 K) dielectric performance at 10 kHz for rutile TiO2 (this work vs. literature).
Figure 8 shows the temperature dependence of the dielectric properties from 150 K to 370 K at 10 kHz. At low temperatures, the dielectric constant is stable and starts rising significantly from 250 to 275 K for the doped samples. This increase means that at this temperature, there is enough energy to unlock a new polarization mechanism, enabling the increase in the permittivity of the material. This phenomenon is also visible on the imaginary part, Figure 8b, ε″, where the peaks are in the same temperature ranges. It is likely that this temperature-dependent polarization mechanism can be ascribed to the IBLC model. With the rising temperature, more electrons/holes are thermally excited in the semiconducting grains, increasing their mobility and conductivity, and consequently increasing charge storage at the grain/grain boundaries interface. Moreover, the ball-milling time also seems to have an impact on the peak temperature, compared to the pure TiO2 curves, TiO2-500-2 and TiO2-500-4. The lowest ball-milling time causes a higher split of the peak in temperature.
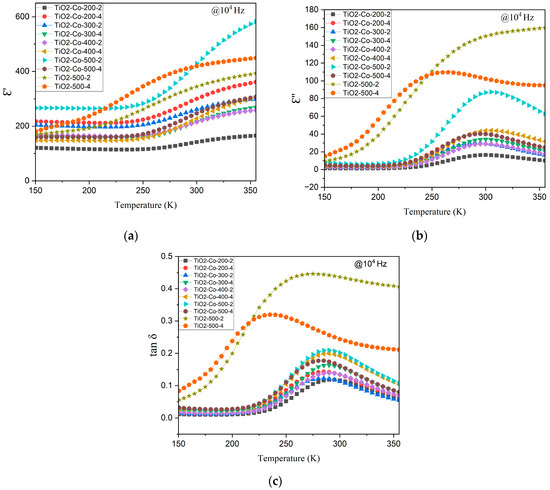
Figure 8.
Temperature dependence of the dielectric properties of undoped and doped TiO2, (a) real part ε′, (b) imaginary part ε″, and (c) loss tangent, tan δ.
The information obtained from scanning electron microscopy is important to decide on the best model of the dielectric relaxation to be used. The double relaxation processes are often attributed to the distinct electrical behaviors of the grains (bulk) and grain boundaries. These two microstructural regions contribute separately to the dielectric and conductivity response of the material, resulting in two distinct relaxation processes. Then, we used the Havriliak–Negami model, with two relaxation processes, which fit the data accurately. Figure 9 shows the experimental data and the fitting for the sample TiO2-Co-300-4 at 290 K. In the Cole–Cole plot, Figure 9c, the high-frequency arc corresponds to grain response, and the low-frequency arc corresponds to grain boundary response. Similarly, in dielectric permittivity versus frequency plots, a shoulder or peak at high frequencies is attributed to the grain relaxation, and a second shoulder or peak at lower frequencies arises from the grain boundaries.
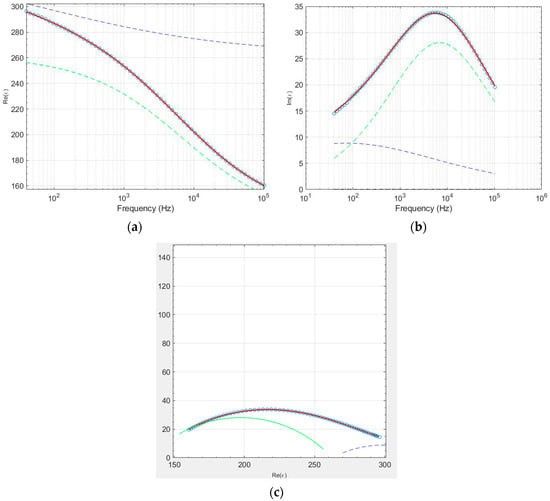
Figure 9.
Sample TiO2-Co-300-4 at 290 K, (a) real part ε′ vs. frequency, (b) imaginary part ε″ vs. frequency, and (c) Cole–Cole plot. The red line presents the fitting of the experimental data, where the blue and green dashed lines correspond to each relaxation process.
To obtain the two relaxation parameters, the expression given by S. Havriliak et al. [28] was used (Equation (4)):
where ε*(ω) is the complex dielectric permittivity as a function of angular frequency, ω, (ω = 2πf), σdc is the conductivity of the material under direct current, ε0 is the free space permittivity, ε∞ is the permittivity at high frequencies, ∆ε = εS − ε∞ is the dielectric strength, with εS being the static permittivity (ω = 0), τ being the relaxation times, and α and β being the shape parameters of both relaxations that affect the width and asymmetry of the relaxation process.
The HN model was fitted to the experimental data by using the software EIS smart tool [29]. The fitting results are in agreement with the experimental data, meaning that the HN model can be used to accurately describe their behavior. The analysis of the Havriliak–Negami parameters (Figure 10) reveals that only the α parameter deviates from unity, while β remains equal to one for both the first and second relaxation processes. This behavior corresponds to a non-Debye dielectric response of the Cole–Cole model, indicating a moderate distribution of relaxation times associated with microstructural heterogeneities, such as grain size variations and Mg-rich grain-boundary regions.
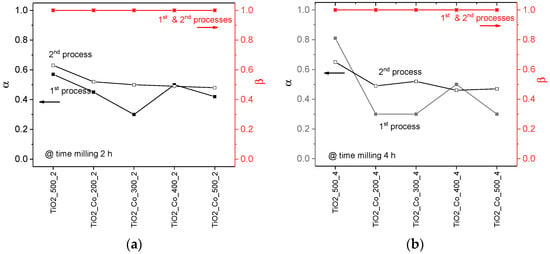
Figure 10.
Shape parameters, α and β, for all pure TiO2 and co-doped TiO2 samples for a time of milling of (a) 2 h and (b) 4 h, for relaxation processes 1 and 2.
According to the HN relaxation formula, if β = 1, the relaxation mechanism becomes a Cole–Cole model [28] (Equation (5)):
The efficient fitting of the data now allows us to extract fmax and τmax. In a manner to obtain the activation energy, the Arrhenius behavior equation can be used (Equation (6)):
Figure 11 shows the Arrhenius behavior for the 2 h non-doped and 5% co-doped samples for both the 1st (Figure 11a) and 2nd (Figure 11b) relaxation processes. The associated activation energies are summarized in Table 5. As displayed in Figure 11, the co-doped samples exhibit Ea well above the non-doped samples. Pure TiO2 1st and 2nd relaxation process energies could correspond to the polaron relaxations due to hopping motions of trapped electrons and/or holes, according to their low values of activation energy (from 10 to 100 meV), widely studied [12,30,31,32]. While for the co-doped sample, values go closer to one eV activation energy, indicating the displacement of ions such as oxygen vacancies or dipoles in oxides [14]. It is believed to be a Maxwell–Wagner relaxation, due to the importance of the extrinsic dielectric response in CP materials [12].
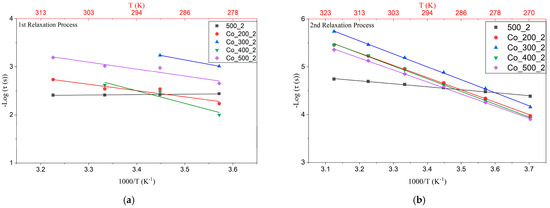
Figure 11.
Arrhenius plots of the two relaxations for non-doped samples and 5% co-doped TiO2 milled for 2 h: (a) 1st relaxation process (lower frequency region) and (b) 2nd relaxation process (higher frequency region).

Table 5.
Activation energy results for both undoped and 5% doped samples, using the frequency or the conductivity methods.
The spread of activation energy for the first relaxation (~0.26–0.92 eV) among doped samples is attributed to variations in grain-boundary barrier height within an IBLC framework, governed by (i) microstructure (grain size and grain boundary (GB) area/thickness, controlled by milling) and (ii) Mg-rich GB segregation, which increases GB resistivity and the effective barrier. In contrast, the second relaxation exhibits a narrower activation energy range (~0.50–0.57 eV), indicating a less chemistry-sensitive interfacial pathway. The anomalously low value for TiO2-Co-200-4 likely reflects partial overlap and limited temperature leverage for the first relaxation and is flagged as low confidence.
The frequency dependence of the conductivity was also measured to better understand the sample’s properties, as can be seen in Figure 12. The figure shows that the co-doped samples display lower conductivity compared to the non-doped rutile. It can also be seen that the samples milled with higher rpm present higher conductivity for the entire frequency range. Meanwhile, the co-doped sample with the highest conductivity, TiO2-Co-500-2, has the highest dielectric constant. This means that the polarization mechanism could be associated with the conductivity difference between grain and grain boundaries, as proposed by the IBLC model.
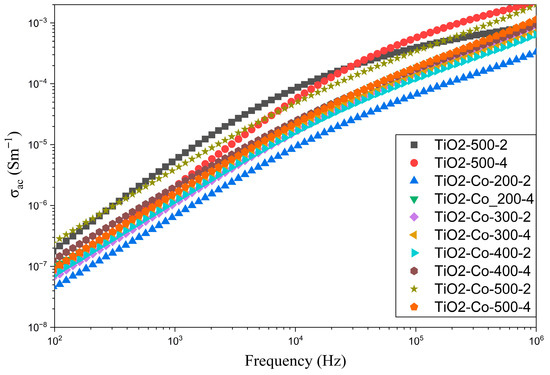
Figure 12.
Frequency dependence of the conductivity for non-doped (TiO2) and co-doped samples (5% co-doped TiO2).
The EIS smart tool was also employed to calculate the activation energy using the Arrhenius model. For this purpose, a linear fit was performed by plotting the natural logarithm of the conductivity as a function of 1000/T at 10 kHz, as shown in Figure 13. The temperature dependence of the ac conductivity can be described by an Arrhenius-type behavior:
where is the pre-exponential factor. By plotting versus 1000/T, the slope of the linear fit yields the activation energy, . This formalism is commonly applied in dielectric ceramics to clarify the dominant conduction mechanism [12,25]. The corresponding activation energies are summarized in Table 5.
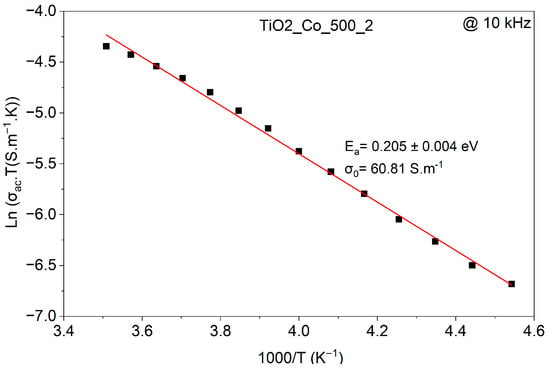
Figure 13.
Arrhenius plot of the ac conductivity for TiO2-Co-500-2.
The samples milled at the highest rpm display the highest dielectric constant and tangent loss, including TiO2-Co-500-2, while the lowest rpm induces the lowest values of dielectric constant and tangent loss, particularly TiO2-Co-200-2. Nevertheless, a good balance between these two properties is crucial to developing the best material for energy storage. In addition, the grain size was found to be higher at higher speeds, confirming that higher grain size provides higher dielectric constant values. On the other hand, samples with the lowest rpm, and so the smallest grains, obtain the lowest values of tangent loss. As discussed previously, magnesium could also be the origin of the reduction in dielectric losses, creating its own phase in the vicinity of TiO2 grain boundaries, as displayed by SEM images. Thus, it has been confirmed that ball-milling has a significant impact on sample morphology and that morphology has a crucial role in the dielectric properties. Despite the high dielectric constant observed for TiO2-Co-500-2, its dielectric properties remain significantly lower than those reported in other studies on co-doped rutile titanium dioxide [2,3,5,6,7,9,11,13,15], suggesting that the EPDD polarization mechanism could not be present. Nonetheless, to mitigate the high dielectric loss of the samples, the titanium ceramic powders could be incorporated into a polymer nanocomposite (PCN), thereby enabling the design of a flexible energy storage device (ESD).
Co-doping with 5% has been made in this work, but a deepening of the dopant concentration could also be important, according to the impact of the dopant on morphology and, consequently, the dielectric properties.
4. Conclusions
The dielectric properties of non-doped and co-doped rutile titanium dioxide were investigated. The first principal purpose was to influence the grain size using a planetary ball mill. Then, the deep relationship between morphology and dielectric properties has been studied. To further investigate their origin and the mechanism behind it, further analysis has been made on their electrical properties, notably the activation energy. The sample with the highest dielectric constant corresponds to the highest milling speed (TiO2-Co-500-2), while the sample with the lowest tangent loss corresponds to the lowest milling speed (TiO2-Co-200-2), with, respectively, the largest and smallest grain size. This work demonstrates the crucial role of the dopant and the morphology on the dielectric properties, potentially offering various ways to enhance the electrical properties of materials designed for energy storage applications.
Author Contributions
Conceptualization, S.S.T. and F.A.; methodology, S.S.T., F.A., and L.C.C.; software, L.F. and J.P.F.C.; validation, L.F., J.P.F.C., S.R.G., F.A., L.I.T., G.S., L.C.C., R.B., and S.S.T.; formal analysis, S.S.T. and L.C.C.; investigation, L.F., J.P.F.C., and S.S.T.; writing—original draft preparation, L.F., J.P.F.C., S.R.G., F.A., L.I.T., G.S., L.C.C., R.B., and S.S.T.; writing—review and editing, S.S.T., F.A., and L.C.C.; visualization, S.S.T. and L.C.C.; supervision, S.S.T. and R.B. All authors have read and agreed to the published version of the manuscript.
Funding
This research was funded by FCT—Fundação para a Ciência e a Tecnologia, I.P., in the scope of the projects LA/P/0037/2020, UIDP/50025/2020, and UIDB/50025/2020 of the Associate Laboratory Institute of Nanostructures, Nanomodelling, and Nanofabrication-i3N. J. P. F. Carvalho acknowledges the Fundação da Ciência e Tecnologia (FCT), Portugal, for the PhD Grant 2024.00842.BD.
Data Availability Statement
The original contributions presented in this study are included in the article. Further inquiries can be directed to the corresponding author.
Acknowledgments
The authors acknowledge the support of FCT—Fundação para a Ciência e a Tecnologia, I.P., in the scope of the projects LA/P/0037/2020, UIDP/50025/2020, and UIDB/50025/2020 of the Associate Laboratory Institute of Nanostructures, Nanomodelling, and Nanofabrication-i3N.
Conflicts of Interest
The authors declare no conflicts of interest.
References
- Diebold, U. The Surface Science of Titanium Dioxide. Surf. Sci. Rep. 2003, 48, 53–229. [Google Scholar] [CrossRef]
- Zhou, W.; Cao, M.; Wang, H.; Hao, H.; Yao, Z.; Liu, H. Defect Structure Design of TiO2 Ceramics with Colossal Permittivity by Doping with Ti Metal Powder. Ceram. Int. 2022, 48, 16723–16729. [Google Scholar] [CrossRef]
- Suchikova, Y.; Nazarovets, S.; Konuhova, M.; Popov, A.I. Binary Oxide Ceramics (TiO2, ZnO, Al2O3, SiO2, CeO2, Fe2O3, and WO3) for Solar Cell Applications: A Comparative and Bibliometric Analysis. Ceramics 2025, 8, 119. [Google Scholar] [CrossRef]
- Liang, X.; Yu, S.; Meng, B.; Wang, X.; Yang, C.; Shi, C.; Ding, J. Advanced TiO2-Based Photoelectrocatalysis: Material Modifications, Charge Dynamics, and Environmental–Energy Applications. Catalysts 2025, 15, 542. [Google Scholar] [CrossRef]
- Nachaithong, T.; Chanlek, N.; Moontragoon, P.; Thongbai, P. The Primary Origin of Excellent Dielectric Properties of (Co, Nb) Co-doped Tio2 Ceramics: Electron-pinned Defect Dipoles vs. Internal Barrier Layer Capacitor Effect. Molecules 2021, 26, 3230. [Google Scholar] [CrossRef]
- Zhao, L.; Wang, J.; Gai, Z.; Li, J.; Liu, J.; Wang, J.; Wang, C.; Wang, X. Annealing Effects on the Structural and Dielectric Properties of (Nb + In) Co-Doped Rutile TiO2 Ceramics. RSC Adv. 2019, 9, 8364–8368. [Google Scholar] [CrossRef]
- Tsuji, K.; Han, H.S.; Guillemet-Fritsch, S.; Randall, C.A. Dielectric Relaxation and Localized Electron Hopping in Colossal Dielectric (Nb,In)-Doped TiO2 Rutile Nanoceramics. Phys. Chem. Chem. Phys. 2017, 19, 8568–8574. [Google Scholar] [CrossRef]
- Mingmuang, Y.; Chanlek, N.; Moontragoon, P.; Srepusharawoot, P.; Thongbai, P. Effects of Sn4+ and Ta5+ Dopant Concentration on Dielectric and Electrical Properties of TiO2: Internal Barrier Layer Capacitor Effect. Results Phys. 2022, 42, 106029. [Google Scholar] [CrossRef]
- Li, Z.; Wu, J.; Xiao, D.; Zhu, J.; Wu, W. Colossal Permittivity in Titanium Dioxide Ceramics Modified by Tantalum and Trivalent Elements. Acta Mater. 2016, 103, 243–251. [Google Scholar] [CrossRef]
- Li, W.; Qiu, S.; Chen, N.; Du, G. Enhanced Dielectric Response in Mg-Doped CaCu3Ti4O12 Ceramics. J. Mater. Sci. Technol. 2010, 26, 682–686. [Google Scholar] [CrossRef]
- Hu, W.; Liu, Y.; Withers, R.L.; Frankcombe, T.J.; Norén, L.; Snashall, A.; Kitchin, M.; Smith, P.; Gong, B.; Chen, H.; et al. Electron-Pinned Defect-Dipoles for High-Performance Colossal Permittivity Materials. Nat. Mater. 2013, 12, 821–826. [Google Scholar] [CrossRef]
- Wang, C.; Zhang, N.; Li, Q.; Yu, Y.; Zhang, J.; Li, Y.; Wang, H. Dielectric Relaxations in Rutile TiO2. J. Am. Ceram. Soc. 2015, 98, 148–153. [Google Scholar] [CrossRef]
- Cheng, X.; Li, Z.; Wu, J. Colossal Permittivity in Ceramics of TiO2 Co-Doped with Niobium and Trivalent Cation. J. Mater. Chem. A Mater. 2015, 3, 5805–5810. [Google Scholar] [CrossRef]
- Ke, S.; Li, T.; Ye, M.; Lin, P.; Yuan, W.; Zeng, X.; Chen, L.; Huang, H. Origin of Colossal Dielectric Response in (In + Nb) Co-Doped TiO2 Rutile Ceramics: A Potential Electrothermal Material. Sci. Rep. 2017, 7, 10144. [Google Scholar] [CrossRef]
- Mckubre, M.; Macdonald, D.; Strømme, M. Impedance Spectroscopy: Theory, Experiment, and Applications, 3rd ed.; Wiley: Hoboken, NJ, USA, 2018. [Google Scholar]
- Yang, C.; Tse, M.Y.; Wei, X.; Hao, J. Colossal Permittivity of (Mg + Nb) Co-Doped TiO2 Ceramics with Low Dielectric Loss. J. Mater. Chem. C Mater. 2017, 5, 5170–5175. [Google Scholar] [CrossRef]
- El Mragui, A.; Logvina, Y.; da Silva, L.P.; Zegaoui, O.; da Silva, J.C.E. Synthesis of Fe-and Co-Doped TiO2 with Improved Photocatalytic Activity under Visible Irradiation toward Carbamazepine Degradation. Materials 2019, 12, 3874. [Google Scholar] [CrossRef]
- Khan, M.A.M.; Siwach, R.; Kumar, S.; Alhazaa, A.N. Role of Fe Doping in Tuning Photocatalytic and Photoelectrochemical Properties of TiO2 for Photodegradation of Methylene Blue. Opt. Laser Technol. 2019, 118, 170–178. [Google Scholar] [CrossRef]
- Wang, X.W.; Zheng, Y.P.; Liang, B.K.; Zhang, G.; Shi, Y.C.; Zhang, B.H.; Xue, L.L.; Shang, S.Y.; Shang, J.; Yin, S.Q.; et al. Preparation and Properties of La and Nb Co-Doped TiO2 Colossal Dielectric Ceramic Materials. J. Mater. Sci. Mater. Electron. 2020, 31, 16044–16052. [Google Scholar] [CrossRef]
- Patterson, E.A.; Kwon, S.; Huang, C.C.; Cann, D.P. Effects of ZrO2 Additions on the Dielectric Properties of CaCu3Ti4O12. Appl. Phys. Lett. 2005, 87, 182911. [Google Scholar] [CrossRef]
- Yu, M.; Sun, H.; Huang, X.; Yan, Y.; Zhang, W. In Situ-Formed and Low-Temperature-Deposited Nb:TiO2 Compact-Mesoporous Layer for Hysteresis-Less Perovskite Solar Cells with High Performance. Nanoscale Res. Lett. 2020, 15, 135. [Google Scholar] [CrossRef]
- Xu, Y.; Wu, S.; Wan, P.; Sun, J.; Hood, Z.D. Introducing Ti3+ Defects Based on Lattice Distortion for Enhanced Visible Light Photoreactivity in TiO2 Microspheres. RSC Adv. 2017, 7, 32461–32467. [Google Scholar] [CrossRef]
- Wang, Y.; Qiu, C.; Xie, Y.; Wang, L.; Ding, J.; Zhang, J.; Wan, H.; Guan, G. Intentionally Introducing Oxygen Vacancies and Ti3+ Defects on the Surface of Bi4Ti3O12 Nanosheets for Promoting the Photoreduction of CO2 to CH3OH. ACS Appl. Nano Mater. 2024, 7, 3012–3023. [Google Scholar] [CrossRef]
- Xu, W.; Russo, P.A.; Schultz, T.; Koch, N.; Pinna, N. Niobium-Doped Titanium Dioxide with High Dopant Contents for Enhanced Lithium-Ion Storage. ChemElectroChem 2020, 7, 4016–4023. [Google Scholar] [CrossRef]
- Moulder, J.F.; Stickle, W.F.; Sobol, P.E.; Bomben, K.D. Handbook of X-Ray Photoelectron Spectroscopy; Perkin-Elmer Corporation Physical Electronics Division: Norwalk, CT, USA, 1995. [Google Scholar]
- Tsyganov, A.; Morozova, N.; Vikulova, M.; Asmolova, A.; Zotov, I.; Bainyashev, A.; Gorokhovsky, A.; Gorshkov, N. Thermal Behavior of La3+, Ni2+ and Sn4+ Co-Doped CaCu3Ti4O12 Ceramics Dielectric Response. Inorg. Chem. Commun. 2024, 160, 111914. [Google Scholar] [CrossRef]
- Tsyganov, A.; Morozova, N.; Vikulova, M.; Asmolova, A.; Artyukhov, D.; Zotov, I.; Gorokhovsky, A.; Gorshkov, N. The Effect of Lithium Doping on the Dielectric Properties of Solid Solutions LixCa(1−x)Cu3Ti4O12 (x = 0.01–0.1). J. Compos. Sci. 2023, 7, 282. [Google Scholar] [CrossRef]
- Havriliak, S.; Negami, S. A Complex Plane Representation of Electronical and Mechanical Relaxation. Polymer 1967, 8, 161–210. [Google Scholar] [CrossRef]
- Melo, B.; Loureiro, F.J.; Fagg, D.P.; Costa, L.; Graça, M. DFRTtoEIS An Easy Approach to Verify the Consistency of a DFRT Generated from an Impedance Spectrum. Electrochim. Acta 2021, 366, 137429. [Google Scholar] [CrossRef]
- Maglione, M.; Vikhnin, S.; Liu Springer, G.K. Polarons, Free Charge Localisation and Effective Dielectric Permittivity in Oxides. arXiv 2010, arXiv:1006.3719. [Google Scholar] [CrossRef]
- Deskins, N.A.; Dupuis, M. Electron Transport via Polaron Hopping in Bulk TiO2: A Density Functional Theory Characterization. Phys. Rev. B Condens. Matter Mater. Phys. 2007, 75, 195212. [Google Scholar] [CrossRef]
- Yagi, E.; Hasiguti, R.R.; Aono, M. Electronic Conduction above 4 K of Slightly Reduced Oxygen-Deficient Rutile TiO2−x. Phys. Rev. B Condens. Matter 1996, 54, 7945–7956. [Google Scholar] [CrossRef]
Disclaimer/Publisher’s Note: The statements, opinions and data contained in all publications are solely those of the individual author(s) and contributor(s) and not of MDPI and/or the editor(s). MDPI and/or the editor(s) disclaim responsibility for any injury to people or property resulting from any ideas, methods, instructions or products referred to in the content. |
© 2025 by the authors. Licensee MDPI, Basel, Switzerland. This article is an open access article distributed under the terms and conditions of the Creative Commons Attribution (CC BY) license (https://creativecommons.org/licenses/by/4.0/).