Different methods have been reported to produce CaCO
3 particles [
3,
8,
12,
13,
14,
15,
16,
17,
18,
19]. The precipitation method via the mixing of soluble Ca
2+ salts and CO
32−/HCO
3− salts is effective, fast, and can be easily scaled up. However, to fabricate the metastable vaterite CaCO
3 particles, dilute concentrations, low temperature, short reaction time, and the addition of additives (e.g., alcohols, diols, surfactants, polymers) have been utilized in the synthesis. However, the challenge in preparing nanosized vaterite particles with tuneable morphology and porosity remains. Ethylene (EG) is one of the mostly used additives because it is readily available, miscible in water, and can be easily used to prepare salt solutions [
3,
8,
12,
14]. In this study, we have systematically investigated different reaction parameters, with EG as the additive. This allowed the optimization of reaction conditions for the preparation of small porous vaterite nanoparticles with adjustable surface area and pore size, which were then used as carrier for the uploading and release of curcumin.
3.1. Synthesis of CaCO3 Particles with Varying Contents of EG
The reactions were first carried out between Na
2CO
3 and CaCl
2 with a concentration of 0.5 M and EG concentrations of 0, 15, 50, and 85
v/
v%.
Figure 1 presents the SEM images of CaCO
3 particles formed under different concentrations of EG. These images demonstrate a morphology change of cubic particles to spherical particles, when the concentration of EG was increased from 0
v/
v% to 85
v/
v%.
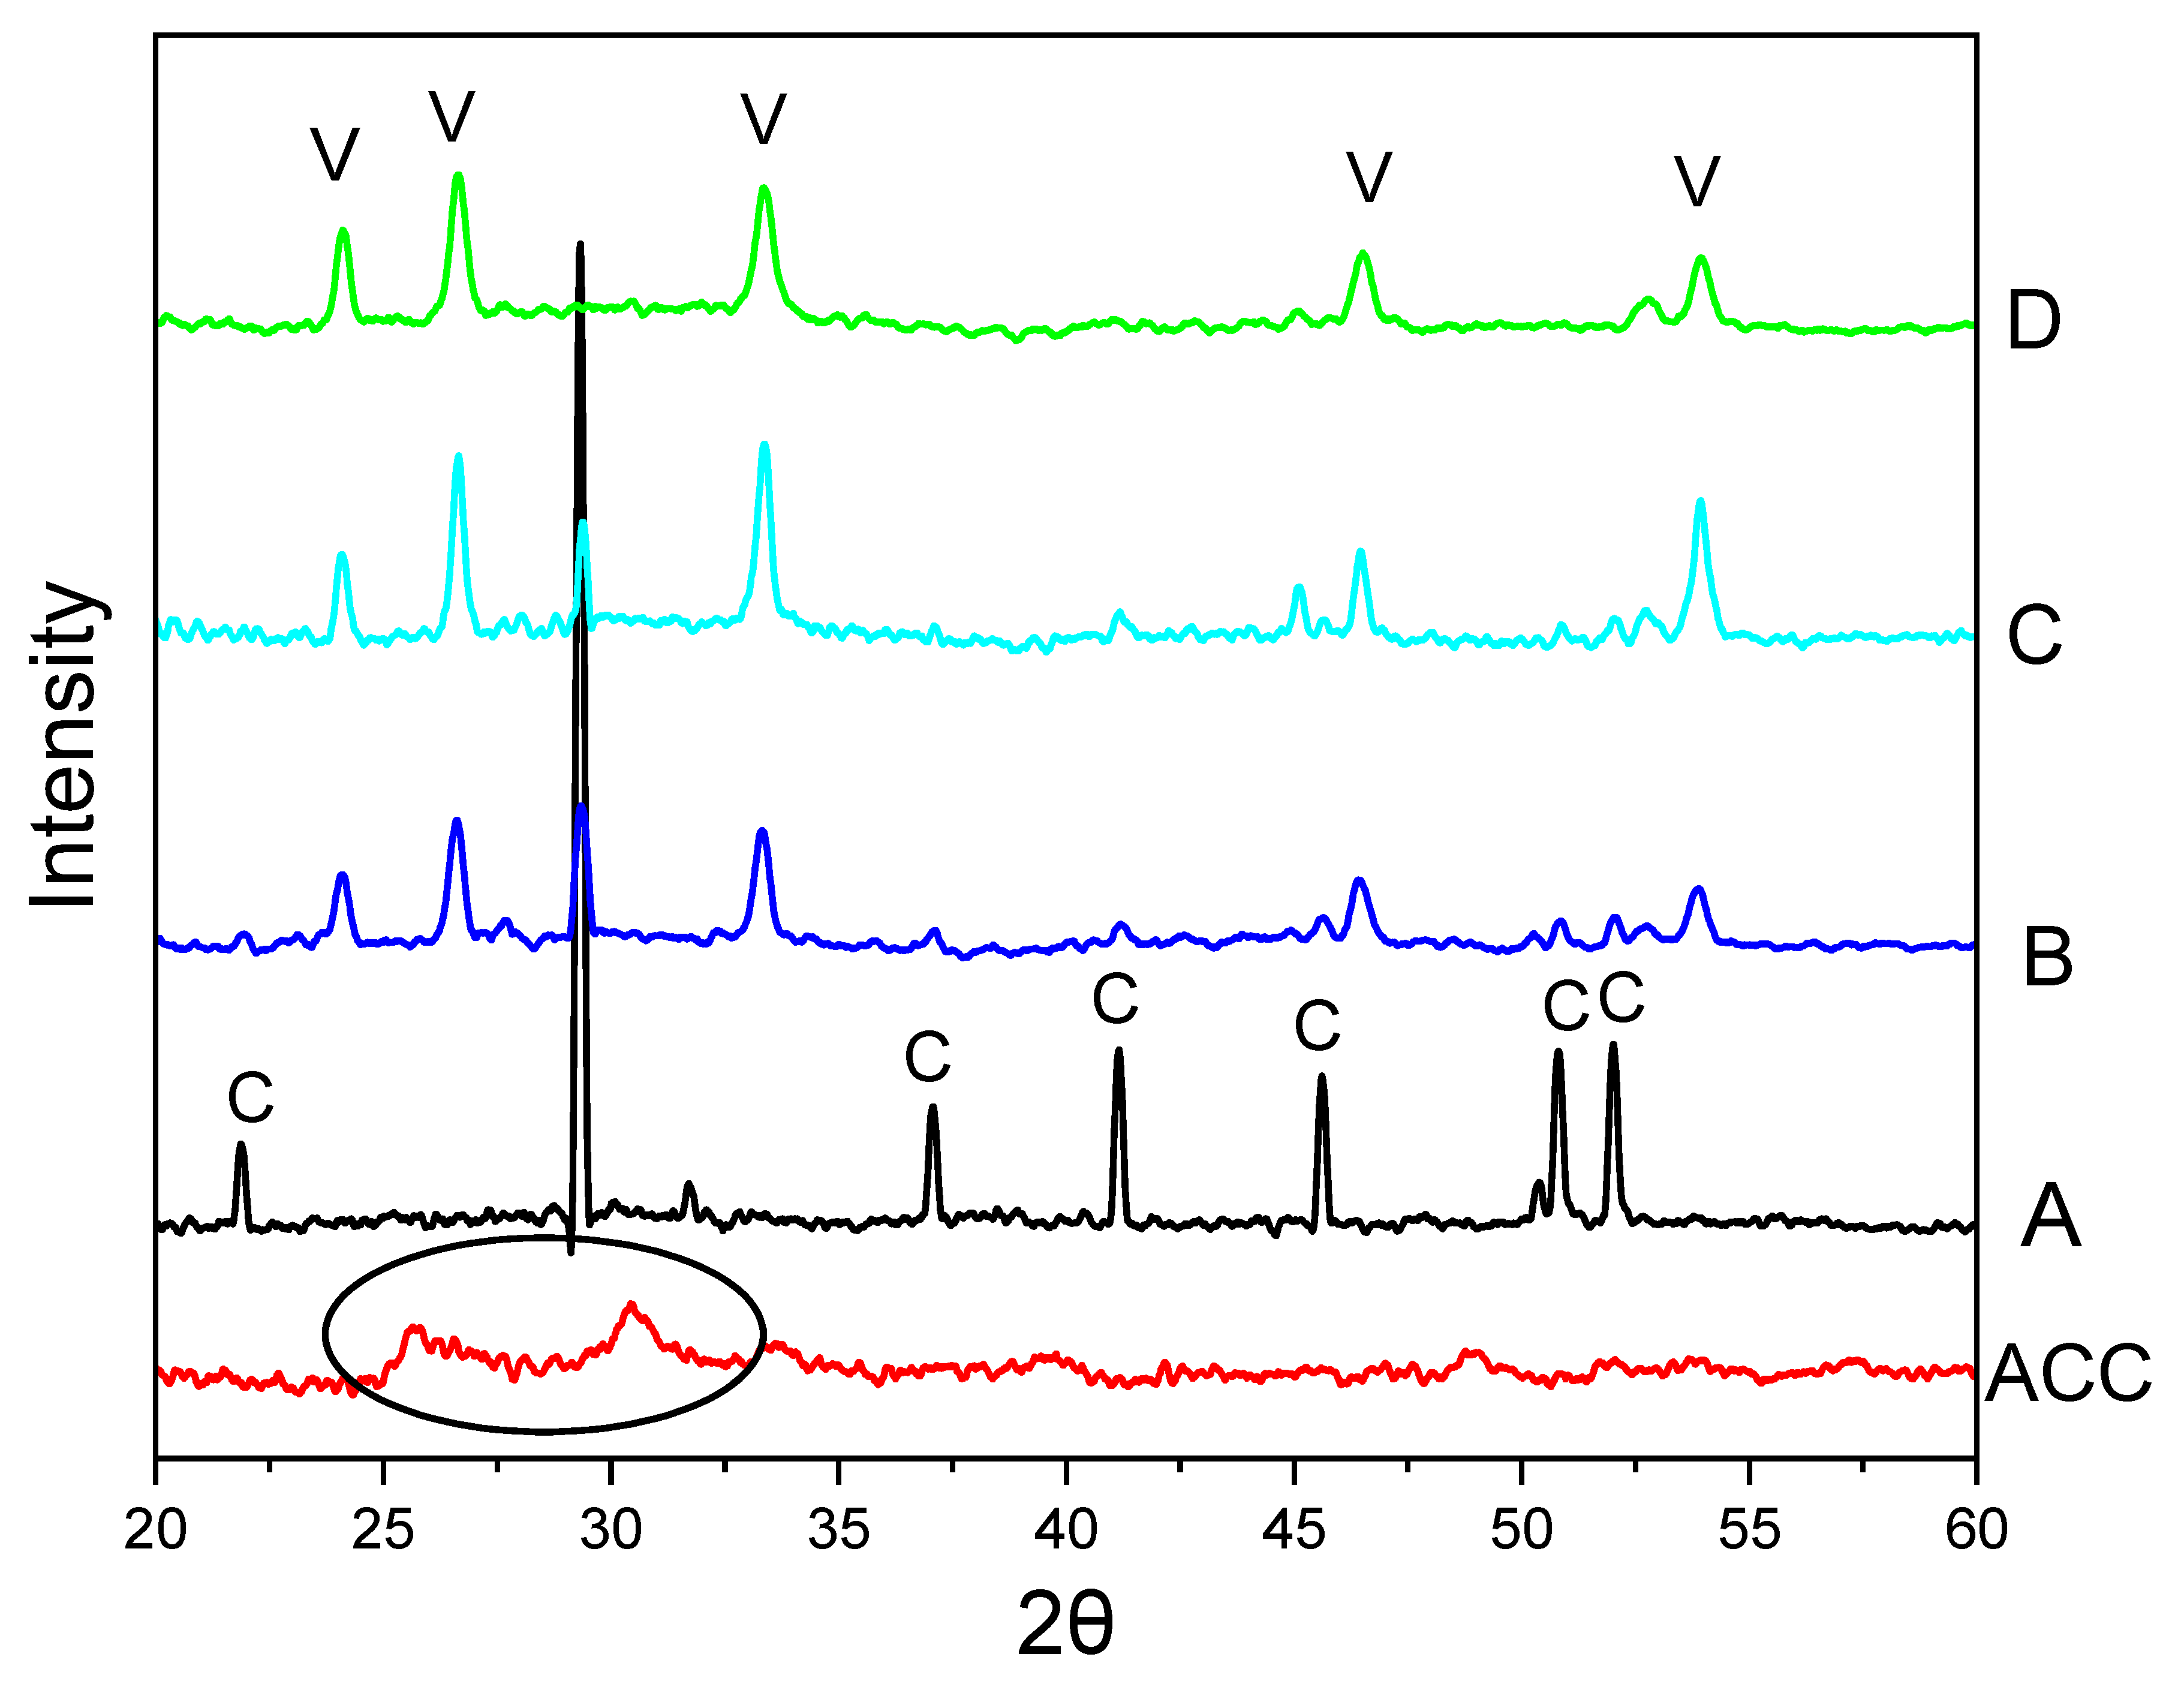
Figure 2 shows the PXRD patterns of CaCO
3 particles, illustrating a crystalline phase change of calcite, mixture of calcite and vaterite, and vaterite particles. In
Figure 1A and
Figure 2A, there was no EG involved in the reaction (sample S1,
Table 1), only calcite particles were formed. However, upon the addition of EG (15
v/
v%, 50
v/
v%, 85
v/
v%), vaterite particles began to appear and then dominate in the precipitates (
Figure 1B–D and
Figure 2B–D). Indeed, when the EG concentration reached 85
v/
v%, no calcite was observed, and no calcite peaks appeared in the PXRD diffractogram. This indicates that at this concentration, the ratio of water to EG is optimal for promoting and maintaining vaterite formation.
The initially precipitated slush was also characterized by PXRD. It exhibited no sharp peaks in the PXRD diffractogram, indicating a lack of crystalline structure and confirming the formation of amorphous calcium carbonate (ACC) (circled in the diffractogram for ACC in
Figure 2). The PXRD pattern in
Figure 2A reveals peaks at 2θ values of 21.90°, 29.31°, 37.06°, 41.16°, 45.68°, 50.83°, and 52.04°, corresponding to the crystallographic planes (012), (104), (110), (013), (202), (018), and (116). These peaks confirm that the CaCO
3 particles are calcite. The peak at 29.31°, corresponding to the (104) crystallographic plane, is the main peak for calcite. In contrast, the PXRD diffractogram for
Figure 2D shows diffraction angle 2θ at 24.10°, 26.69°, 33.32°, 46.56°, and 53.9°, corresponding to the crystallographic planes (100), (101), (102), (110), (104), and (202), indicating that the particles formed are vaterite [
5,
6,
24]. With the introduction of EG for the synthesis of the sample shown in
Figure 2B, the intensity of the calcite peak at 29.3° reduces while vaterite peaks intensity start to appear and increase (
Figure 2C).
The polymorphs of CaCO
3 particles can also be confirmed by FTIR analysis [
24,
25]. In general, the FTIR spectra of CaCO
3 exhibit four absorption bands corresponding to carbonate ions, which has different vibrations modes: symmetric stretching (ν
1), out-of-plane bending (ν
2), doubly degenerate asymmetric stretching (ν
3), and doubly degenerate in-plane bending (ν
4) [
25]. In
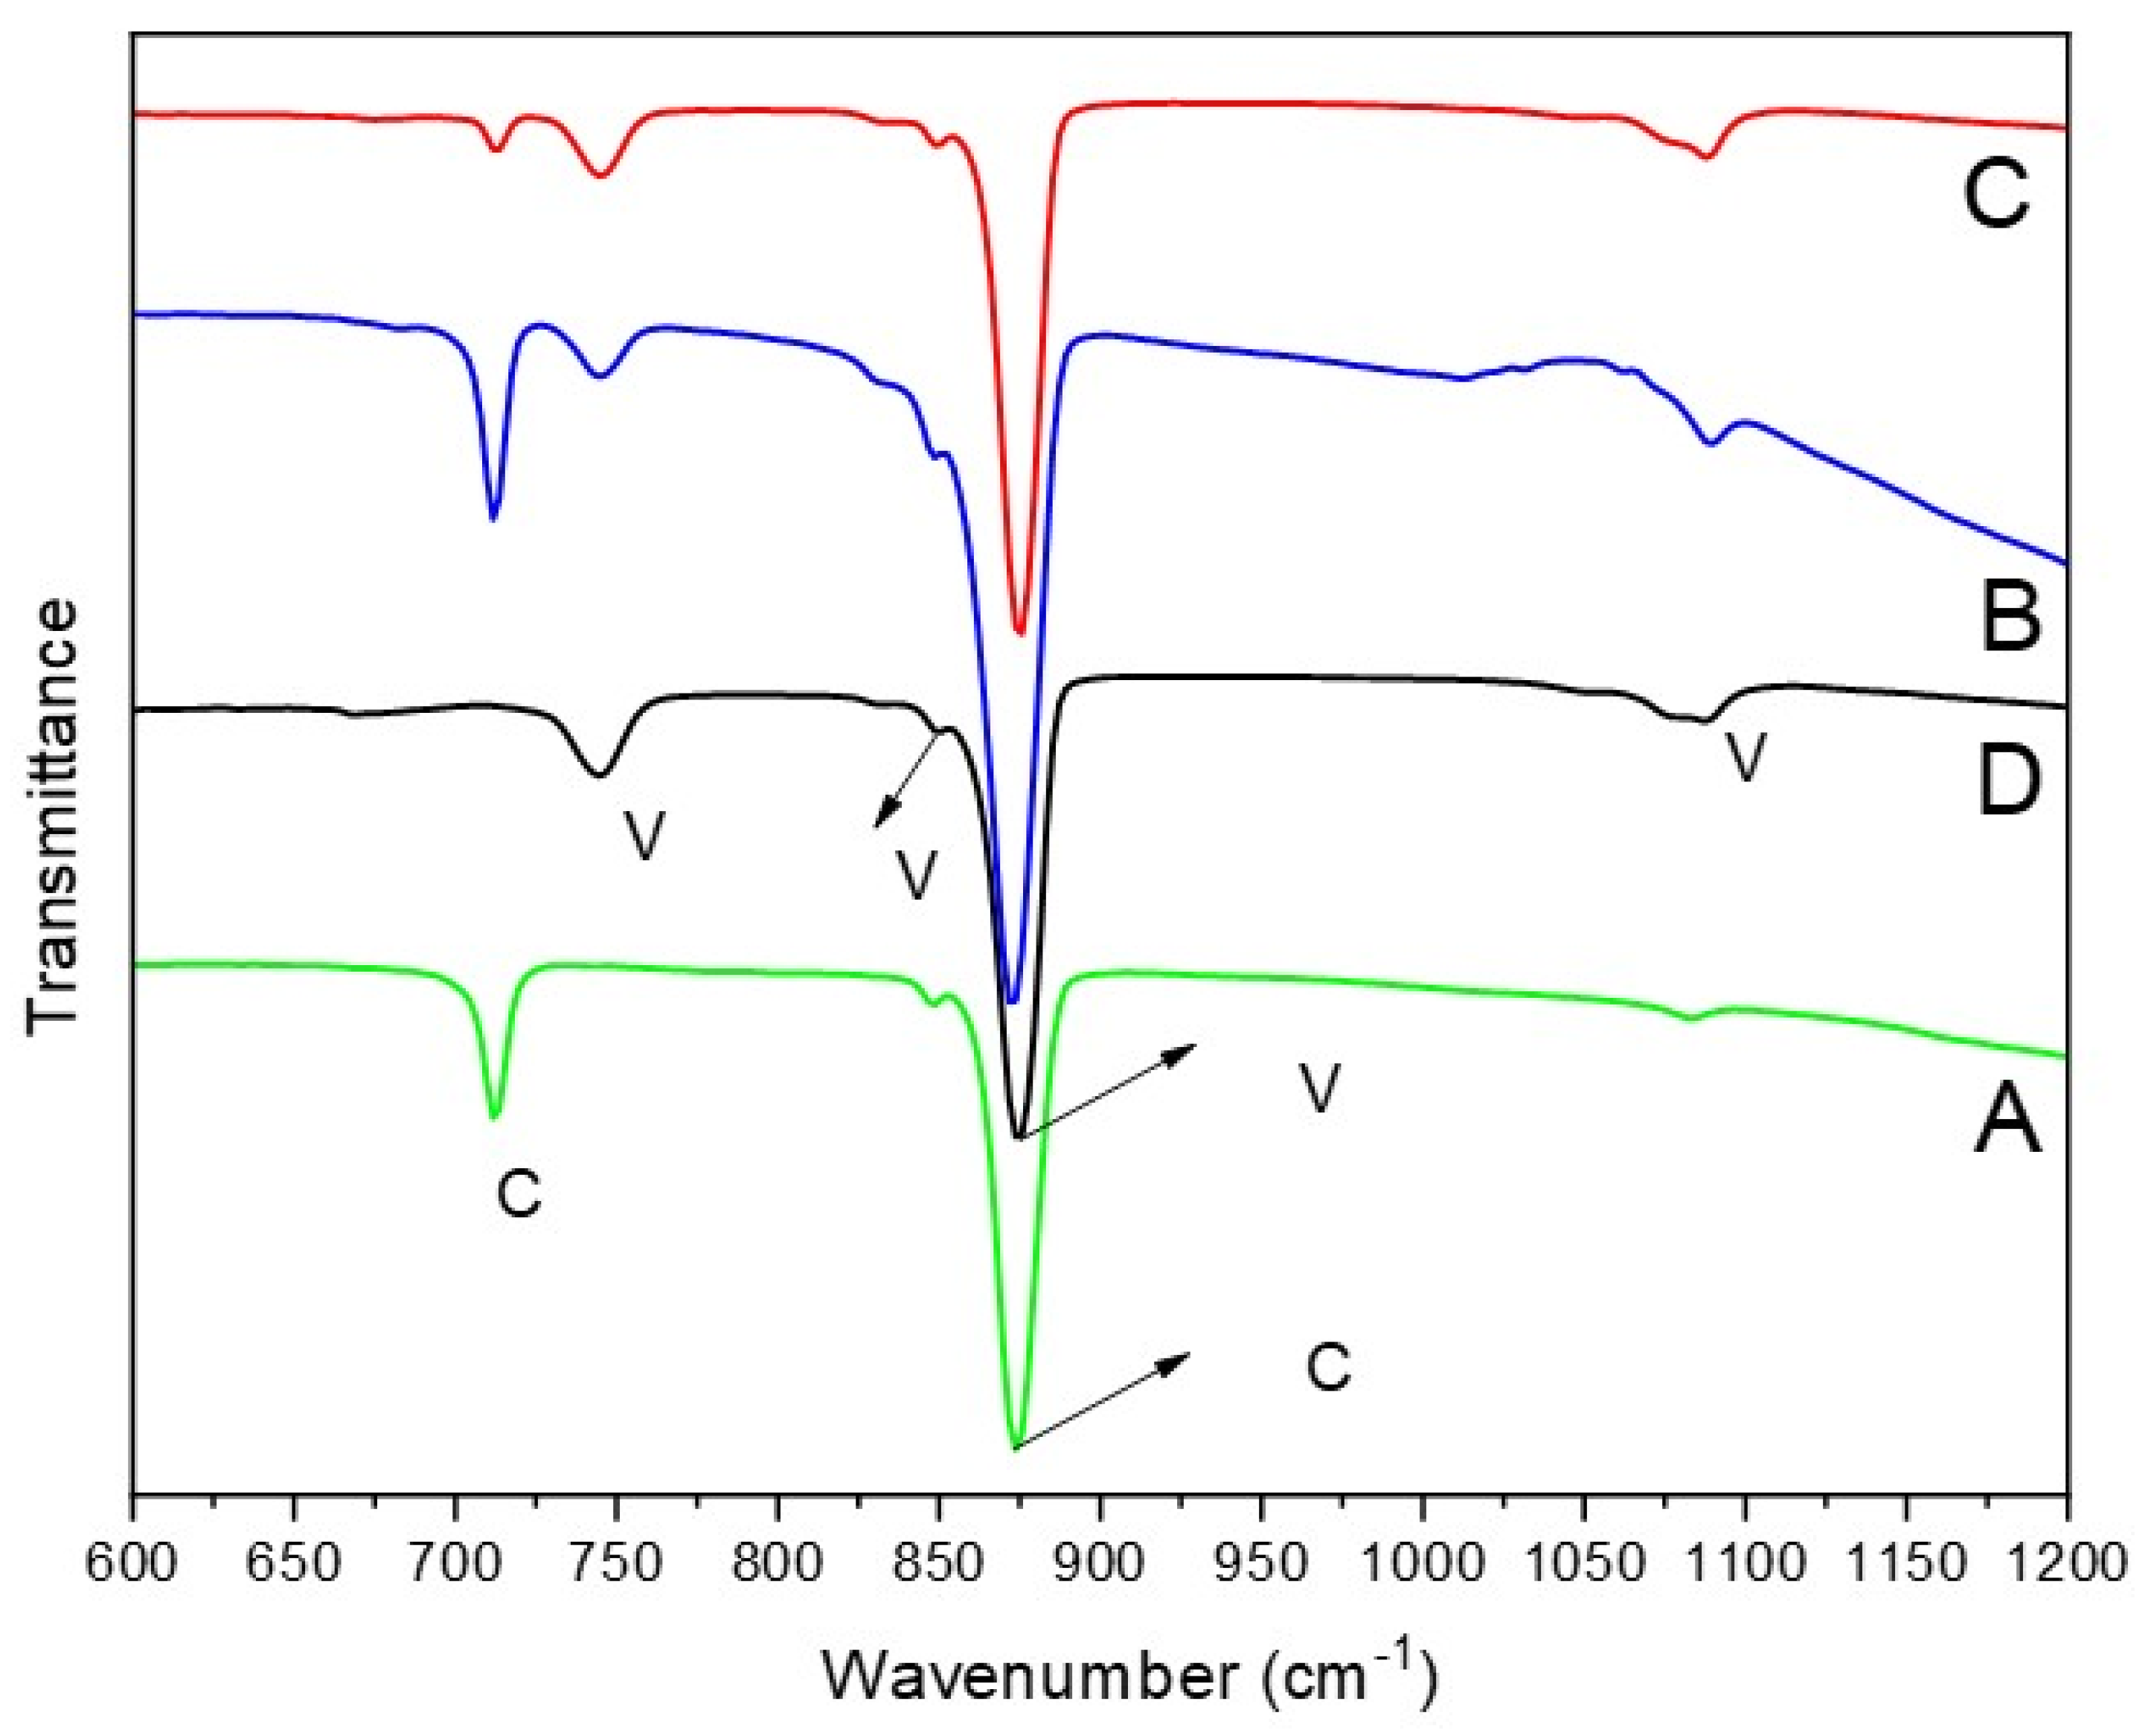
Figure 3, the FTIR results indicate that two strong peaks are observed in the synthesized calcite particles (
Figure 3A), appearing at 712 cm
−1 (in-plane (ν
4)) and 876 cm
−1 (out-of-plane(ν
2)). In comparison, as shown in
Figure 3D, the FTIR peaks of vaterite are detected at 745 cm
−1 (an in-plane bending ν
4), 849 cm
−1, 877 cm
−1 (out-of-plane bending ν
2), and 1088 cm
−1 (a symmetric carbonate stretching band ν
1). Notably, an overlapping absorption peak of vaterite and calcite is out-of-plane bending (ν
2) vibrational, which also exists in aragonite and was recorded in the 876–877 cm
−1 range in this study. For the samples in
Figure 3B,C, the FTIR spectra show peaks corresponding to both calcite and vaterite, indicating a mixture of both polymorphs. Particularly, the FTIR spectrum in
Figure 3B exhibits a higher intensity at 712 cm
−1, which corresponds to the calcite abdorption band, suggesting a greater amount of calcite in the sample. This observation is consistent with the findings in
Figure 1 and
Figure 2.
The phase transformation of calcium carbonate (CaCO
3) from the amorphous state to crystalline calcite state was studied via optical microscopy.
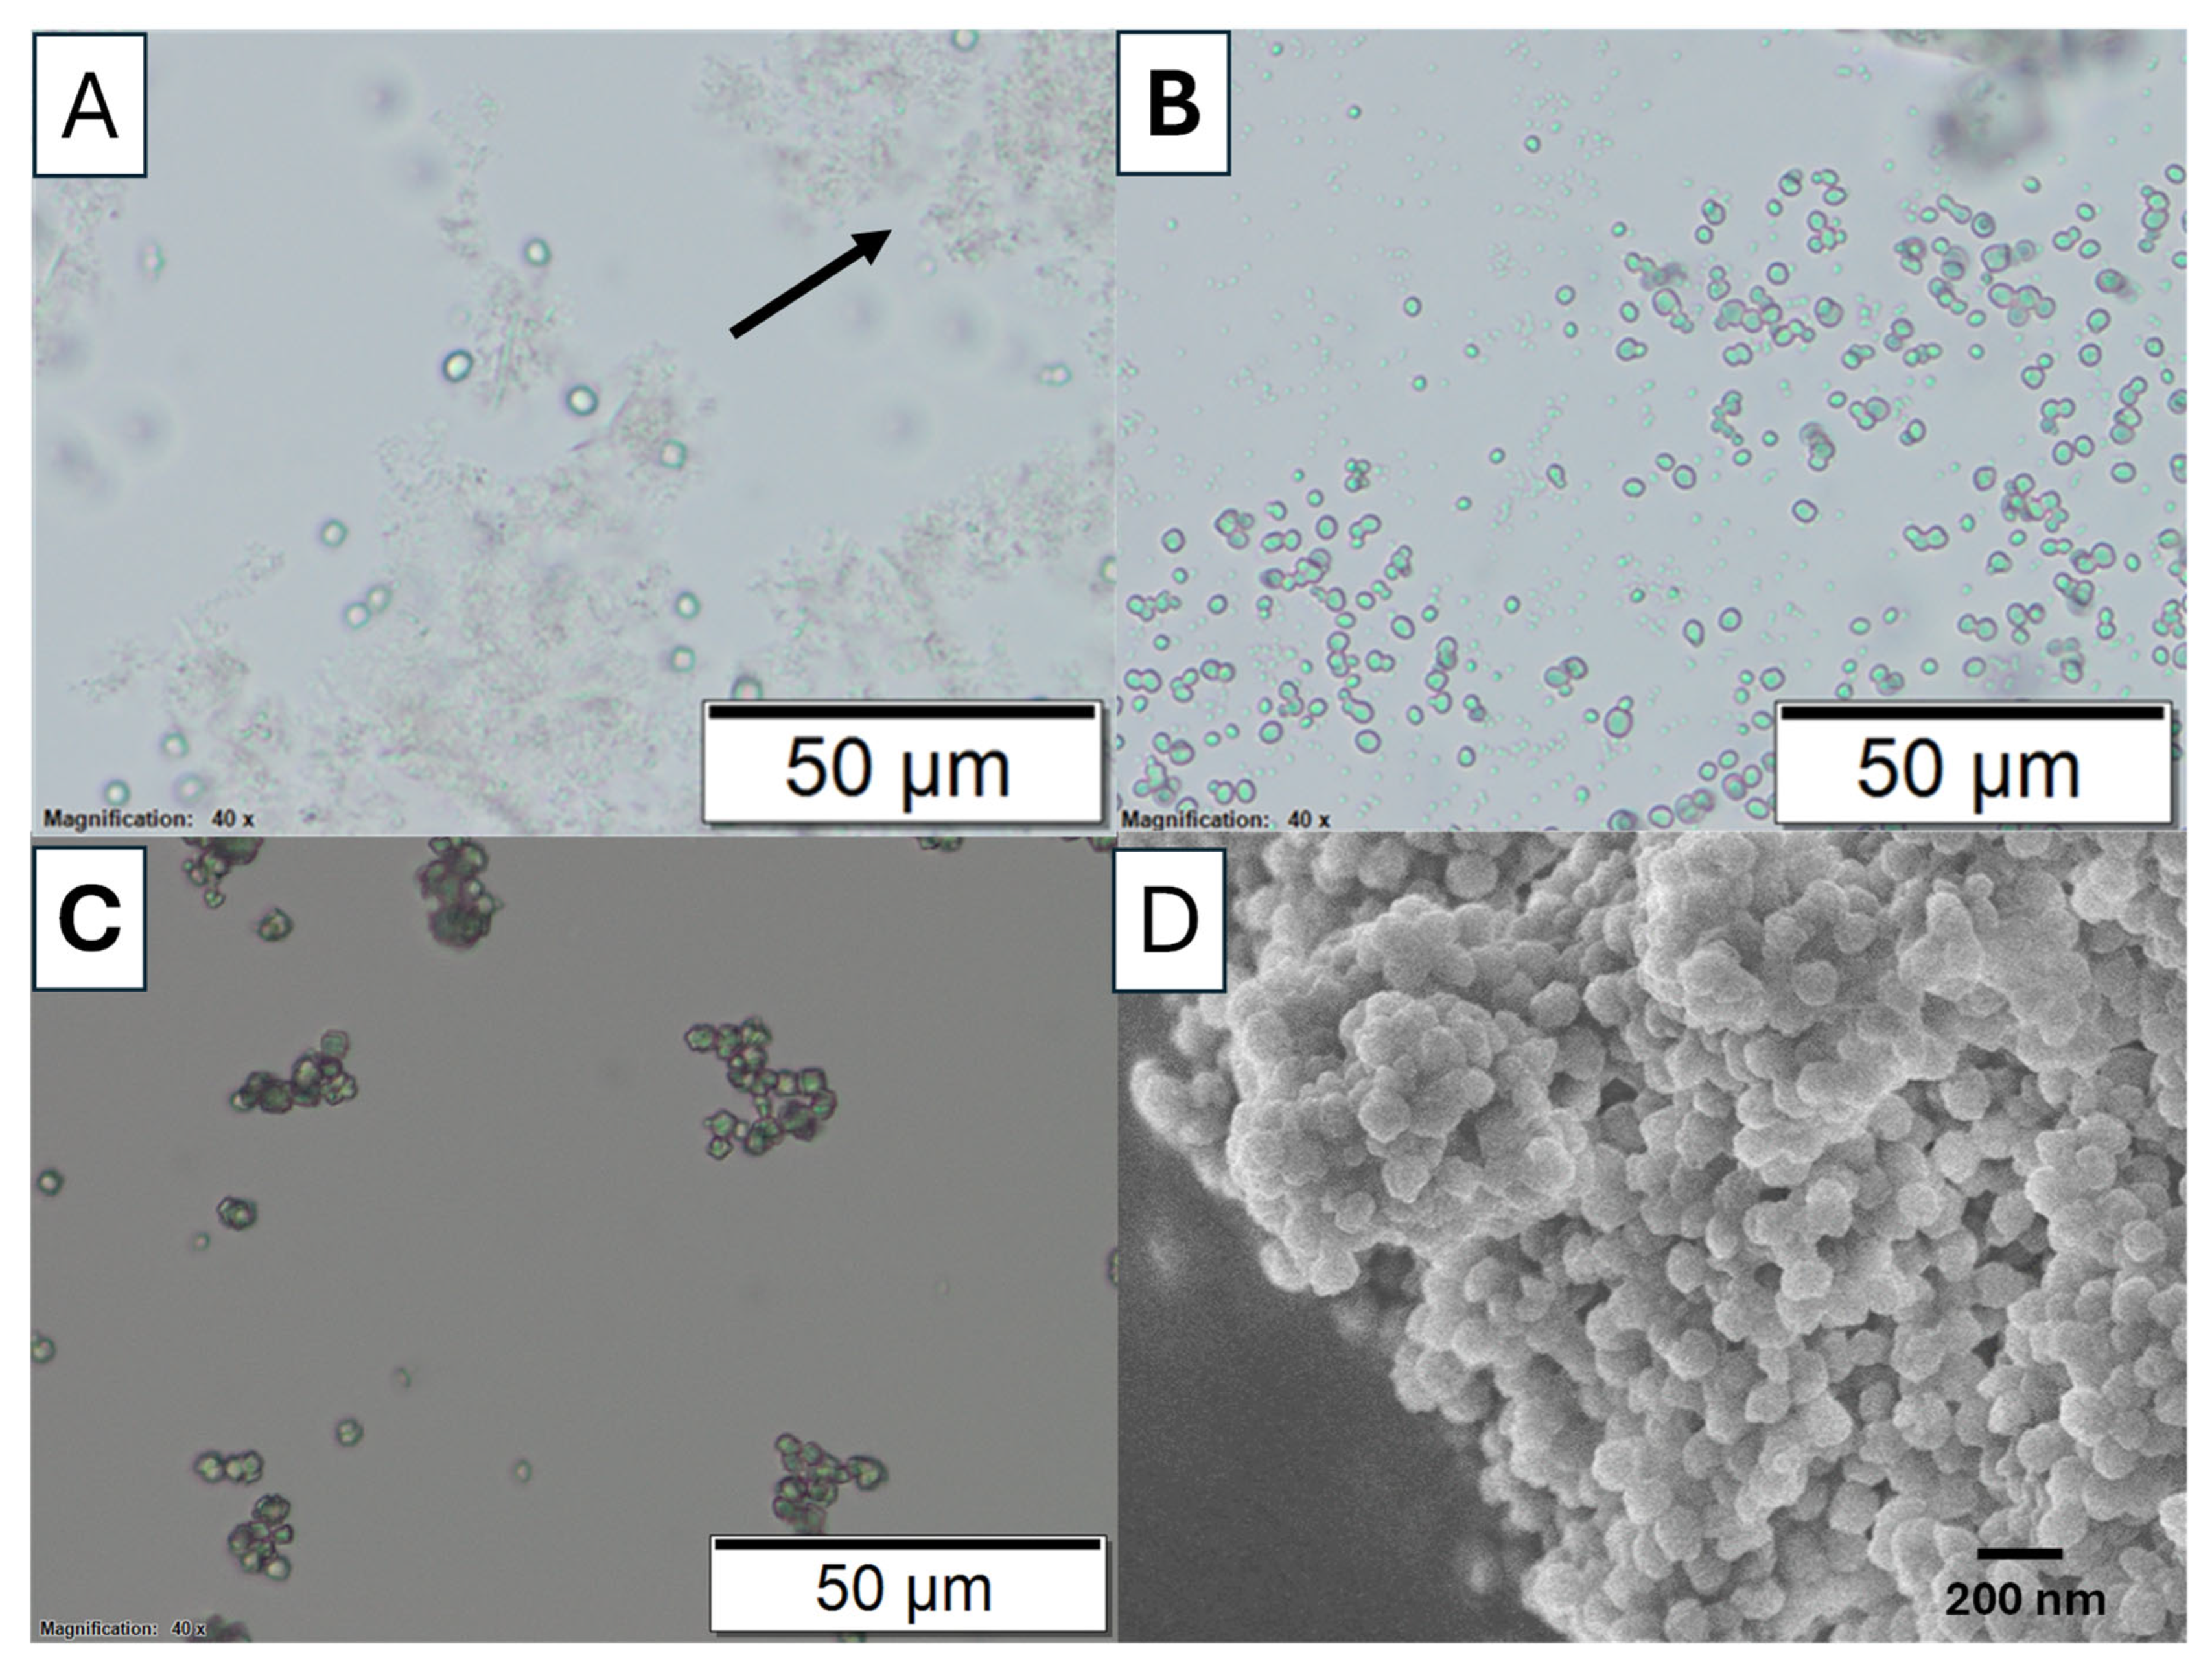
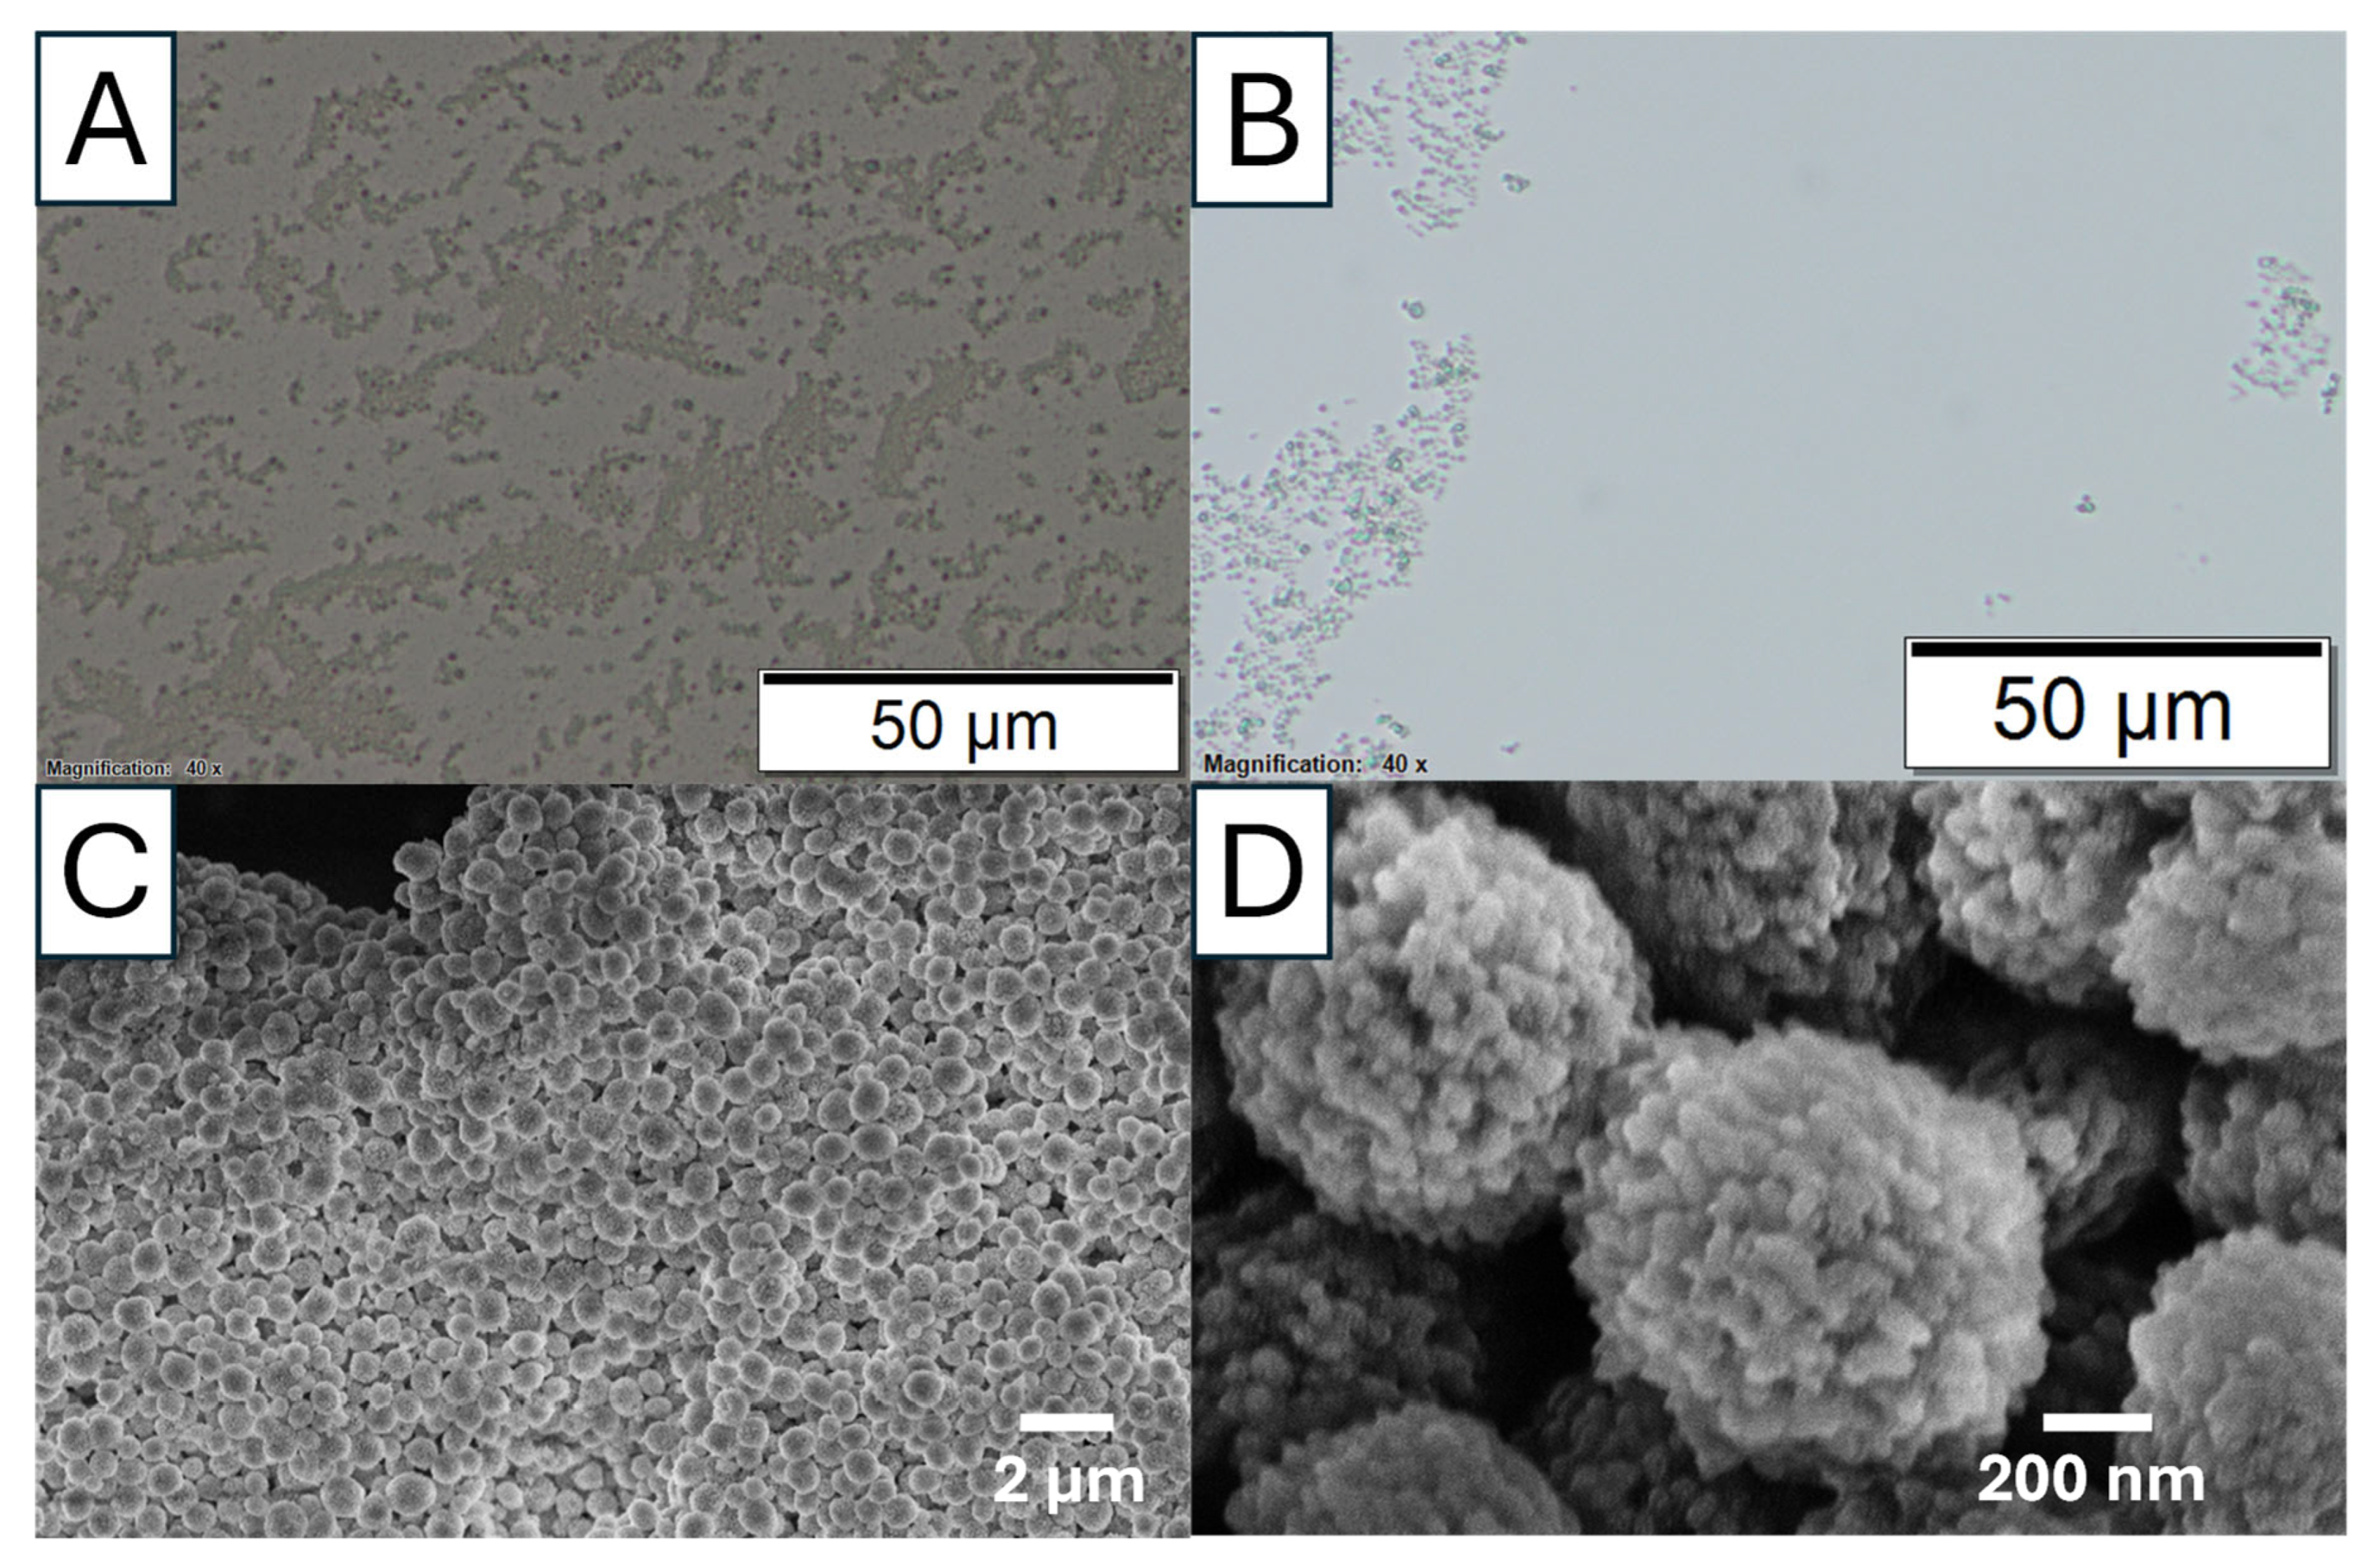
Figure 4 shows the optical microscopic images of this transformation when the reaction was carried out in an ice bath (to slow down the reaction) without EG added. After mixing calcium ions (Ca
2+) and carbonate ions (CO
32−), the transition from an ACC phase to a crystalline phase was observed at different time points of 1, 10, and 60 min.
Figure 4A shows only a few nuclei are visible after 1 min. Most of the observed particles appear to be a gel-slushie state. At this stage, the precipitation process is dominated by the formation of ACC. ACC is an unstable, highly hydrated polymorph that lacks the defined crystalline structure which normally transforms into the other polymorph within serval minutes [
26]. According to Konrad et al., ACC begins to dissolve when the humidity reaches a certain level. As ACC starts to dehydrate, the released water increases the surrounding moisture, leading to its dissolution and followed by recrystallization [
27].
At 10 min, as shown
Figure 4B, more crystals are formed, indicating the ongoing transformation of ACC into a more stable crystalline phase. No significant ACC slush was observed. For the reaction at 60 min, barely any other phases are visible under an optical microscope, and the particle sizes appear to be more uniform (
Figure 4C). This suggests that most likely all the ACC has converted into a single crystalline phase. The uniform particle size indicates a reduction in nucleation as the dehydrated ACC is consumed. With fewer new nuclei forming, crystal growth becomes more prominent, leading to the growth of larger calcite crystals. The uniformity in particle size at this stage can be attributed to Ostwald ripening, a process in which smaller particles dissolve and redeposit onto larger calcite crystals, promoting their growth. FTIR spectra further confirm that most of the particles in
Figure 4B,C are calcite (
Figure S1). The morphology of the amorphous calcium carbonate collected after 5 min in the reaction is revealed by SEM in
Figure 4D, which shows agglomerated spherical particles and are distinctly different from the calcite particles.
It is clear that the formation of vaterite particles is a result of increasing concentrations of EG in the reaction system. The hydroxyl groups offered by EG could play an important role in vaterite formation. EG could act as either a co-surfactant or a co-solvent depending on the concentration in the reaction system. At low concentrations, EG functions as a co-surfactant with the negative charge presented by the hydroxyl groups. After the initial formation of vaterite nuclei, EG molecules are attracted to the vaterite nuclei. The negative charge of these hydroxyl groups could prevent the transformation of vaterite into calcite [
7]. Additionally, the presence of hydroxyl groups alters the surface charge of vaterite, making it more thermodynamically stable compared to calcite in the system [
12]. This impact is enhanced with the increasing concentration of EG. At higher concentrations of EG, the abundance of hydroxyl groups and free Ca
2+ ions favor the nucleation of vaterite. Calcium precursor salts dissolve in both water and EG, whereas carbonates primarily dissolve in water. As the concentration of EG increases, the solubility of carbonate salts decreases [
12]. As a result, the supersaturation of carbonate salts is higher than that of calcium ions, further promoting vaterite formation. The concentration of Ca
2+ could influence CaCO
3 growth. It was reported that the increased concentration of Ca
2+ led to the reduced particle size [
28]. As a result, EG can act as both a stabilizer, preventing the transformation of vaterite into other polymorphs, and a promoter, enhancing vaterite formation. Therefore, as the concentration of EG increases, vaterite particles are produced, whereas calcite dominates the formation in the absence of EG.
Another effect from the addtive is the viscosity of the reaction system, thereby altering nucleation and growth rates [
29]. The viscosity of the reaction system affects the diffusion velocity of ions, with the crystallization speed being determined by the diffusion rate of Ca
2+. An earlier study confirmed that an increase in reaction viscosity contributed to higher diffusion resistance to ions [
30]. Higher viscosity inhibits particle growth, causing the nucleation process to dominate. In the presence of EG, the reaction viscosity increases. It is worth noting that the viscosity of polyols is dictated by the number of hydroxyl groups forming hydrogen bonds. The reduced diffusion velocity of Ca
2+ and CO
32− ions could slow nucleation and crystal growth, leading to the formation of smaller crystal [
31]. This trend can be observed in
Figure 1.
The presence of EG could also impact the supersaturation of the reaction [
12]. The supersaturation increases when the concentration of EG in the reaction increases. The supersaturation of the reaction solution is a key factor in the control of the crystallization because it affects the nucleation and growth of the crystal. The supersaturation ratio S can be defined by this equation [
29]:
where [Ca
2+] and [CO
32−] represent the concentrations of calcium and carbonate ions, respectively, and K
sp is the solubility product constant of calcium carbonate. When S < 1, the solution is unsaturated. The solution reaches equilibrium when S = 1. When S > 1, calcium carbonate starts to precipitate to restore equilibrium in the solution, which is thermodynamicallly favoured. Increasing supersaturation subsequently influences the size of the primary stucture of the vaterite [
4,
31,
32]. High supersaturation favours the nucleation of the calcium carbonate crystals, leading to smaller individual crystallites as observered when the concentration of the EG was increased. This reduction in crystallite size is attributed to calcium ions associating with the polar -OH groups in EG, which increases the local supersaturation, providing more nucleation sites in the system [
24]. Crystals grow faster at a low supersaturation, however, crystal nucleation domionates the growth of the crystal at high supersaturation, leading to smaller primary nanoparticles which agglomerate to form the vaterite particles [
31].
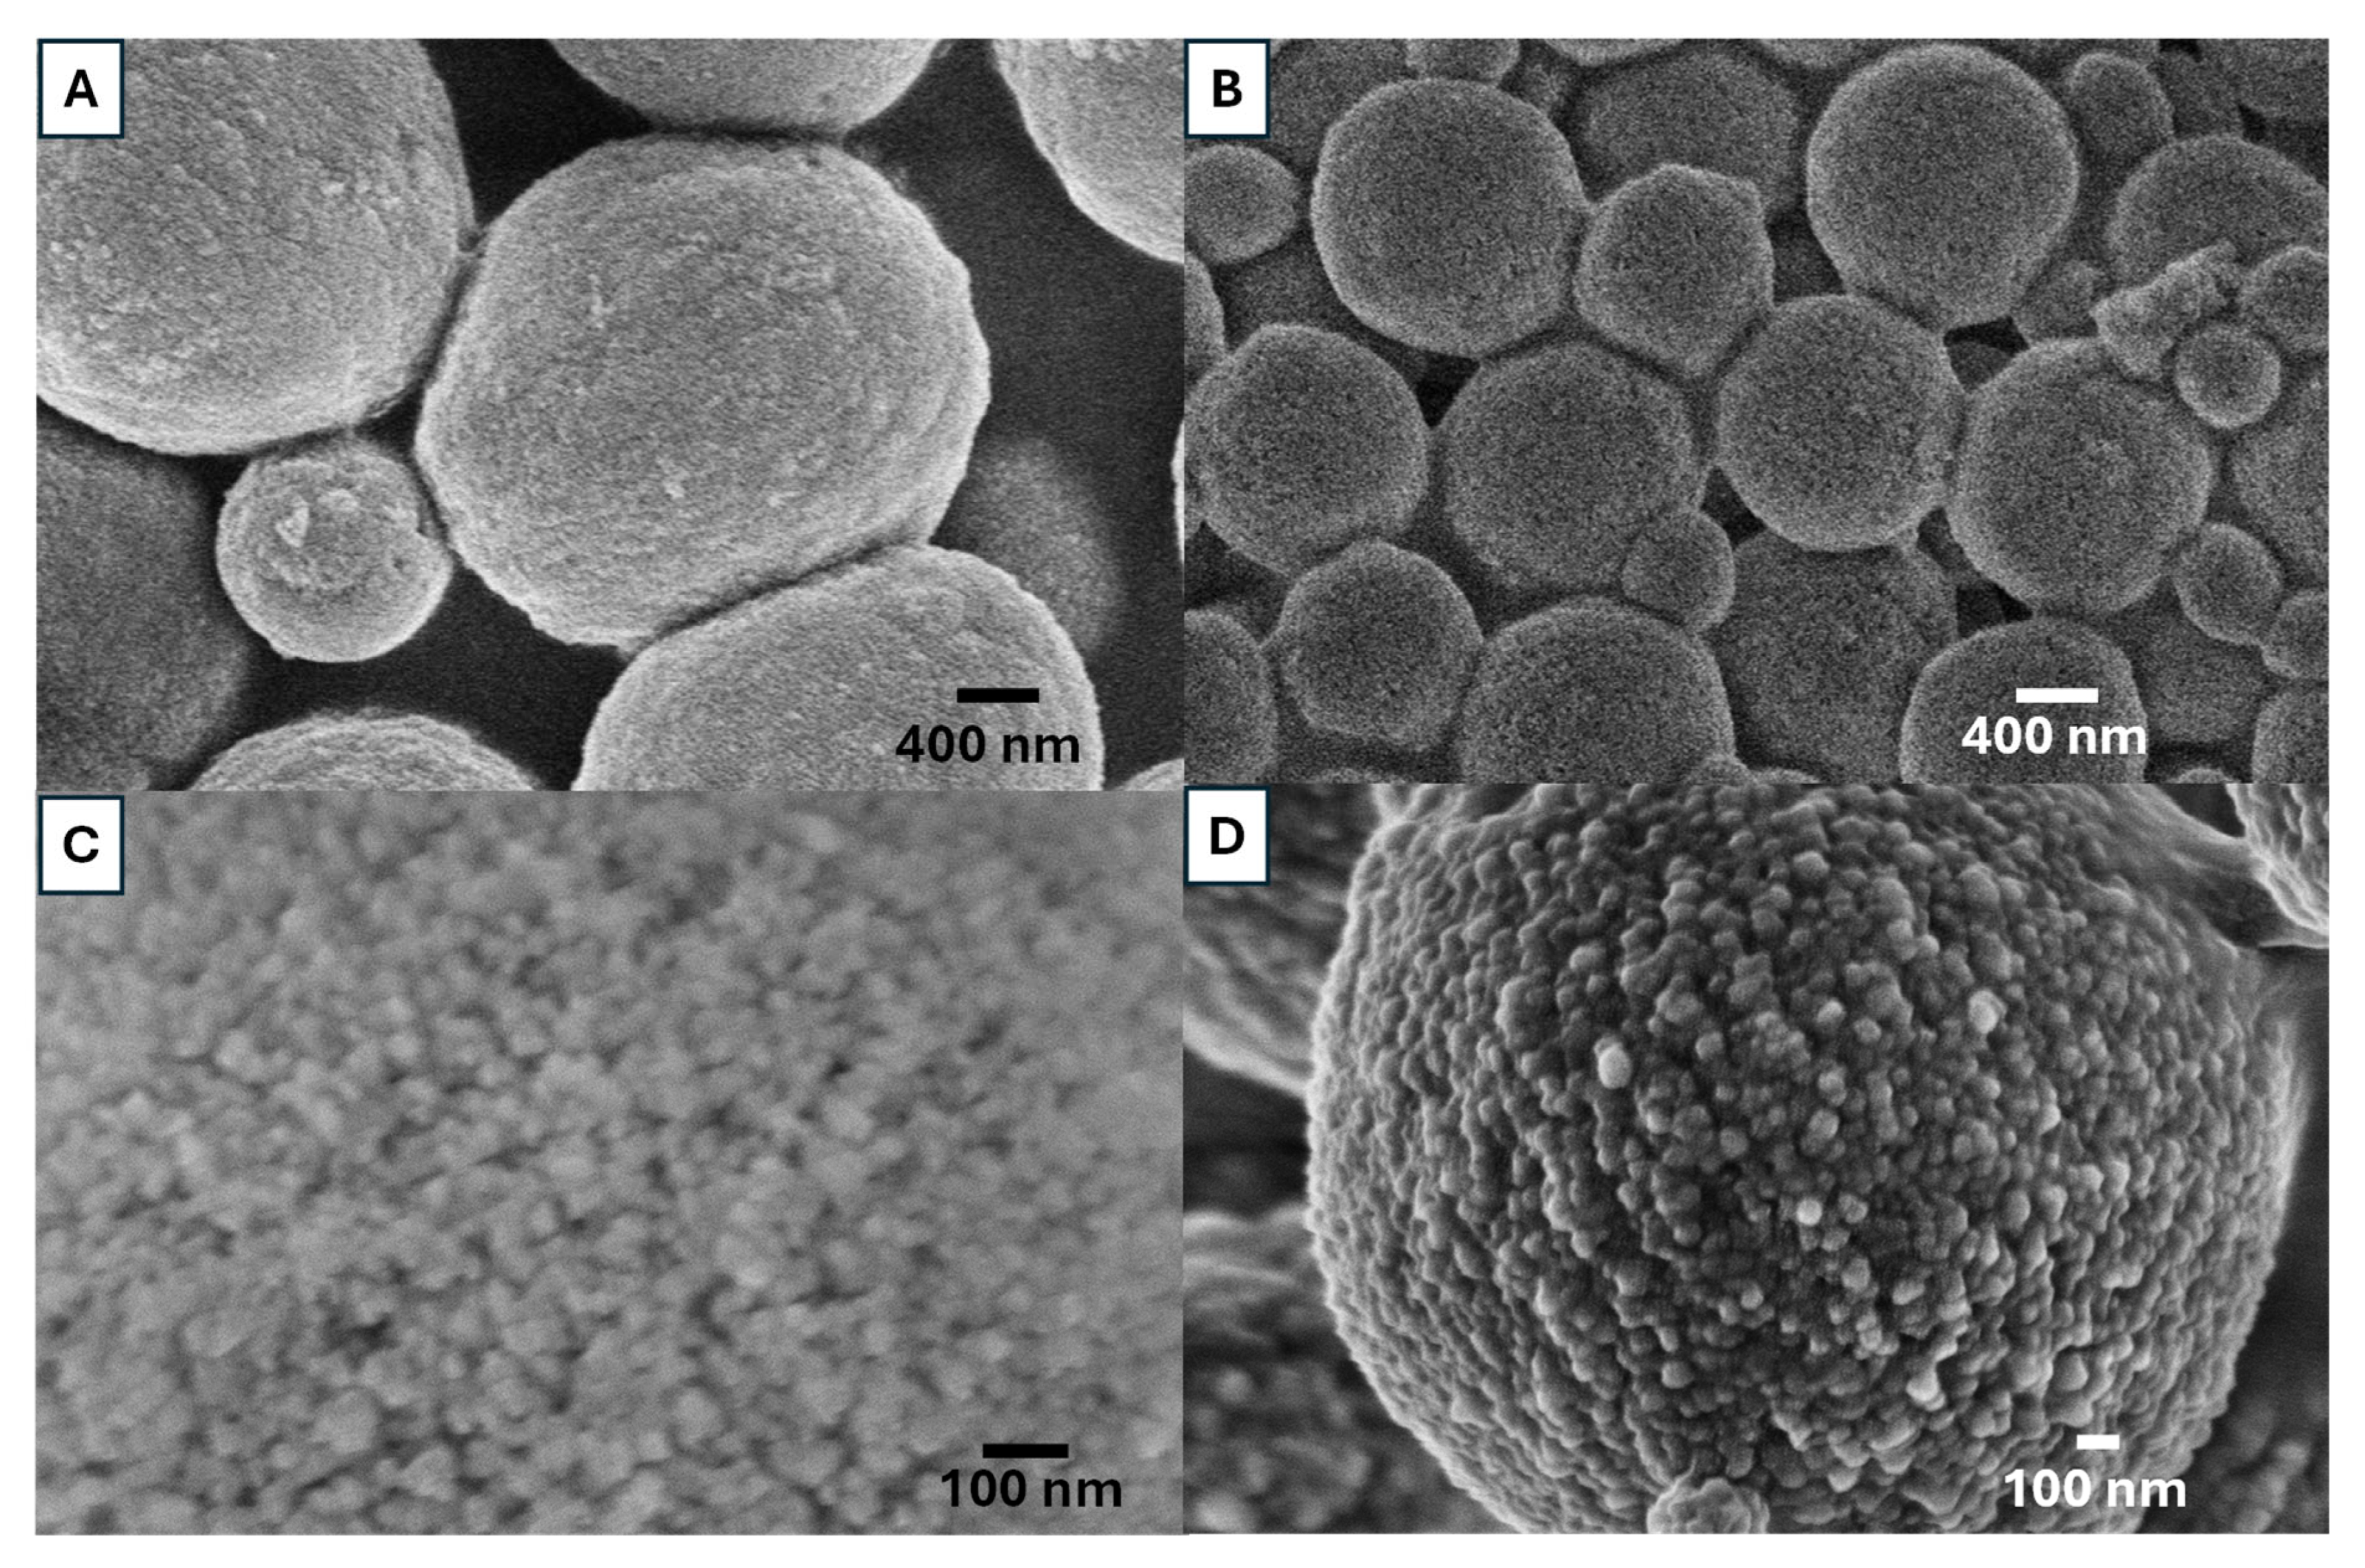
Figure 5 shows the internal structure of vaterite particles after mechanical fracture, prepared from 0.5 M solutions with an EG concentration of 85
v/
v% at 20 °C. The SEM images indicate that the vaterite synthesized in this study is formed through the agglomeration of nanocrystals. The vaterite particles exhibit a highly interconnected internal structure, composed of agglomerated layer-by-layer nanoparticles. Based on our observations in
Figure 4 and
Figure 5 and literature reports [
28,
29,
30,
31,
32], we suggest that the growth of porous vaterite particles is likely to follow this mechanism. First, when calcium and carbonate salts react, ACC precipitates to form a slush-like crystalline state. Then the ACC loses water, and it transforms into a more ordered, homogeneous nanocrystalline structure. These nanocrystals then rapidly aggregate, forming a porous polycrystalline structure, which represents the secondary structure of vaterite particles. In the final step, following Ostwald ripening, larger porous vaterite particles are formed, with all these steps facilitated by the presence of EG.
3.3. Effect of Reaction Temperature
Reaction temperature can significantly affect nucleation rate, grain growth and final grain size [
33,
34].
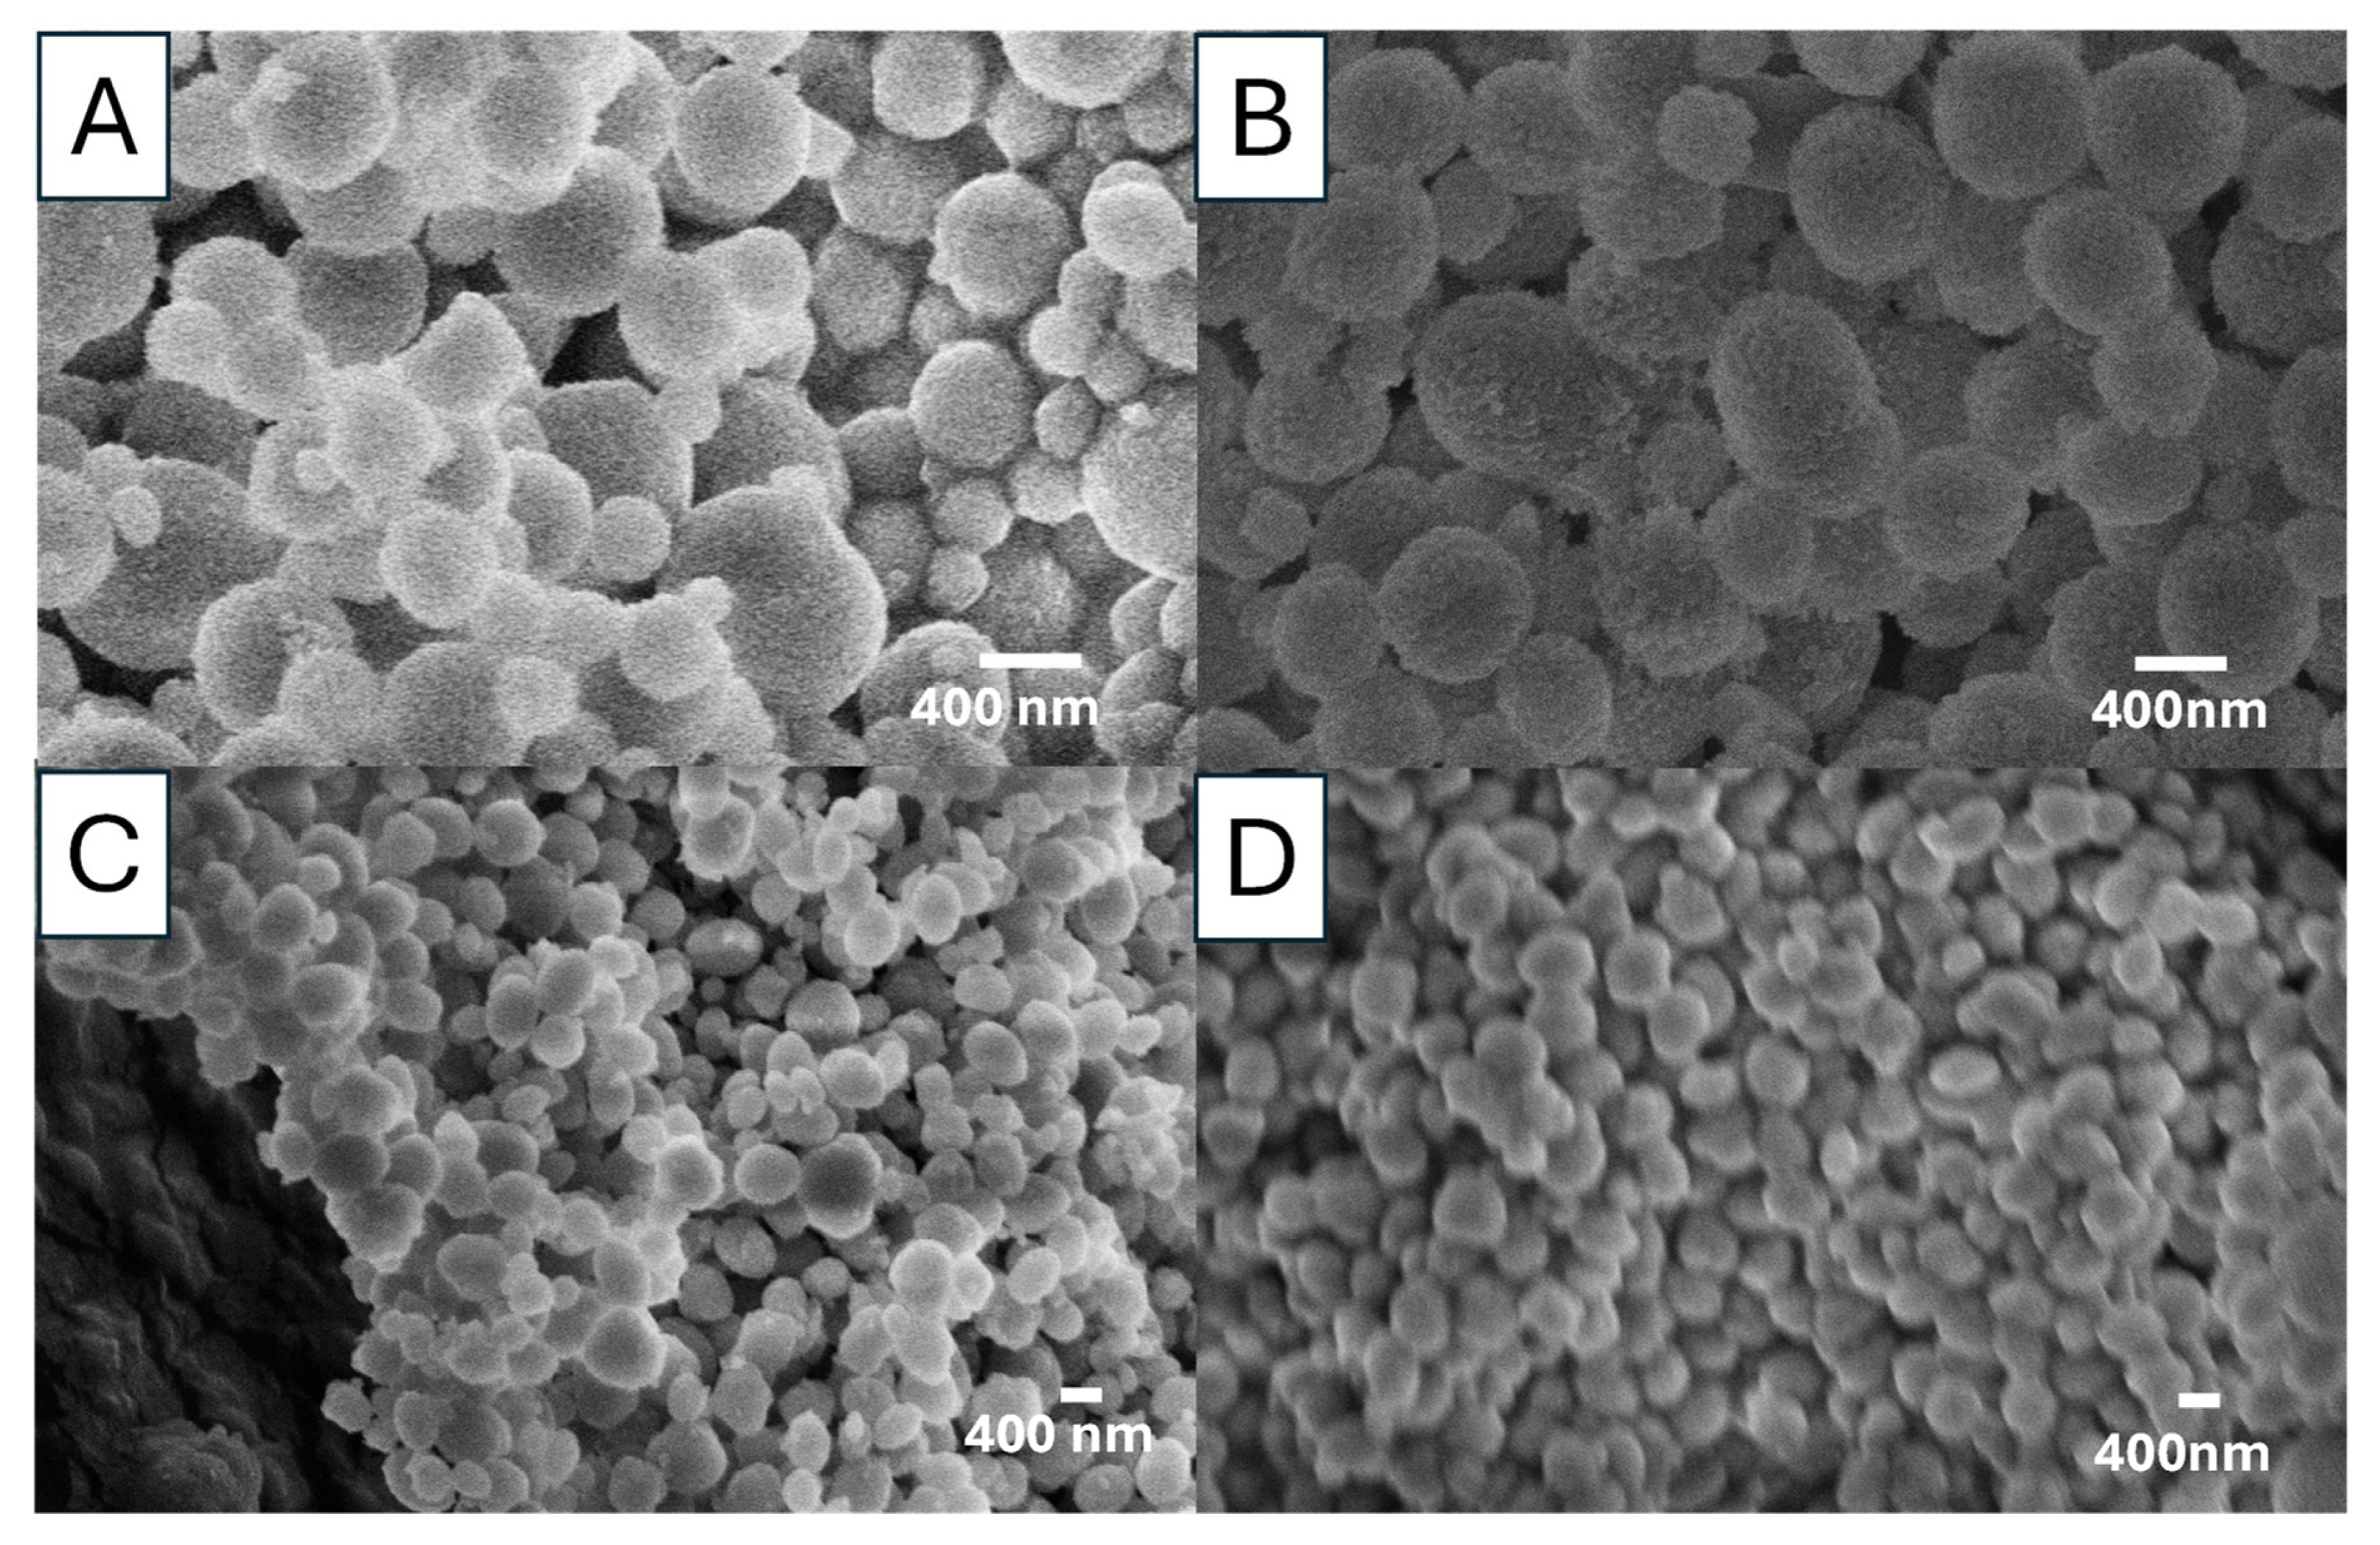
Figure 6 shows the vaterite particles prepared at room temperature (20 °C) and 60 °C from 0.1 M solutions with 85
v/
v% EG. A notable size decrease is observed (
Figure 6A,B). These vaterite particles consist of numerous individual but agglomerated primary nanoparticles. Feoktistova et al. found that the size of primary nanoparticles could be affected by reaction temperature; when the temperature increased, the size of primary nanoparticles increased [
35]. The crystallization of vaterite begins with the formation of ACC when Ca
2+ and CO
32− ions are mixed. ACC has been comfirmed as CaCO
3·H
2O, is thermodynamically unstable and crystallizes at ambient temperatures, leading to the formation of calcium carbonate and its polymorphs. The spherulitic growth of vaterite proceeds via a three step process [
35,
36]. First, ACC loses the water to a dehydrated form, transitioning into a more ordered nanocrystalline structure, known as the primary structure of vaterite. Second, the nanocrystalline particles start to grow because the supersaturation of the vaterite is low, where smaller particles dissolve, promoting nanocrystallite growth. The final steps is dominated by the surface-mediated Ostwald ripening rule [
37]. At a higher temperature, faster reaction rates accelerate Ostwald ripening, resulting in larger nanocrystallites compared to lower reaction temperatures [
35,
36]. This is consistent with our findings, as shown in
Figure 6C,D. When the reaction temperature was 60 °C, the sizes of the nanocrystallities are less than 50 nm. When the reaction temperature was increased to 60 °C the nanocrystallites sizes are larger than 50 nm.
Figure 7 shows the SEM images of the vaterite particles synthesized by rapidly mixing 0.05 M Na
2CO
3 solution and 0.05 M CaCl
2 with 85
v/
v% EG at three different temperatures (0, 20, and 60 °C). The vaterite particle surface appears rough but becomes progressively smoother as the temperature increases. The SEM images show that higher temperatures lead to the formation of more uniform but smaller particles. All vaterite particles maintain a spherical shape. The descrease in particle sizes is consistent with the observation of vaterite particles prepared from 0.1 M solutions at different temperatures.
To anyalse the porosity of the secondary vaterite particles, N
2 sorption was used to measure the pore size and the specific surface area by the Brunauer–Emmett–Teller (BET) method at 77.3 K. Pore diameters were determined using the Barrett–Joyner–Halenda (BJH) analysis based on the desorption isothermal curves. The results are presented in
Table 2. The specific surface areas of these samples are influenced by the synthesis temperature. When the temperature increases from 0 °C to 20 °C, the specific surface area increases. However when the temperature increase from 20 °C to 60 °C, the specific surface area decreases. It is also observed that pore diameter and pore volume consistently increase with the increase of reaction temperature. This may be explained by the increasing size of individual primary nanocrystals (which aggregate to form the secondary spherical particles) at higher reaction temperatures. This can reduce the surface-to-volume ratio and result in larger interstitial voids formed from the agglomerated primary nanocrystalites, with some pores larger than 50 nm (
Figure S2).
3.4. Effect of Reaction Precursors and the Ratio of Ca2+:CO32−
We further examined the effect of different Ca
2+:CO
32− ratios (1:1 and 1:2) with different reaction precursors (Na
2CO
3 and Ca(NO
3)
2) on the formation of vaterite particles. Indeed, all the reactions conducted so far were using Na
2CO
3 and CaCl
2 solutions with a Ca
2+:CO
32− ratio of 1:1, but under different concentrations and reaction temperatures. At the same Ca
2+:CO
32− ratio of 1:1, different combinations of Ca
2+ and CO
32− precursors were investigated with 85
v/
v% EG at 20 °C and 60 °C (
Figure 10). The SEM inages in
Figure 10 show that the choice of precursor has no significant impact on the morphology of the vaterite particles. All the particles produced are spherical, although some particles are agglomerated. The particle size distributions look similar but there is a trend that the use of NaHCO
3 as precursor and higher reaction temperature lead to wider size distribution and smaller particles (
Figure S3). The FTIR results (
Figure S4) indicate that vaterite particles were formed and the use of different precursors under these reaction conditions did not alter the crystalline vaterite structure.
For the Ca
2+:CO
32− ratio of 1:2, the reactions were performed at varied concentrations (0.5 M, 0.1 M, and 0.05 M) and temperatures (20 °C, 60 °C) with different precursors. FTIR analysis of these samples (
Figure S5) confirmed that vaterite particles had been produced.
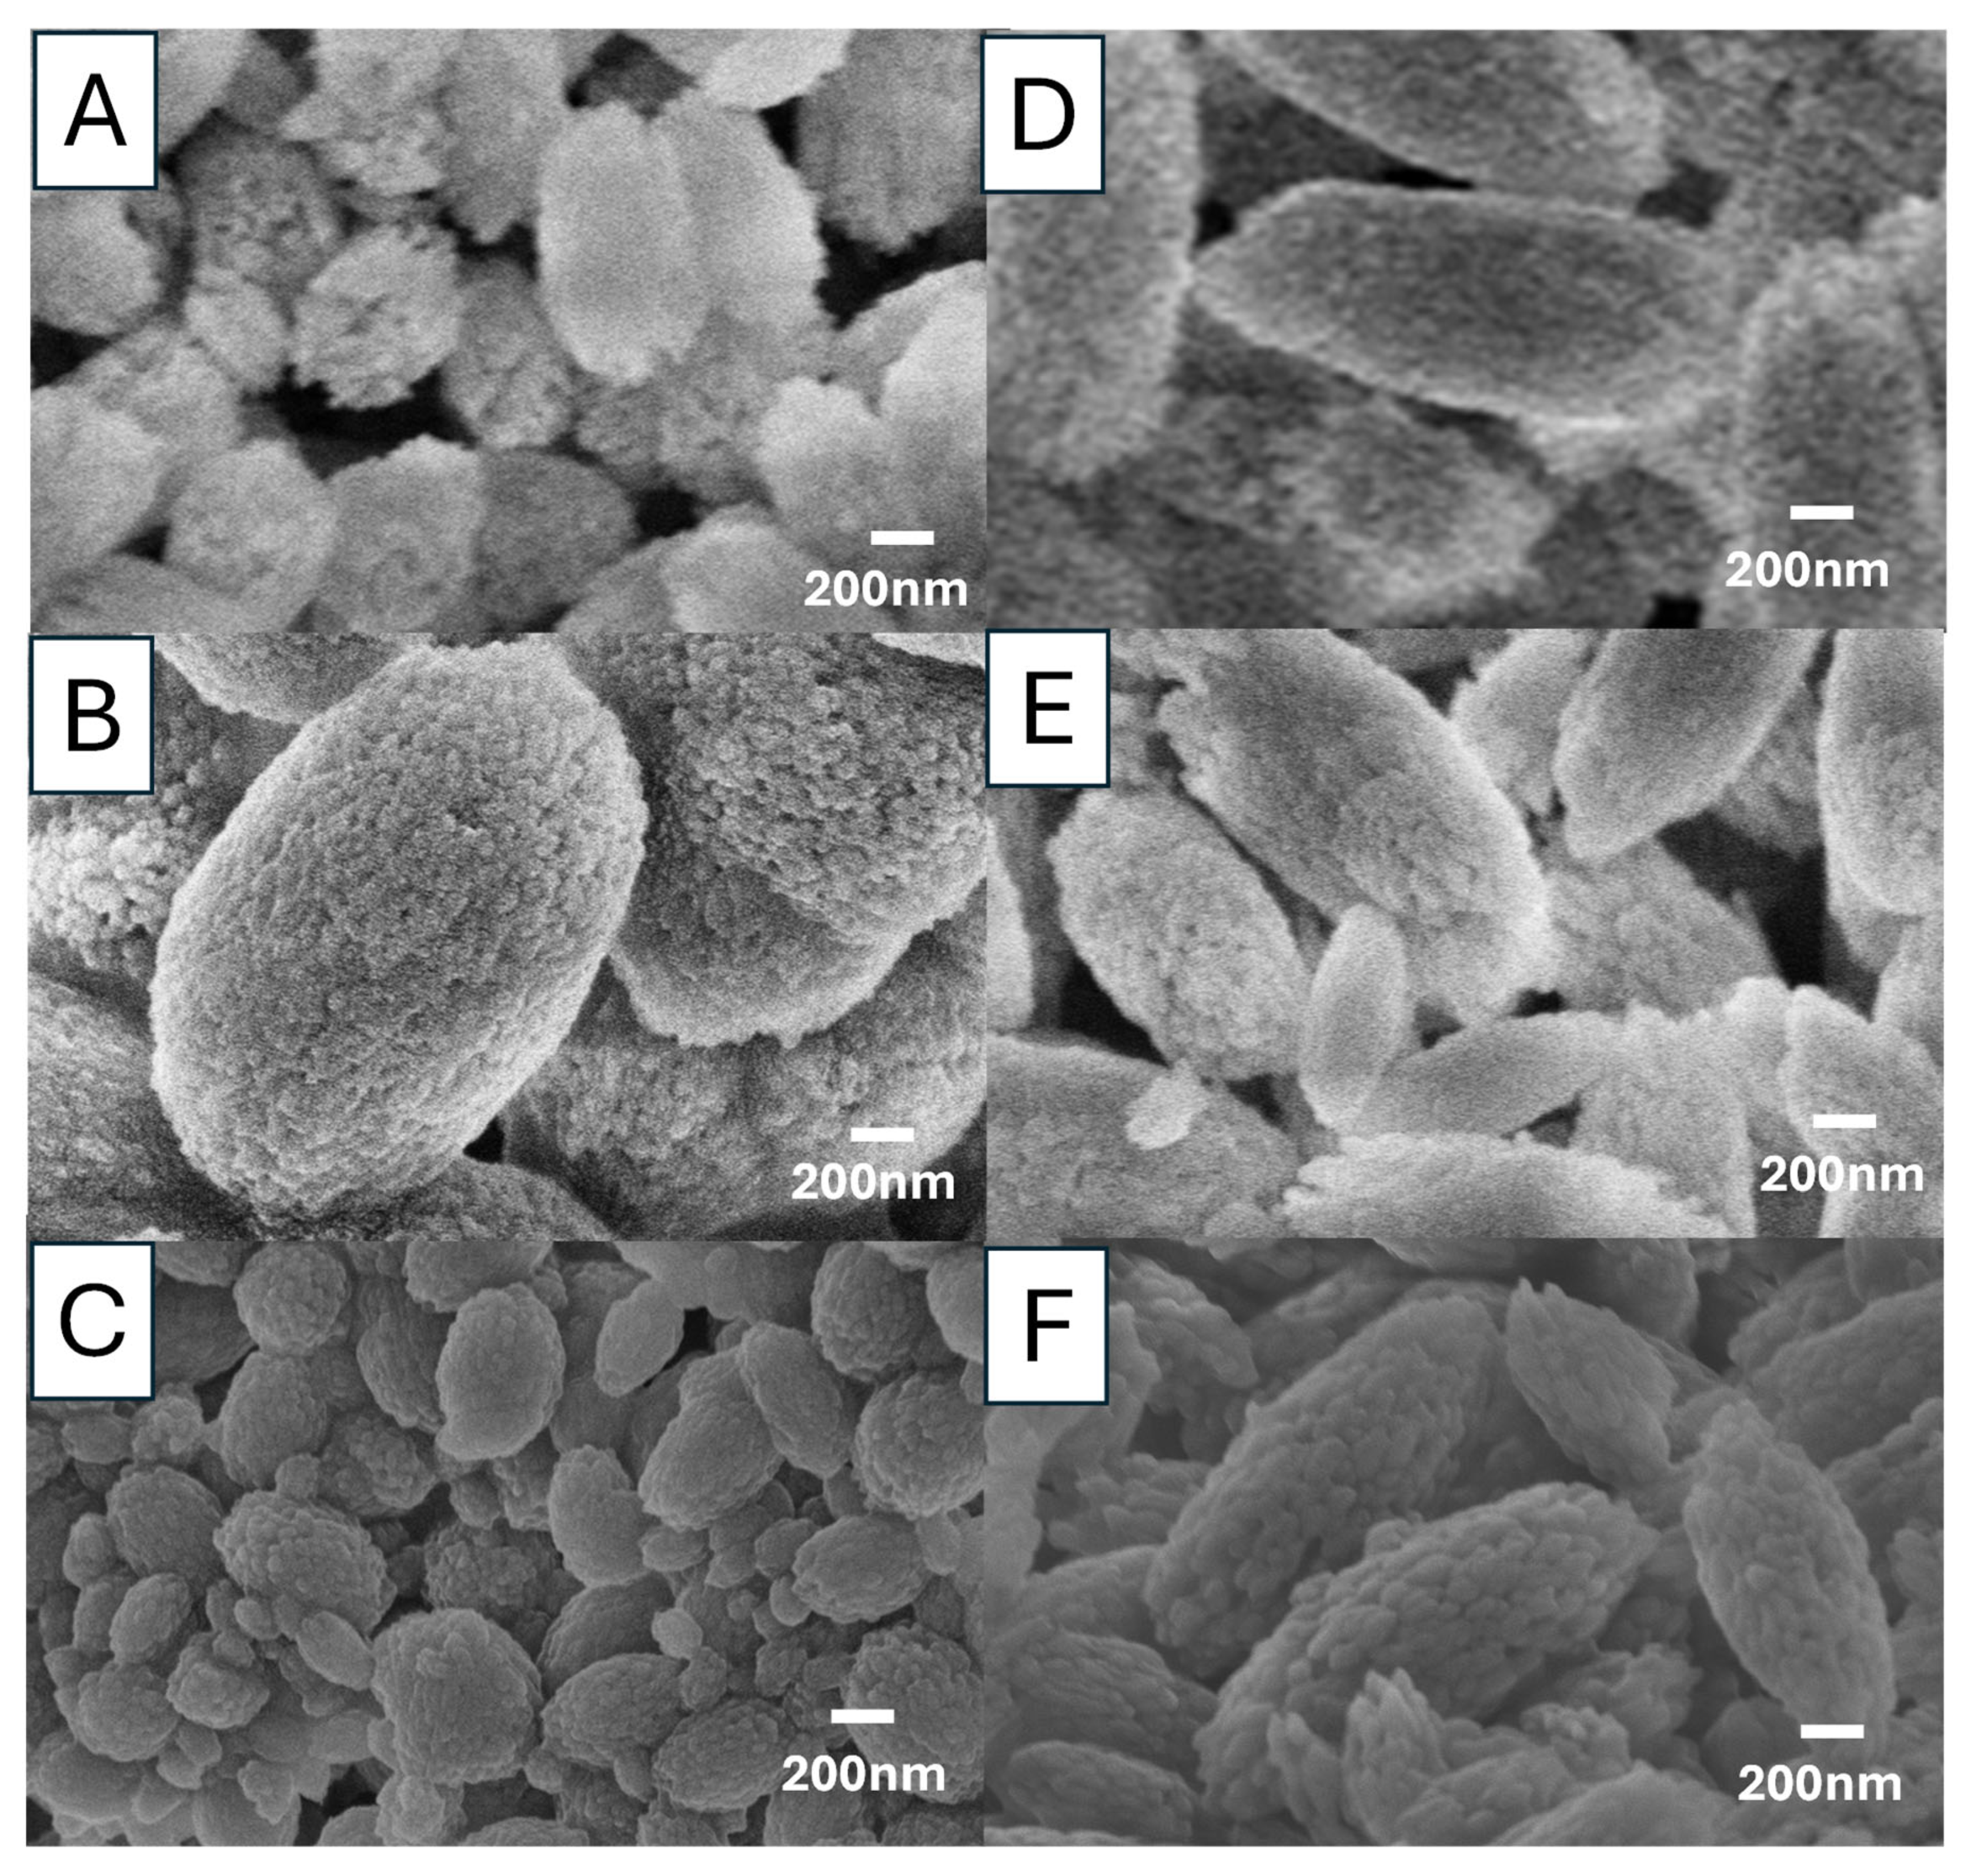
Figure 11 presents the morphologies of these particles. It is clear that the increase in the molar ratio of carbonate salts has a significant impact on the particle morphology—a change of particle shape from spherical to ellipsoidal. The formation of ellipsoidal vaterite was observed, regardless of the precursor used, precursor concentrations and reaction temperature, at a 1:2 Ca
2+:CO
32− ratio. It is difficult to compare the size of these particles because this study intended to invesigate the effect of precursor/concentration/temperature and the conditions were not directly comparable. However, it is still possible to draw some qualitative conclusions, for example, higher concentrations leading to larger particles (particles in
Figure 11B largest, particles in
Figure 11D–F generally larger than the paricles in
Figure 11A,C). The sizes of primary nanocrystallites (which aggregate to form the secondary spherical structures) are different among the precursors (e.g.,
Figure 11D vs.
Figure 11E). The ellipsoidal particles become more elongated with the increase of reaction temperature.
3.5. CaCO3 Particles (Ca 1 and Ca 2) for Curcumin Loading
Two types of CaCO
3 particles (samples Ca 1 and Ca 2 in
Table 1) were prepared, with different size, porosity, and crystallinity. Because our objective is to use CaCO
3 particles for drug loading and release/delivery, nanoparticles with higher porosity are highly desirable. Sample Ca 1 was prepared with 0.5 M Na
2CO
3 solution + 0.5 M Ca(NO
3)
2 solution with 50
v/
v% EG at room temperature, mainly serving as a control sample. Sample Ca 2 was produced as porous vaterite nanoparticles, under the conditions of 0.025 M NaHCO
3 + 0.025 M CaCl
2 with 85
v/
v% EG stirred at 1200 rpm for 1 h at room temperature. This is based on our earlier findings that lower precursor concentration and the use of NaHCO
3 with high EG content contribute to the formation of smaller vaterite particles.
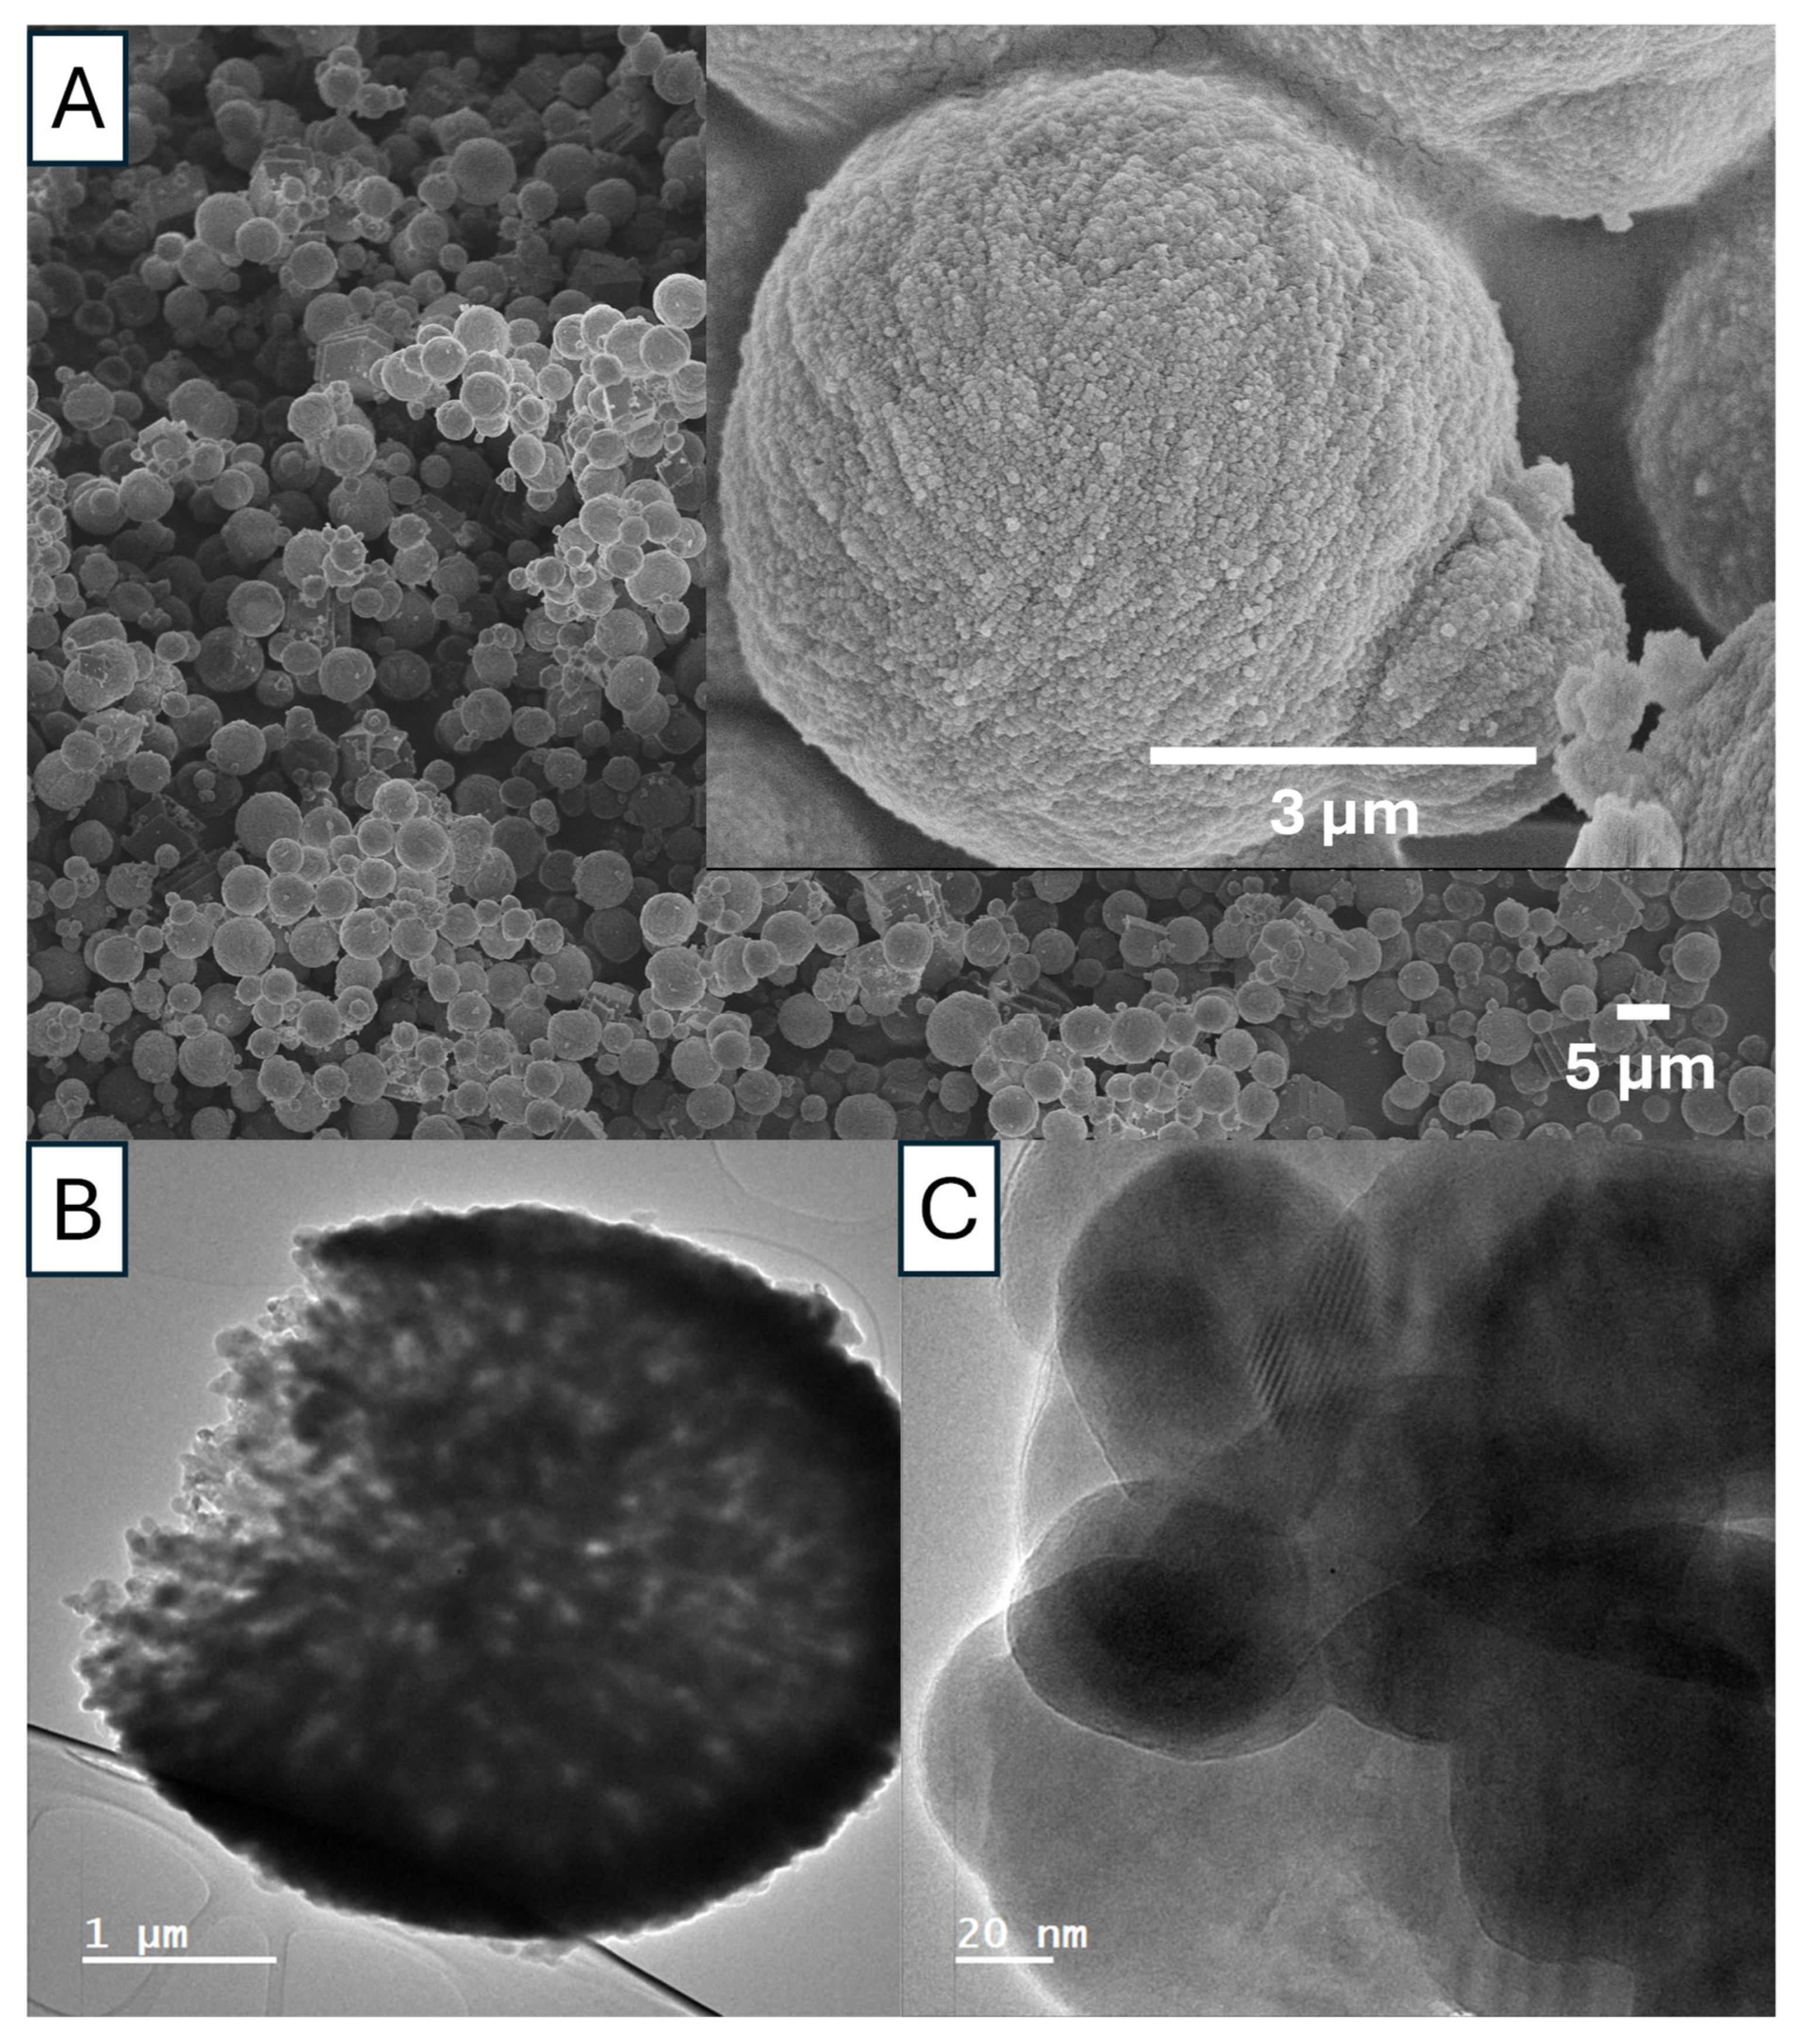
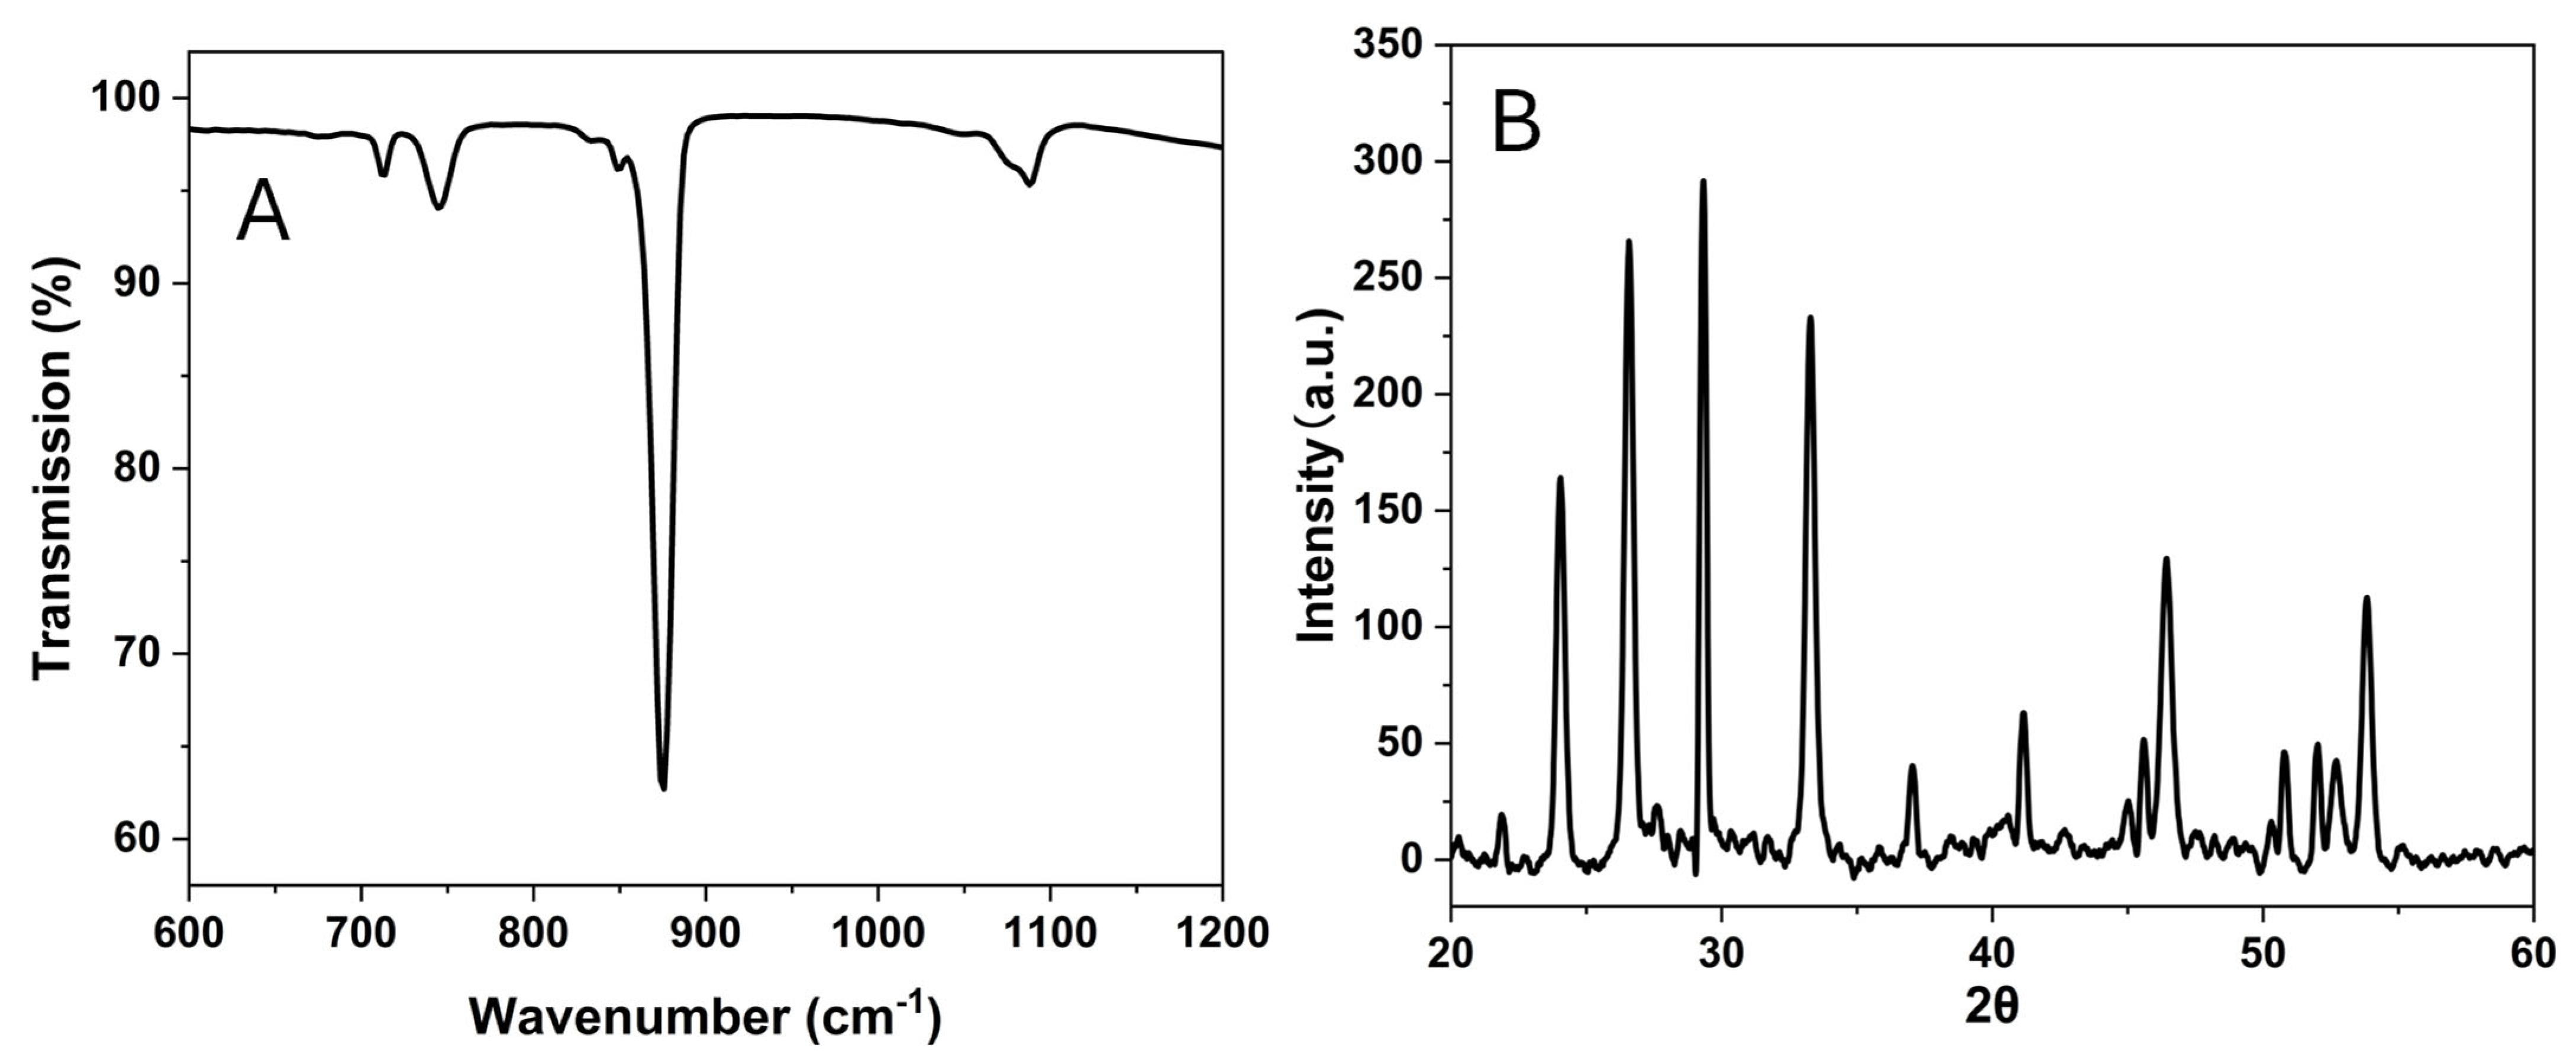
As shown in
Figure 12 and
Figure 13, Ca 1 is a mixture of vaterite and calcite particles with the diameters in the range of 1–5 µm. The porosity and the crystalline structure can be revealed by the TEM images in
Figure 12B,C. The FTIR peaks (
Figure 13A) indicate that the particles contain both vaterite and calcites. The vibration bands are observed at 713.1 cm
−1(calcite), 744.5 cm
−1 (vaterite), and overlapping at 849 cm
−1, 876 cm
−1, and 1088 cm
−1. Additionally, the XRD diffractogram (
Figure 13B) shows the diffraction angles at 24.02°, 26.56°, 29.34°, 33.26°, 37.05°, 41.13°, 44.99°, 46.45°, 50.72°, and 53.79°, indicating that the particles are the mixture of vaterite and calcite [
24,
25].
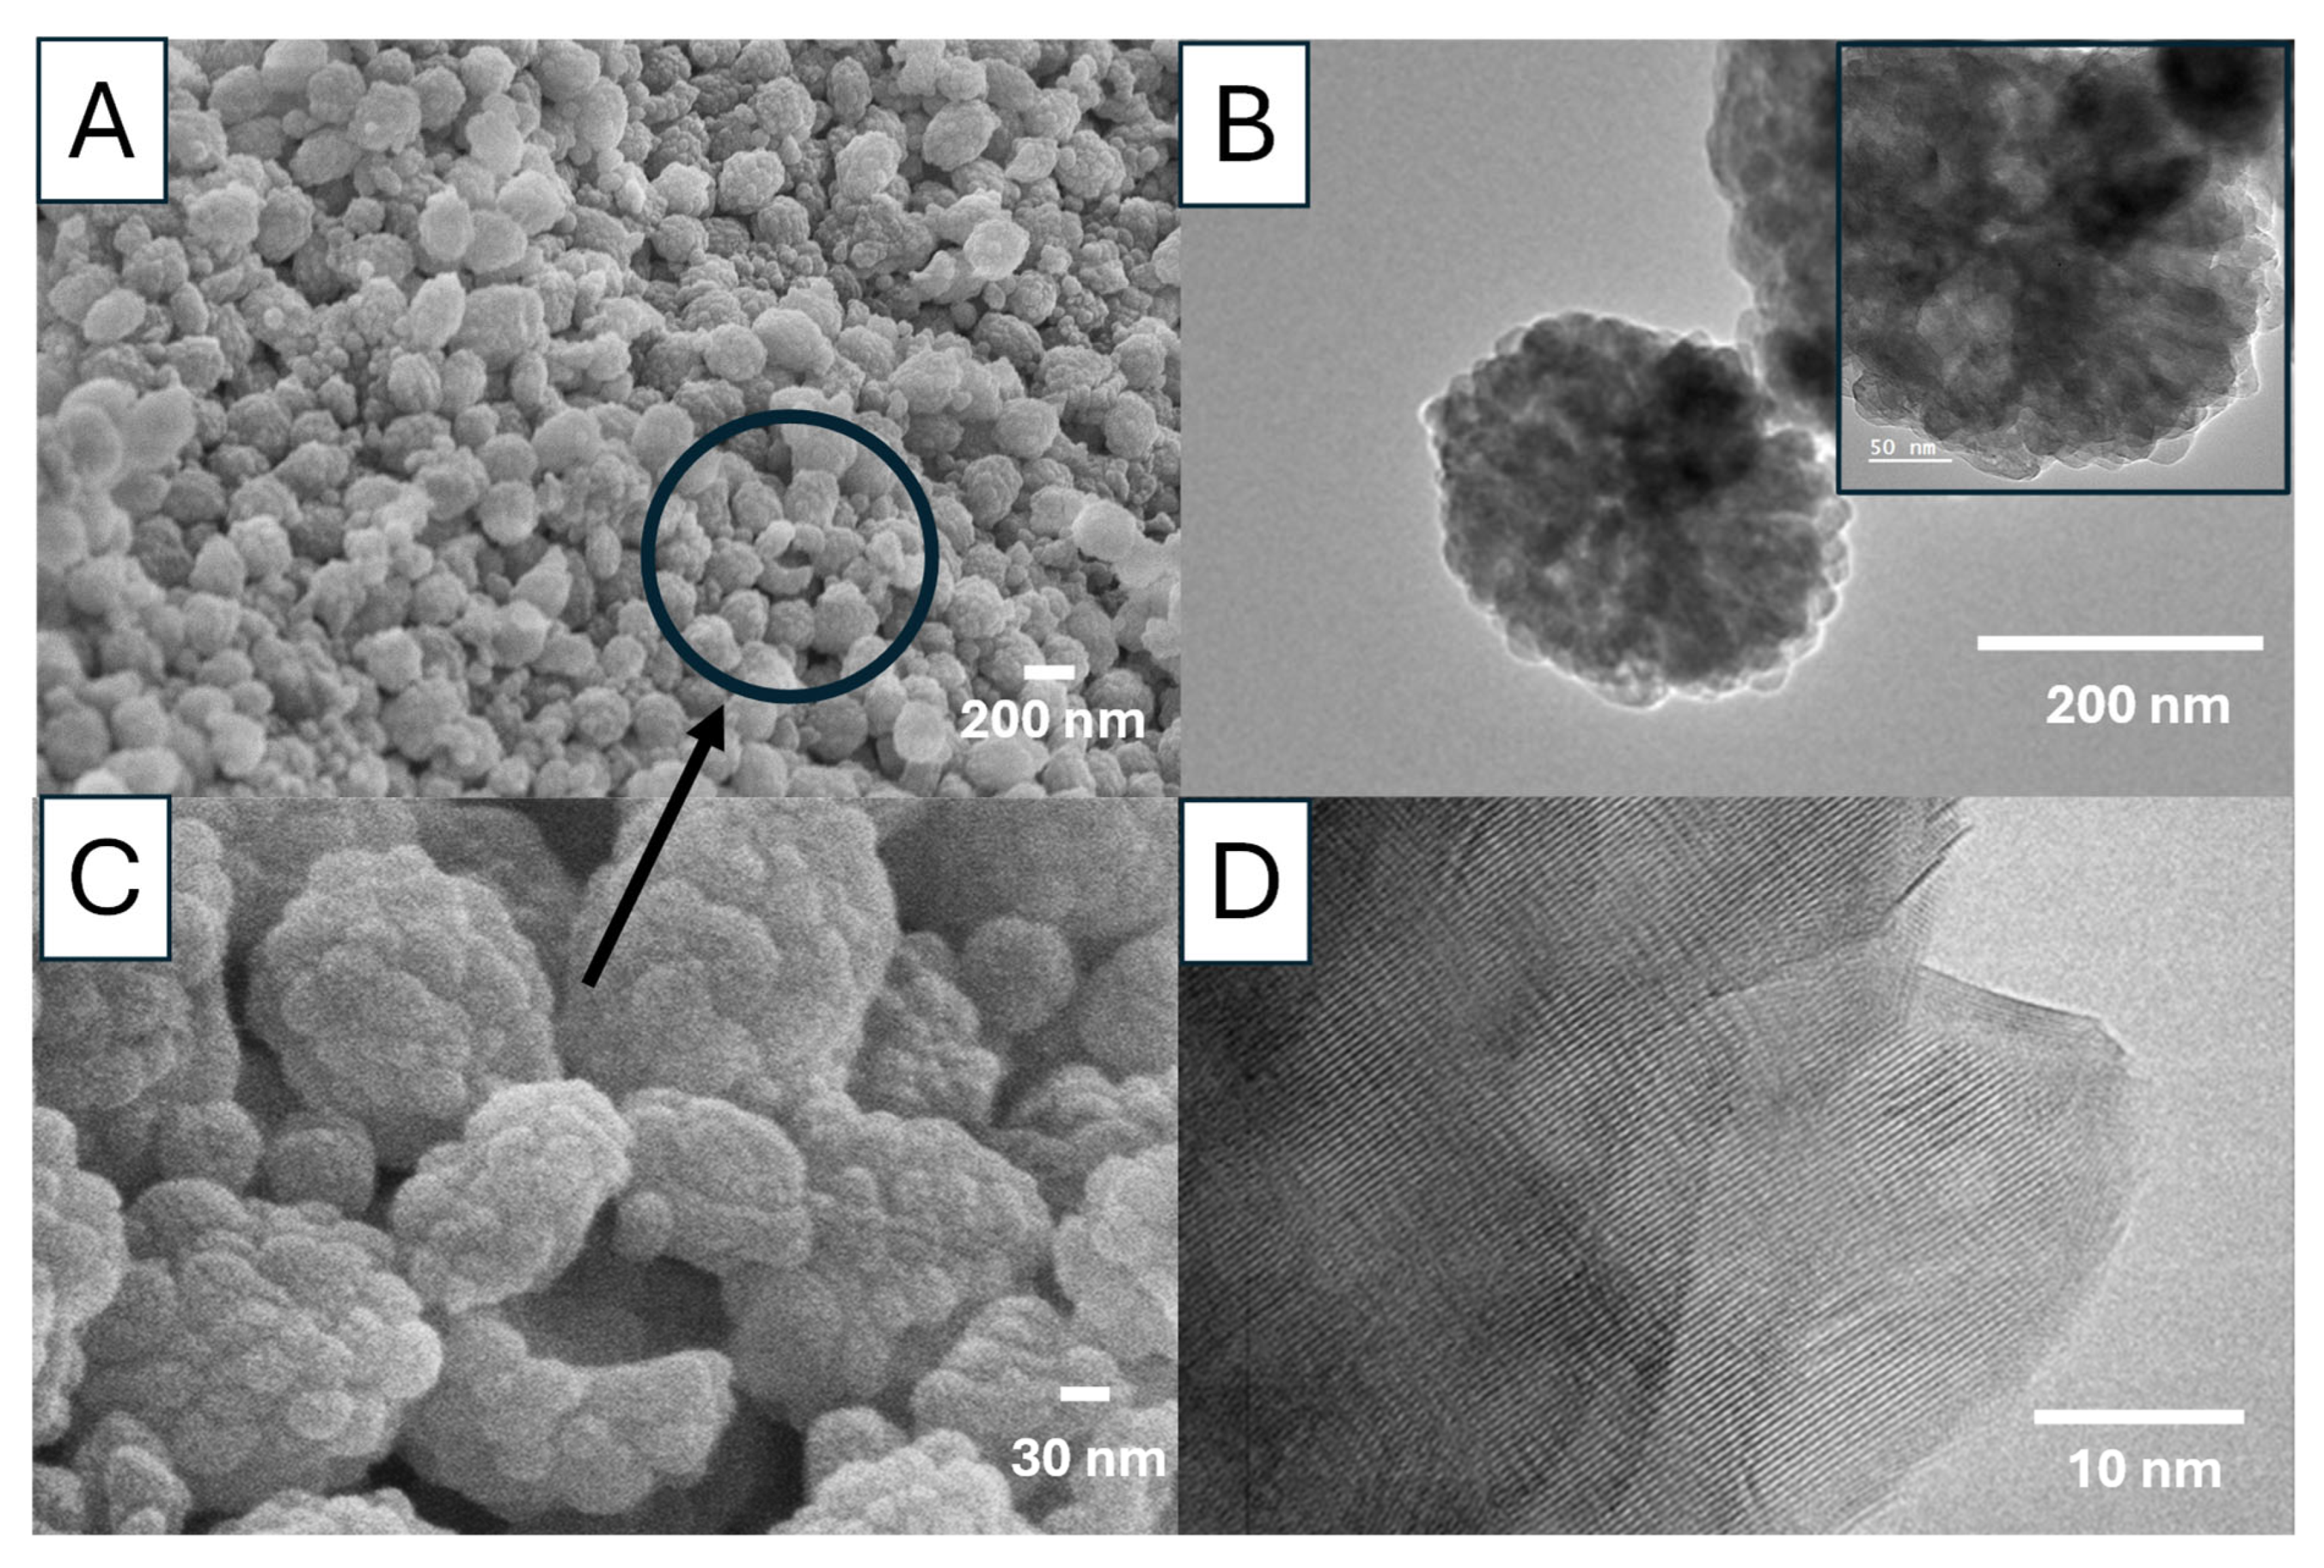
For sample Ca 2, the vaterite nanoparticles are around 200 nm (
Figure 14A,B), consisting of agglomerated primary nanocrystals in the range of 20–40 nm (
Figure 14C). The primary nanocrystals are relatively uniform, with most particles around 30 nm (
Figure 14B,C). The TEM images show the porous structure of these vaterite particles and the crystalline structure (a Moiré pattern) (
Figure 14B,D). The FTIR spectrum with the typical peak at 745 cm
−1 indicates the formation of vaterite nanoparticles whilst the PXRD pattern with the peaks at the diffraction angles of 23.98°, 26.61°, 33.27°, 46.40°, and 53.79° (corresponding to the crystallographic planes (100), (101), (102), (110), (104), and (202)) further confirms the vaterite crystalline structure (
Figure S6) [
24,
25].
The surface area and porosity of Ca 1 and Ca 2 were evaluated by N
2 sorption. The specific surface areas of 5.32 m
2/g and 20.40 m
2/g were obtained for Ca 1 and Ca 2, respectively (
Table 3). The analysis results show higher surface areas, larger pore diameter, and much higher pore volume for Ca 2 (
Table 3). This suggests that Ca 2 should have better potential as a drug carrier for higher drug loading.
3.6. Loading and Controlled Release of Curcumin
The loading of a model drug curcumin was achieved by soaking Ca 1 and Ca 2 particles in curcumin solutions, followed by rotary evaporation to remove the solvent. Thus, the encapsulation efficiency of Ca 1 and Ca 2 particles were considered to be close to 100%. Based on this assumption, the drug loading capacity was calculated to be 3.1% for both Ca 1 and Ca 2. Curcumin is a hydrophobic polyphenolic compound [
21]. As one of the promising drug candidates for cancer treatment, curcumin could be used on its own or associated with other drugs [
22,
23]. To increase the bioavailability and solubility of curcumin and achieve a sustained release, designing and developing appropriate drug carriers is critical. Here, porous vaterite CaCO
3 particles are used as the carrier for controllable release of curcumin.
The SEM images of curcumin-loaded particles (
Figure S7) showed no visible curcumin precipitate on particle surface, indicating the successful encapsulation of curcumin within the vaterite particles. Furthermore, the TEM image of curcumin-loaded Ca 1 exhibited a denser structure than the blank Ca 1 particle (
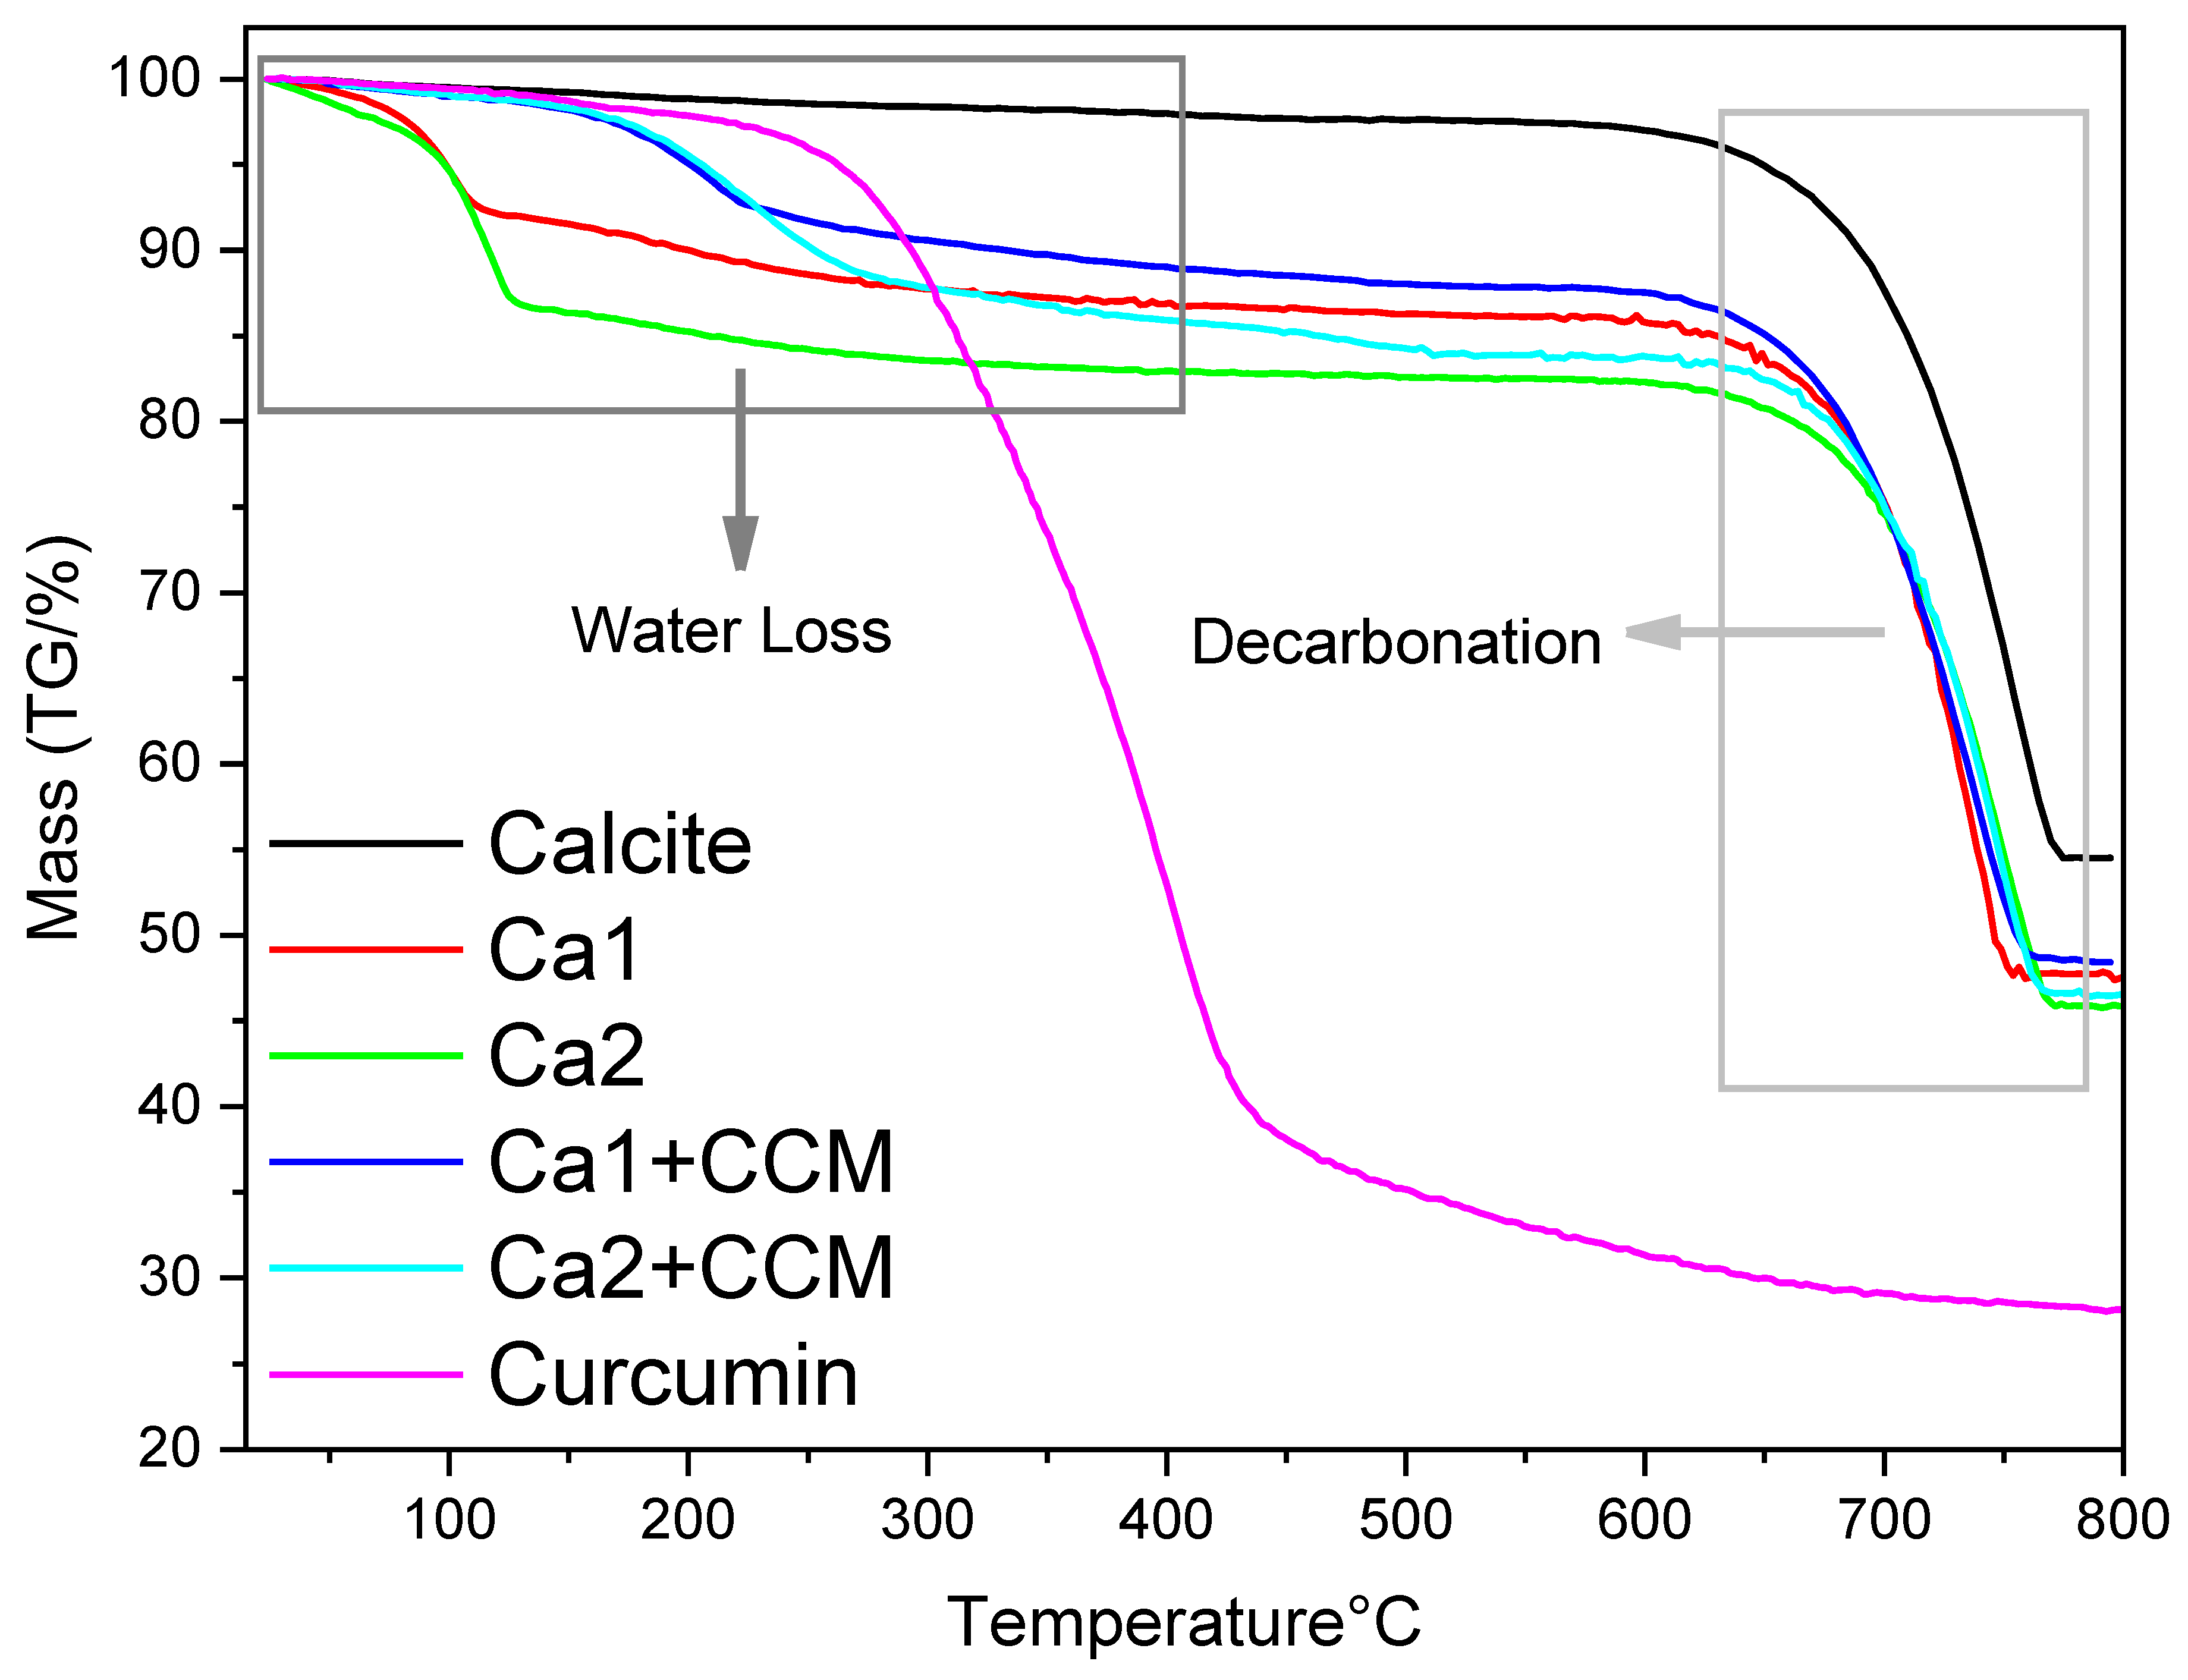
Figure S8), another indication of curcumin encapsulation. The thermogravimetric analysis (TGA) of the vaterite particles with loaded curcumin was recorded in the temperature range of 20 to 800 °C. As shown in
Figure 15, all calcium carbonate particles exhibit similar behaviour within the 650–750 °C temperature range, which is the main mass loss attributing to the decomposition of CaCO
3 and the removal of produced CO
2. The TGA profile indicates that decarbonation begins after 600 °C. For pure calcite, there is a lower mass loss. The small mass loss from 25 to 600 °C is about 2% which could be the moisture absorbed in the powder. The endothermic decomposition of CO
2 occurs between 620–780 °C, corresponding to the conversion of CaCO
3 to CaO, resulting in a 40% mass loss (theoretical mass loss is around 44%). For Ca 1 and Ca 2, because Ca 1 has a small portion of calcite compared to Ca 2, the water content in Ca 1 is expected to be lower than in Ca 2. From the TGA profile, a mass loss of 8% is observed between 20–110 °C for Ca 1, 13% for Ca 2. A second mass loss of 5–10% is observed between 110–600 °C, corresponding to the elimination of water within the vaterite structure. For curcumin-loaded vaterite Ca 1 and Ca 2 particles, the mass loss in the temperature range of 20–110 °C looks lower, compared to blank Ca 1 and Ca 2 particles. This is likely due to the moisture content removed during the rotary evaporation process which was employed to prepare curcumin-loaded particles. However, a more significant mass loss is observed in the temperature range of 200–550 °C, which is attributed to the mass loss of curcumin during the heating procedure.
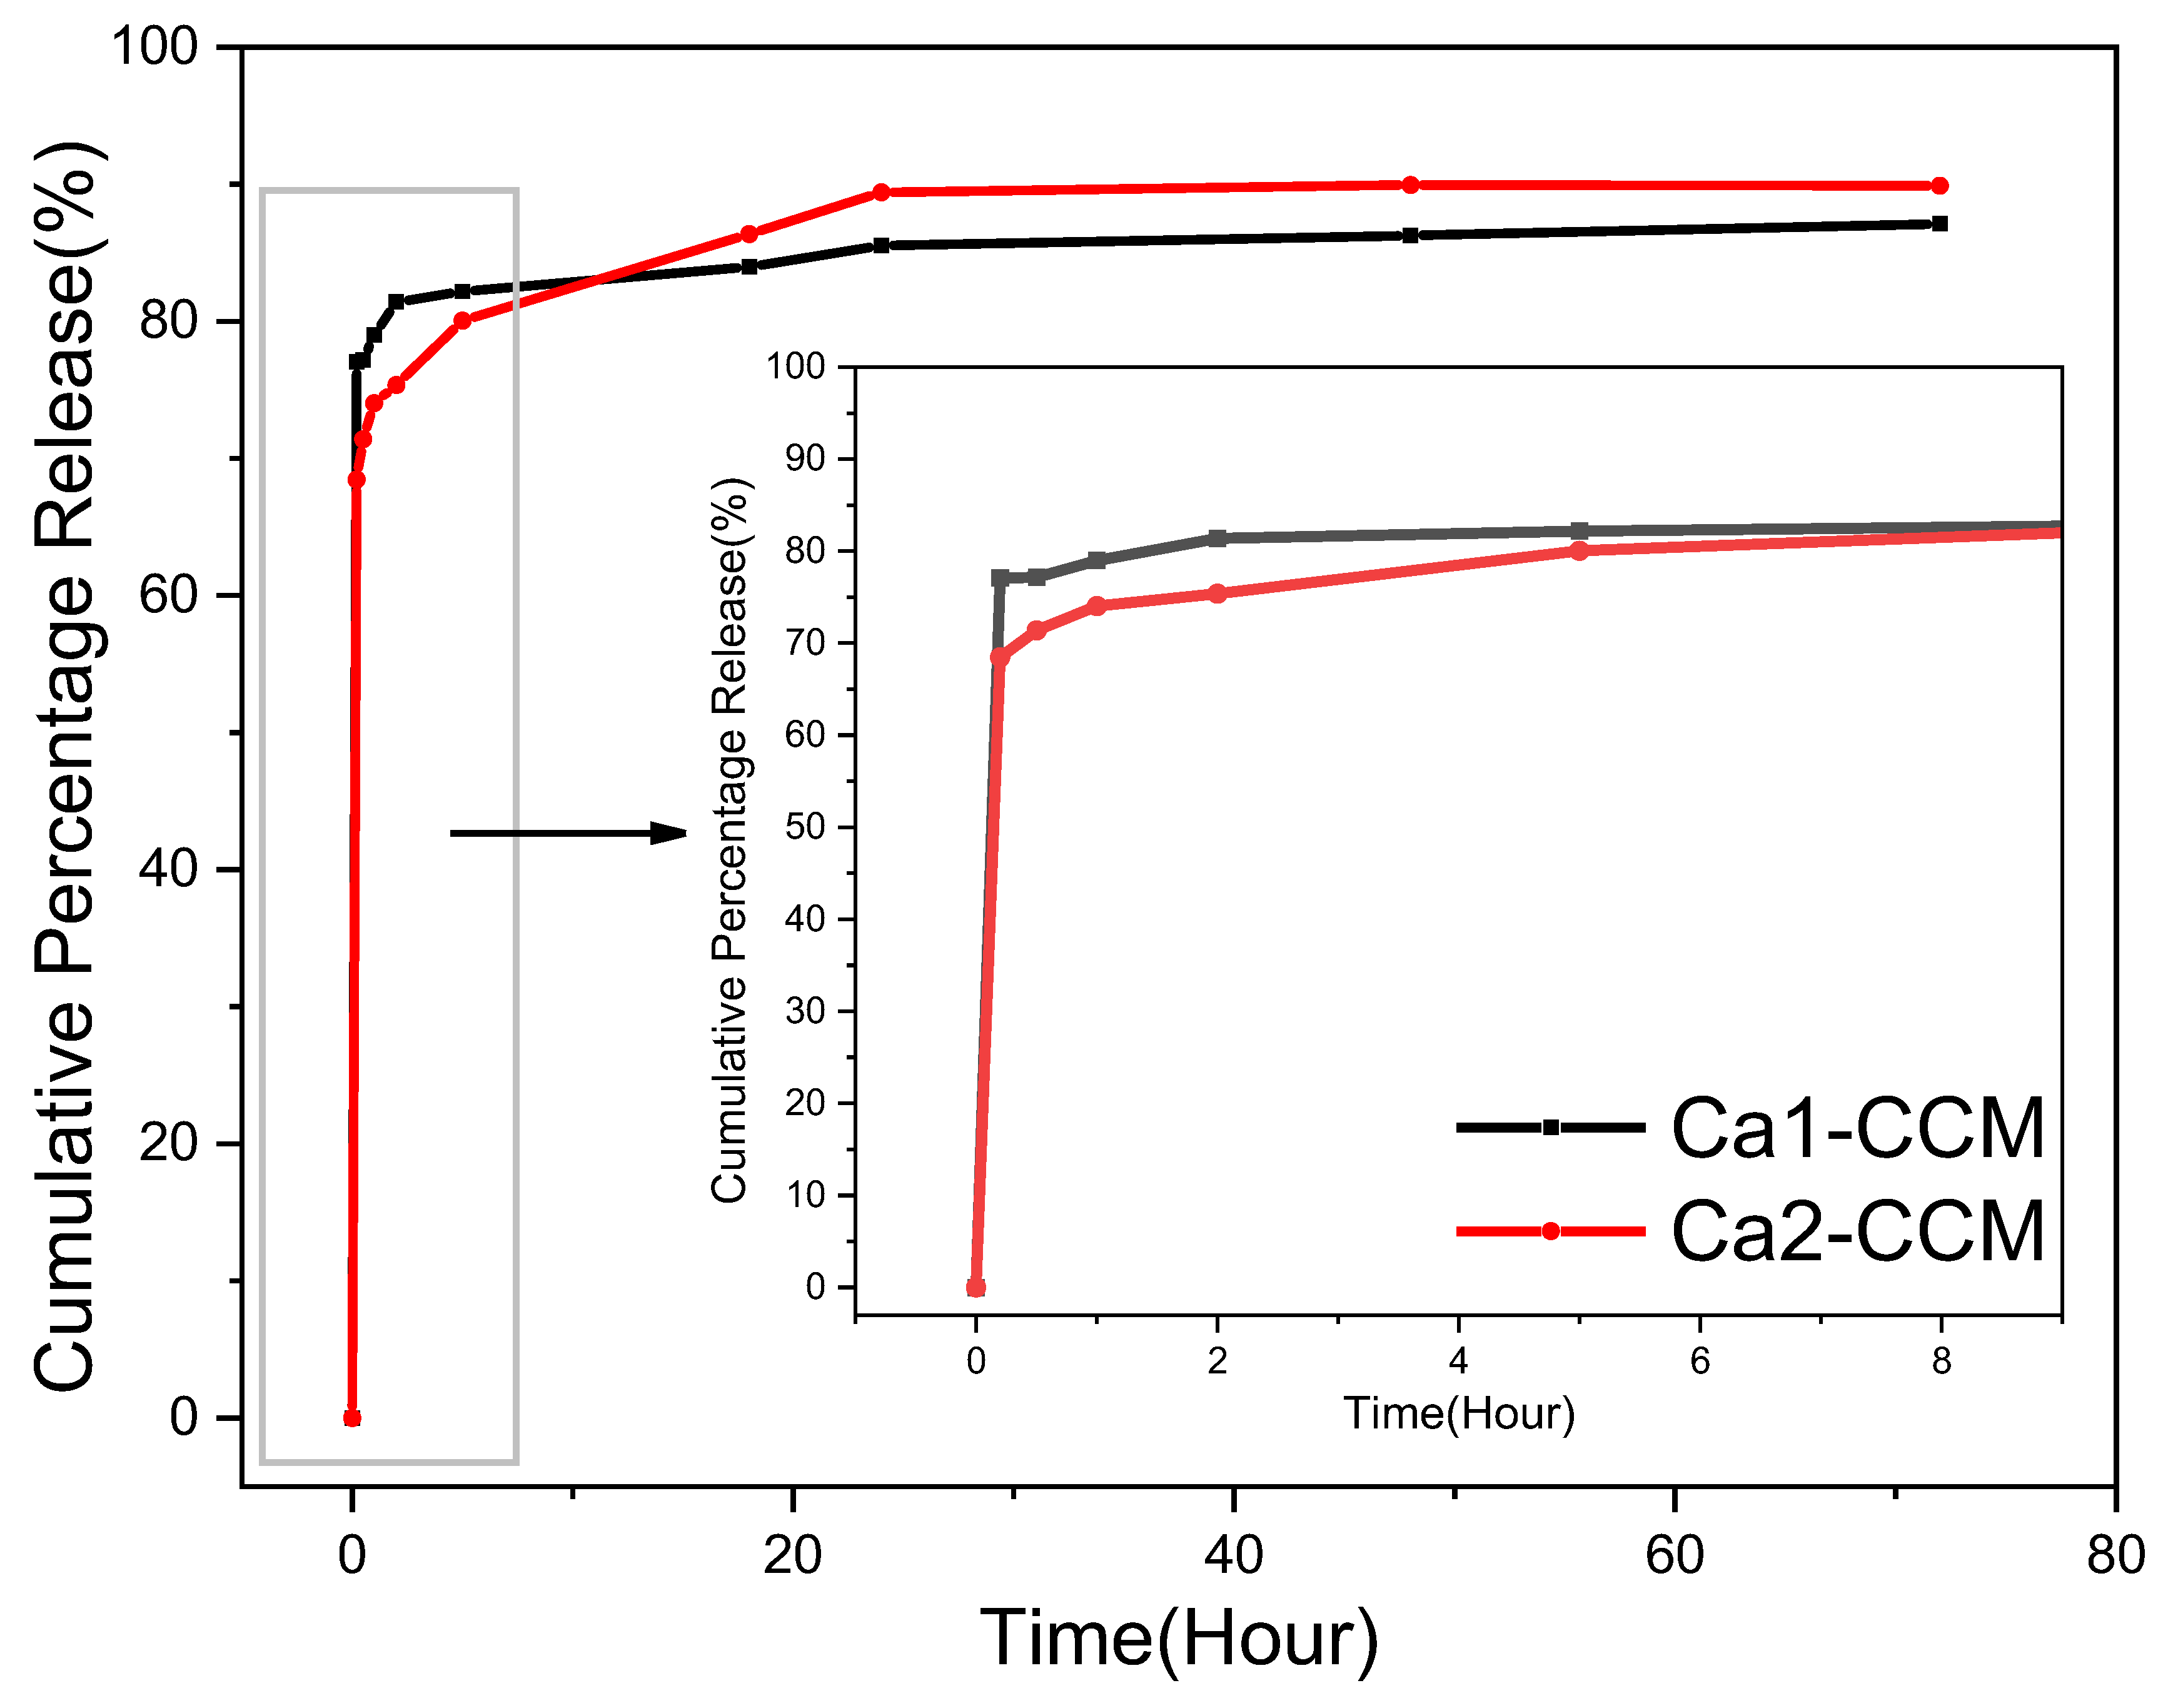
The release study was carried out in the 1:1 PBS: ethanol solution to slow down and prevent the transformation of vaterite to calcite while ensuring the release of curcumin.
Figure 16 illustrates the drug release profiles of curcumin-loaded Ca 1 and Ca 2. The release of curcumin was monitored by UV-vis spectroscopy and calculated based on the calibration curve of curcumin in 1:1
v/
v PBS:ethanol solution (
Figure S9). Both samples exhibit a sharp burst release within the first 10 min, followed by a steady and slow release. The high initial release can be attributed to the curcumin loaded on or close to the particle surface. Overall, vaterite Ca 2 achieves a 90% drug release, while Ca 1 reaches 87.11%. Ca 1, with larger particle size and small surface area, shows a higher initial drug release because more curcumin is deposited on the superficial surface of the structure. Ca 2 shows a lower initial burse release, and then slower and longer release of more curcumin. This results from the smaller particle size, higher surface area, and highly interconnected porosity. This demonstrates that it is possible to control and tune the drug release profile by carefully selecting conditions for the preparation of carrier CaCO
3 particles.

