Article

Silver Nanoparticles-Decorated Porous Silicon Microcavity as a High-Performance SERS Substrate for Ultrasensitive Detection of Trace-Level Molecules

1
Institute of Materials Science, Vietnam Academy of Science and Technology, Hanoi 100000, Vietnam
2
Graduate University of Sciences and Technology, Vietnam Academy of Science and Technology, Hanoi 100000, Vietnam
3
Vietnam Academy of Science and Technology, University of Sciences and Technology of Hanoi, Hanoi 100000, Vietnam
4
Department of Physics, Hanoi National University of Education, Hanoi 100000, Vietnam
5
Department of Physics, Thai Nguyen University of Education, Thai Nguyen University, Thai Nguyen 250000, Vietnam
6
Department of Physics, Kyung Hee University, Seoul 02447, Republic of Korea
*
Authors to whom correspondence should be addressed.
Nanomaterials 2025, 15(13), 1007; https://doi.org/10.3390/nano15131007
Submission received: 28 May 2025 / Revised: 21 June 2025 / Accepted: 24 June 2025 / Published: 30 June 2025
(This article belongs to the Section Nanoelectronics, Nanosensors and Devices)

Abstract

In this study, we present a novel surface-enhanced Raman scattering (SERS) substrate based on porous silicon microcavities (PSiMCs) decorated with silver nanoparticles (AgNPs) for ultra-sensitive molecule detection. This substrate utilizes a dual enhancement mechanism: the localized surface plasmon resonance (LSPR) of AgNPs and the optical resonance of the PSiMC structure, which together create intense electromagnetic hot spots and prolong photon–molecule interactions. The porous architecture provides a large surface area for uniform nanoparticle distribution and efficient analyte adsorption. The AgNP/PSiMC substrate demonstrates an impressive detection limit of 1.0 × 10⁻¹³ M for rhodamine101 and 1.0 × 10⁻¹⁰ M for methyl parathion, outperforming many previously reported SERS platforms. Furthermore, the substrate exhibits excellent signal uniformity (RSD ≈ 6.14%) and long-term stability, retaining over 50% signal intensity after 28 days. These results underscore the potential of AgNP/PSiMCs as highly efficient, reproducible, and scalable SERS platforms for trace-level chemical and environmental sensing applications.

1. Introduction

Surface-enhanced Raman scattering (SERS) has emerged as a powerful spectroscopic technique that significantly enhances the inherently weak Raman signals of analyte molecules through the interaction with nanostructured metallic surfaces. This enhancement occurs when analytes are positioned close to, or directly adsorbed onto, the rough surfaces of noble metal nanoparticles such as silver, gold, or copper. Due to its exceptional sensitivity, SERS has been extensively applied in diverse fields including biosensing, food safety, pharmaceutical analysis, explosive detection, and environmental monitoring [1,2,3,4]. The remarkable sensitivity of SERS, with reported enhancement factors reaching up to 14 orders of magnitude, is primarily attributed to localized surface plasmon resonance (LSPR). This phenomenon arises from the interaction between incident laser light and the collective oscillations of conduction electrons in metal nanoparticles [5,6]. The resulting plasmonic excitation creates highly confined electromagnetic fields, enabling the detection of molecular signatures down to the single-molecule level [7,8].
The performance of SERS is highly dependent on the properties of the substrate, sensing mechanism, and the surrounding environment. To optimize sensitivity, nanostructured substrates are commonly employed due to their large specific surface area and enhanced adsorption capabilities. Among these, porous silicon (PSi) materials have gained increasing attention due to their high surface area, tunable morphology, biocompatibility, and compatibility with existing silicon-based fabrication technologies [9]. PSi is a sponge-like silicon material produced via electrochemical etching, where the silicon wafer serves as the anode. This method is simple, cost-effective, and highly controllable. By adjusting the anodization current density, the porosity of the silicon can be tuned, while etching time controls the pore depth. Additionally, the pore diameter and surface morphology can be further tailored by changing the electrolyte composition, etching parameters, and the crystalline orientation or doping type of the silicon wafer [10,11,12]. Due to its flexibility, PSi has been widely applied in areas such as biosensors [13], solar cells [14], biomedical devices [9], and catalysis [15]. In recent years, PSi-based SERS substrates have also been extensively investigated [16,17,18], where noble metal nanoparticles (Au, Ag, or alloys) are deposited onto the porous silicon matrix to create high-density electromagnetic hotspots, resulting in excellent SERS performance [19,20,21,22].
The ability to precisely modulate the refractive index through porosity control makes PSi a highly suitable material for fabricating one-dimensional (1D) photonic structures, including rugate filters [23], Bragg reflectors [24], and microcavities [25], which exhibit useful light-trapping and interference properties. In particular, porous silicon microcavities (PSiMCs), consisting of two distributed Bragg reflector (DBR) mirrors sandwiching a cavity layer of optical thickness λ or λ/2, have attracted attention for photonic and sensing applications. The DBRs are formed by stacking alternating layers of high and low porosity, creating a one-dimensional photonic crystal structure with strong optical interference effects. The central spacer layer acts as a resonant cavity, where constructive interference enhances light–matter interaction within the localized optical field. When functionalized with silver nanoparticles (AgNPs), PSiMC structures combine plasmonic enhancement and photonic confinement, forming a hybrid platform with superior SERS sensitivity. Despite the strong potential of this design, SERS substrates based on metal-decorated PSiMCs remain largely underexplored. Most studies have focused on single-layer PSi [26,27] or surface-modified porous structures [28,29,30]; in contrast, SERS sensors utilizing PSiMC structures have been rarely reported.
In this study, we present a novel surface-enhanced Raman scattering (SERS) platform based on porous silicon microcavities (PSiMCs) functionalized with silver nanoparticles (AgNPs). This hybrid structure harnesses the synergistic benefits of photonic resonance within the microcavity and localized surface plasmon resonance (LSPR) from the AgNPs, resulting in the formation of densely distributed electromagnetic “hotspots” that dramatically amplify Raman signals. The substrate is fabricated through a simple, cost-effective, and scalable electrochemical process that is fully compatible with standard silicon processing technologies. Using rhodamine 101 (Rh101), a xanthene dye featuring dual chromophores that facilitate resonance enhancement, we systematically demonstrate the platform’s high sensitivity, signal uniformity, and stability. Additionally, the SERS spectra of Rh101 obtained from PSi single-layer and photonic crystal substrates serve as references. Furthermore, the detection of methyl-parathion (MP), a hazardous environmental contaminant, underscores the potential of AgNP/PSiMCs as a powerful and reproducible SERS substrate for label-free trace detection in environmental safety, food monitoring, and biosensing applications.

2. Materials and Methods

2.1. Materials

The monocrystalline silicon wafers used in this investigation were p-type, boron-doped, with a typical resistivity of 0.01–0.013 Ω·cm, (100) orientation, and a thickness of 625 µm, sourced from CrysTec GmbH, Germany. The electrolyte solution consisted of 48 wt% hydrofluoric acid (HF, Merck Millipore, Germany) and 99.9% absolute ethanol (Merck Millipore) in a 1:2 volume ratio. Silver nitrate (AgNO3, ≥99.0%, Sigma-Aldrich) was dissolved in deionized (DI) water at a concentration of 10−2 M. Rhodamine 101 (Sigma-Aldrich, Germany) was also dissolved in water to prepare a standard stock solution at a concentration of 10−2 M. Different concentrations (10−7 M to 10−13 M) were prepared by successive dilutions of the stock solution with water. Methyl parathion (MP) purchased from Sigma-Aldrich was first dissolved in a small amount of acetone to prepare a concentrated stock solution at 10−1 M. This stock solution was subsequently diluted with deionized water to prepare analyte solutions at concentrations ranging from 10−6 M to 10−10 M. Analyte solutions (10 µL each) were dropped onto the AgNP/PSiMC surface and air-dried to form samples for Raman spectroscopic measurements.

2.2. Preparation of Porous Silicon Substrates

The PSi samples used in this experiment were fabricated using anodic electrochemical etching in an electrolyte solution composed of 48% HF and absolute ethanol mixed in a 1:2 (v/v) ratio. The PSi multilayer structure, also known as a distributed Bragg reflector (DBR), was designed by periodically modulating the current density during the etching process, creating alternating layers of low and high refractive indices. This configuration consists of a total of 12 layer pairs. The PSi microcavity resonator structure comprises two DBR stacks separated by a spacer layer with a thickness of either λ or λ/2. The bottom DBR contains more periods than the top DBR to compensate for the additional losses that arise as a function of depth in the silicon. Detailed etching parameters for all structures are provided in Table 1. Notably, a monolayer PSi structure was fabricated using a current density of 50 mA/cm2, corresponding to the refractive index of the low-index layer in the DBR configuration.

2.3. Fabrication of SERS Substrates

Silver nanoparticles (AgNPs) were deposited onto PSiMC substrates using an immersion plating technique. This method takes advantage of the high density of Si-H bonds on the porous silicon surface, which facilitates the reduction of Ag+ ions to metallic silver without the need for additional chemical reducing agents. As a result, AgNPs can be synthesized in a clean, straightforward process that avoids the use of toxic chemicals. Immersion plating is therefore a widely used and convenient approach for generating AgNPs on solid surfaces. The density and average size of AgNPs are closely dependent on parameters such as dipping time and the concentration of the AgNO3 solution. In this study, five types of samples were obtained by immersing the substrates for varying durations: 25, 50, 75, 100 and 125 s in 0.01 M AgNO3 solution. After immersion, the PSiMC samples were left to dry naturally in the air and were utilized as SERS sensor probes for detecting rhodamine 101 (Rh101) and methyl parathion (MP) pesticide residues.

2.4. Characterizations and SERS Measurement

The crystalline structure of the AgNP/PSiMC composites was analyzed using a high-resolution X-ray diffractometer (XRD), specifically the D8-Advance model, which features a powder diffraction setup and employs a Cu Kα radiation source (λ = 1.5406 Å). To investigate the surface morphology and structural characteristics of both the as-prepared PSiMC and AgNP/PSiMC samples, a field-emission scanning electron microscope (FESEM, Hitachi 4800, Japan) was utilized. The elemental composition was further examined through energy-dispersive X-ray spectroscopy (EDX), which is integrated into the FESEM system. For optical characterization, reflectance spectra of PSiMC and AgNP/PSiMC substrates were measured using an Ocean Optics USB-4000 spectrometer paired with an HL-2000 halogen light source from the same manufacturer.
SERS measurements were performed using a LabRAM HR Evolution Raman microscope system from Horiba Scientific, equipped with a 785 nm excitation laser. The laser spot size on the sample surface was approximately 1 µm in diameter. Analytical standard solutions were created using varying concentration gradients, and 10 µL of these analyte solutions were drop cast onto the AgNP/PSiMC and left to dry naturally overnight under ambient conditions.

3. Results and Discussion

3.1. Structure and Morphological Characteristics

Figure 1 presents the schematic design, structural morphology, and optical characterization of a porous silicon microcavity (PSiMC) fabricated via electrochemical etching. As illustrated in Figure 1a, the microcavity consists of alternating layers of high and low porosity silicon arranged symmetrically around a central optical cavity. This architecture is realized by modulating the etching current density over time, enabling precise control over porosity and, consequently, the refractive index profile throughout the depth of the structure. The cross-sectional SEM image in Figure 1b confirms the successful formation of the PSiMC. The alternating bright and dark layers correspond to the modulation of porosity, which forms the photonic crystal-like structure. The central cavity, clearly visible as a disruption in periodicity, serves as the optical resonance site. Inset images in Figure 1b provide zoomed-in views of both the top surface morphology, showing a nanoporous texture, and the vertical pore structure within the multilayer, which confirms the anisotropic and vertically aligned nature of the etching process. The reflectance spectrum shown in Figure 1c reveals a distinct and narrow resonance dip at 784.4 nm, corresponding to the optical mode confined within the central cavity. This resonance is located within the photonic bandgap formed by the periodic porosity layers, validating the optical functionality of the microcavity. The close alignment of this resonance with common Raman excitation wavelengths (e.g., 785 nm) highlights the suitability of the structure for optical sensing applications, including cavity-enhanced Raman scattering. Together, these structural and optical characterizations demonstrate that the fabricated PSiMC is a well-defined, optically resonant platform capable of confining light within the infrared–visible range.
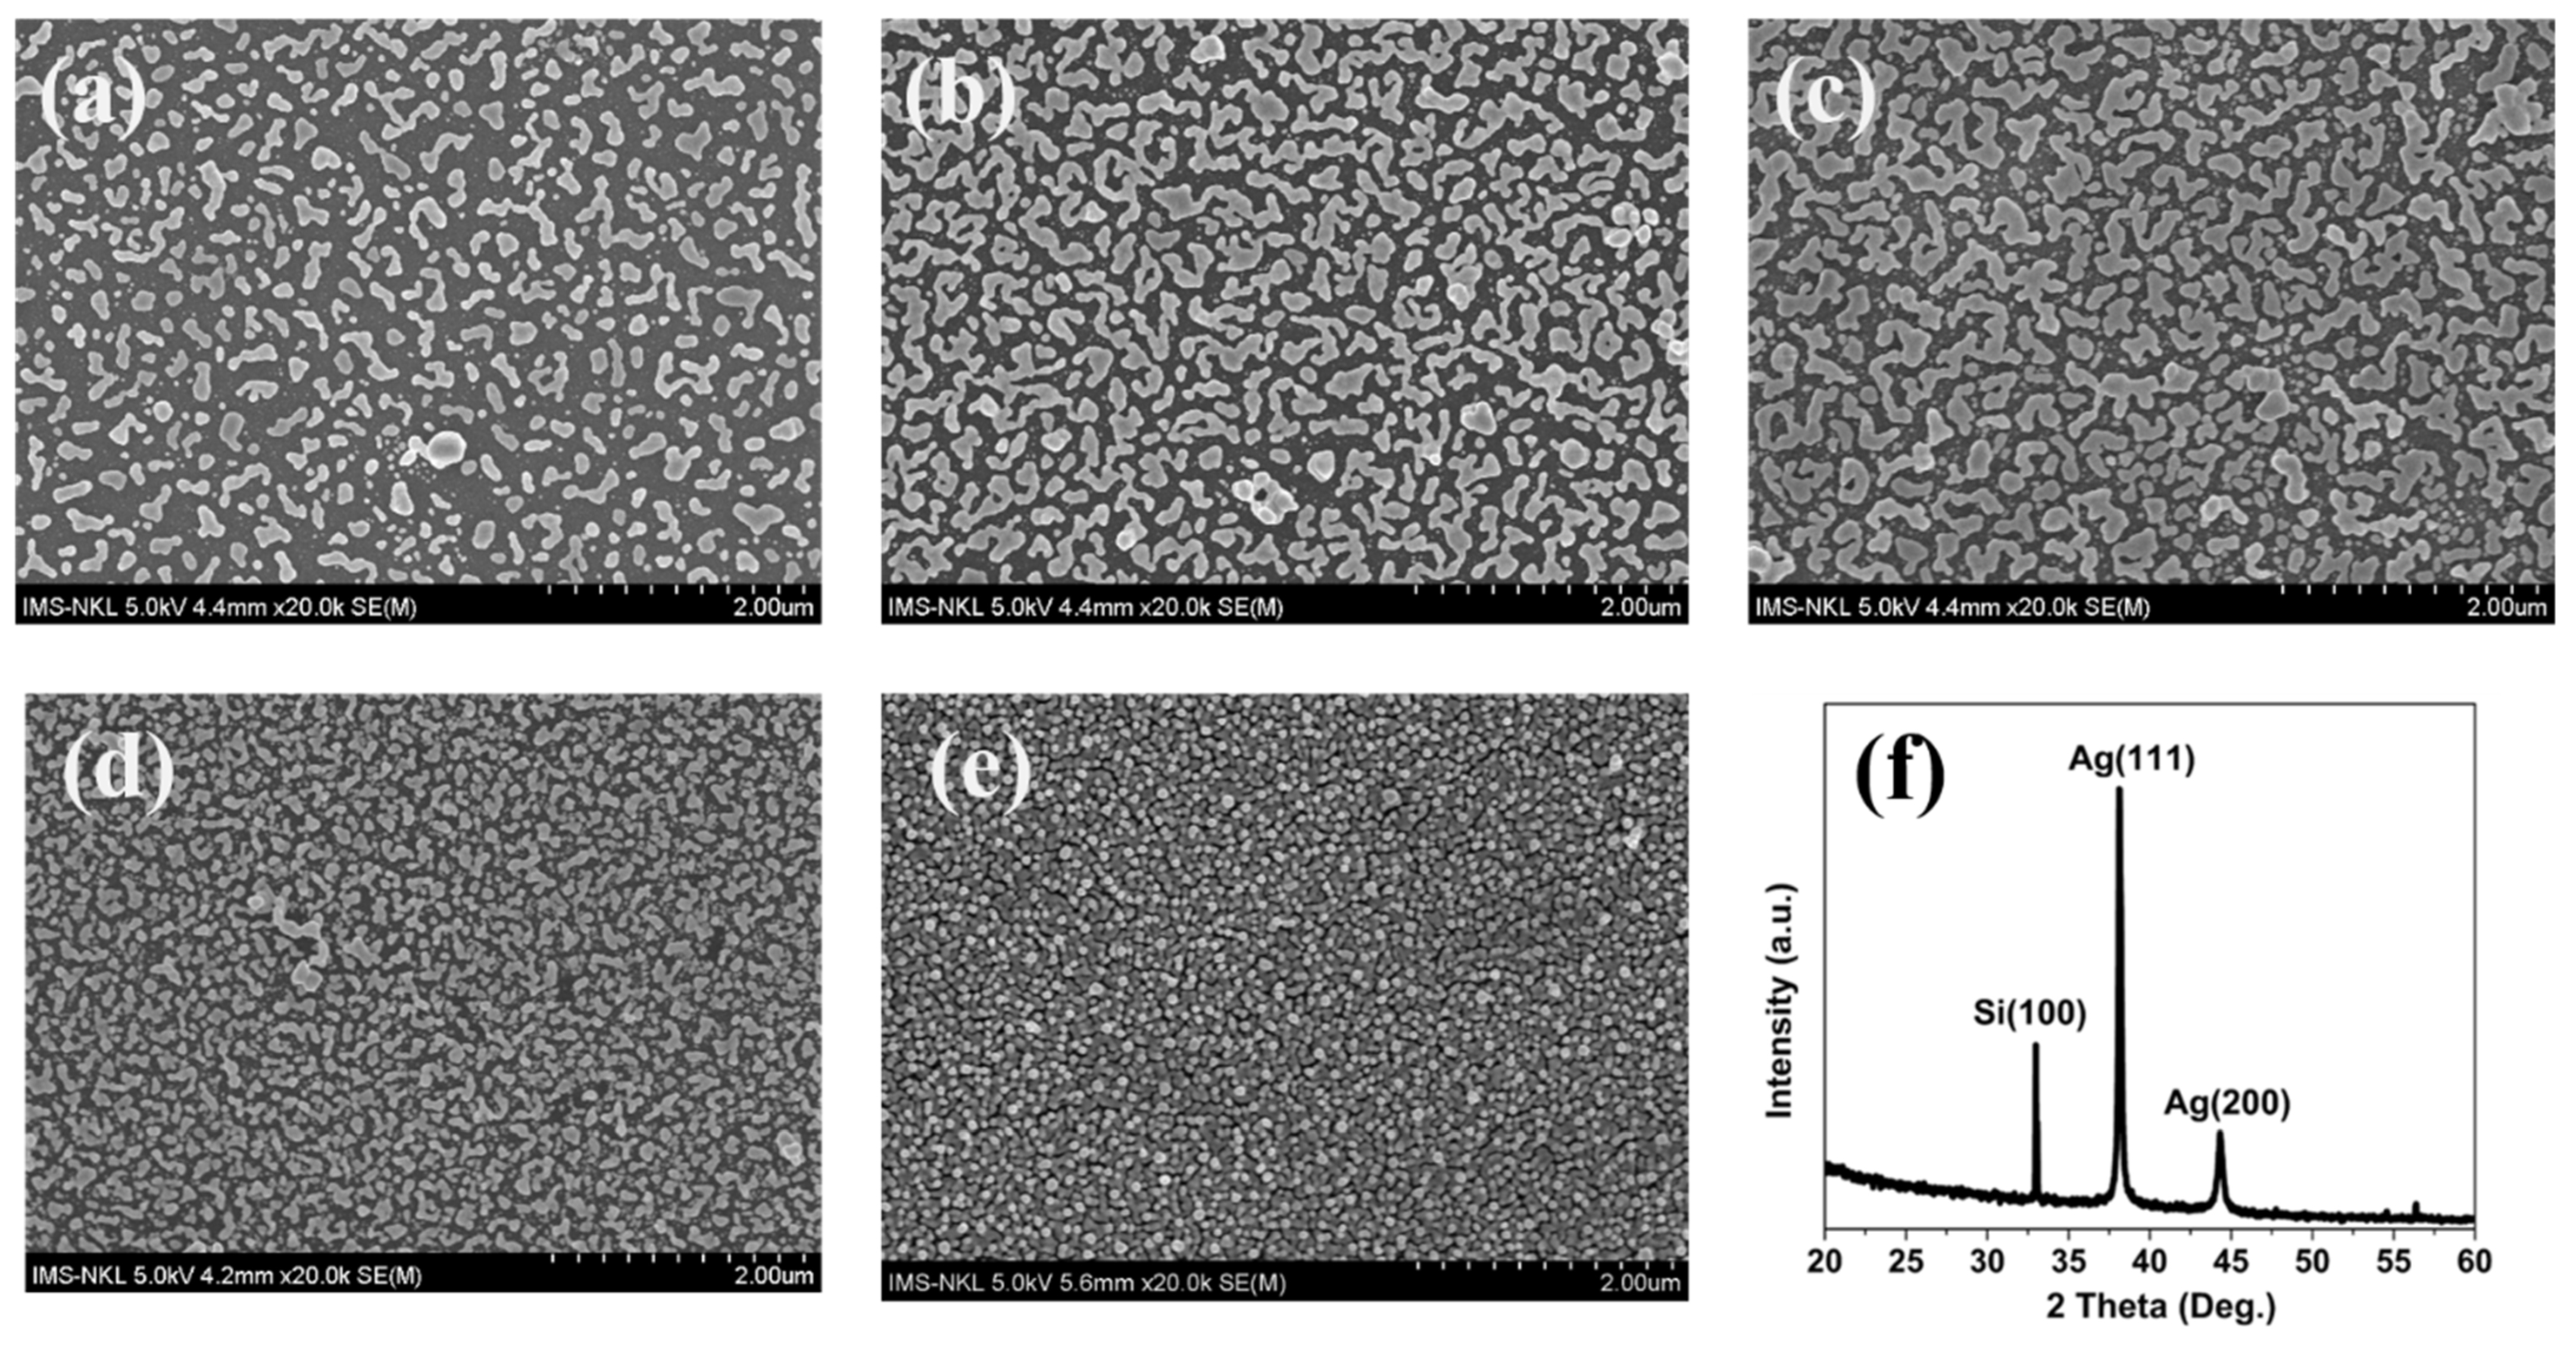
Figure 2 illustrates the evolution of the surface morphology of silver nanoparticles (Ag NPs) formed on freshly etched PSiMC substrates by immersing them in a 0.01 M AgNO3 solution at the following time intervals: 25 s, 50 s, 75 s, 100 s, and 125 s. At short deposition times of 25 s and 50 s (Figure 2a,b), AgNPs are sparsely and irregularly distributed. The nucleation process is driven by the high density of surface Si-H bonds in freshly etched PSi, resulting in particles ranging from sub-micron to nanometer sizes. However, the coverage remains incomplete, and the size distribution is broad. At 75 s (Figure 2c), the AgNPs achieve an optimal distribution for plasmonic enhancement, exhibiting a uniform size of 30–40 nm, with interparticle distances of 5–20 nm. This arrangement forms semi-continuous yet well-separated nanoparticle networks [31], maximizing the density of plasmonic “hot spots” and providing ideal conditions for strong LSPR-based SERS enhancement. Additionally, the mesoporous structure allows smaller AgNPs to embed within the pores, while larger particles anchor to the surface. The particle size and spacing were estimated from SEM images using ImageJ (version 1.54k) software by measuring multiple representative particles per sample. With longer deposition times of 100 s and 125 s (Figure 2d,e), excessive growth leads to the coalescence of Ag NPs, forming larger clusters and increased surface coverage. This morphological transition decreases nanogap density and weakens electromagnetic field concentration, potentially compromising SERS performance. The X-ray diffraction (XRD) pattern in Figure 2f, corresponding to the 75 s deposition sample, shows prominent diffraction peaks at 2θ ≈ 38.1° (Ag(111)) and 44.3° (Ag(200)), confirming the formation of crystalline silver with a face-centered cubic structure. The strong Ag(111) peak indicates a preferential orientation, consistent with thermodynamically favored growth while a weaker Si(100) peak is also visible, corresponding to the underlying silicon substrate.
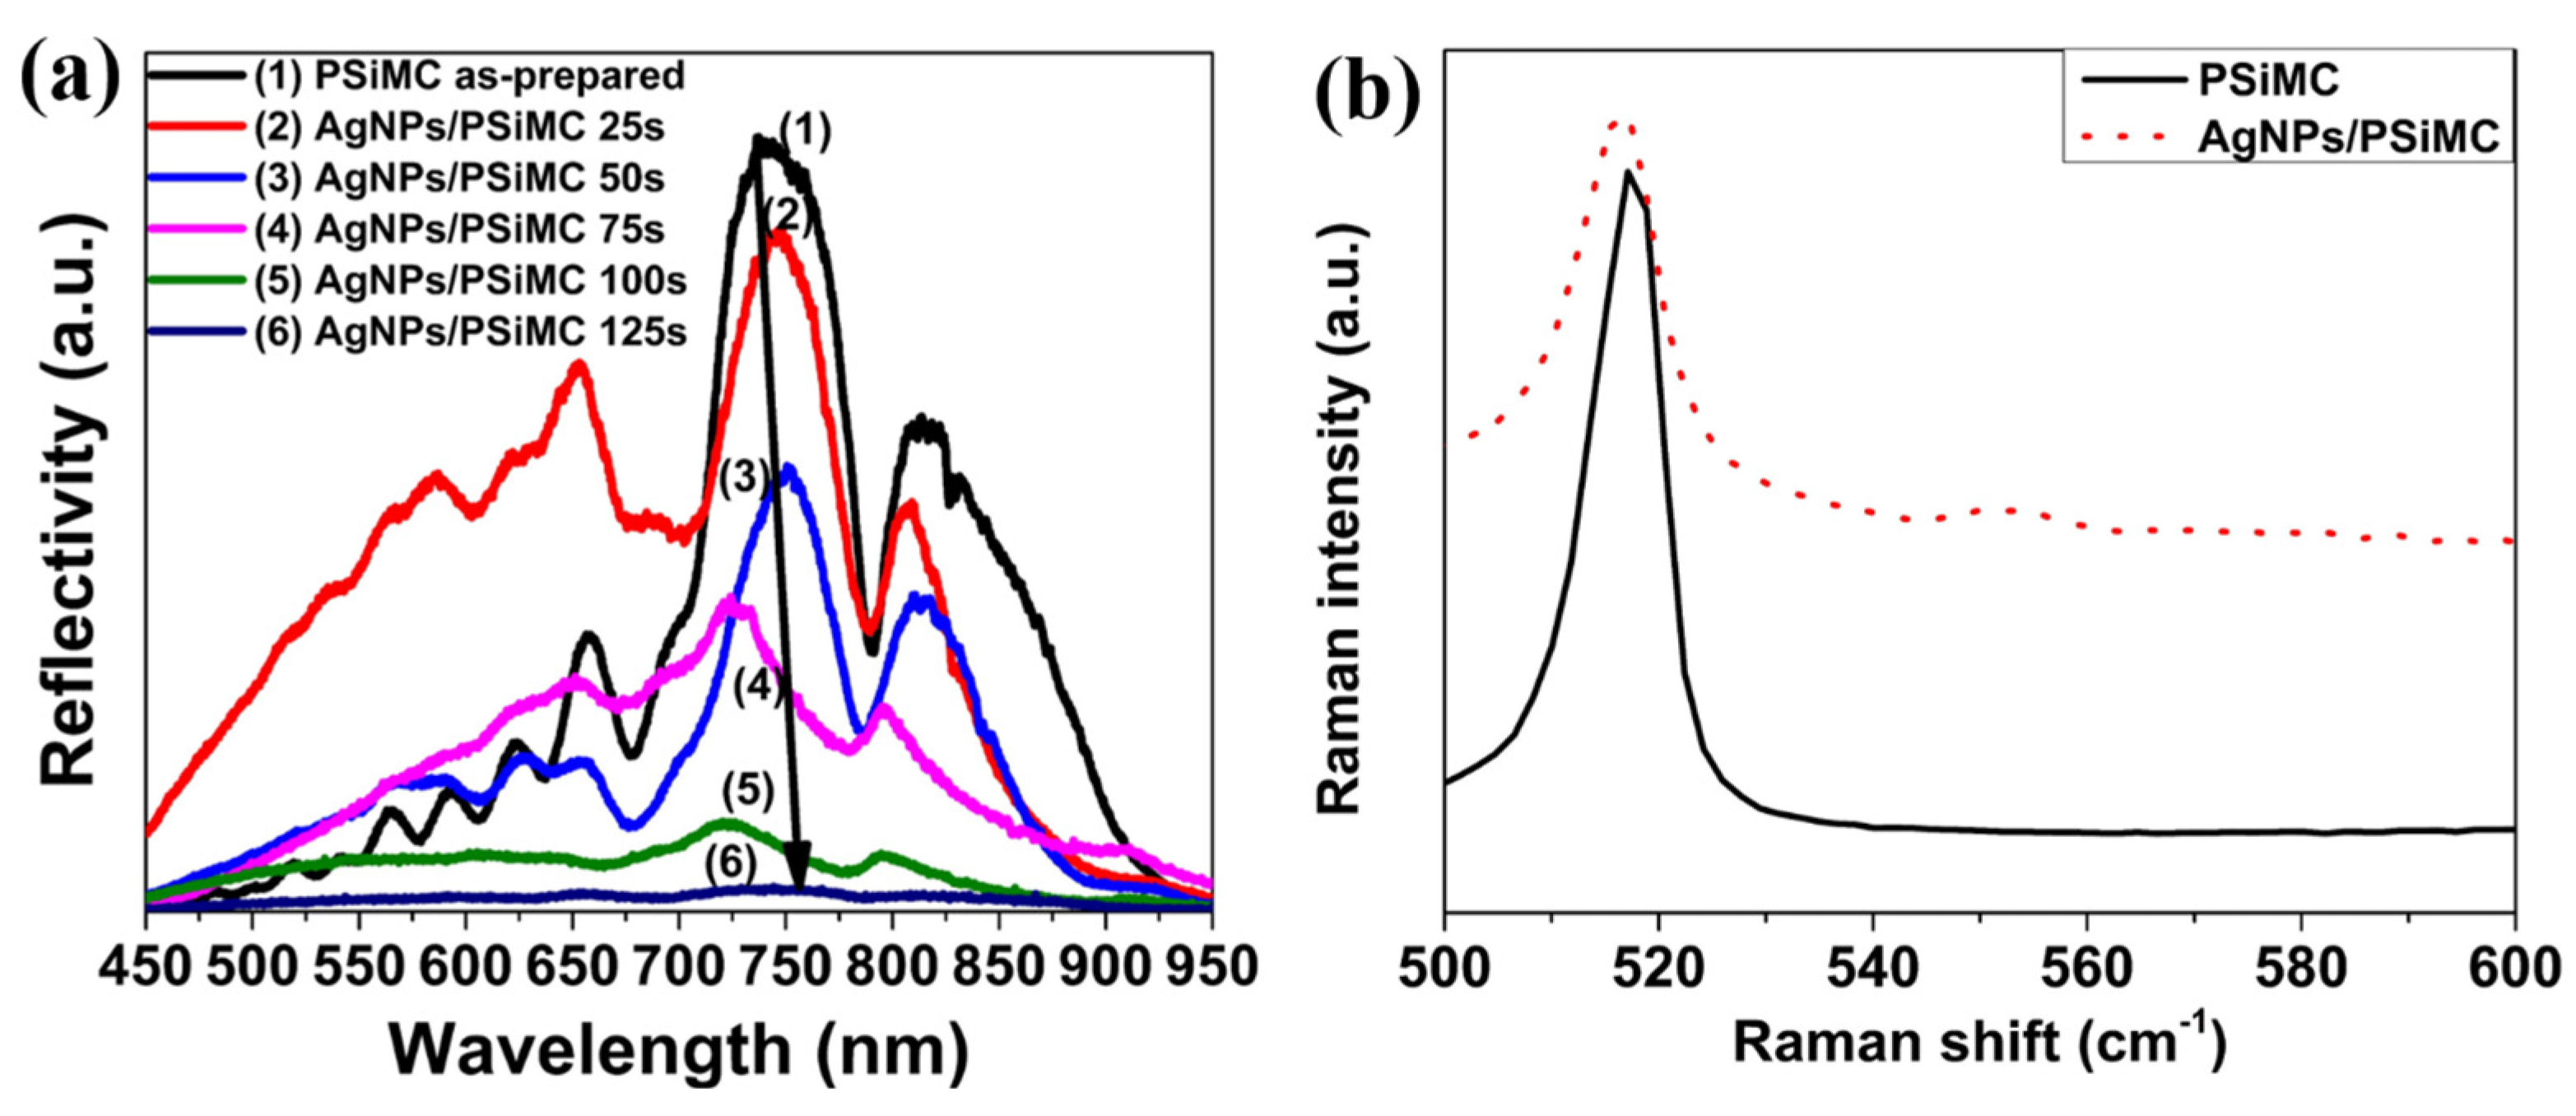
The optical response of the Ag-decorated PSiMC nanostructures was evaluated through specular reflectance measurements. Figure 3a illustrates the changes in reflectance spectra corresponding to Ag deposition times ranging from 25 to 125 s. As the deposition time increased, the cavity resonance became broader and less defined. This behavior can be attributed to the increased surface coverage by AgNPs, which disrupt the periodicity necessary for strong optical interference. Additionally, the results suggest that silver nanoparticles may infiltrate into the porous silicon matrix during longer deposition times. Notably, interference fringes remained clear for deposition times up to 75 s; however, at 100 s, the reflectance spectrum showed an almost complete loss of interference patterns. These findings are consistent with the surface structural changes observed in the SEM analysis. Figure 3b presents the Raman spectra of PSiMC samples before and after decoration with AgNPs. In both samples, a strong Raman peak is centered at approximately 520 cm−1, corresponding to the first-order optical phonon mode of crystalline silicon (c-Si). The bare PSiMC sample (black curve) shows a symmetric and sharp Raman peak, indicating minimal stress and uniform nanostructure within the as-prepared porous silicon. After AgNP decoration (red dashed curve), the Raman peak broadens significantly compared with the bare PSiMC sample. The peak broadening can be attributed to two main effects: (i) the size distribution broadening of the silicon nanostructures due to surface modifications [32], and (ii) a local temperature increase caused by plasmonic heating from the excitation of AgNPs [33]. Plasmonic nanoparticles are known to enhance local electromagnetic fields and can induce localized photothermal effects during Raman excitation, leading to phonon softening and broader Raman features.

3.2. SERS Evaluation of AgNP-Coated PSiMC Active Substrates

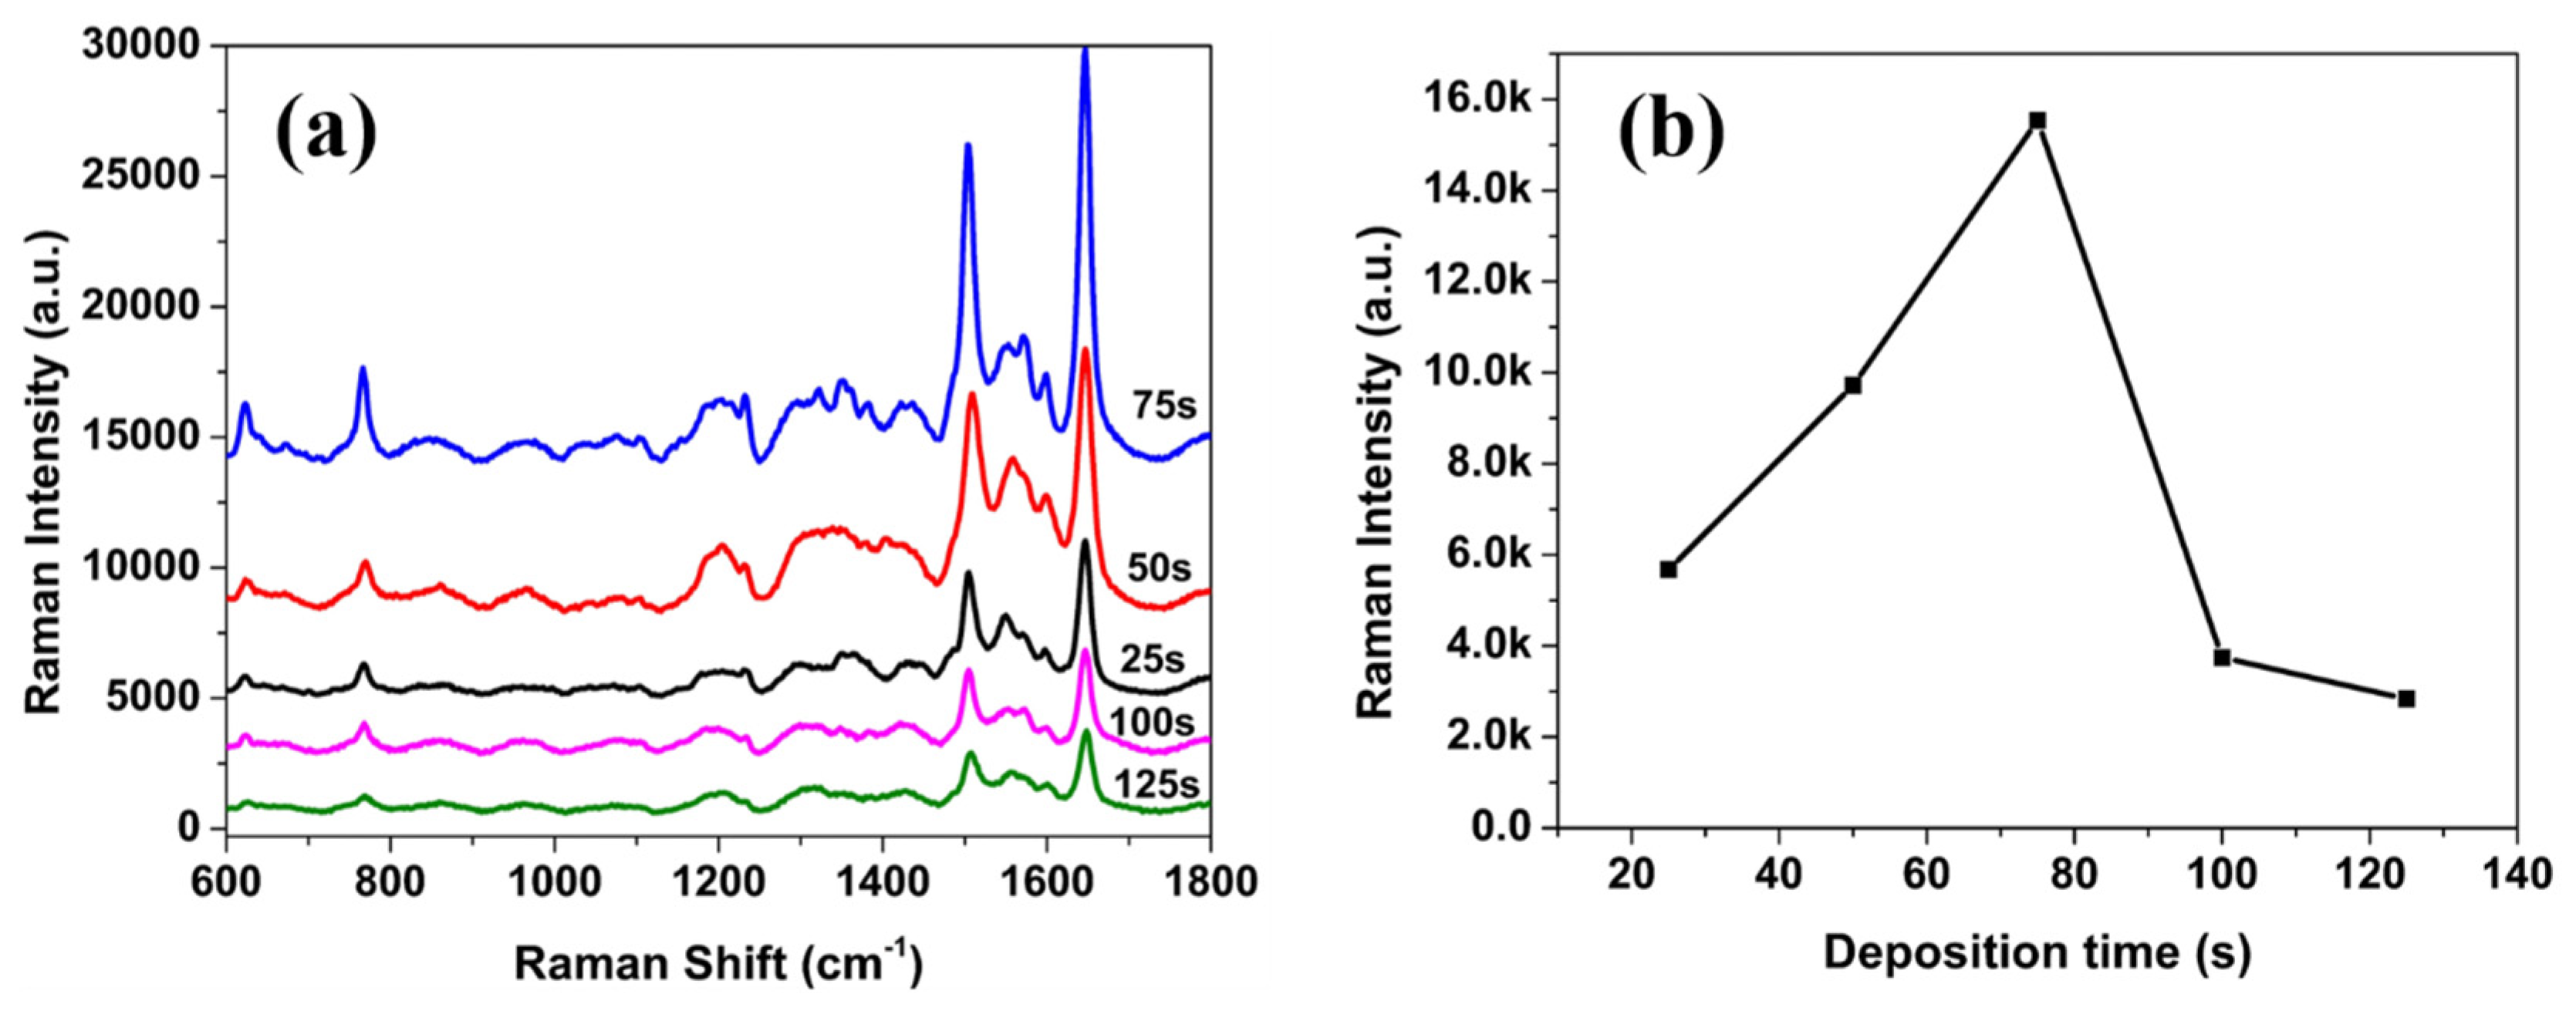
The SERS performance was first examined and evaluated using Rh101 dye as the target analyte. Figure 4a shows the SERS spectra of Rh101 (1.0 × 10⁻⁹ M) acquired from AgNP/PSiMC substrates with varying silver deposition durations in 0.01 M AgNO3 solution. The Raman signals progressively strengthen from 25 to 75 s, with a dramatic enhancement observed at 75 s. Prominent peaks, particularly around 1646 cm−1, characteristic of aromatic C=C stretching in the xanthene ring of Rh101, demonstrate the sensitivity of the plasmonic-active PSiMC substrates. This enhancement can be attributed to the optimized size and interparticle gap of silver nanoparticles at 75 s, which results in maximal localized surface plasmon resonance (LSPR) and the formation of abundant electromagnetic “hot spots.” Such conditions greatly amplify the incident and scattered Raman fields near the adsorbed Rh101 molecules. However, as the silver deposition time increases further to 100 and 125 s, the overall Raman signal declines. This attenuation is commonly linked to Ag nanoparticle overgrowth and aggregation, which reduces the effective hot spot density due to increased interparticle distances and loss of nanogap uniformity. The results correlate with the SEM observations shown in Figure 2a–e, indicating that longer immersion times lead to larger and more irregular AgNPs formations. Additionally, excessive surface coverage may lead to shadowing effects or quenching phenomena that limit light–analyte interaction [34]. Figure 4b quantifies the trend by plotting the intensity of the ~1646 cm−1 band against deposition time. The observed dependence indicates that the AgNP morphology at 75 s offers the most favorable nanostructure for SERS enhancement in detecting Rh101 at trace concentrations. These findings underscore the critical importance of controlling AgNP deposition kinetics when engineering nanostructured SERS substrates for the efficient detection of fluorescent dyes such as Rh101. Table 2 illustrates the characteristic Raman peaks of Rh101. The intensity of the peak at 1646 cm−1 was selected as the parameter by which to characterize the SERS signals.
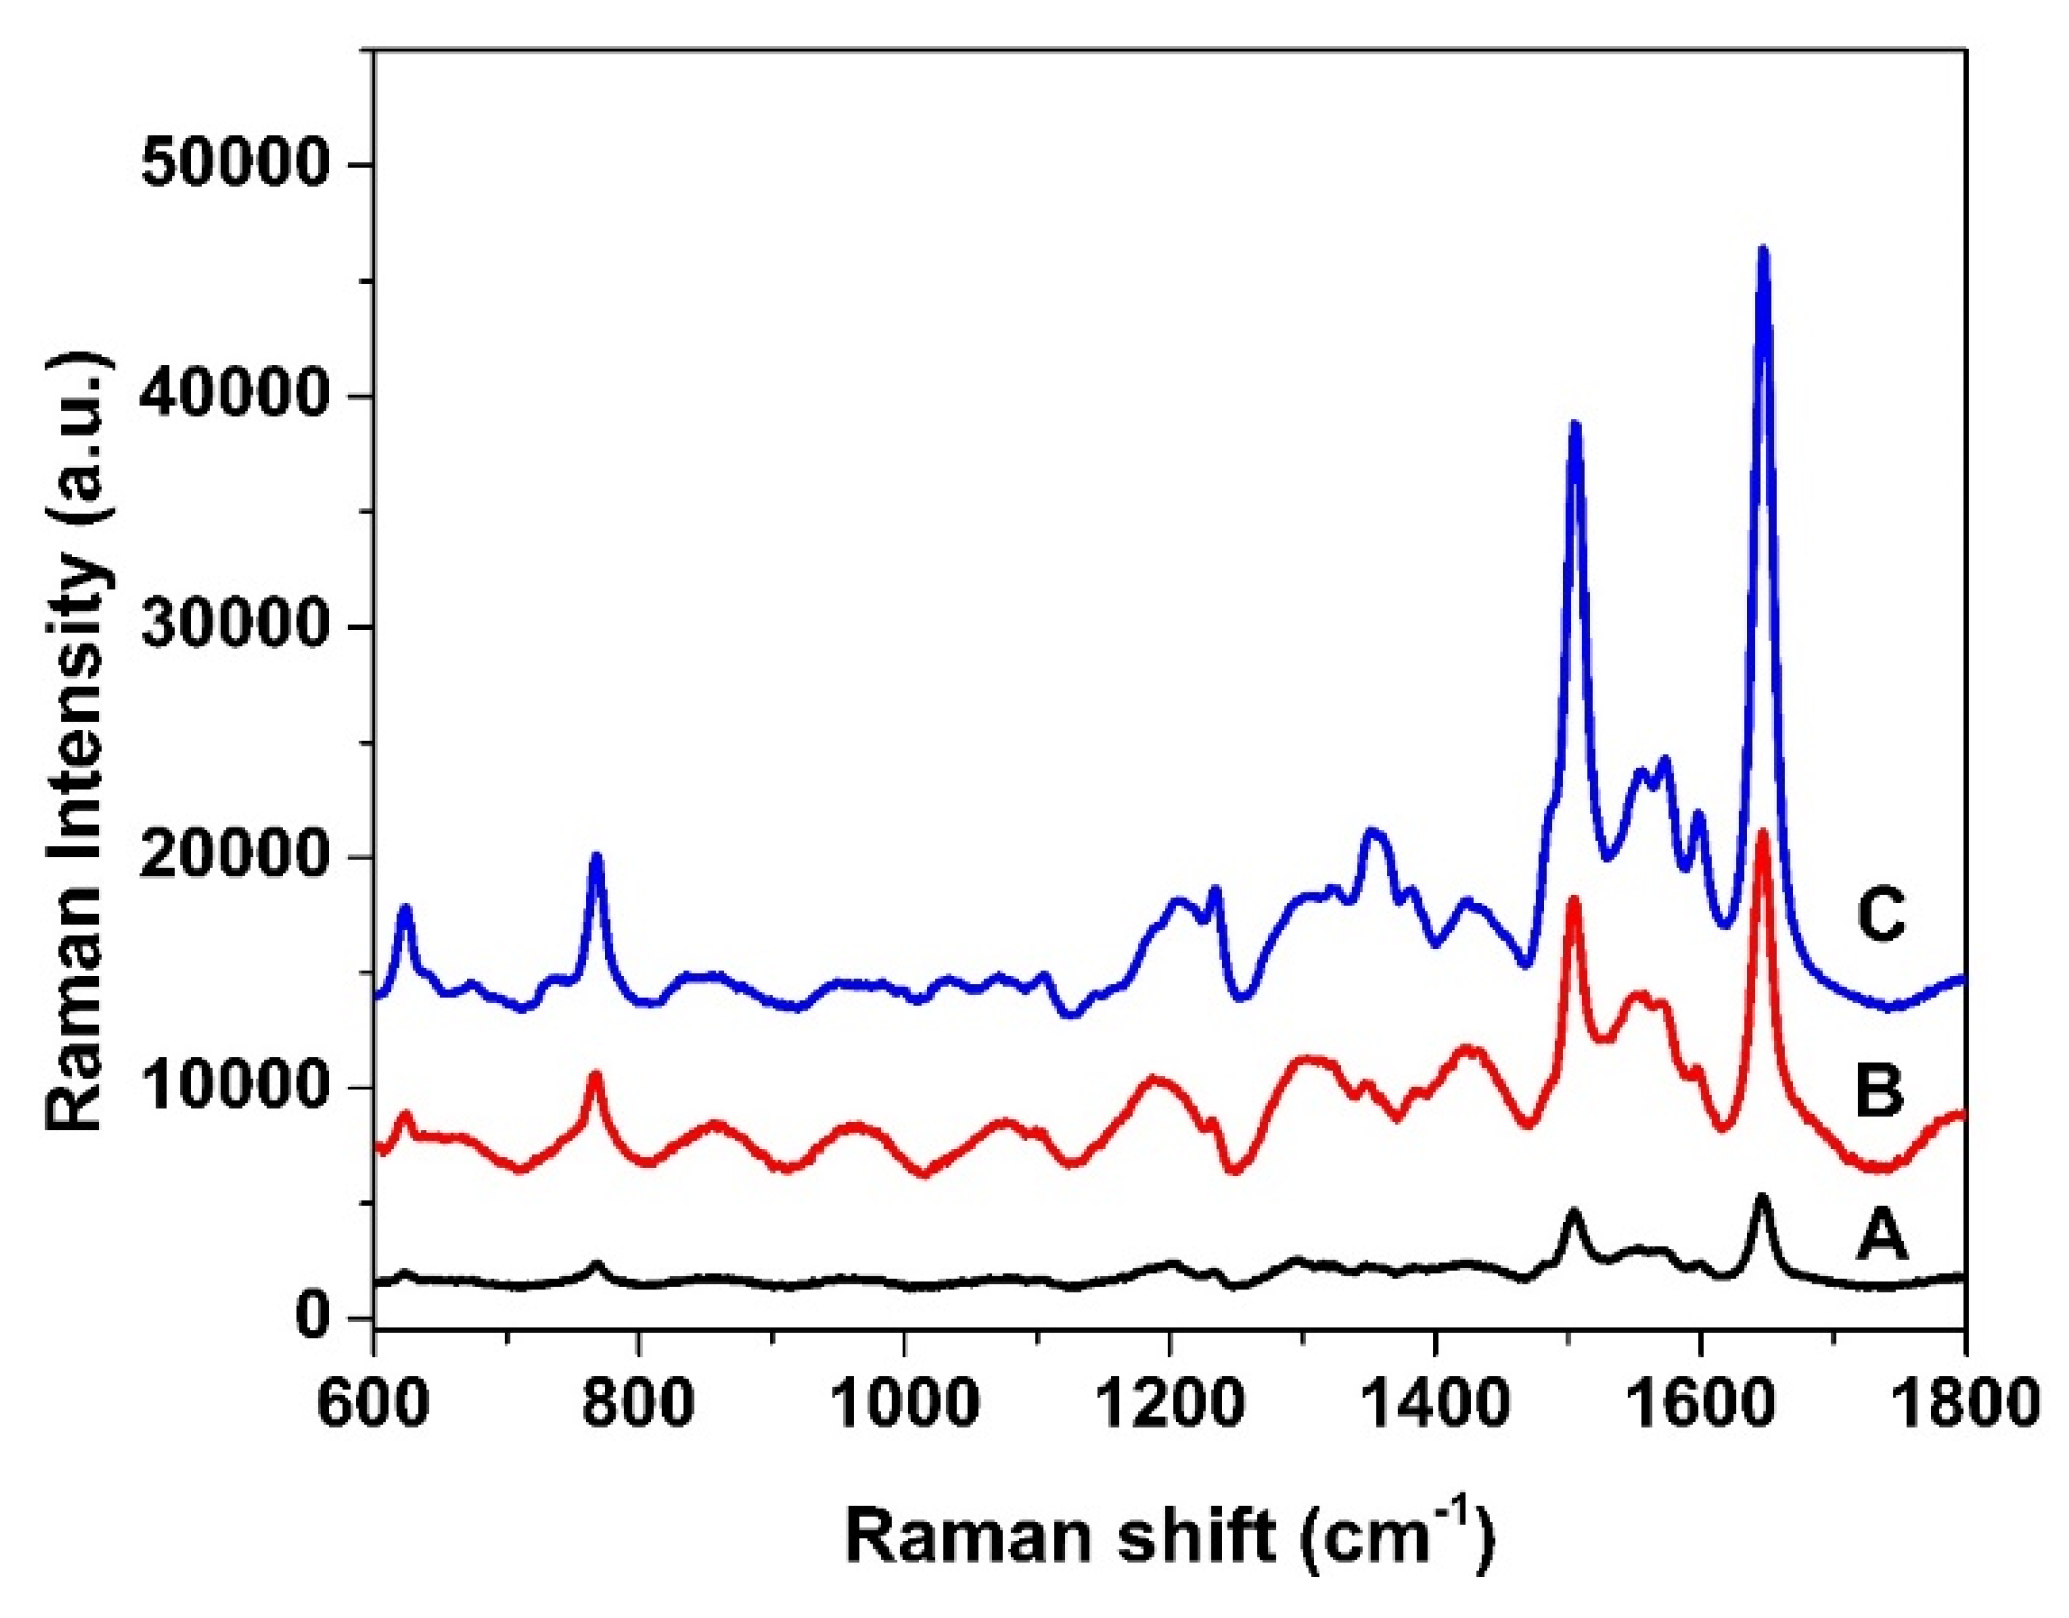
Figure 5 illustrates the observed variation in Raman intensity among the three PSi-based substrates: single-layer (A), photonic crystal (B), and microcavity (C). This variation is primarily attributed to differences in the surface electric field distribution after AgNP deposition. It is well established that photonic crystal structures, due to their periodic multilayer configuration, can support photonic band-gap effects and spatially confine the optical field near the surface [38,39]. This optical field confinement enhances the localized surface plasmon resonance (LSPR) effect when noble metal nanoparticles are present, resulting in stronger electromagnetic enhancement and improved SERS performance. Compared with the single-layer substrate, the photonic crystal substrate exhibits significantly stronger Raman signals, despite comparable porosity in their low-index layers. This suggests that the enhancement is primarily due to electromagnetic effects rather than differences in molecular adsorption. Moreover, the microcavity structure, which introduces a resonant cavity within the photonic crystal framework, demonstrates the highest Raman intensities [40,41]. This can be attributed to further enhancement of light–matter interactions and the formation of highly localized electromagnetic “hot spots” at the AgNP interface. Therefore, these results confirm the critical role of surface field localization and optical confinement in enhancing SERS signals and underscore the superiority of microcavity and photonic crystal architectures in developing high-sensitivity SERS-active substrates.
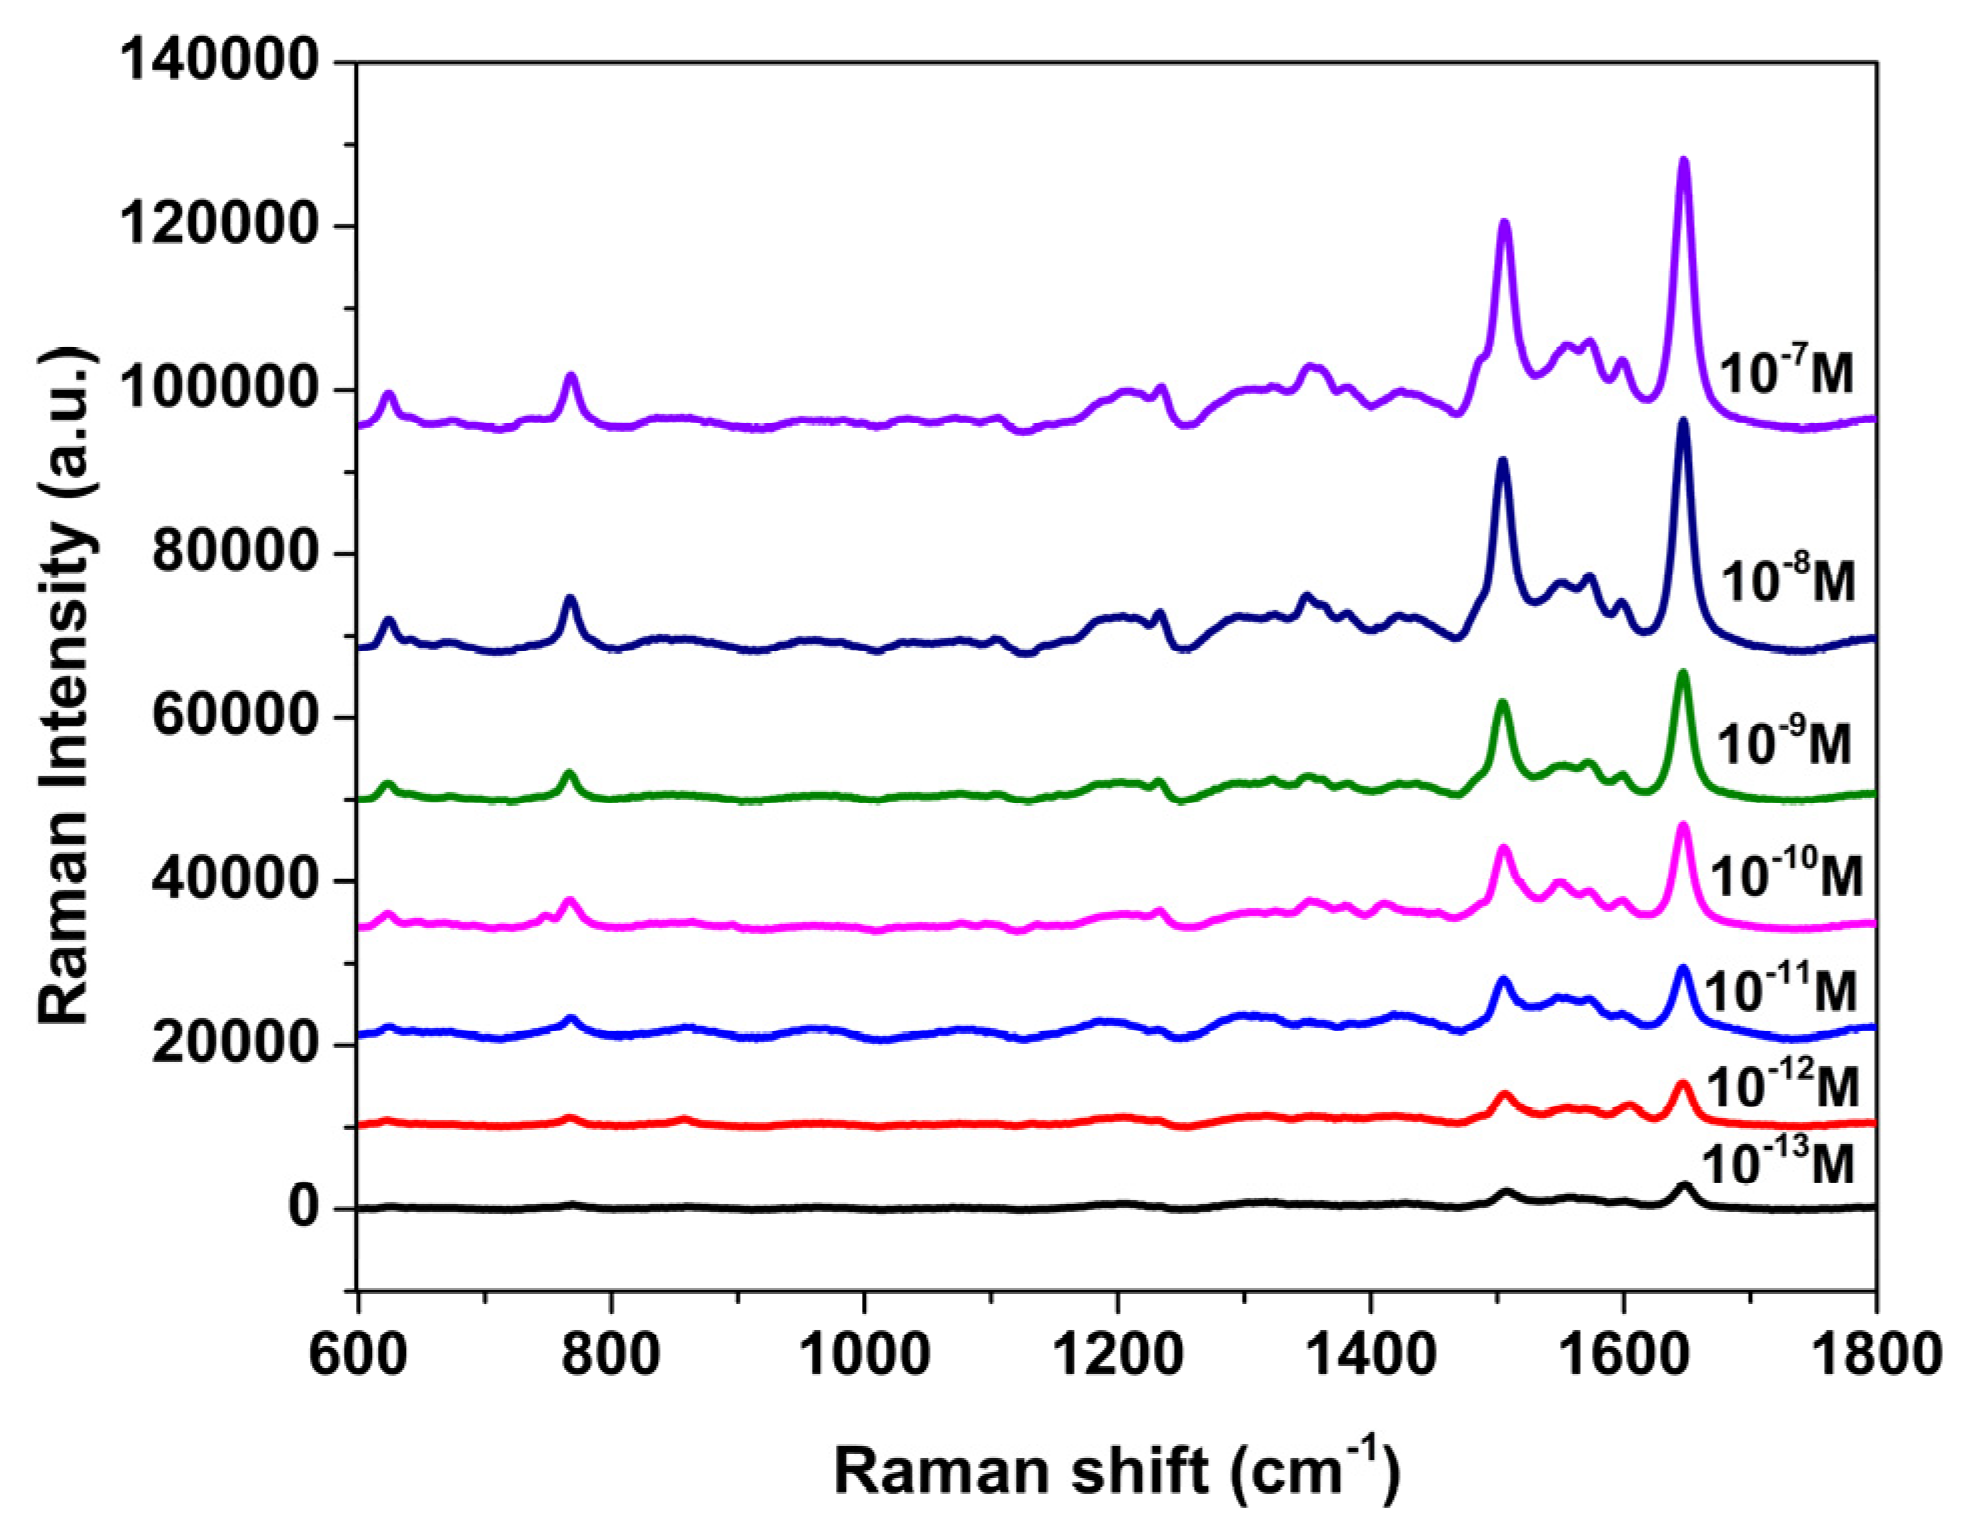
The detection limit is one of the key parameters used to evaluate the performance of a SERS-active substrate, as it reflects the lowest analyte concentration at which a Raman signal can be reliably detected. To characterize the sensitivity of the AgNP/PSiMCsubstrates, Rh101 was used as the probe molecule in a concentration range from 1.0 × 10⁻⁷ M to 1.0 × 10⁻¹³ M. PSiMC samples were immersed in 0.01 M AgNO3 aqueous solution for 75 s prior to measurement. As shown in Figure 6, a gradual increase in Raman intensity was observed as the Rh101 concentration increased. Importantly, distinguishable characteristic peaks of Rh101, particularly near 1350 cm−1 and 1648 cm−1, remained detectable above the noise level at concentrations as low as 1.0 × 10⁻¹³ M, indicating the high sensitivity of the AgNP/PSiMC substrate. In this work, the detection limit refers to the lowest Rh101 concentration that yielded a signal-to-noise ratio (S/N) greater than 3 [42,43,44]. These results demonstrate the remarkable sensitivity of the PSiMC-based SERS platform and its suitability for ultra-trace molecular detection in future chemical or biosensing applications.
Quantifying the signal enhancement in SERS typically involves calculating the enhancement factor (EF), which requires knowledge of both the Raman intensity and the number of analyte molecules within the laser excitation volume as the following formula [28]:
E F = I A g / P S i / N A g / P S i I S i / N S i
where I refers to the measured Raman signal intensity and N represents the quantity of Rh101 molecules present within the region exposed to the laser beam. The notation Ag/PSi corresponds to a PSiMC substrate modified with AgNPs, whereas Si indicates an unmodified silicon substrate.
For porous silicon substrates, determining the exact number of analyte molecules within the irradiated area is practically difficult due to the complex internal structure. As a result, Equation (1) is not applicable for directly calculating the enhancement factor of AgNP/PSiMC substrates. To address this, a widely used alternative, external amplification Raman efficiency, is employed [34]. This method evaluates the enhancement by calculating the ratio between the minimum detectable concentration of analyte on the Ag-coated PSiMC substrate and that of a bare Si substrate. For flat Si substrates, the lowest detectable concentration of Rh101 using the immersion method is approximately 1.0 × 10⁻² M. In comparison, on the AgNP/PSiMC substrate, Rh101 can be detected down to 1.0 × 10⁻¹³ M, as confirmed by the experimental results. Therefore, the amplification Raman efficiency for the AgNP/PSiMC substrate is 1011.
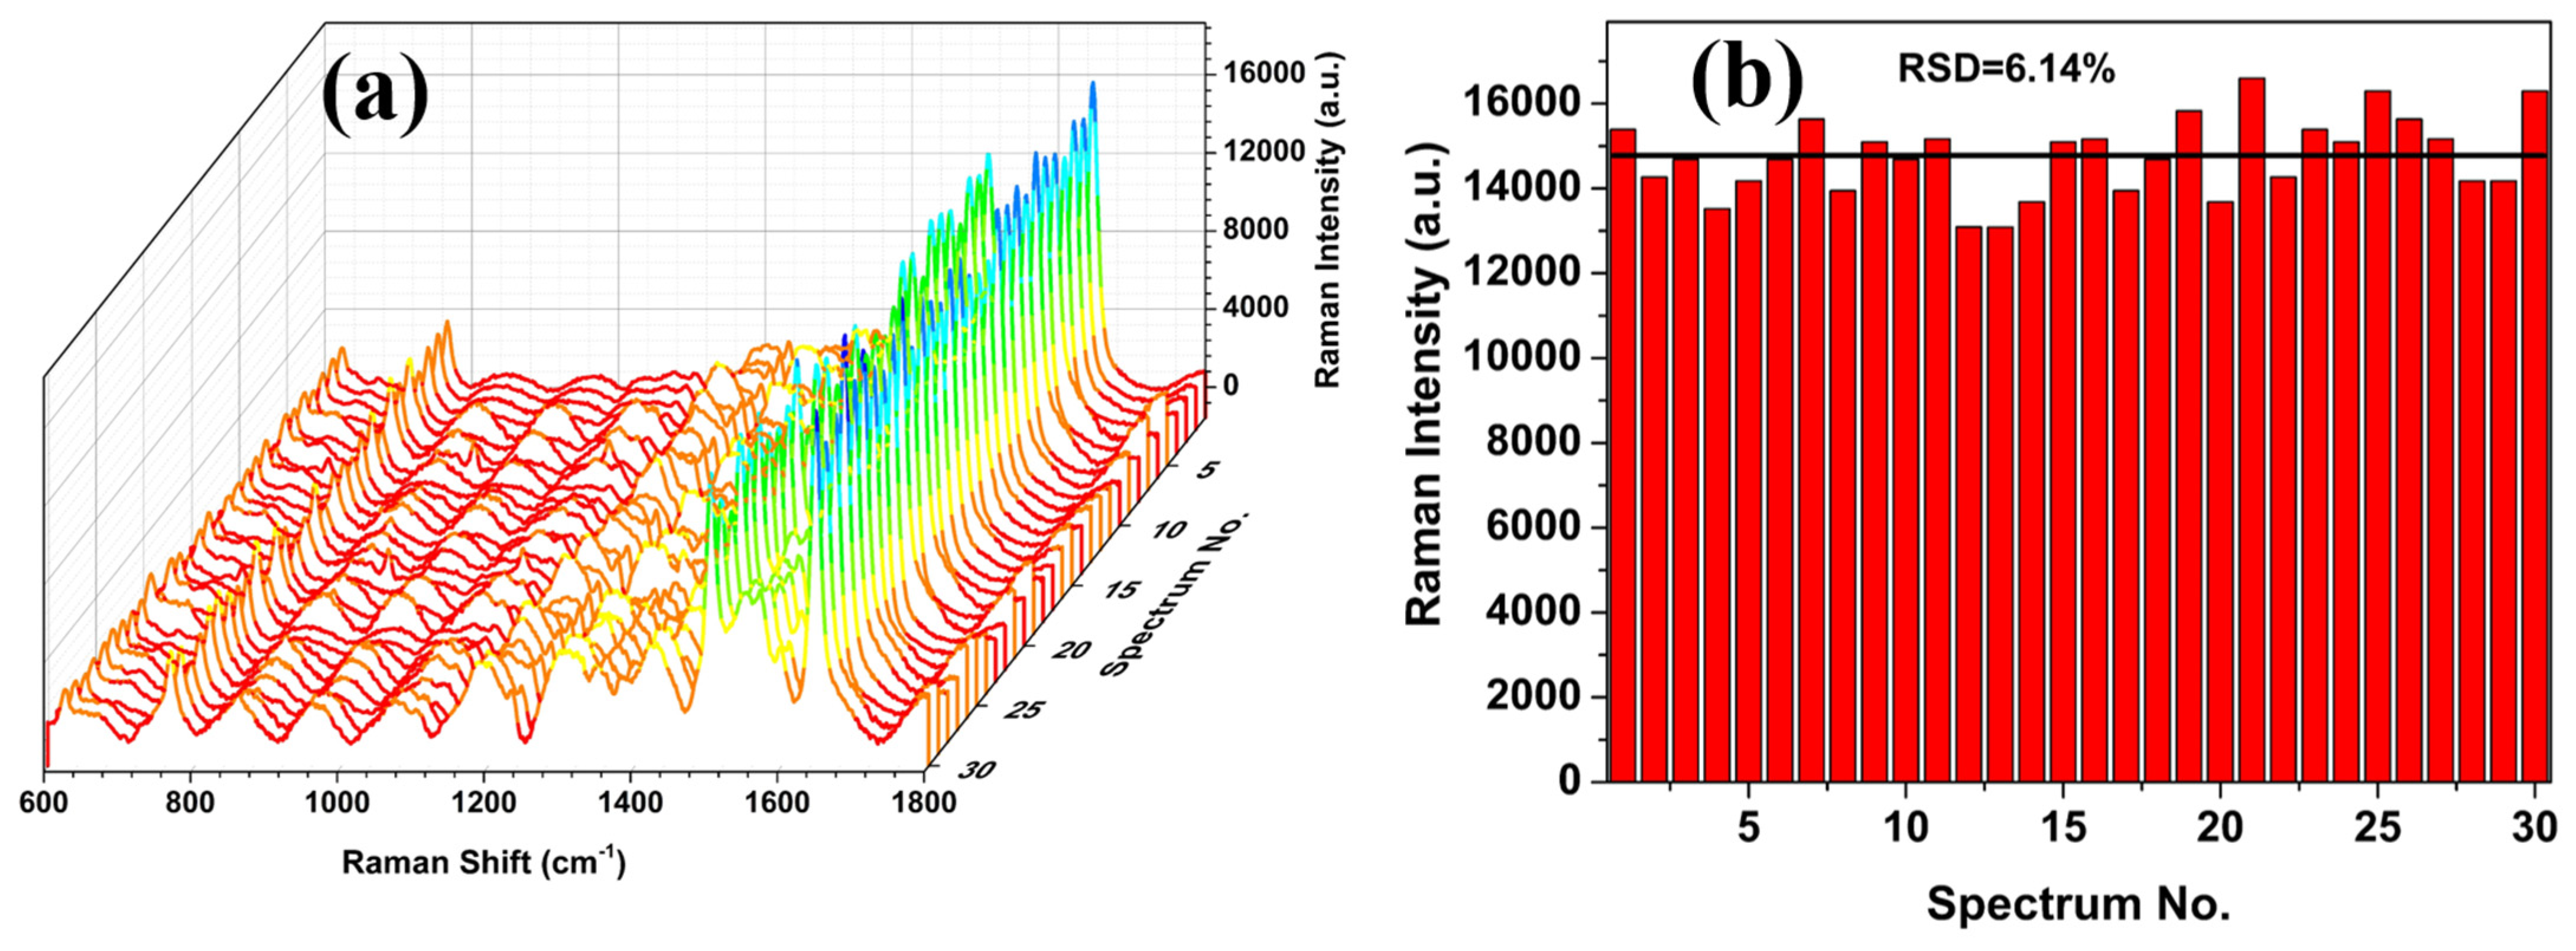
To assess the reproducibility of the AgNP/PSiMC substrate, SERS spectra of Rh101 (10−9 M) were collected from thirty randomly selected positions from three independently prepared substrates, all measured under the same experimental conditions. As shown in Figure 7, the SERS signals exhibited similar intensity, demonstrating the uniformity of SERS enhancements across the entire surface of the AgNP/PSiMC substrates. The calculated relative standard deviation (RSD) of 6.14% at the 1646 cm−1 peak confirms good signal uniformity, indicating reliable fabrication and homogenous AgNP deposition. This level of reproducibility highlights the substrate’s potential for practical SERS applications that require both sensitivity and consistency.
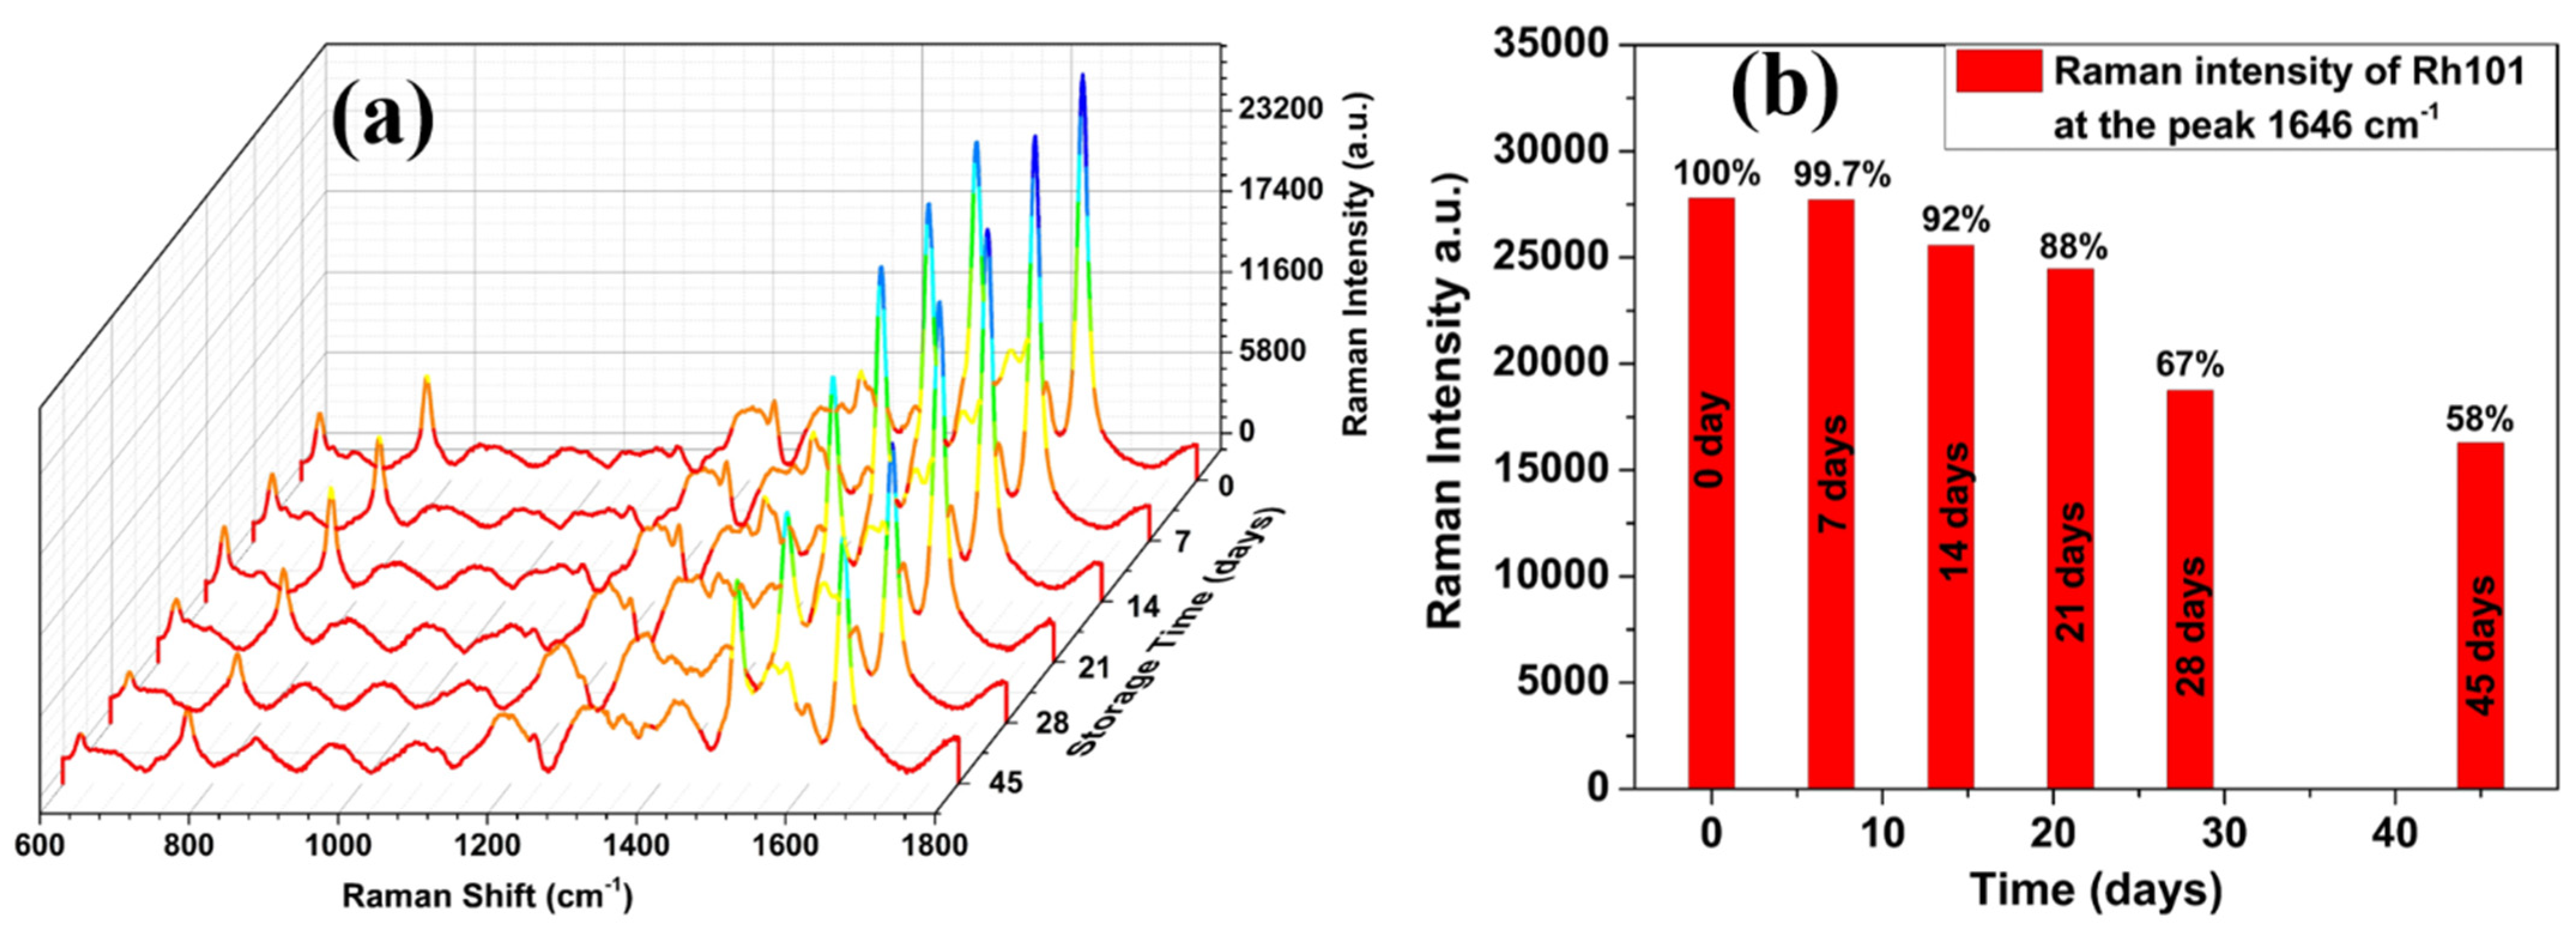
The long-term stability of the AgNP/PSiMC SERS substrate was evaluated through a systematic aging test. Six samples were fabricated following the same protocol. One freshly prepared sample was used to adsorb Rh101 10−8 M directly, while the remaining five were stored in a vacuum desiccator, protected from light, for 7, 14, 21, 28, and 45 days, respectively. After each storage period, the aged samples were treated with Rh101 under the same conditions as the fresh one, and their Raman spectra were recorded. As shown in Figure 8a, the characteristic Raman peak at 1646 cm−1 remained visible across all storage durations, although a gradual decline in intensity was observed over time. Figure 8b presents the intensity variation at this peak, with the substrate maintaining approximately 99.7%, 92%, 88%, 67%, and 58% of the initial signal intensity after 7, 14, 21, 28, and 45 days, respectively. Notably, the Raman signal retained more than 50% of its original intensity even after four weeks of storage. These results confirm that the AgNP/PSiMC substrate exhibits excellent storage stability and reproducibility, making it a reliable platform for practical SERS applications in trace-level detection.

3.3. Detection of Methyl Parathion on SERS Active Substrate

Methyl parathion (MP) is a highly toxic organophosphorus pesticide widely used in agriculture to control insect pests. Despite its effectiveness, its persistence in the environment and strong neurotoxicity pose significant threats to human health and ecological safety. MP can accumulate in soil, water sources, and agricultural produce, including vegetables and fruits, entering the food chain and potentially leading to chronic exposure. Prolonged contact with trace levels of this compound has been linked to severe health effects, including disruption of the nervous system, reproductive toxicity, and carcinogenic risks. In this work, we utilize AgNP/PSiMC substrates as an effective SERS-active platform for detecting MP residues.
Figure 9 displays the Raman spectra of MP measured on the AgNP/PSiMC substrate across a series of concentrations ranging from 1.0 × 10⁻⁶ M to 1.0 × 10⁻¹⁰ M. As the concentration decreased, a consistent decline in Raman signal intensity was observed, confirming the substrate’s ability to capture variations in analyte concentration. Three prominent peaks located at 855.68 cm−1, 1327.84 cm−1, and 1601.31 cm−1 were clearly distinguishable at all tested concentrations, corresponding to the NO2 bending, P=O and CH3 stretching, and C=C aromatic ring stretching vibrations, respectively [45,46,47]. Notably, even at the lowest concentration of 10−10 M, the peak at 1327.84 cm−1 remained clearly identifiable above the noise level, satisfying the SERS criterion of a signal-to-noise ratio (S/N) > 3. This result confirms the excellent sensitivity of the AgNP/PSiMC platform for trace detection of MP, achieving detection down to the sub-nanomolar level. The clear and reproducible spectral features across multiple orders of magnitude further demonstrate the strong enhancement capability and reproducibility of the developed SERS substrate.
Table 3 presents a comparison of detection limits, excitation wavelengths, and Raman systems used in recent studies on methyl parathion detection. Among these, the AgNP/PSiMC substrate demonstrated a superior detection limit of 1.0 × 10⁻¹⁰ M, surpassing or matching several state-of-the-art nanostructured SERS platforms. This enhanced sensitivity is attributed to the strong localized electromagnetic field and effective plasmonic confinement within the microcavity structure. These results highlight the AgNP/PSiMC substrate as a promising SERS platform for ultra-trace detection of pesticide residues in food safety and environmental monitoring.

4. Conclusions

We have successfully developed a highly sensitive and reproducible SERS substrate by integrating silver nanoparticles onto porous silicon microcavity (PSiMC) structures. The synergistic interaction between plasmonic AgNPs and photonic confinement within the microcavity architecture significantly enhances Raman signal intensity and detection performance. The AgNP/PSiMC substrate demonstrated excellent sensitivity toward Rhodamine 101, achieving a detection limit as low as 1.0 × 10⁻¹³ M, and enabled reliable detection of the organophosphorus pesticide methyl-parathion down to 1.0 × 10⁻¹⁰ M. In addition to its high analytical sensitivity, the platform exhibited superior signal reproducibility (RSD of 6.14%) and good long-term stability. These findings establish the AgNP/PSiMC substrate as a promising SERS platform for environmental monitoring, food safety assessment, and the detection of hazardous trace compounds in complex matrices.

Author Contributions

Conceptualization, writing—original draft preparation, funding acquisition, T.V.N.; writing—review and editing, V.H.P. (Van Hoi Pham); methodology, sample characterization, formal analysis, M.T.H., H.B., T.H.C.H., V.H.P. (Van Hai Pham), N.T.L., L.V.L., T.B.P., C.V.D. and T.C.D.; funding acquisition, T.J.K. All authors have read and agreed to the published version of the manuscript.

Funding

This research was funded by the Vietnam Academy of Science and Technology (Grant No. VAST03.07/23-24). Additionally, this research was funded by the National Research Foundation of Korea (NRF) grant funded by the Korean Government (MSIP) (RS-2020-NR049536).

Data Availability Statement

The data presented in this study are available on request from the corresponding author.

Conflicts of Interest

The authors declare no conflicts of interest.

References

  1. Suleimenova, A.; Frasco, M.F.; Sales, M.G.F. An ultrasensitive paper-based SERS sensor for detection of nucleolin using silver-nanostars, plastic antibodies and natural antibodies. Talanta 2024, 279, 126543. [Google Scholar] [CrossRef] [PubMed]
  2. Serebrennikova, K.V.N.; Komova, N.S.; Zherdev, A.V.; Dzantiev, B.B. SERS Sensors with Bio-Derived Substrates Under the Way to Agricultural Monitoring of Pesticide Residues. Biosensors 2024, 14, 573. [Google Scholar] [CrossRef] [PubMed]
  3. Xia, L.; Qi, X.; Yu, H.; Li, Y. Surface-enhanced Raman spectroscopy in pharmaceutical analysis: From component determination to mechanism research. Microchim. Acta 2025, 192, 211. [Google Scholar] [CrossRef] [PubMed]
  4. Mazur, N.; Dzhagan, V.; Kapush, O.; Isaieva, O.; Demydov, P.; Lytvyn, V.; Chegel, V.; Kuklaa, O.; Yukhymchuka, V. SERS of nitro group compounds for sensing of explosives. RSC Adv. 2025, 15, 252–260. [Google Scholar] [CrossRef]
  5. Mahadev, A.P.; Kavitha, C.; Perutil, J.R.; John, N.S. Synergistic SERS Enhancement of Highly Sensitive and Reusable rGO-Ag-ZrO2 Thin Film Nanocomposite to Detect Synthetic Textile Dyes. Langmuir 2025, 41, 2411–2426. [Google Scholar] [CrossRef]
  6. Fu, S.-Y.; Hsu, Y.-K.; Chen, M.-H.; Chuang, C.-J.; Chen, Y.-C.; Lin, Y.-G. Silver-decorated hierarchical cuprous oxide micro/nanospheres as highly effective surface-enhanced Raman scattering substrates. Opt. Express 2014, 22, 14617–14624. [Google Scholar] [CrossRef]
  7. Segervald, J.; Malyshev, D.; Öberg, R.; Zäll, E.; Jia, X.; Wågberg, T.; Andersson, M. Ultra-Sensitive Detection of Bacterial Spores via SERS. ACS Sens. 2025, 10, 1237–1248. [Google Scholar] [CrossRef]
  8. Park, M.; Kim, Y.-S.; Kim, S.; Lim, J.Y. Ultra-sensitive, on-site pesticide detection for environmental and food safety monitoring using flexible cellulose nano fiber/Au nanorod@Ag SERS sensor. J. Hazard. Mater. 2025, 487, 137197. [Google Scholar] [CrossRef]
  9. Kang, R.H.; Baek, S.W.; Oh, C.-K.; Kim, Y.H.; Kim, D. Recent Advances of Macrostructural Porous Silicon for Biomedical Applications. ACS Appl. Mater. Interfaces 2025, 17, 5609–5626. [Google Scholar] [CrossRef]
  10. Mebed, A.M.; Abd-Elnaiem, A.M.; Malsche, W.D. Influence of Anodizing Parameters on the Electrochemical Characteristics and Morphology of Highly Doped P-type Porous Silicon. Silicon 2021, 13, 819–829. [Google Scholar] [CrossRef]
  11. Pyatilova, O.V.; Gavrilov, S.A.; Shilyaeva, Y.I.; Pavlov, A.A.; Shaman, Y.P.; Dudin, A.A. Influence of the doping type and level on the morphology of porous Si formed by galvanic etching. Semiconductors 2017, 51, 173–177. [Google Scholar] [CrossRef]
  12. Ghaderi, A.; Sabbaghzadeh, J.; Dejam, L.; Pour, G.B.; Moghimi, E.; Matos, R.S.; Filho, H.D.D.F.; Țălu, Ș.; Shayegan, A.S.; Aval, L.F.; et al. Nanoscale morphology, optical dynamics and gas sensor of porous silicon. Sci. Rep. 2024, 14, 3677. [Google Scholar] [CrossRef] [PubMed]
  13. Sánchez-Salcedo, R.; Sharma, P.; Voelcker, N.H. Advancements in Porous Silicon Biosensors for Point of Care, Wearable, and Implantable Applications. ACS Appl. Mater. Interfaces 2025, 17, 2814–2843. [Google Scholar] [CrossRef]
  14. Lujan-Cabrera, I.A.; Anaya, E.K.R.; Sierra, J.A.R.; De Paz, J.P.Z.; Isaza, C.; Ramirez-Gutierrez, C.F. Thermal Stability and Optical Behavior of Porous Silicon and Porous Quartz Photonic Crystals for High-Temperature Applications. Photonics 2025, 12, 94. [Google Scholar] [CrossRef]
  15. Sampath, S.; Maydannik, P.; Ivanova, T.; Shestakova, M.; Homola, T.; Bryukvin, A.; Sillanpää, M.; Nagumothu, R.; Alagan, V. Efficient solar photocatalytic activity of TiO2 coated nano-porous silicon by atomic layer deposition. Superlattices Microstruct. 2016, 97, 155–166. [Google Scholar] [CrossRef]
  16. Tsao, C.-W.; Zheng, Y.-S.; Sun, Y.-S.; Cheng, Y.-C. Surface-enhanced Raman scattering (SERS) spectroscopy on localized silver nanoparticle-decorated porous silicon substrate. Analyst 2021, 146, 7645–7652. [Google Scholar] [CrossRef]
  17. Kumar, K.; Shafeeq, M.M.; Kumar, P.; Munjal, R.; Mukhopadhyay, S.; Mondal, D.P.; Khan, M.A.; Vandana, V. Detection of water pollutants using super-hydrophobic porous silicon-based SERS substrates. Microchim. Acta 2024, 191, 357. [Google Scholar] [CrossRef]
  18. Novara, C.; Marta, S.D.; Virga, A.; Lamberti, A.; Angelini, A.; Chiadò, A.; Rivolo, P.; Geobaldo, F.; Sergo, V.; Bonifacio, A.; et al. SERS-Active Ag Nanoparticles on Porous Silicon and PDMS Substrates: A Comparative Study of Uniformity and Raman Efficiency. J. Phys. Chem. C 2016, 120, 16946–16953. [Google Scholar] [CrossRef]
  19. Ismail, N.F.; Lee, K.Y.; Mohd, N.S.H.; Ismail, L.N.; Rahim, A.F.A.; Abdullah, M.H.; Radzol, A.R.M. Nano Silver-Coated Porous Silicon-Based Surface-Enhanced Raman Spectroscopy Substrate for Low-Concentration Dengue NS1 Protein Detection. J. Appl. Spectrosc. 2024, 91, 480–488. [Google Scholar] [CrossRef]
  20. Mariani, S.; Paghi, A.; Mattina, A.A.L.; Debrassi, A.; Dähne, L.; Barillaro, G. Decoration of Porous Silicon with Gold Nanoparticles via Layer-by-Layer Nanoassembly for Interferometric and Hybrid Photonic/Plasmonic (Bio)sensing. ACS Appl. Mater. Interfaces 2019, 11, 43731–43740. [Google Scholar] [CrossRef]
  21. Al-Syadi, A.M.; Faisal, M.; Harraz, F.A.; Jalalah, M.; Alsaiari, M. Immersion-plated palladium nanoparticles onto meso-porous silicon layer as novel SERS substrate for sensitive detection of imidacloprid pesticide. Sci. Rep. 2021, 11, 9174. [Google Scholar] [CrossRef] [PubMed]
  22. Al-Syadi, A.M.; Faisal, M.; El-Toni, A.M.; Khan, A.; Jalalah, M.; Alsareii, S.A.; Harraz, F.A. Surface-enhanced Raman scattering (SERS) active substrate from gold nanoparticle-coated porous silicon for sensitive detection of horseradish peroxidase enzyme. Mater. Chem. Phys. 2022, 281, 125931. [Google Scholar] [CrossRef]
  23. Lorenzo, E.; Oton, C.J.; Capuj, N.E.; Ghulinyan, M.; Navarro-Urrios, D.; Gaburro, Z.; Pavesi, L. Porous silicon-based rugate filters. Appl. Opt. 2005, 44, 5415–5421. [Google Scholar] [CrossRef] [PubMed]
  24. Grau, M.; Nguyen, N.-T.; Straboni, A.; Lemiti, M. Structural and Optical Properties of Annealed Porous Silicon Bragg Reflector for Thin-Film Crystalline Silicon Solar Cells. Energy Procedia 2011, 10, 8–13. [Google Scholar] [CrossRef]
  25. Van, N.T.; Chinh, V.D.; Binh, P.T.; Hoi, P.V.; Huy, B.; Nga, P.T. Select and Rapid Detection of Methylene Blue on Porous Silicon Photonic Crystals Covered with Silver Nanoparticles by SERS. J. Electron. Mater. 2022, 51, 1946–1949. [Google Scholar] [CrossRef]
  26. Chen, N.; Ding, P.; Shi, Y.; Jin, T.; Su, Y.; Wang, H.; He, Y. Portable and Reliable Surface-Enhanced Raman Scattering Silicon Chip for Signal-On Detection of Trace Trinitrotoluene Explosive in Real Systems. Anal. Chem. 2017, 89, 5072–5078. [Google Scholar] [CrossRef]
  27. Nguyen, T.V.; Vu, D.C.; Pham, T.S.; Bui, H.; Pham, T.B.; Hoang, T.H.C.; Pham, V.H.; Pham, V.H. Quasi-3D-Structured Surface-Enhanced Raman Scattering Substrates Based on Silver Nanoparticles/Mesoporous Silicon Hybrid. Phys. Status Solidi (A) Appl. Mater. Sci. 2022, 219, 2200128. [Google Scholar] [CrossRef]
  28. Wang, J.; Jia, Z.; Liu, Y. Improvement of SERS by the Optical Modulation of Photonic Crystal. IEEE Sens. J. 2019, 19, 11221–11227. [Google Scholar] [CrossRef]
  29. Zhong, F.; Wu, Z.; Guo, J.; Jia, D. Porous Silicon Photonic Crystals Coated with Ag Nanoparticles as Efficient Substrates for Detecting Trace Explosives Using SERS. Nanomaterials 2018, 8, 872. [Google Scholar] [CrossRef]
  30. Nguyen, T.V.; Vu, D.C.; Pham, V.H.; Pham, T.B.; Pham, V.H.; Bui, H. Improvement of SERS for detection of ultra-low concentration of methyl orange by nanostructured silicon decorated with Ag nanoparticles. Optik 2021, 231, 166431. [Google Scholar] [CrossRef]
  31. Bai, Y.; Yan, L.; Wang, J.; Su, L.; Chen, N.; Tan, Z. Highly reproducible and uniform SERS substrates based on Ag nanoparticles with optimized size and gap. Photonics Nanostruct. Fundam. Appl. 2017, 23, 58–63. [Google Scholar] [CrossRef]
  32. Zhao, X.; Wei, C.M.; Yang, L.; Chou, M.Y. Quantum Confinement and Electronic Properties of Silicon Nanowires. Phys. Rev. Lett. 2004, 92, 236805. [Google Scholar] [CrossRef] [PubMed]
  33. Piscanec, S.; Cantoro, M.; Ferrari, A.C.; Zapien, J.A.; Lifshitz, Y.; Lee, S.T.; Hofmann, S.; Robertson, J. Raman spectroscopy of silicon nanowires. Phys. Rev. B 2003, 68, 241312. [Google Scholar] [CrossRef]
  34. Virga, A.; Rivolo, P.; Descrovi, E.; Chiolerio, A.; Digregorio, G.; Frascella, F.; Soster, M.; Bussolino, F.; Marchiò, S.; Geobaldo, F.; et al. SERS active Ag nanoparticles in mesoporous silicon: Detection of organic molecules and peptide–antibody assays. J. Raman Spectrosc. 2012, 43, 730–736. [Google Scholar] [CrossRef]
  35. Li-lin, J.; Wei-long, L.; Yun-fei, S.; Xing, H.; Yang, W.; Chang, W.; Hong-lin, W.; Fang, Y.; Yan-qiang, Y. Photoinduced intermolecular electron transfer and off-resonance Raman characteristics of Rhodamine 101/N,N-diethylaniline. Chem. Phys. 2014, 429, 12–19. [Google Scholar] [CrossRef]
  36. Kundu, A.; Rani, R.; Hazra, K.S. Controlled nanofabrication of metal-free SERS substrate on few layered black phosphorus by low power focused laser irradiation. Nanoscale 2019, 11, 16245–16252. [Google Scholar] [CrossRef]
  37. He, X.N.; Gao, Y.; Mahjouri-Samani, M.; Black, P.N.; Allen, J.; Mitchell, M.; Xiong, W.; Zhou, Y.S.; Jiang, L.; Lu, Y.F. Surface-enhanced Raman spectroscopy using gold-coated horizontally aligned carbon nanotubes. Nanotechnology 2012, 23, 205702. [Google Scholar] [CrossRef]
  38. Mamichev, D.A.; Gonchar, K.A.; Timoshenko, V.Y.; Mussabek, G.K.; Nikulin, V.E.; Taurbaev, T.I. Enhanced Raman scattering in multilayer structures of porous silicon. J. Raman Spectrosc. 2011, 42, 1392–1395. [Google Scholar] [CrossRef]
  39. Delfan, A.; Liscidini, M.; Sipe, J.E. Surface enhanced Raman scattering in the presence of multilayer dielectric structures. J. Opt. Soc. Am. B 2012, 29, 1863–1874. [Google Scholar] [CrossRef]
  40. Huang, S.H.; Jiang, X.; Peng, B.; Janisch, C.; Cocking, A.; Özdemir, Ş.K.; Liu, Z.; Yang, L. Surface-enhanced Raman scattering on dielectric microspheres with whispering gallery mode resonance. Photonics Res. 2018, 6, 346–356. [Google Scholar] [CrossRef]
  41. Alessandri, I. Enhancing Raman Scattering without Plasmons: Unprecedented Sensitivity Achieved by TiO2 Shell-Based Resonators. J. Am. Chem. Soc. 2013, 135, 5541–5544. [Google Scholar] [CrossRef] [PubMed]
  42. Vandenabeele, P.; Jehlička, J.; Vítek, P.; Edwards, H.G.M. On the definition of Raman spectroscopic detection limits for the analysis of biomarkers in solid matrices. Planet. Space Sci. 2012, 62, 48–54. [Google Scholar] [CrossRef]
  43. Desimoni, E.; Brunetti, B. About Estimating the Limit of Detection by the Signal to Noise Approach. Pharm. Anal. Acta. 2015, 6, 1000355. [Google Scholar] [CrossRef]
  44. Thayer, E.; Turner, W.; Blama, S.; Devadas, M.S.; Hondrogiannis, E.M. Signal detection limit of a portable Raman spectrometer for the SERS detection of gunshot residue. MRS Commun. 2019, 9, 948–955. [Google Scholar] [CrossRef]
  45. Xie, J.; Li, L.; Khan, I.M.; Wang, Z.; Ma, X. Flexible paper-based SERS substrate strategy for rapid detection of methyl parathion on the surface of fruit. Spectrochim. Acta Part A Mol. Biomol. Spectrosc. 2020, 231, 118104. [Google Scholar] [CrossRef]
  46. Li, Z.; Meng, G.; Huang, Q.; Hu, X.; He, X.; Tang, H.; Wang, Z.; Li, F. Ag Nanoparticle-Grafted PAN-Nanohump Array Films with 3D High-Density Hot Spots as Flexible and Reliable SERS Substrates. Small 2015, 11, 5452–5459. [Google Scholar] [CrossRef]
  47. Wu, H.; Luo, Y.; Huang, Y.; Dong, Q.; Huo, C.; Huo, D.; Zhao, J.; Lei, Y. A Simple SERS-Based Trace Sensing Platform Enabled by AuNPs-Analyte/AuNPs Double-Decker Structure on Wax-Coated Hydrophobic Surface. Front. Chem. 2018, 6, 482. [Google Scholar] [CrossRef]
  48. Zhu, C.; Hu, X.; Wang, X. Silver nanocubes/graphene oxide hybrid film on a hydrophobic surface for effective molecule concentration and sensitive SERS detection. Appl. Surf. Sci. 2019, 470, 423–429. [Google Scholar] [CrossRef]
  49. Wu, H.; Luo, Y.; Hou, C.; Huo, D.; Wang, W.; Zhao, J.; Lei, Y. Rapid and fingerprinted monitoring of pesticide methyl parathion on the surface of fruits/leaves as well as in surface water enabled by gold nanorods based casting-and-sensing SERS platform. Talanta 2019, 200, 84–90. [Google Scholar] [CrossRef]
  50. Tang, F.; Zhang, M.; Li, Z.; Du, Z.; Chen, B.; He, X.; Zhao, S. Hexagonally arranged arrays of urchin-like Ag-nanoparticle decorated ZnO-nanorods grafted on PAN-nanopillars as surface-enhanced Raman scattering substrates. CrystEngComm 2018, 20, 3550–3558. [Google Scholar] [CrossRef]
  51. Luo, W.; Chen, M.; Hao, N.; Huang, X.; Zhao, X.; Zhu, Y.; Yang, H.; Chen, X. In situ synthesis of gold nanoparticles on pseudo-paper films as flexible SERS substrate for sensitive detection of surface organic residues. Talanta 2019, 197, 225–233. [Google Scholar] [CrossRef]
  52. Yaseen, T.; Pu, H.; Sun, D.-W. Rapid detection of multiple organophosphorus pesticides (triazophos and parathion-methyl) residues in peach by SERS based on core-shell bimetallic Au@Ag NPs. Food Addit. Contam. Part A 2019, 36, 762–778. [Google Scholar] [CrossRef]
Figure 1. (a) Schematic of the microcavity structure formed via time-modulated current density during electrochemical etching. (b) Cross-sectional SEM image showing alternating porosity regions and a central cavity; inset images show zoomed-in views of the surface and cross-sectional pore morphology. (c) Reflectance spectrum displaying a sharp resonance at 784.4 nm, confirming optical confinement within the cavity.
Nanomaterials 15 01007 g001
Figure 2. (ae) Surface topographies of silver nanoparticle (AgNP)-decorated PSiMC substrates with immersion times of 25, 50, 75, 100 and 125 s, respectively and (f) XRD spectrum of AgNPs deposited on the PSiMC surface with deposition time of 75 s.
Nanomaterials 15 01007 g002
Figure 3. (a) Reflectivity spectra of porous silicon microcavity (PSiMC) before and after silver nanoparticle (AgNP) decoration at various immersion times and (b) Raman pattern of PSiMC before and after AgNP decoration (at 75 s).
Nanomaterials 15 01007 g003
Figure 4. (a) Surface-enhanced Raman spectra of Rhodamine 101 (1.0 × 10⁻⁹ M) recorded on AgNP/PSiMC substrates fabricated with different Ag deposition times (25, 50, 75, 100, and 125 s) and (b) dependence of the intensity of 1646 cm−1 band of Rh101 on the deposition time.
Nanomaterials 15 01007 g004
Figure 5. Raman spectra of Rh101 (1.0 × 10⁻⁷ M) detected on (A) PSi single-layer; (B) photonic crystal and (C) microcavity substrates after AgNP deposition. The substrates were treated in 0.01 M AgNO3 solution for the 75 s.
Nanomaterials 15 01007 g005
Figure 6. Raman spectra of Rh101 (10−13 M–10−7 M) on AgNP/PSiMC substrates. PSiMC samples were treated in 0.01 M AgNO3 solution for 75 s.
Nanomaterials 15 01007 g006
Figure 7. (a) Raman spectra of Rh101 (10−9 M) adsorbed on AgNP/PSiMC substrates, recorded at thirty randomly selected positions across the sample surface. (b) The line indicates the average SERS intensity of the 30 random positions at peak of 1646 cm−1 with RSD = 6.14%.
Nanomaterials 15 01007 g007
Figure 8. (a) Raman spectra of Rh101 (10−8 M) adsorbed on AgNP/PSiMC substrates within 45 days, (b) the relationship between the SERS intensity at 1646 cm−1 and storage time.
Nanomaterials 15 01007 g008
Figure 9. Raman spectra of methyl parathion with concentrations ranging from 10−10 M to 10−6 M using AgNP/PSiMC substrate.
Nanomaterials 15 01007 g009
Table 1. Electrochemical etching conditions for PSi structures.
Sample Current Density
(mA/cm2)
Time
(sec)
Thickness
Single layerLow index layer50932.9 µm
DBR
(12 periods)
High index layer158.4126.6 nm
Low index layer503.2112.6 nm
PSiMCTop DBR
(4.5 periods)
158.4126.6 nm
503.2112.6 nm
Spacer506.4225.2 nm
Bottom DBR
(5 periods)
158.4126.6 nm
503.2112.6 nm
Table 2. Assignment of Raman bands in SERS spectra of Rh101 [35,36,37].
Raman Shift (cm−1)AssignmentRaman Shift (cm−1)Assignment
622C-C-C ring in-plane vibration1232CH2 + CH wag + C-O-C stretch
673C-C-C ring out-of-plane vibration1347C-O-C stretch + C-C-C ring stretch
768C-H out-of-plane bending1423
846CH2 out-of-plane wag1504CH2 scissoring + C-N stretch
962CH2 + CH wag + C-C-C ring vibration + C-O-C stretch1570Aromatic C-C stretching
1061CH2 + CH wag + C-C-C ring vibration1597Xanthene ring stretch
1203CH2 + CH wag + C-O-C stretch1646Aromatic C-C stretching
Table 3. Summary of SERS substrates applied for methyl parathion detection using various Raman systems.
SERS Substrate TypeRaman InstrumentationExcitation Wavelength (nm)Reported Detection LimitReference
Ag nanocube/graphene oxide compositeRenishaw confocal microprobe Raman (India)5322.0 × 10−12 M[48]
Au nanorods sensorOcean Optics handheld Raman7851.0 × 10−6 M[49]
Ag–ZnO nanorods with PAN-nanopillar architectureRenishaw inVia confocal micro-Raman5321.0 × 10−8 M[50]
AuNP-based pseudo-paper film (APPF)Portable Raman (B&W Tek)785~5.1 × 10⁻¹¹ M[51]
Au@Ag core–shell nanoparticlesConfocal Raman system633~3.8 × 10⁻⁹ M[52]
AuNP–analyte/AuNP double-decker structure Portable Raman spectrometer (QE Pro, Ocean Optics)7851.0 × 10−8 M[47]
Filter paper coated with AgNPsB&W Tek portable Raman785~5.5 × 10⁻⁸ M[45]
AgNP/PSi microcavity (PSiMC)Confocal Raman microscope (Horiba LabRAM)7851.0 × 10−10 MThis work
Disclaimer/Publisher’s Note: The statements, opinions and data contained in all publications are solely those of the individual author(s) and contributor(s) and not of MDPI and/or the editor(s). MDPI and/or the editor(s) disclaim responsibility for any injury to people or property resulting from any ideas, methods, instructions or products referred to in the content.