

An Approach to the Improvement of Graphene Production by Ultrasonic-Bath Treatment
 ,
,  , ,
, ,
Abstract

1. Introduction
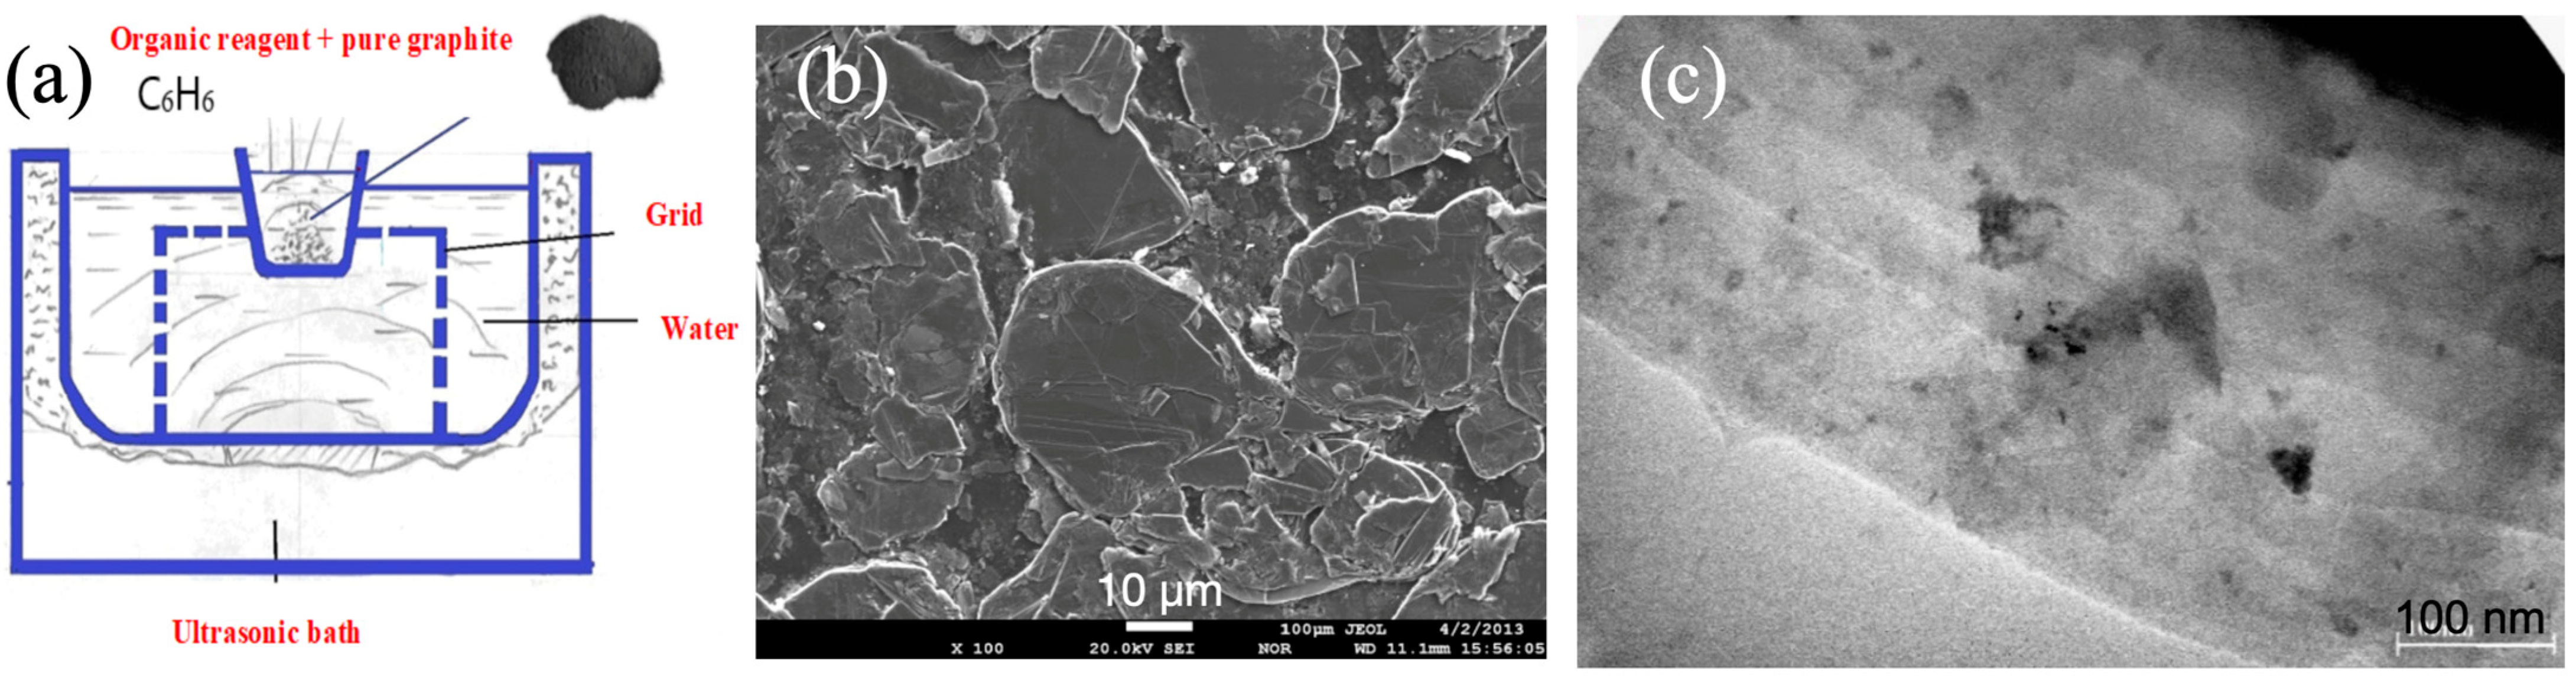
2. Experimental
3. Samples Fabrication
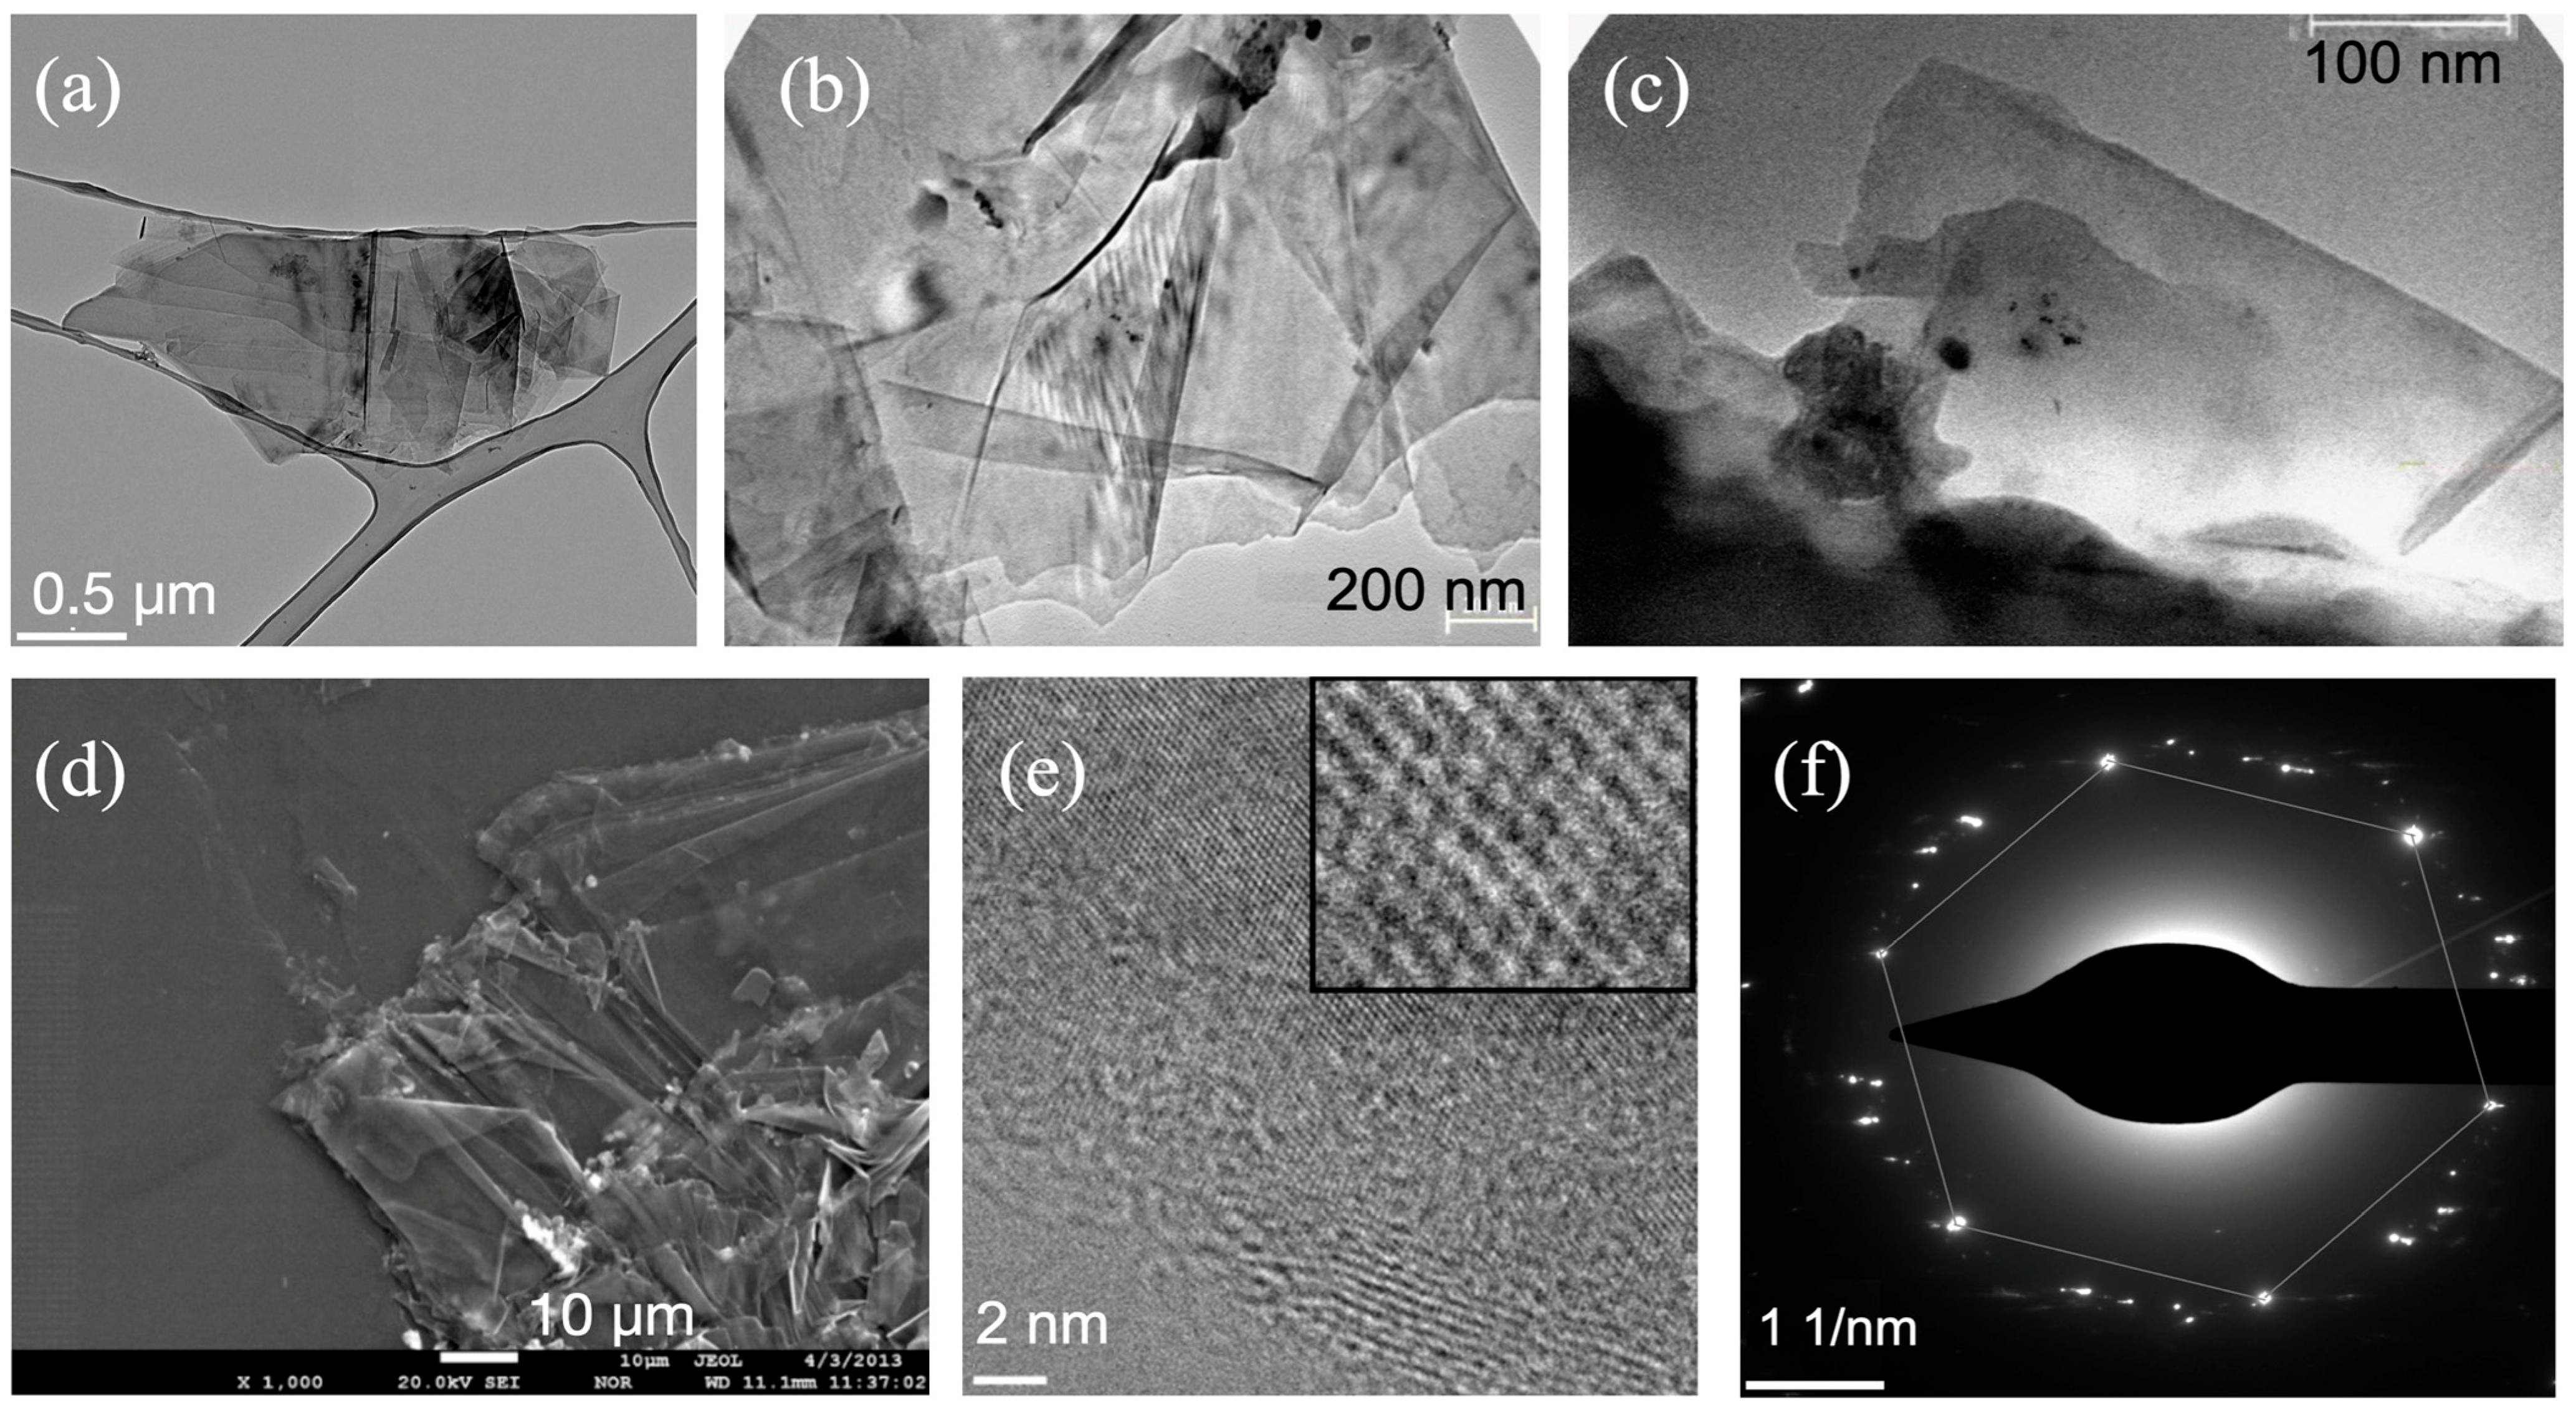
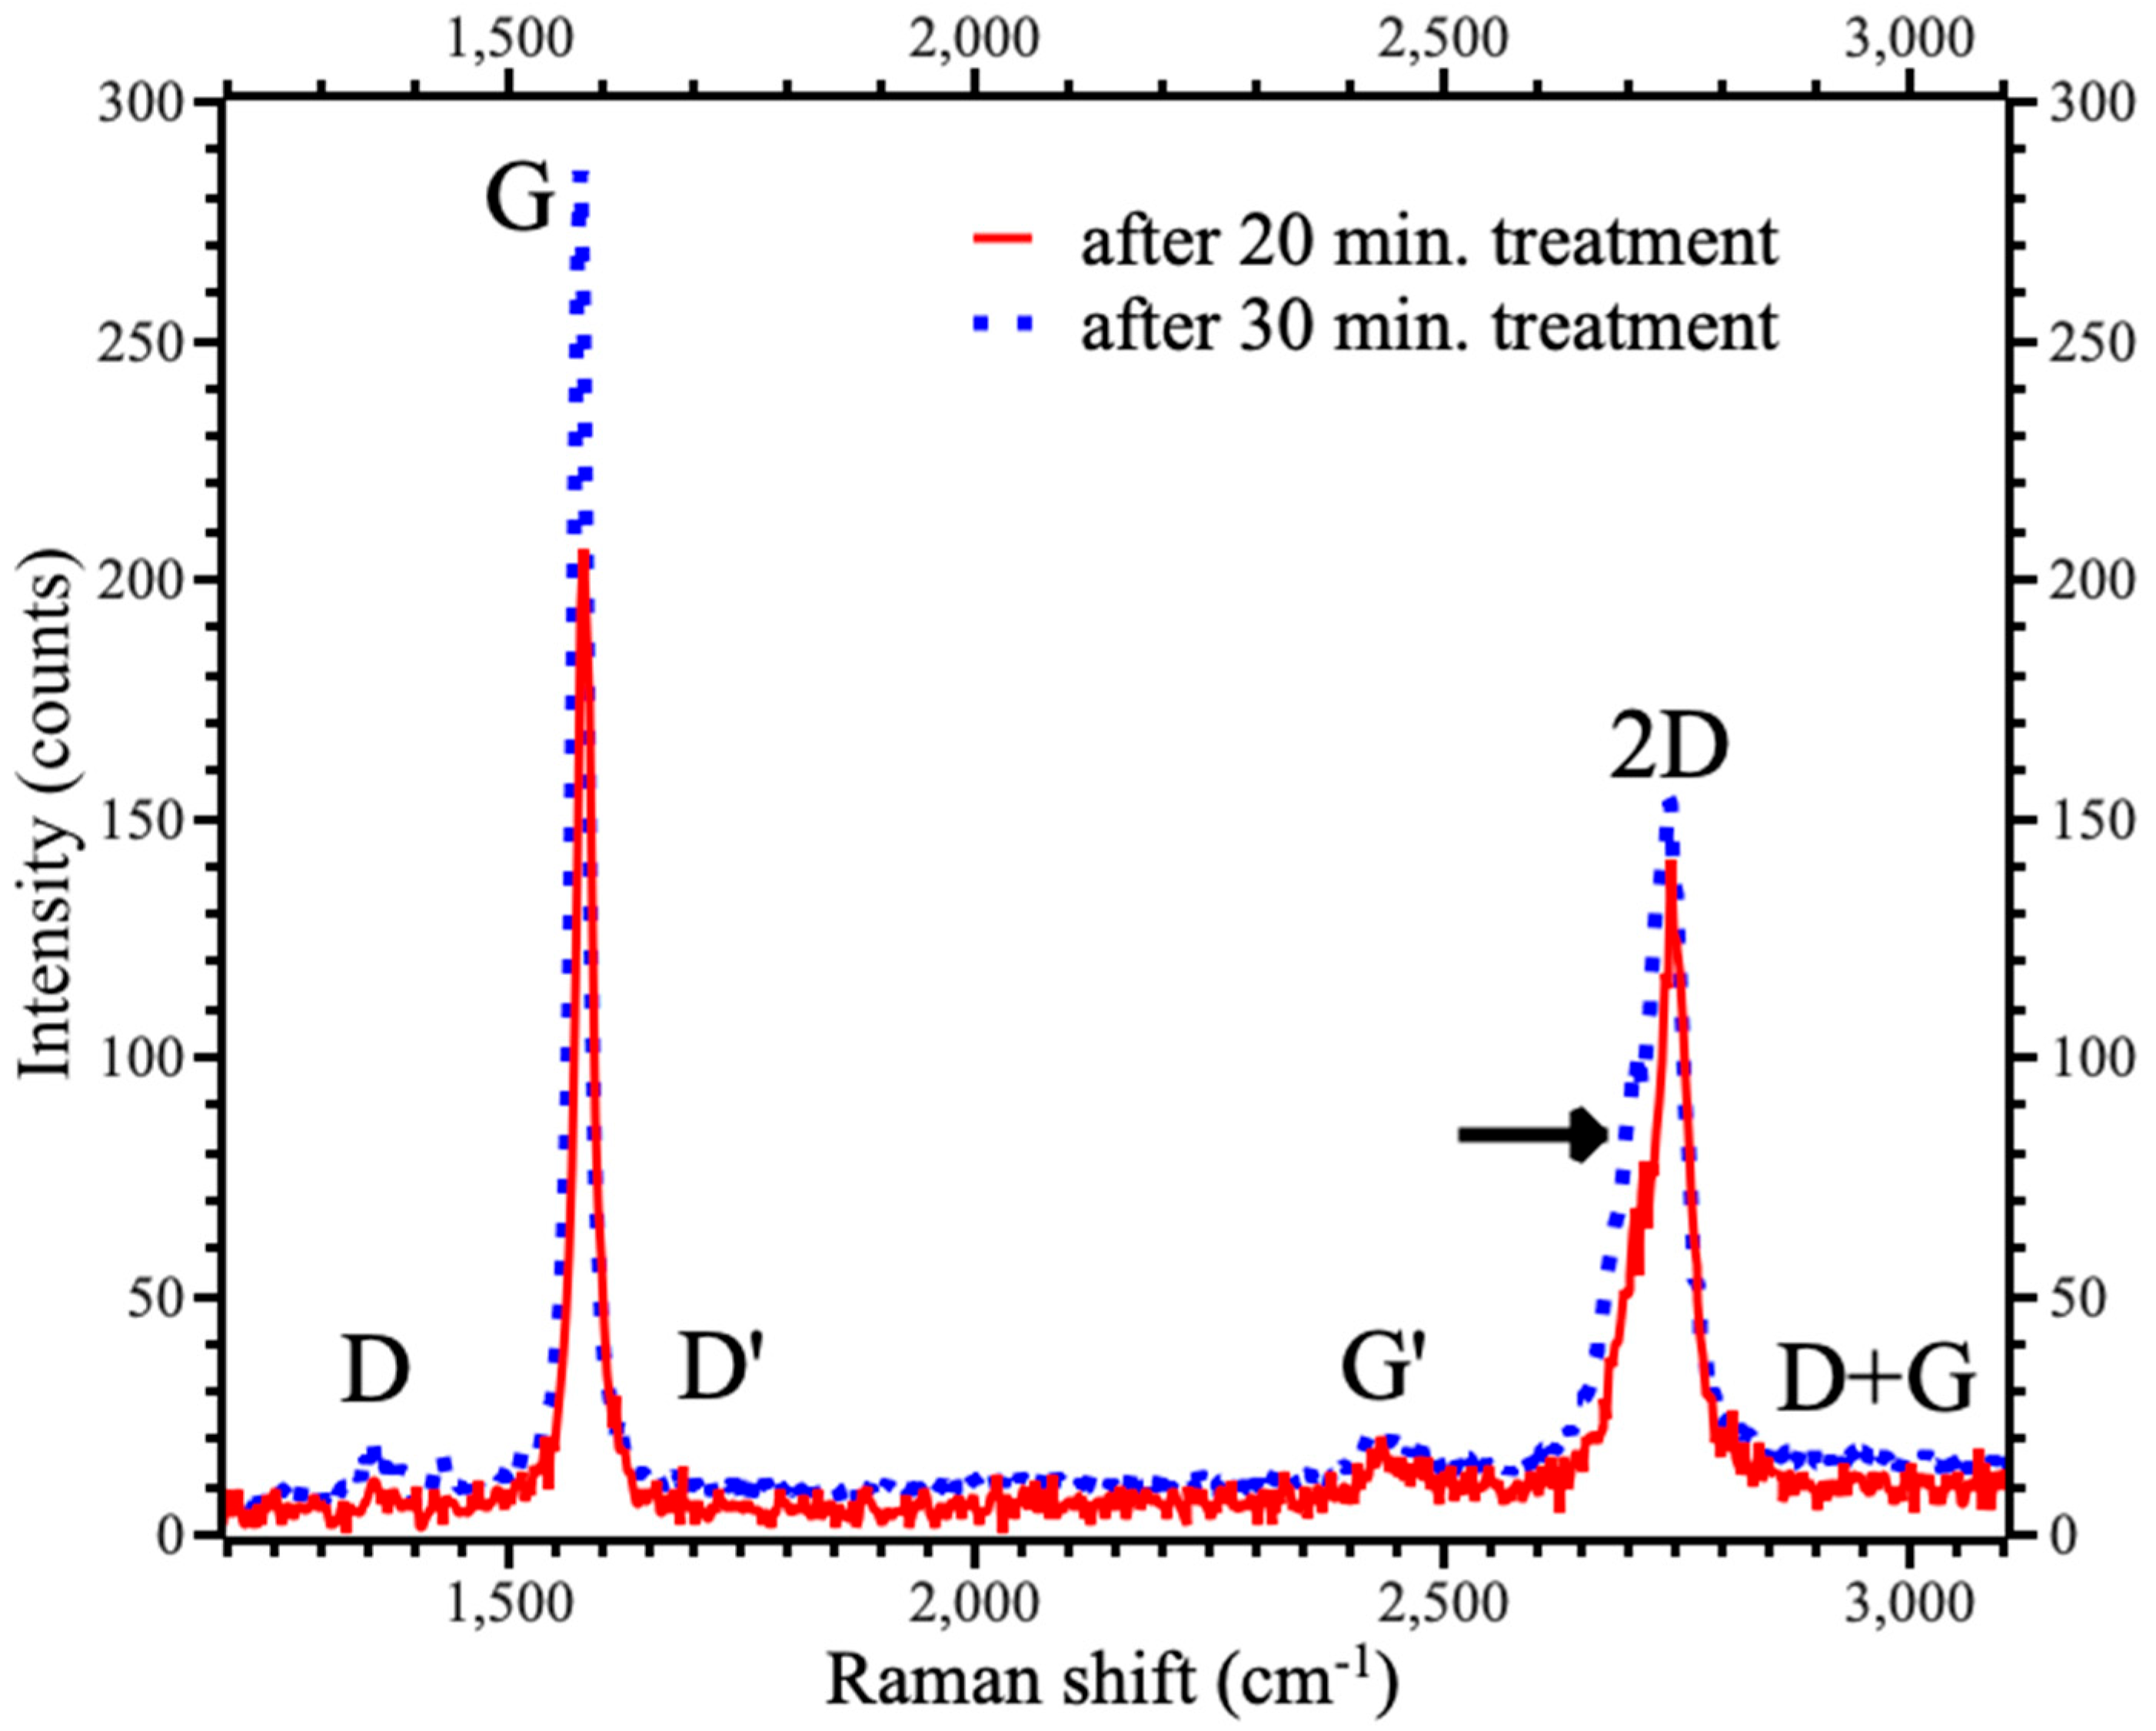
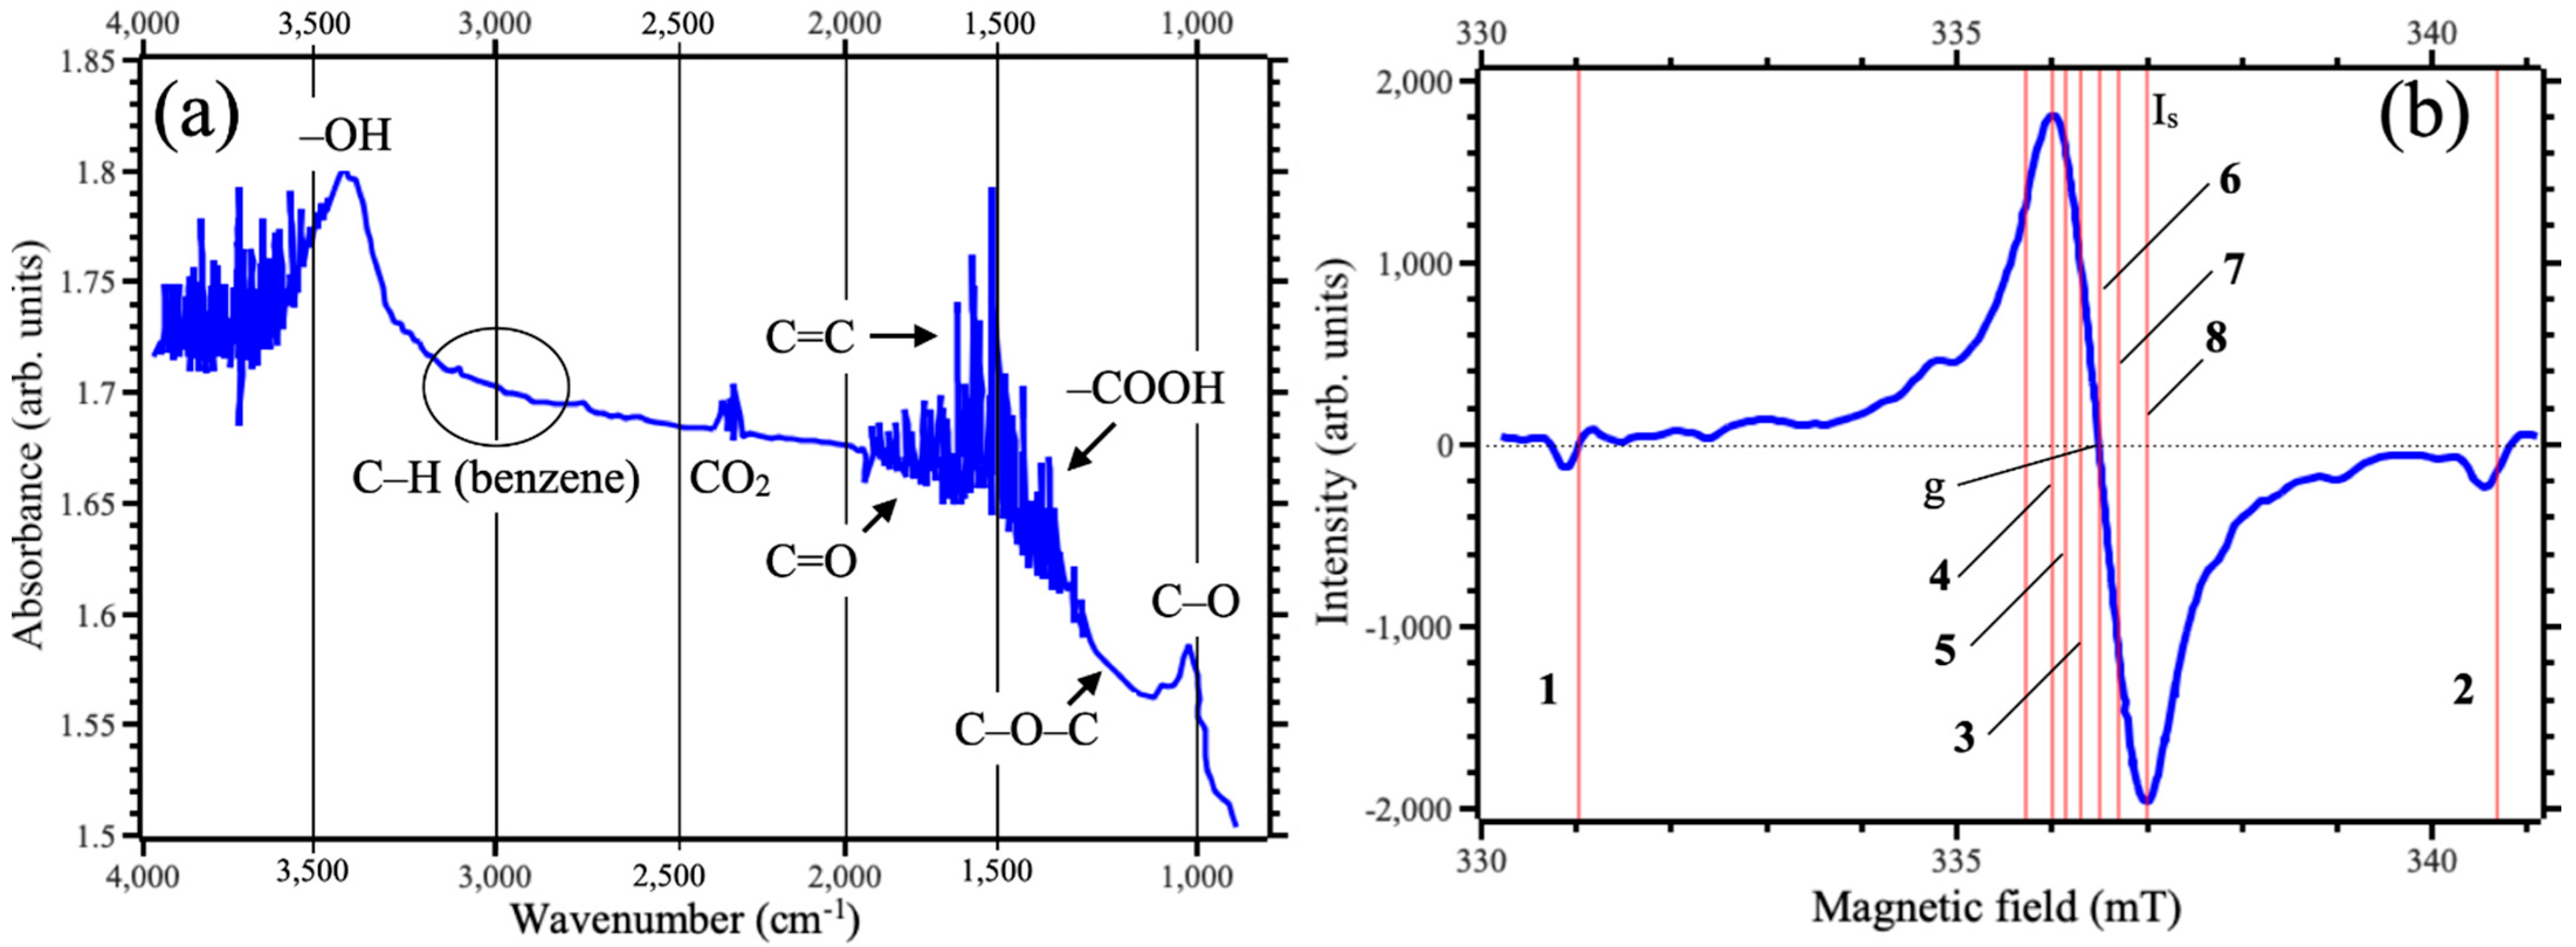
4. Results and Discussions
5. Conclusions
Supplementary Materials
Author Contributions
Funding
Data Availability Statement
Conflicts of Interest
References
- Kauling, A.P.; Seefeldt, A.T.; Pisoni, D.P.; Pradeep, R.C.; Bentini, R.; Oliveira, R.V.B.; Novoselov, K.S.; Neto, A.H.C. The Worldwide Graphene Flake Production. Adv. Mater. 2018, 30, 1803784. [Google Scholar] [CrossRef] [PubMed]
- BØggild, P. The war on fake graphene. Nature 2018, 562, 502. [Google Scholar] [CrossRef] [PubMed]
- Ciesielski, A.; Samori, P. Graphene via sonication assisted liquid-phase exfoliation. Chem. Soc. Rev. 2014, 43, 381. [Google Scholar] [CrossRef] [PubMed]
- Stankovich, S.; Dikin, D.A.; Dommett, G.H.B.; Kohlhaas, K.M.; Zimney, E.J.; Stach, E.A.; Piner, R.D.; Nguyen, S.T.; Ruoff, R.S. Graphene-based composite materials. Nature 2006, 442, 282. [Google Scholar] [CrossRef]
- Stankovich, S.; Piner, R.D.; Chen, X.Q.; Wu, N.Q.; Nguyen, S.T.; Ruoff, R.S. Stable aqueous dispersions of graphitic nanoplatelets via the reduction of exfoliated graphite oxide in the presence of poly(sodium 4-styrenesulfonate). J. Mater. Chem. 2006, 16, 155. [Google Scholar] [CrossRef]
- Khan, U.; O’Neill, A.; Lotya, M.; De, S.; Coleman, J.N. High-Concentration Solvent Exfoliation of Graphene. Small 2010, 6, 864. [Google Scholar] [CrossRef]
- Silva, L.I.; Mirabella, D.A.; Tomba, J.P.; Riccardi, C.C. Optimizing graphene production in ultrasonic devices. Optimizing graphene production in ultrasonic devices. Ultrasonics 2020, 100, 105989. [Google Scholar] [CrossRef]
- Han, J.T.; Jang, J.I.; Kim, H.; Hwang, J.Y.; Yoo, H.K.; Woo, J.S.; Choi, S.; Kim, H.Y.; Jeong, H.J.; Jeong, S.Y.; et al. Extremely Efficient Liquid Exfoliation and Dispersion of Layered Materials by Unusual Acoustic Cavitation. Sci. Rep. 2014, 4, 5133. [Google Scholar] [CrossRef]
- Hernandez, Y.; Nicolosi, V.; Lotya, M.; Blighe, F.M.; Sun, Z.; De, S.; McGovern, I.T.; Holland, B.; Byrne, M.; Gun’Ko, Y.K.; et al. High-yield production of graphene by liquid-phase exfoliation of graphite. Nat. Nanotechnol. 2008, 3, 563. [Google Scholar] [CrossRef]
- Muthoosamy, K.; Manickam, S. State of the art and recent advances in the ultrasound-assisted synthesis, exfoliation and functionalization of graphene derivatives. Ultrason. Sonochem. 2017, 39, 478. [Google Scholar] [CrossRef]
- Bisht, A.; Srivastava, M.; Kumar, R.M.; Lahiri, I.; Lahiri, D. Strengthening mechanism in graphene nanoplatelets reinforced aluminum composite fabricated through spark plasma sintering. Mater. Sci. Eng. A 2017, 695, 20–28. [Google Scholar] [CrossRef]
- Kumar, H.G.P.; Xavior, M.A. Fatigue and Wear Behavior of Al6061–Graphene Composites Synthesized by Powder Metallurgy. Trans. Indian Inst. Met. 2016, 69, 415–419. [Google Scholar] [CrossRef]
- Baig, Z.; Mamat, O.; Mustapha, M.; Mumtaz, A.; Munir, K.S.; Sarfraz, M. Investigation of tip sonication effects on structural quality of graphene nanoplatelets (GNPs) for superior solvent dispersion. Ultrason. Sonochem. 2018, 45, 133–149. [Google Scholar] [CrossRef]
- Gu, X.; Zhao, Y.; Sun, K.; Vieira, C.L.; Jia, Z.; Cui, C.; Wang, Z.; Walsh, A.; Huang, S. Method of ultrasound-assisted liquid-phase exfoliation to prepare graphene. Ultrason. Sonochem. 2019, 58, 104630. [Google Scholar] [CrossRef]
- Park, S.; Ruoff, R.S. Chemical methods for the production of graphenes. Nat. Nanotechnol. 2009, 4, 217–224. [Google Scholar] [CrossRef]
- Cai, M.; Thorpe, D.; Adamson, D.H.; Schniepp, H.C. Methods of graphite exfoliation. J. Mater. Chem. 2012, 22, 24992–25002. [Google Scholar] [CrossRef]
- Paton, K.R.; Varrla, E.; Backes, C.; Smith, R.J.; Khan, U.; O’Neill, A.; Boland, C.S.; Lotya, M.; Istrate, O.M.; King, P.; et al. Scalable production of large quantities of defect-free few-layer graphene by shear exfoliation in liquids. Nat. Mater. 2014, 13, 624–630. [Google Scholar] [CrossRef]
- Tour, J.M. Layered materials: Scaling up exfoliation. Nat. Mater. 2014, 13, 545546. [Google Scholar] [CrossRef]
- Tyurnina, A.V.; Tzanakis, I.; Morton, J.; Mi, J.; Porfyrakis, K.; Maciejewska, B.M.; Grobert, N.; Eskin, D.G. Ultrasonic exfoliation of graphene in water: A key parameter study. Carbon 2020, 168, 737–747. [Google Scholar] [CrossRef]
- Polverino, S.; Castillo, A.E.D.R.; Brencich, A.; Marasco, L.; Bonaccorso, F.; Morbiducci, R. Few-Layers Graphene-Based Cement Mortars: Production Process and Mechanical Properties. Sustainability 2022, 14, 784. [Google Scholar] [CrossRef]
- Shin, S.E.; Bae, D.H. Deformation behavior of aluminum alloy matrix composites reinforced with few-layer graphene. Comp. Part A 2015, 78, 42–47. [Google Scholar] [CrossRef]
- Baitimbetova, B.A.; Ryabikin, Y.A.; Zashkvara, O.V. The study by spectroscopy method of carbon nanostructure in carbonized ferrochromic spinel. Spectrosc. Lett. 2008, 41, 9–14. [Google Scholar] [CrossRef]
- Ghaemi, F.; Yunus, R.; Ahmadian, A.; Ismail, F.; Salleh, M.A.M.; Rashid, S.A. Few- and multi-layer graphene on carbon fibers: Synthesis and application. RSC Adv. 2015, 5, 81266–81274. [Google Scholar] [CrossRef]
- Ba, H.; Truong-Phuoc, L.; Romero, T.; Sutter, C.; Nhut, J.-M.; Schlatter, G.; Giambastiani, G.; Pham-Huu, C. Lightweight, few-layer graphene composites with improved electro-thermal properties as efficient heating devices for de-icing applications. Carbon 2021, 182, 655–668. [Google Scholar] [CrossRef]
- Xu, Y.; Cao, H.; Xue, Y.; Li, B.; Cai, W. Liquid-phase exfoliation of graphene: An overview on exfoliation media, techniques, and challenges. Nanomaterials 2018, 8, 942–1032. [Google Scholar] [CrossRef]
- Green, A.A.; Hersam, M.C. Solution Phase Production of Graphene with Controlled Thickness via Density Differentiation. Nano Lett. 2009, 9, 4031. [Google Scholar] [CrossRef]
- Buzaglo, M.; Shtein, M.; Kober, S.; Lovrinčić, R.; Vilan, A.; Regev, O. Critical parameters in exfoliating graphite into graphene. Phys. Chem. Chem. Phys. 2013, 15, 4428. [Google Scholar] [CrossRef]
- Baitimbetova, B.; Tolubayev, K.; Ryabikin, Y.; Murzalinov, D.; Zhautikov, B.; Dairbekova, G. The study of carbon nanomaterials by IR-Fourier spectroscopy, obtained by the action of an ultrasonic field on graphite. Bull. Karaganda Univ. Phys. Ser. 2022, 2, 127–132. [Google Scholar] [CrossRef]
- Baitimbetova, B.A.; Ryabikin, Y.A.; Rakymetov, B.A.; Murzalinov, D.O.; Kantarbaeva, D.O.; Duamet, B.; Dmitriyeva, E.A.; Serikkanov, A.S.; Yelemessov, K. Paramagnetic Properties of Carbon Films. Coatings 2023, 13, 1484. [Google Scholar] [CrossRef]
- Baytimbetova, B.A.; Ryabikin, Y.A.; Mukashev, B.N. Study of paramagnetic properties of graphene structures obtained from pure graphite in organic reagents exposed to ultrasound. Russ Phys. J. 2021, 64, 209–215. [Google Scholar] [CrossRef]
- Di Berardino, C.; Bélteky, P.; Schmitz, F.; Lamberti, F.; Menna, E.; Kukovecz, A.; Gatti, T. Controlled Size Reduction of Liquid Exfoliated Graphene Micro-Sheets via Tip Sonication. Crystals 2020, 10, 1049. [Google Scholar] [CrossRef]
- Malard, L.M.; Pimenta, M.A.; Dresselhaus, G.; Dresselhaus, M.S. Raman spectroscopy in graphene. Phys. Rep. 2009, 473, 51–87. [Google Scholar] [CrossRef]
- Ferrari, A.C. Raman spectroscopy of graphene and graphite: Disorder, electron-phonon coupling, doping and nonadiabatic effects. Solid State Comm. 2007, 143, 47–57. [Google Scholar] [CrossRef]
- Scardaci, V.; Compagnini, G. Raman Spectroscopy Investigation of Graphene Oxide Reduction by Laser Scribing. C 2021, 7, 48. [Google Scholar] [CrossRef]
- Zhang, N.; Liu, B.; Lin, L.-W. Effect of He ion irradiation on microstructure and electrical properties of graphene. Acta Phys. Sin. 2020, 69, 01610. [Google Scholar] [CrossRef]
- Di Bartolo, B. Optical Interactions in Solids; Wiley: New York, NY, USA, 1968. [Google Scholar]
- Aliyev, E.; Filiz, V.; Khan, M.M.; Lee, Y.J.; Abetz, C.; Abetz, V. Structural Characterization of Graphene Oxide: Surface Functional Groups and Fractionated Oxidative Debris. Nanomaterial 2019, 9, 1180. [Google Scholar] [CrossRef]
- Khivantsev, K.; Jaegers, N.R.; Aleksandrov, H.A.; Kovarik, L.; Derewinski, M.A.; Wang, Y.; Vayssilov, G.N.; Szanyi, J. Biomimetic CO oxidation below −100 °C by a nitrate-containing metal-free microporous system. Nat. Commun. 2021, 12, 6033. [Google Scholar] [CrossRef]
- Hafiz, S.M.; Ritikos, R.; Whitcher, T.J.; Razib, N.M.; Bien, D.C.S.; Chanlek, N.; Nakajima, H.; Saisopa, T.; Songsiriritthigul, P.; Huang, N.M.; et al. A practical carbon dioxide gas sensor using room-temperature hydrogen plasma reduced graphene oxide. Sens. Actuators B Chem. 2014, 193, 692–700. [Google Scholar] [CrossRef]
- He, D.; Peng, Z.; Gong, W.; Luo, Y.; Zhao, P.; Kong, L. Mechanism of a green graphene oxide reduction with reusable potassium carbonate. RSC Adv. 2015, 5, 11966–11972. [Google Scholar] [CrossRef]
- Chen, J.; Yao, B.; Li, C.; Shi, G. An improved Hummers method for eco-friendly synthesis of graphene oxide. Carbon 2013, 64, 225. [Google Scholar] [CrossRef]
- Yazyev, O.V.; Katsnelson, M.I. Magnetic Correlations at Graphene Edges: Basis for Novel Spintronics Devices. Phys. Rev. Lett. 2008, 100, 047209. [Google Scholar] [CrossRef] [PubMed]
- Boukhvalov, D.; Osipov, V.; Shames, A.; Takai, K.; Hayashi, T.; Enoki, T. Charge transfer and weak bonding between molecular oxygen and graphene zigzag edges at low temperatures. Carbon 2016, 107, 800–810. [Google Scholar] [CrossRef]
- Osipov, V.; Enoki, T.; Takai, K.; Takahara, K.; Endo, M.; Hayashi, T.; Hishiyama, Y.; Kaburagi, Y.; Vul’, A. Magnetic and high resolution TEM studies of nanographite derived from nanodiamond. Carbon 2006, 44, 1225–1234. [Google Scholar] [CrossRef]
- Prasad, B.L.; Sato, H.; Enoki, T.; Hishiyama, Y.; Kaburagi, Y.; Rao, A.M.; Eklund, P.C.; Oshida, K.; Endo, M. Structure and electronic properties of graphite nanoparticles. Phys. Rev. B 1998, 62, 11209. [Google Scholar] [CrossRef]
- Altchuler, S.A.; Kosirev, B.M. Spectroscopic investigation of thermal treatment of doped polypyrrole. Phys. Chem. 2000, 14, 3283–3291. [Google Scholar]

| Time | G | 2D | IG/I2D | ||
|---|---|---|---|---|---|
| Position, cm−1 | FWHD, cm−1 | Position, cm−1 | FWHD, cm−1 | ||
| 20 | 1584.1 | 18.4 | 2774.8 | 53.1 | 1.46 |
| 30 | 1578.6 | 20.7 | 2742.0 | 71.8 | 1.85 |
| Number | Field (mT) | G-Factor |
|---|---|---|
| 1 | 331.031 | 2.03256 |
| 2 | 340.608 | 1.98078 |
| 3 | 336.421 | 2.00544 |
| 4 | 336.524 | 2.00393 |
| 5 | 336.675 | 2.00293 |
| 6 | 336.841 | 2.00293 |
| 7 | 337.031 | 2.0018 |
| 8 | 337.285 | 2.0003 |
Disclaimer/Publisher’s Note: The statements, opinions and data contained in all publications are solely those of the individual author(s) and contributor(s) and not of MDPI and/or the editor(s). MDPI and/or the editor(s) disclaim responsibility for any injury to people or property resulting from any ideas, methods, instructions or products referred to in the content. |
© 2025 by the authors. Licensee MDPI, Basel, Switzerland. This article is an open access article distributed under the terms and conditions of the Creative Commons Attribution (CC BY) license (https://creativecommons.org/licenses/by/4.0/).
Share and Cite
Baitimbetova, B.A.; Boukhvalov, D.W.; Mit’, K.A.; Turmagambetov, T.S.; Baitimbetova, P.; Serikkanov, A.S. An Approach to the Improvement of Graphene Production by Ultrasonic-Bath Treatment. Nanomaterials 2025, 15, 817. https://doi.org/10.3390/nano15110817
Baitimbetova BA, Boukhvalov DW, Mit’ KA, Turmagambetov TS, Baitimbetova P, Serikkanov AS. An Approach to the Improvement of Graphene Production by Ultrasonic-Bath Treatment. Nanomaterials. 2025; 15(11):817. https://doi.org/10.3390/nano15110817
Chicago/Turabian StyleBaitimbetova, Bagila A., Danil W. Boukhvalov, Kostya A. Mit’, Tleuzhan S. Turmagambetov, Perizat Baitimbetova, and Abay S. Serikkanov. 2025. "An Approach to the Improvement of Graphene Production by Ultrasonic-Bath Treatment" Nanomaterials 15, no. 11: 817. https://doi.org/10.3390/nano15110817
APA StyleBaitimbetova, B. A., Boukhvalov, D. W., Mit’, K. A., Turmagambetov, T. S., Baitimbetova, P., & Serikkanov, A. S. (2025). An Approach to the Improvement of Graphene Production by Ultrasonic-Bath Treatment. Nanomaterials, 15(11), 817. https://doi.org/10.3390/nano15110817