
Breaking the Hardness-Wear Trade-Off: Quantitative Correlation in Nano-Al2O3-Reinforced Al10Cr17Fe20NiV4 High-Entropy Alloys


Abstract
1. Introduction
2. Materials and Methods
3. Results
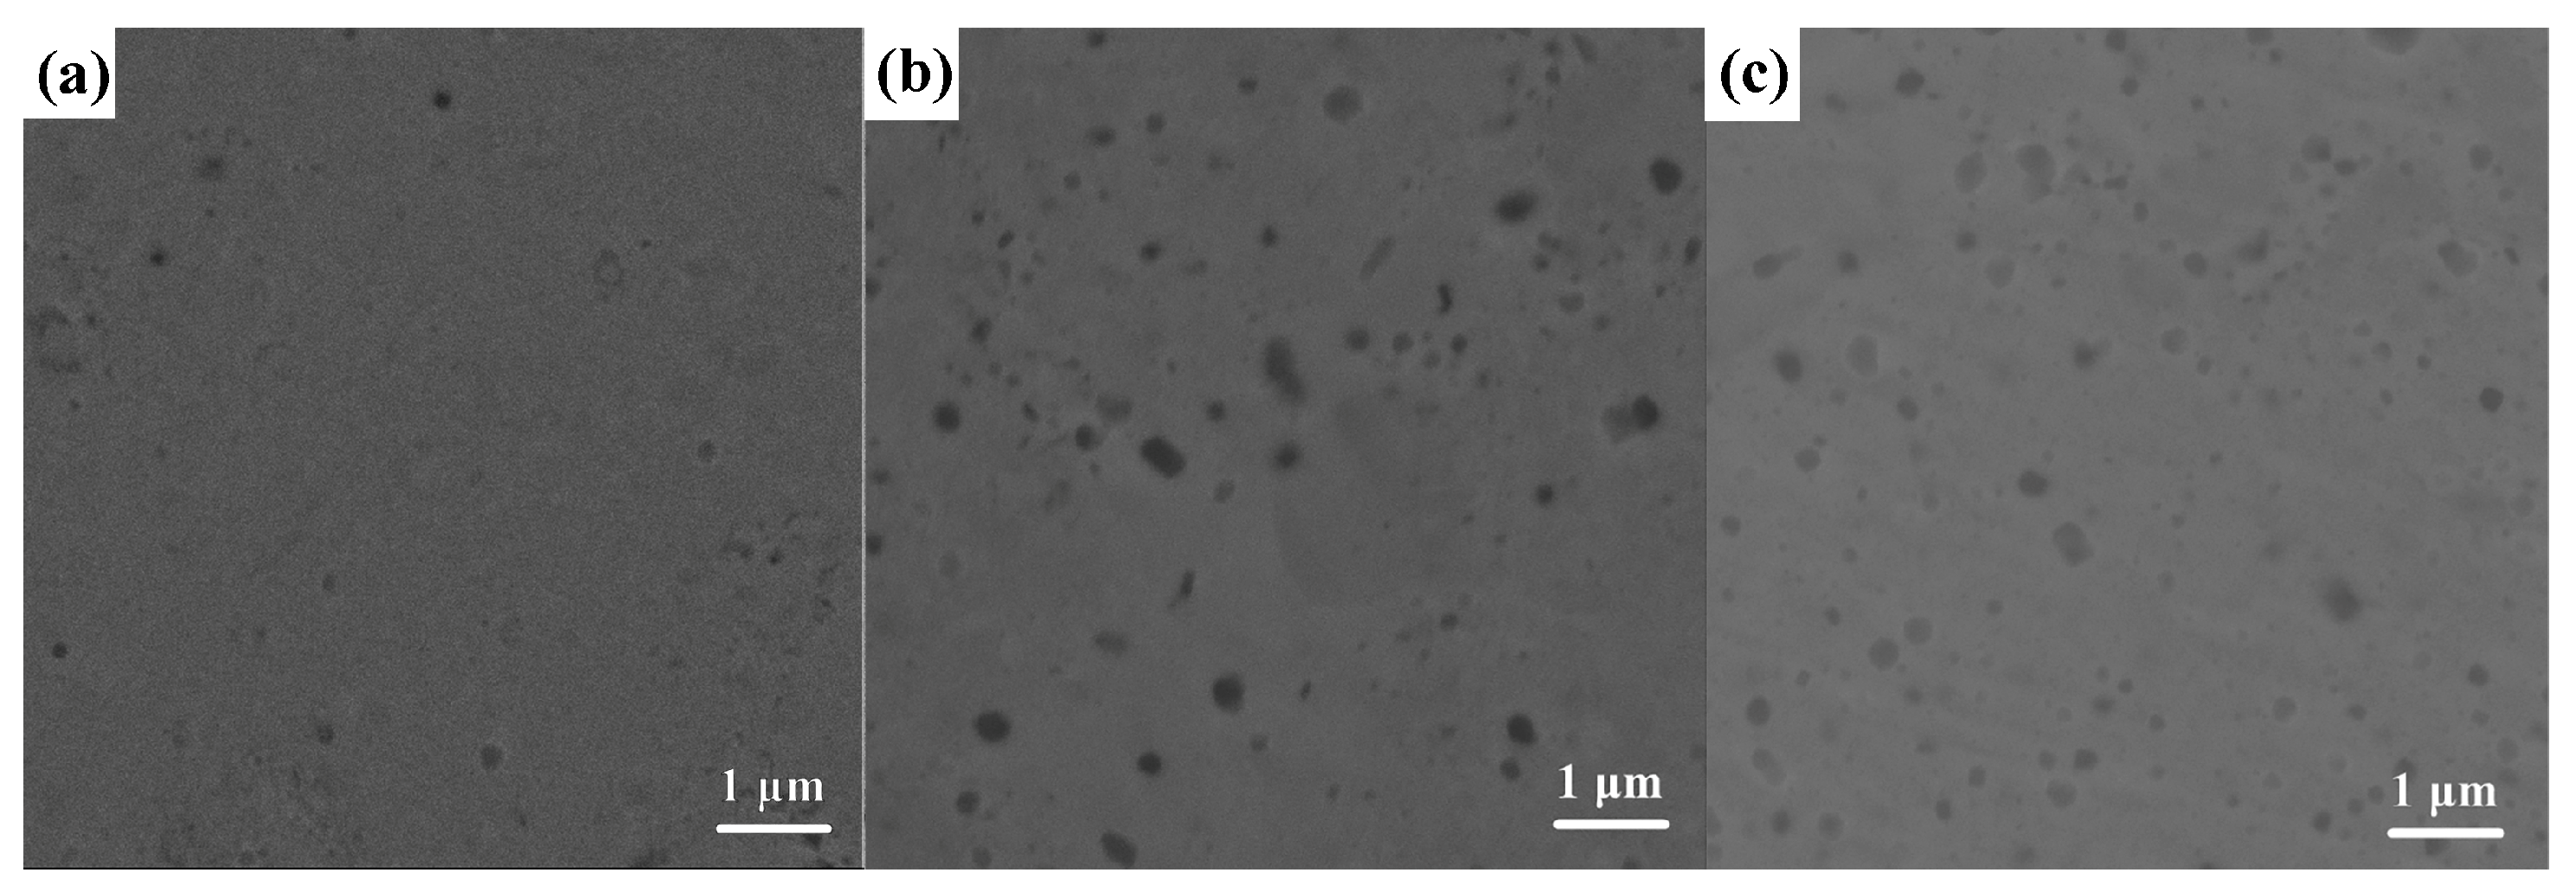
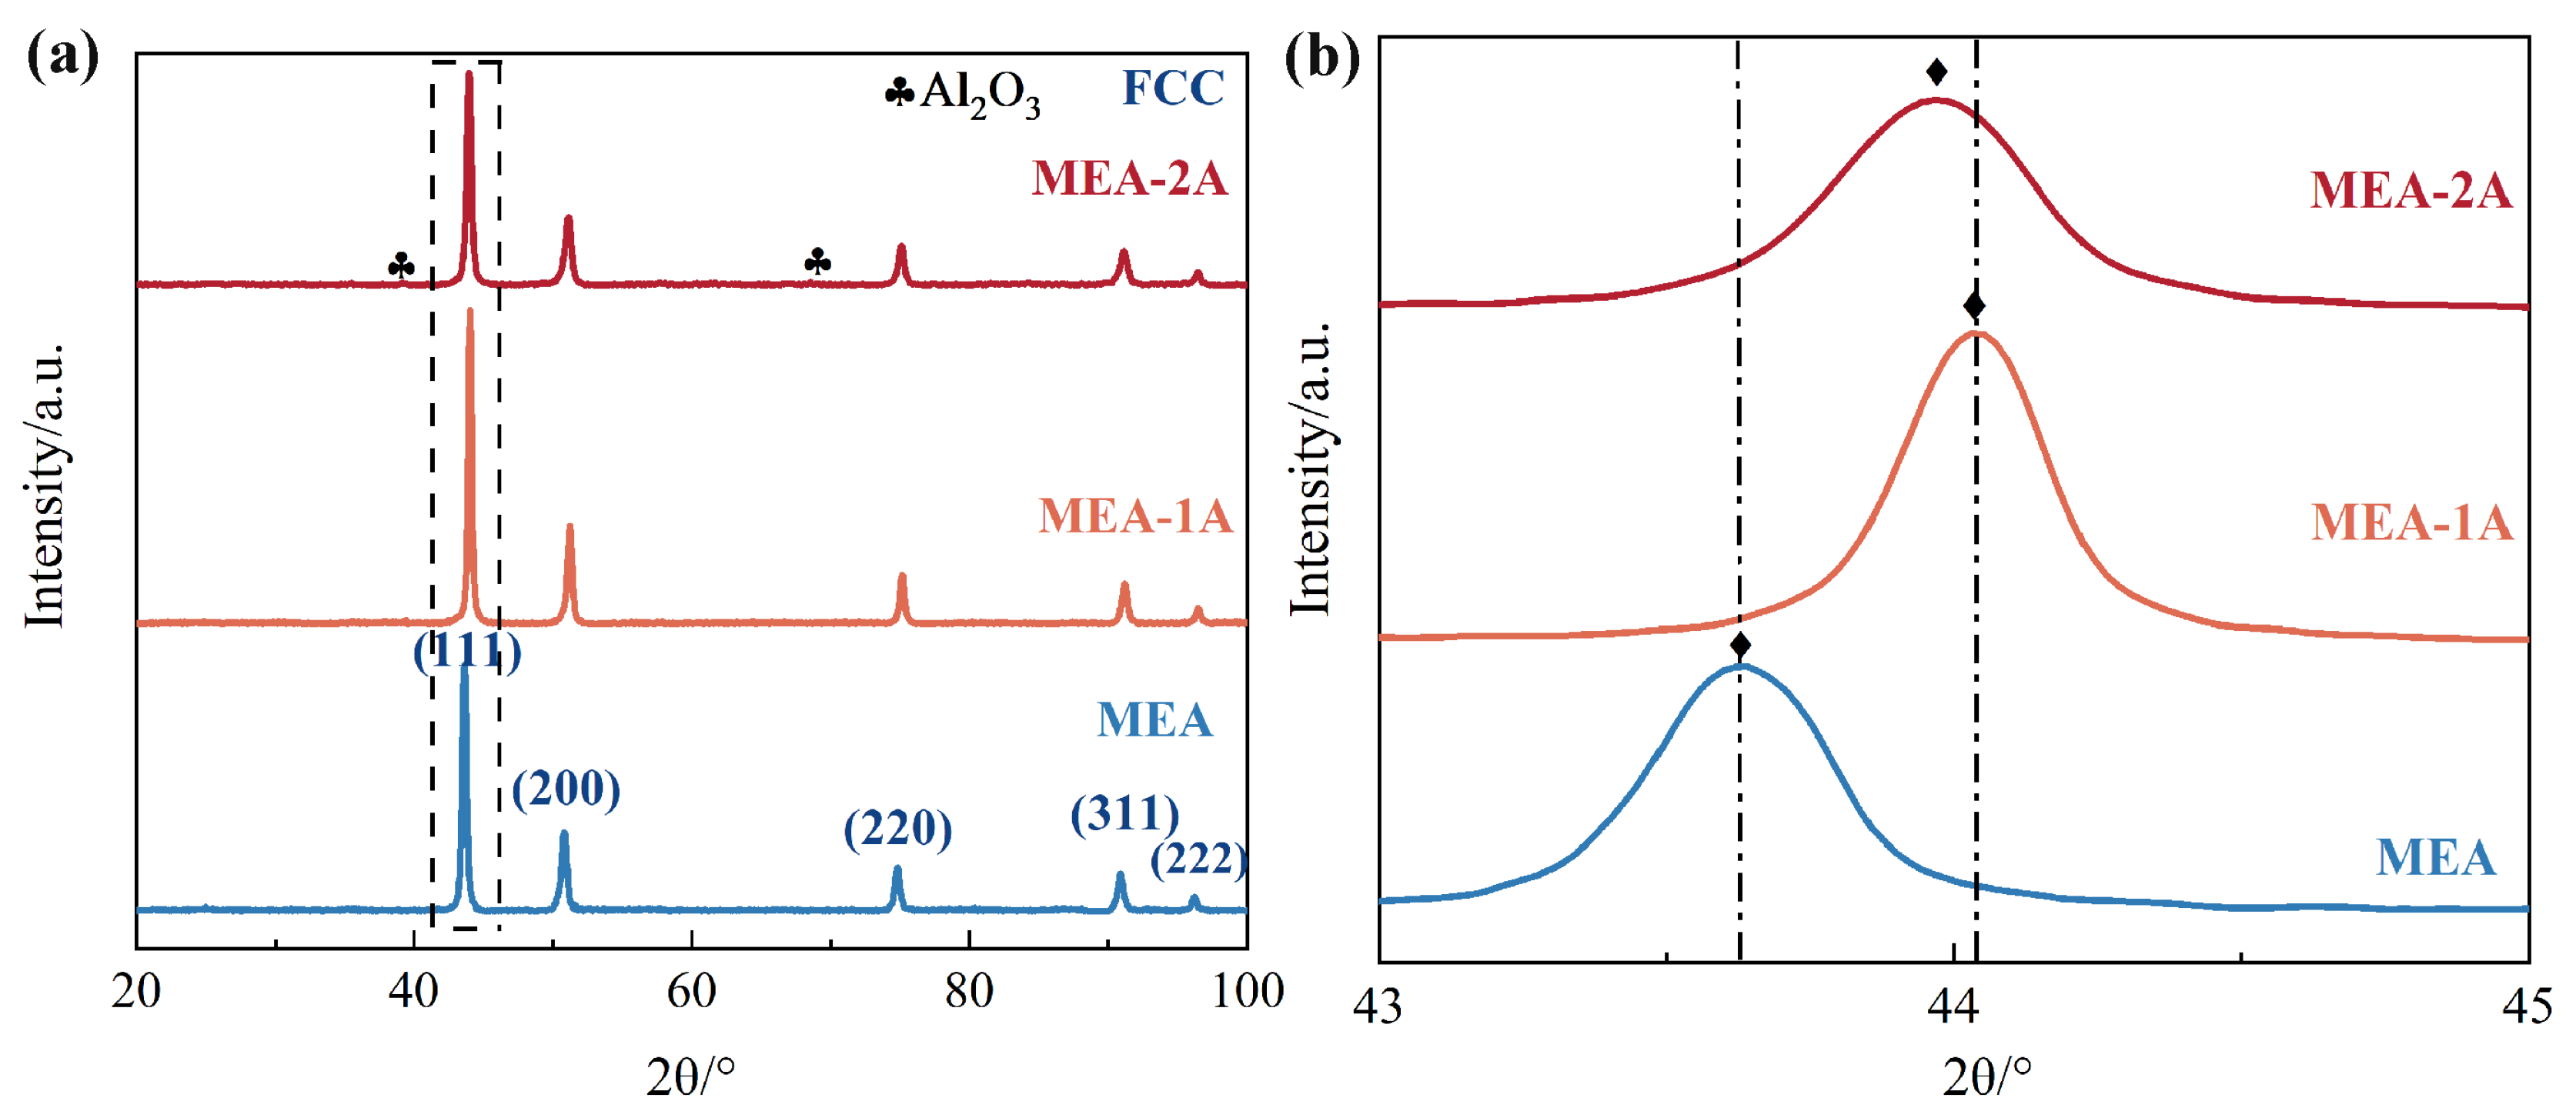
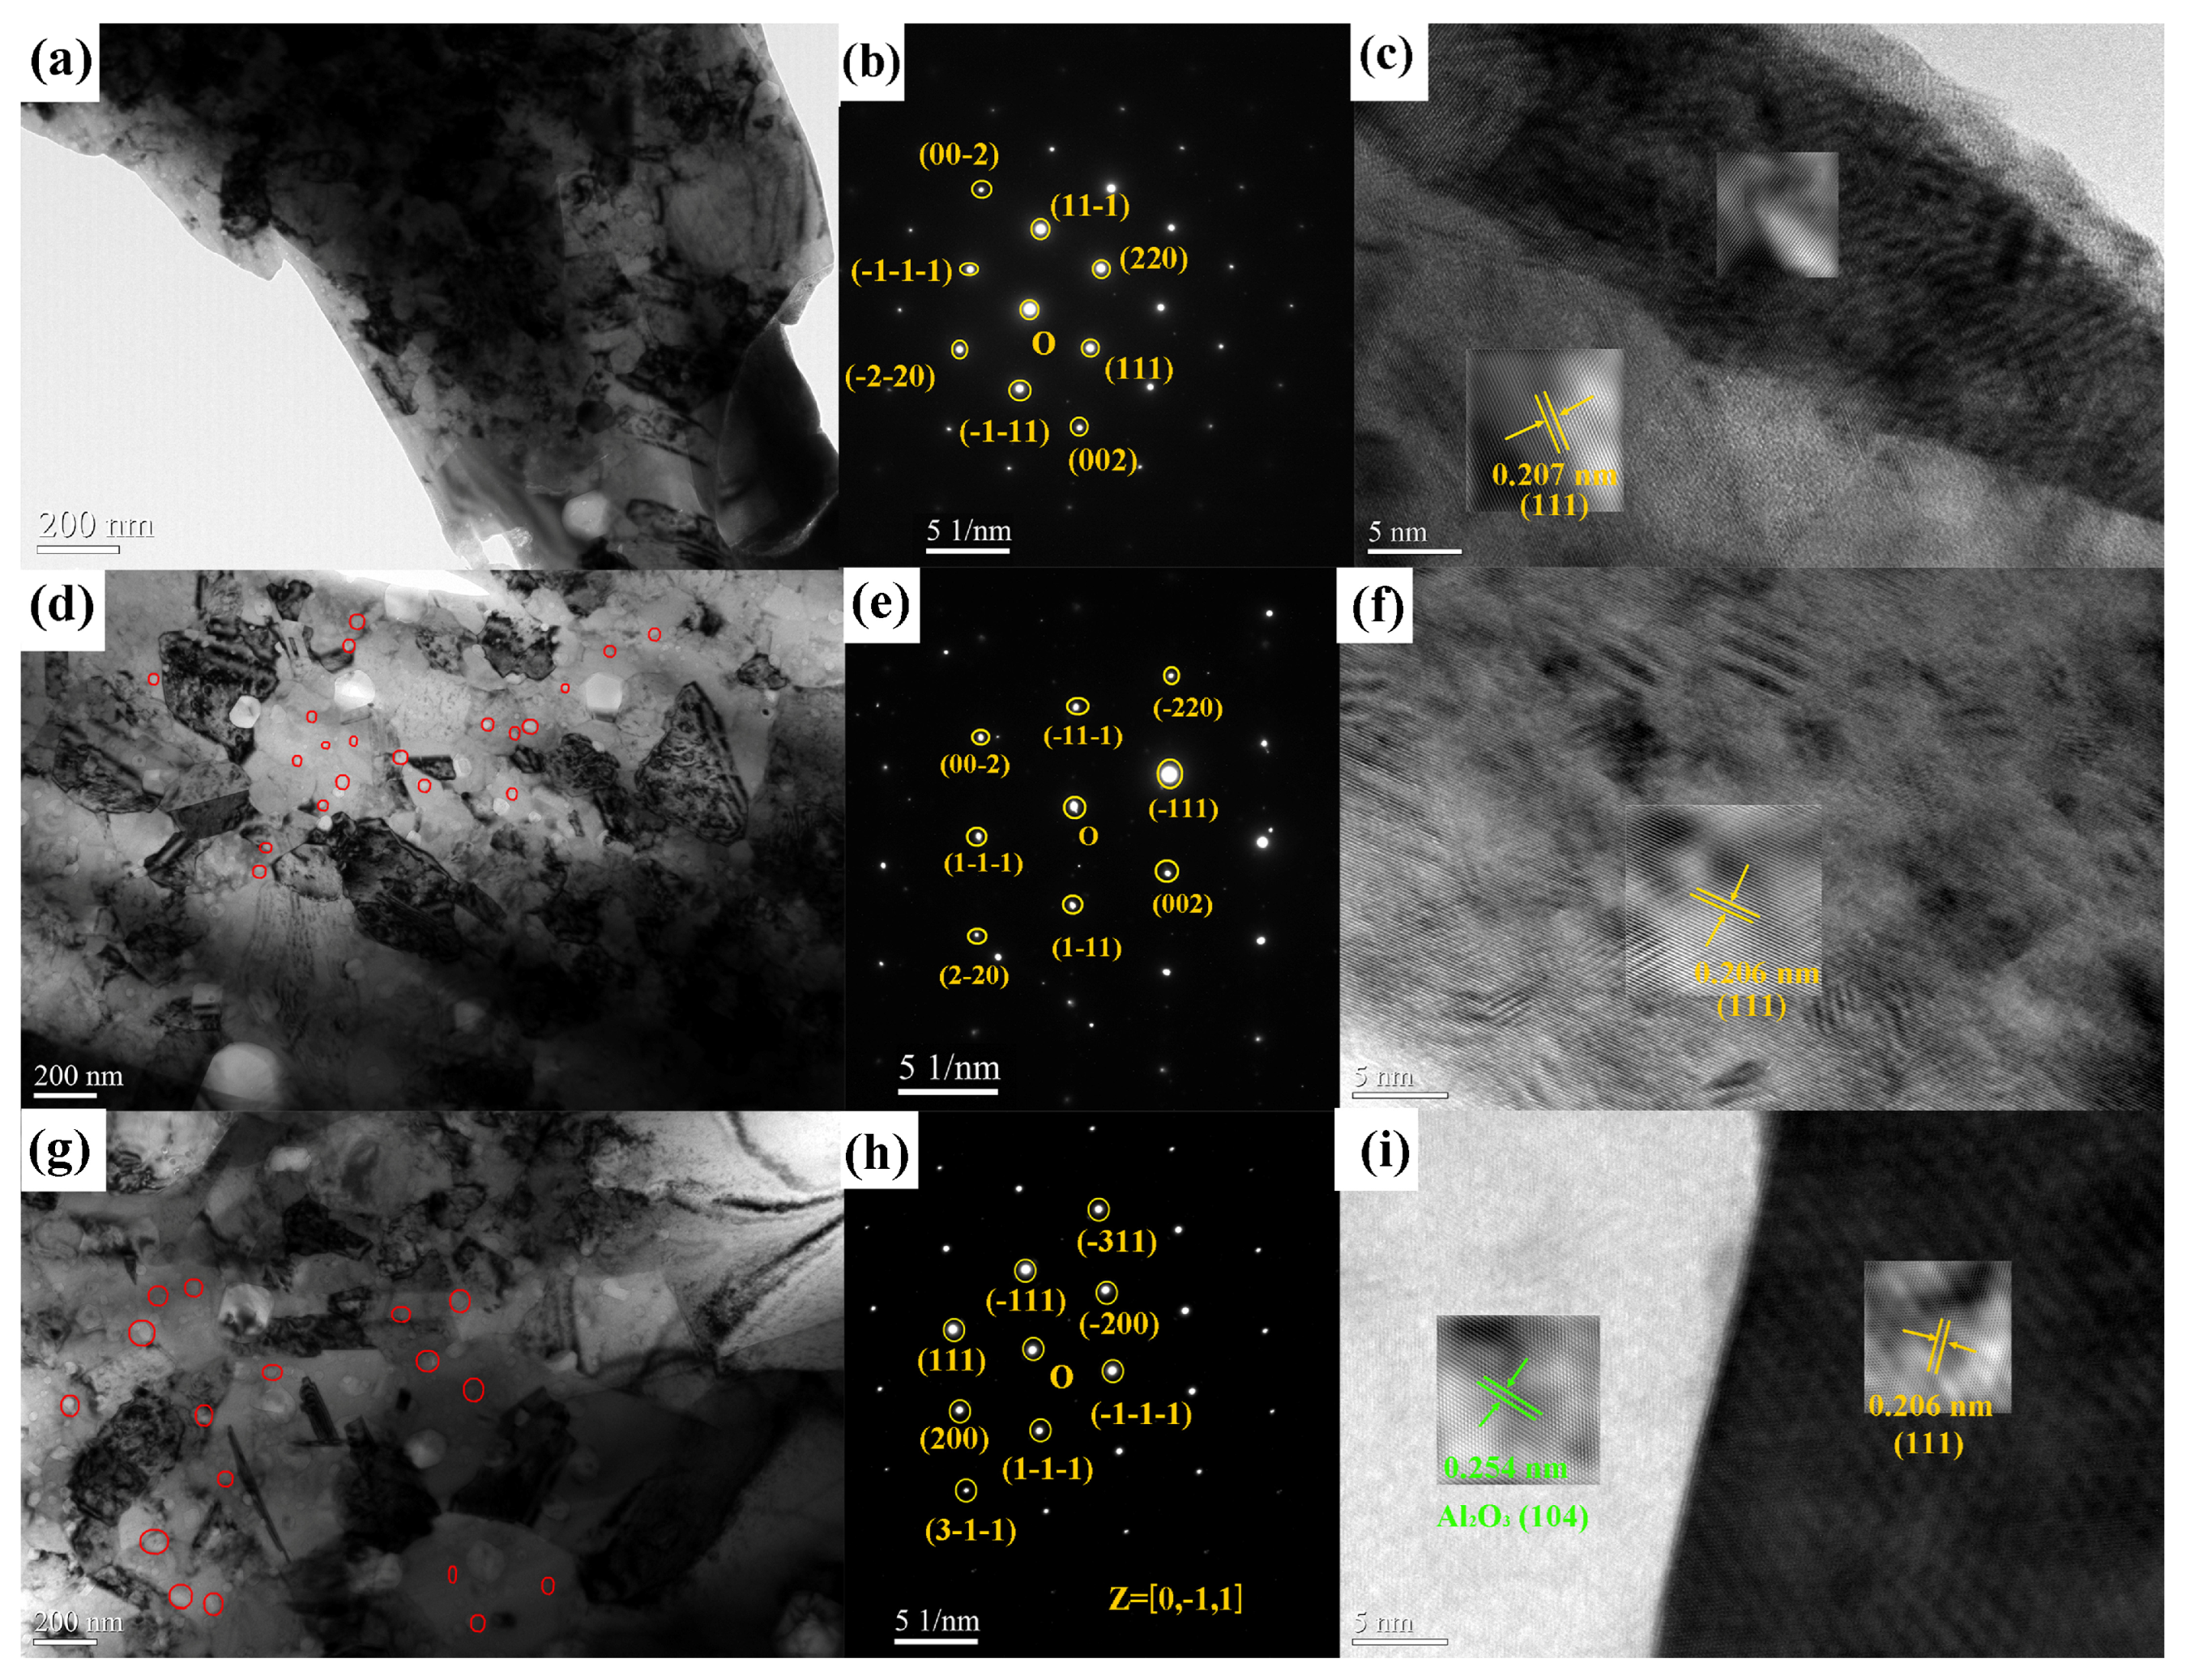
3.1. Transformation of Microstructures
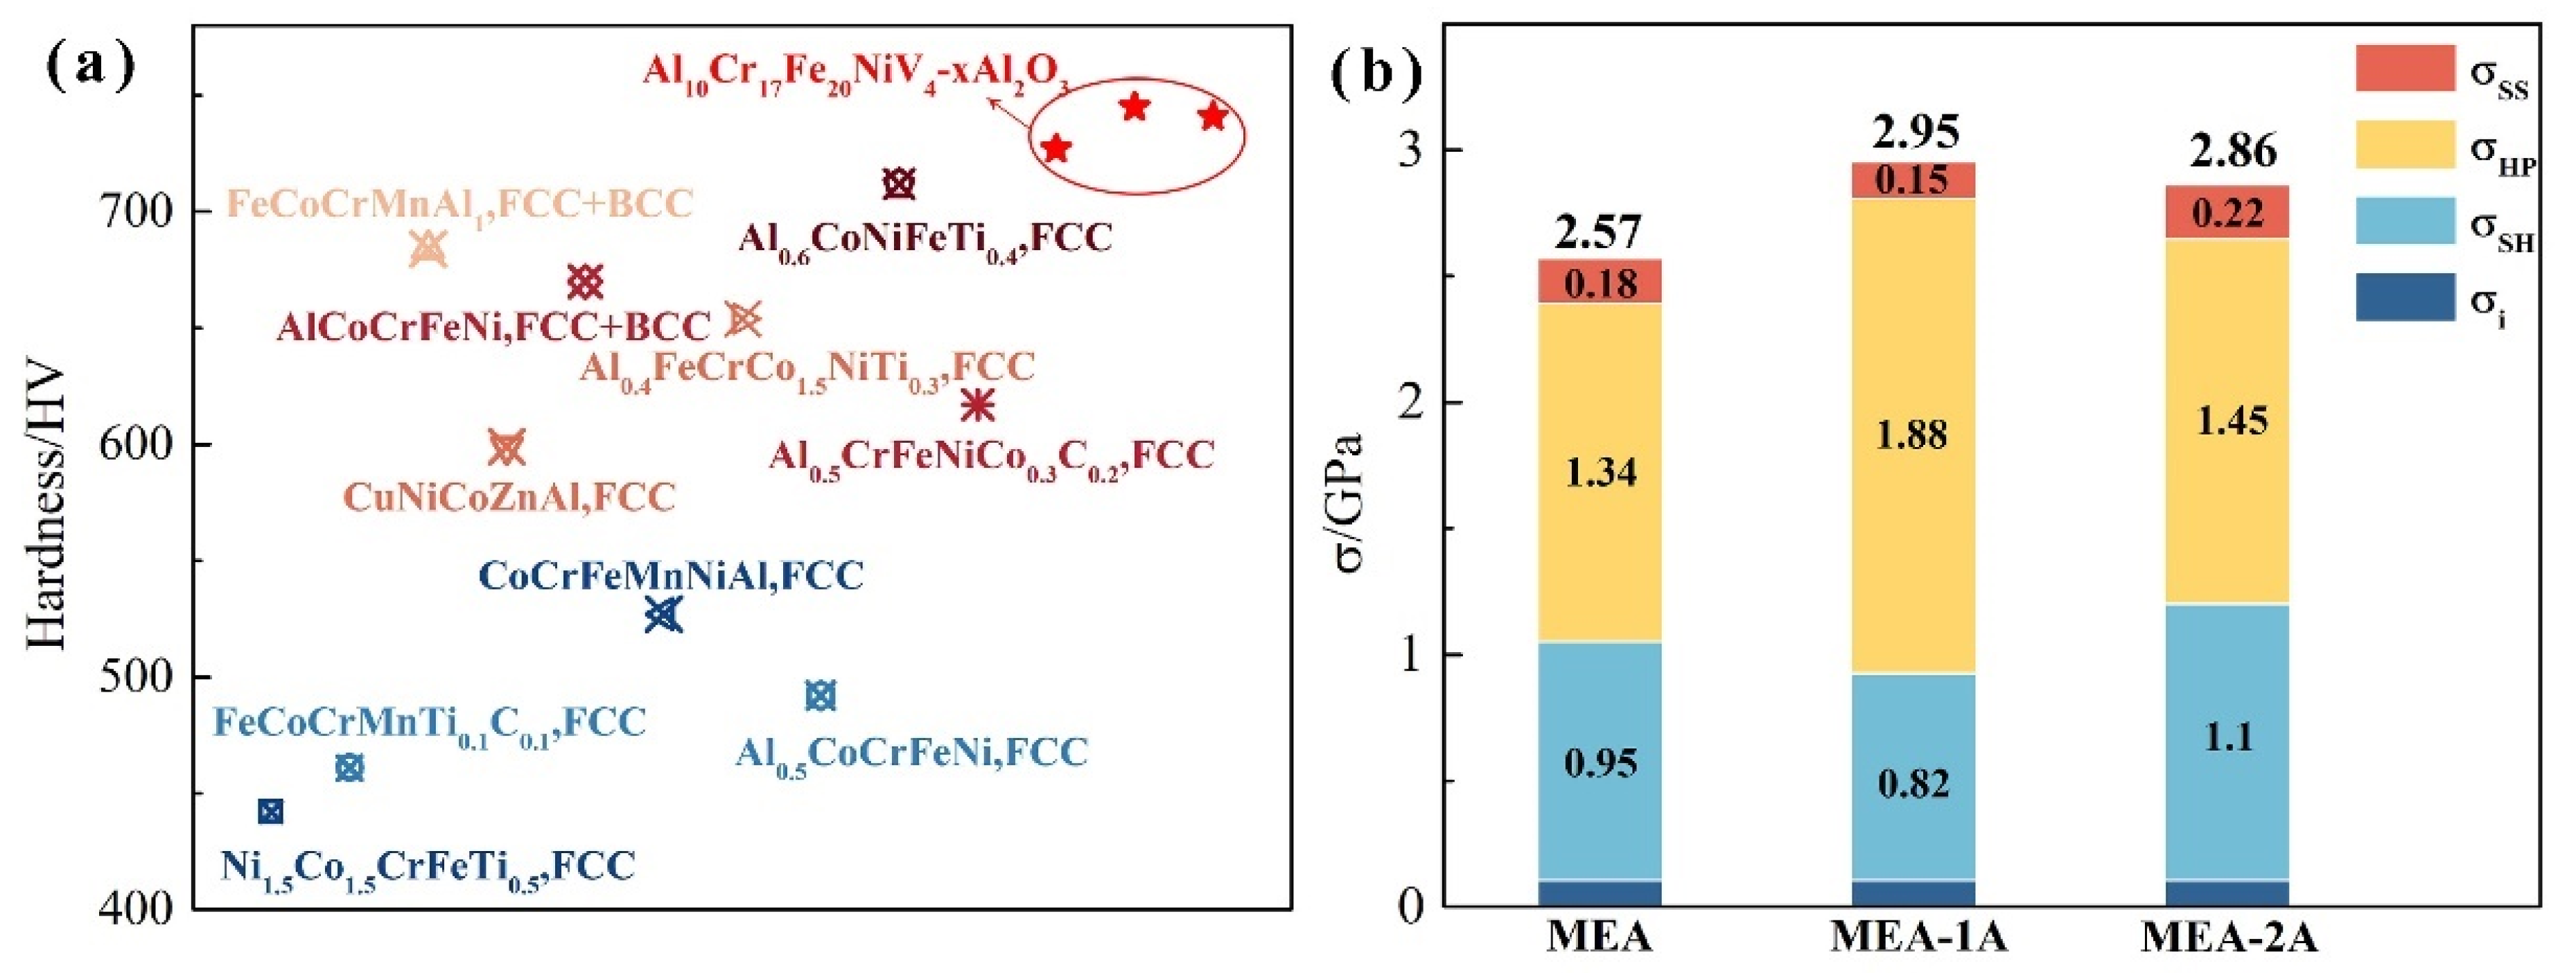
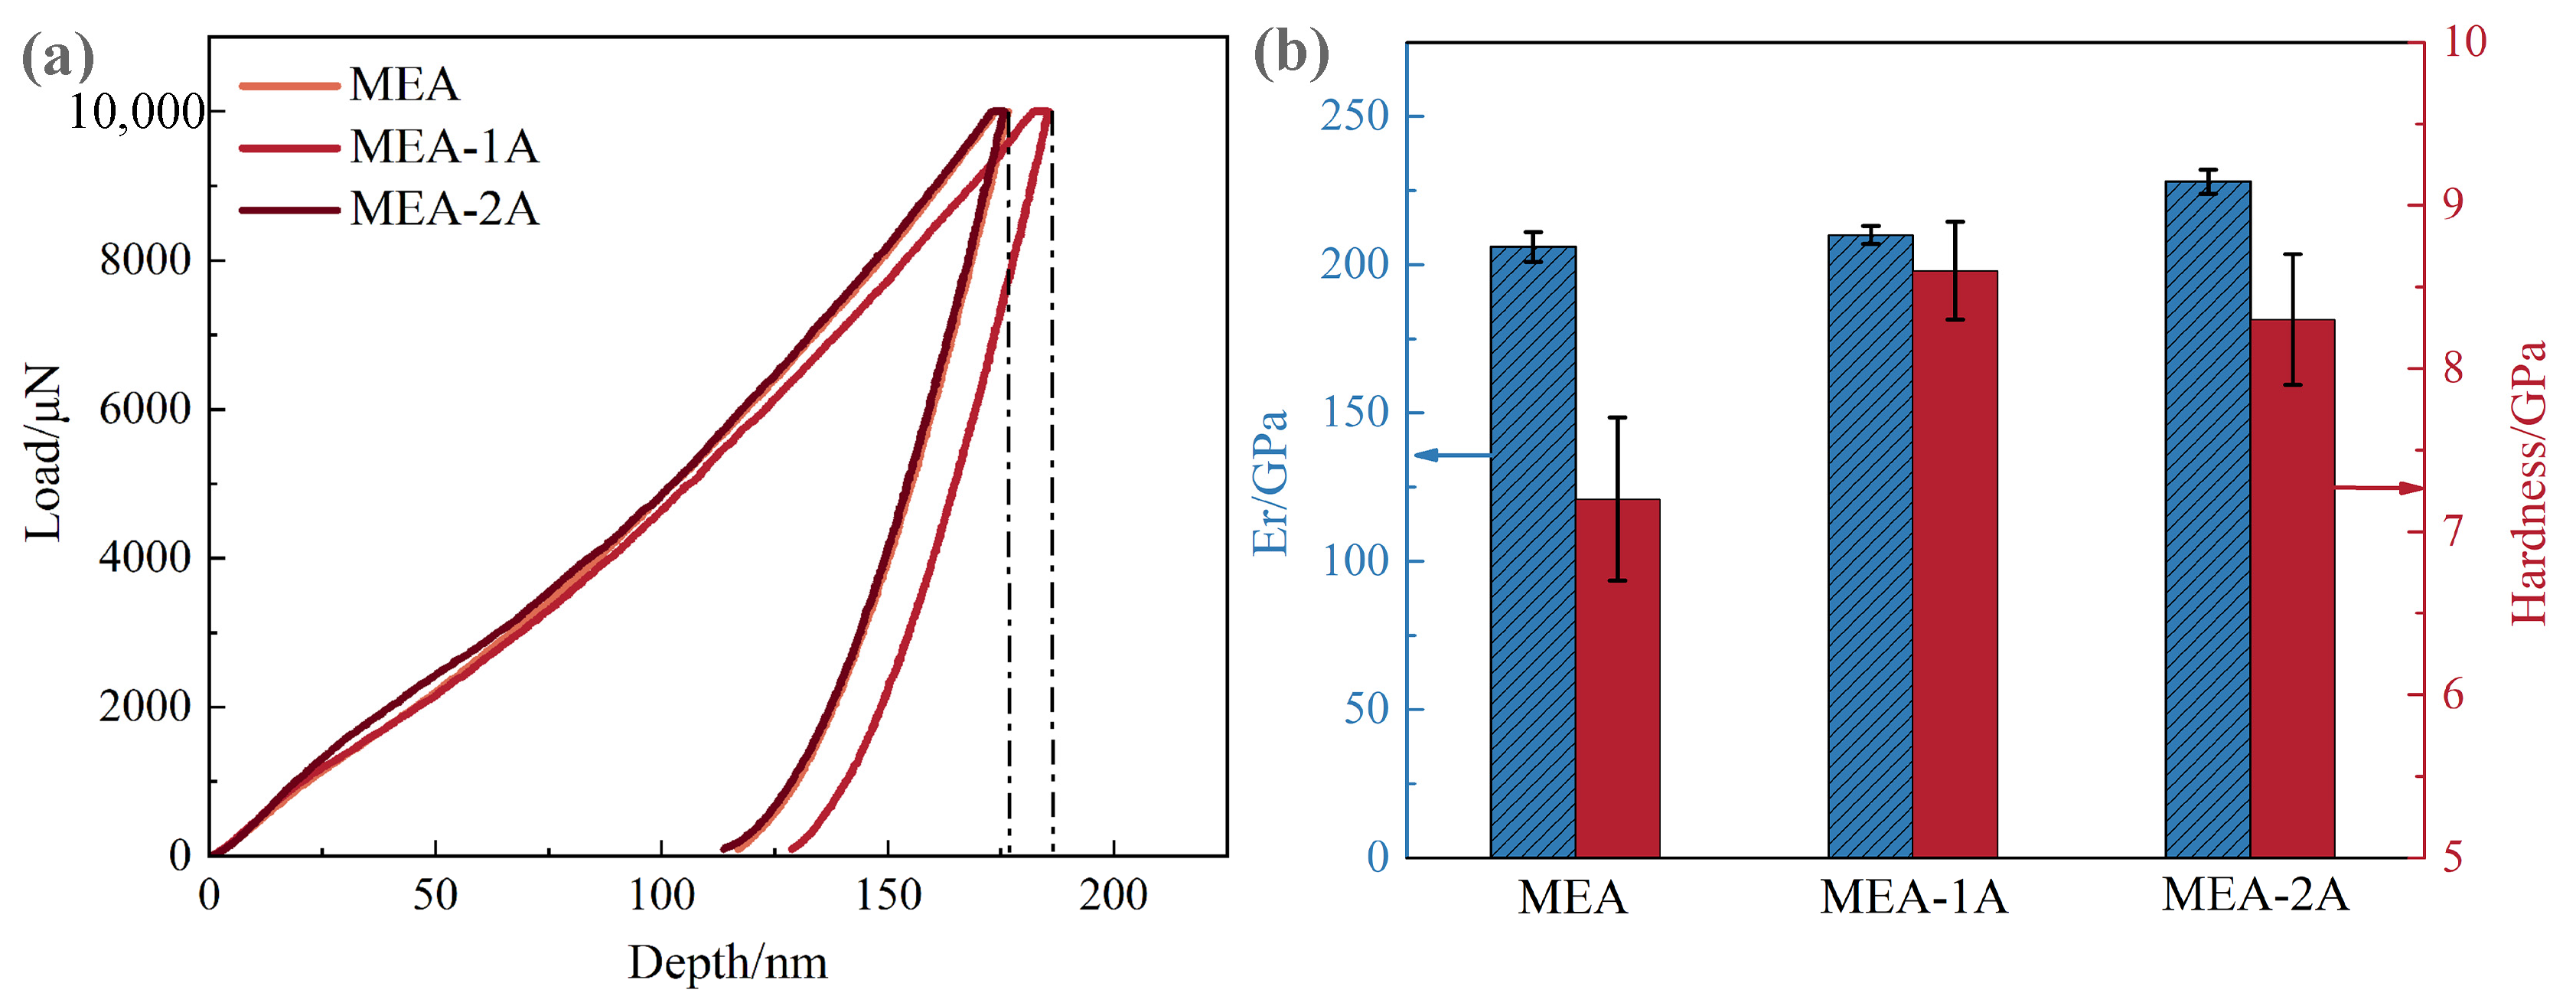
3.2. Mechanical Test
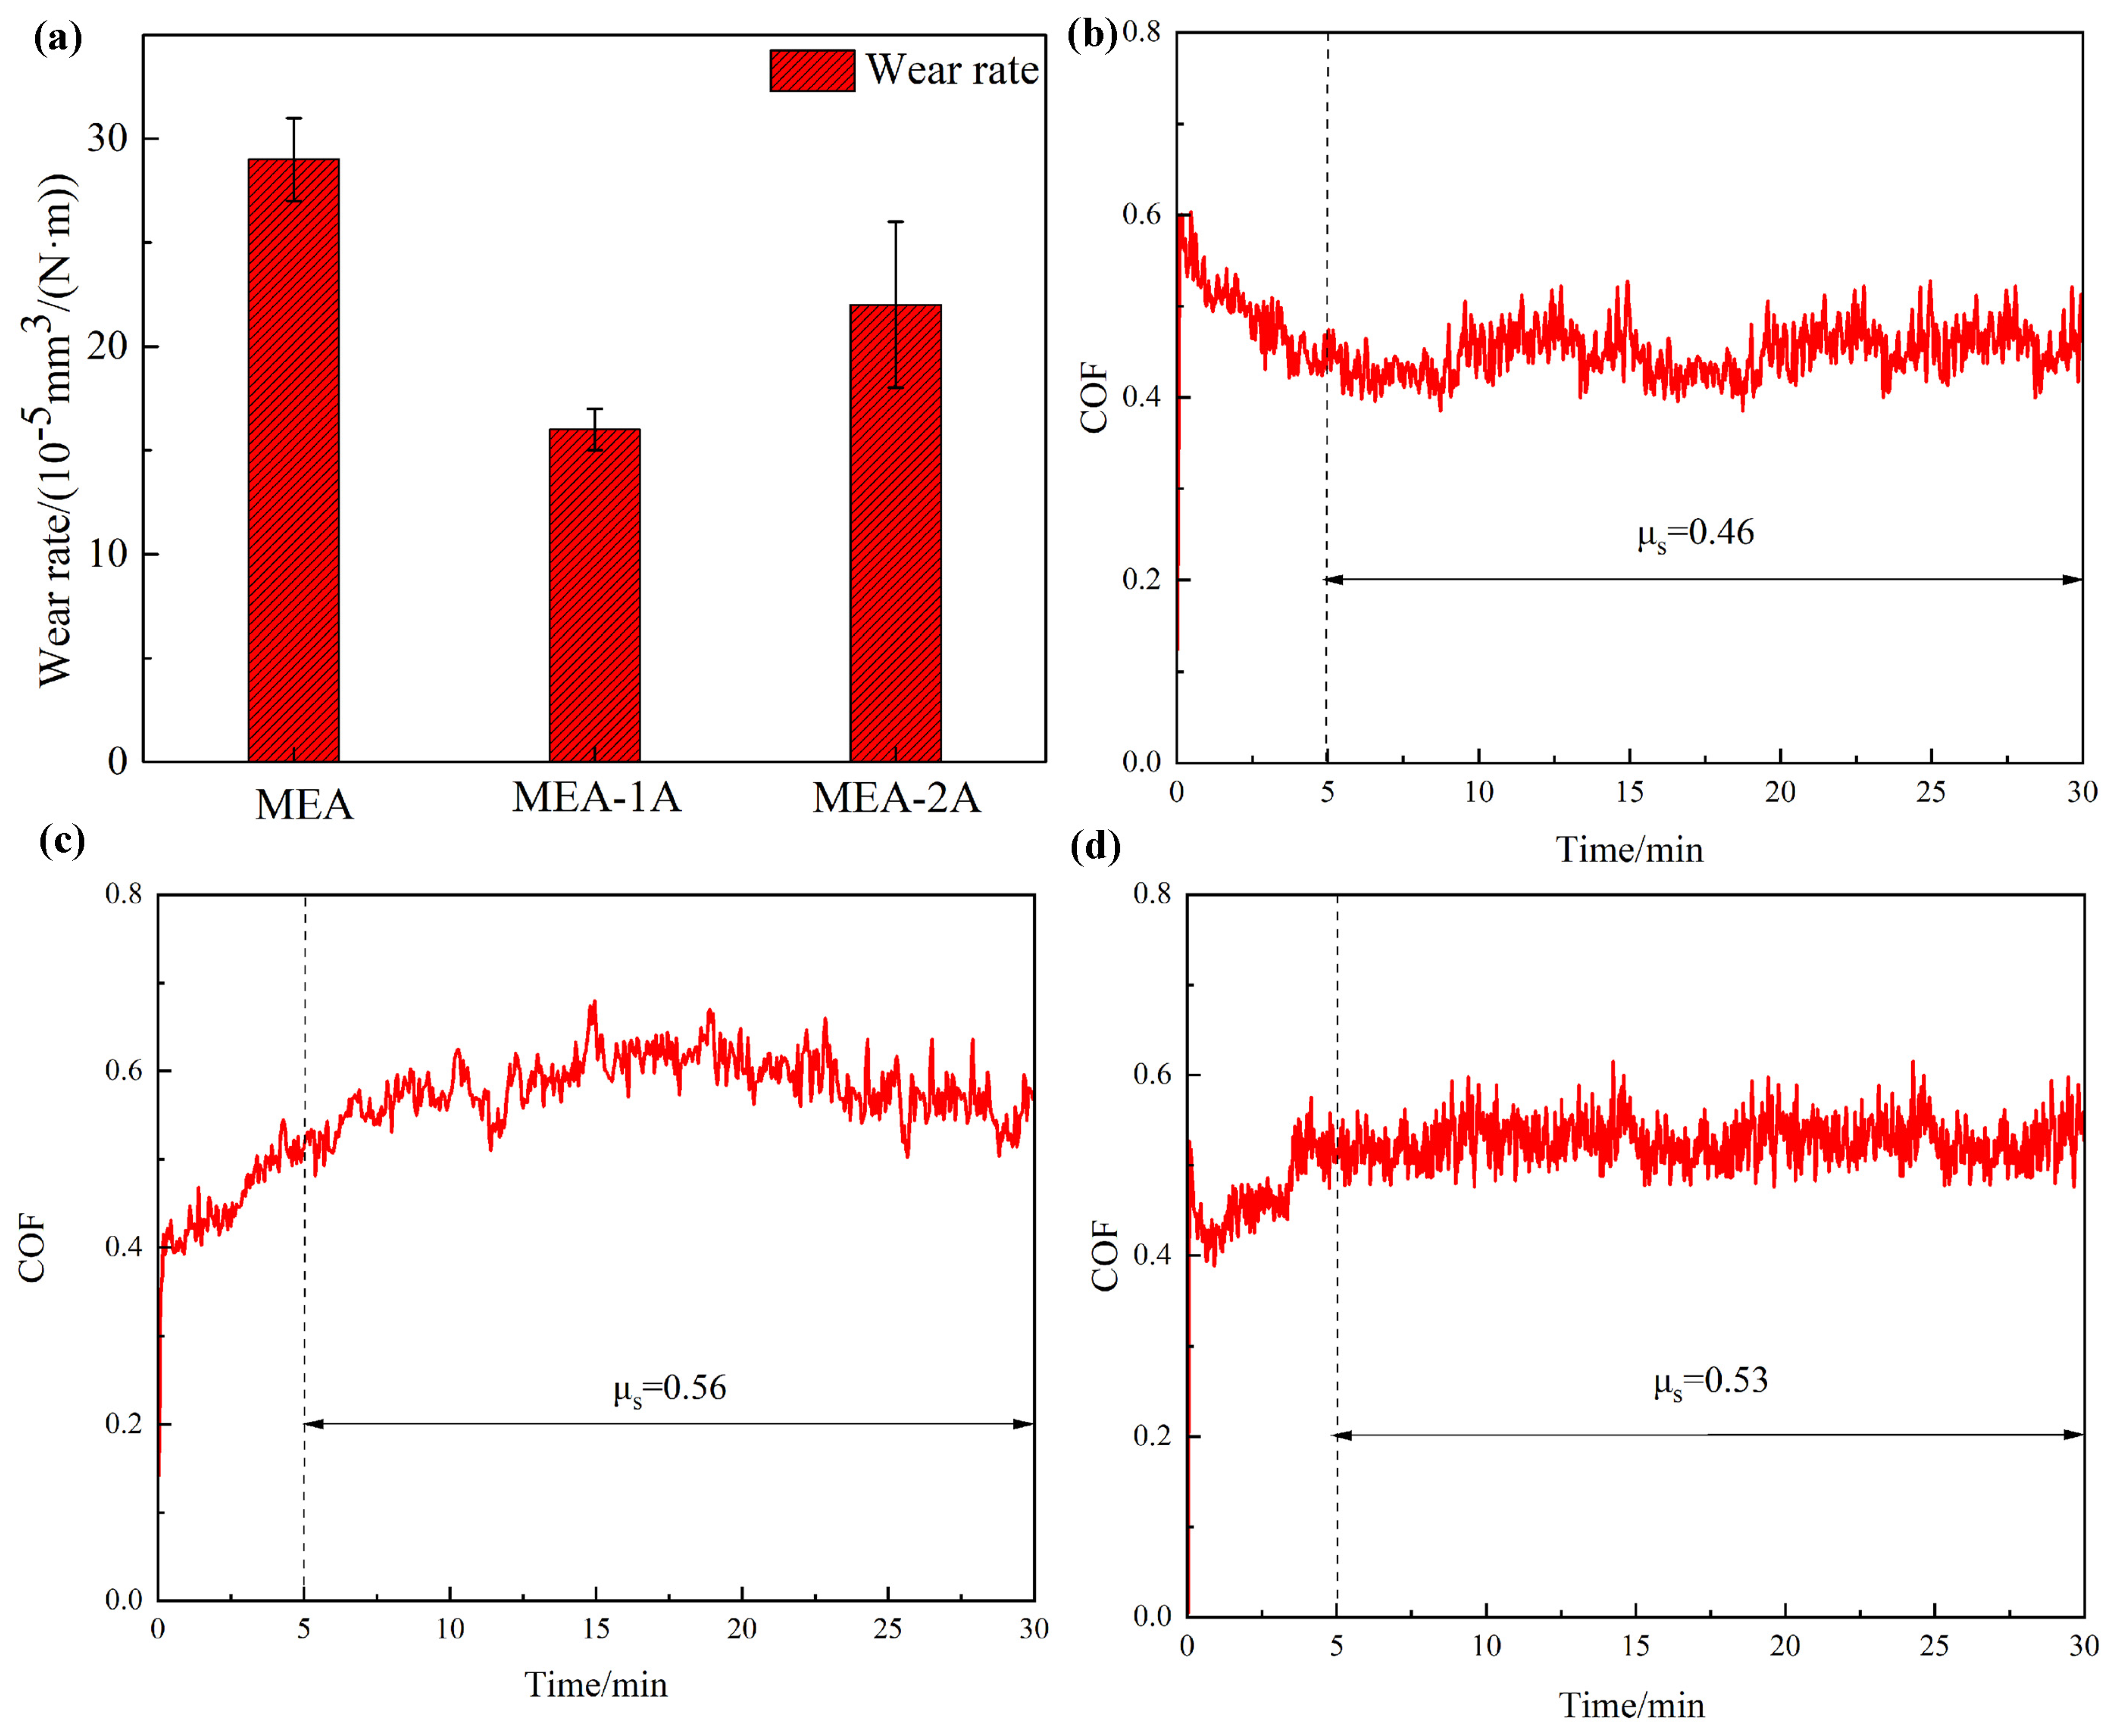
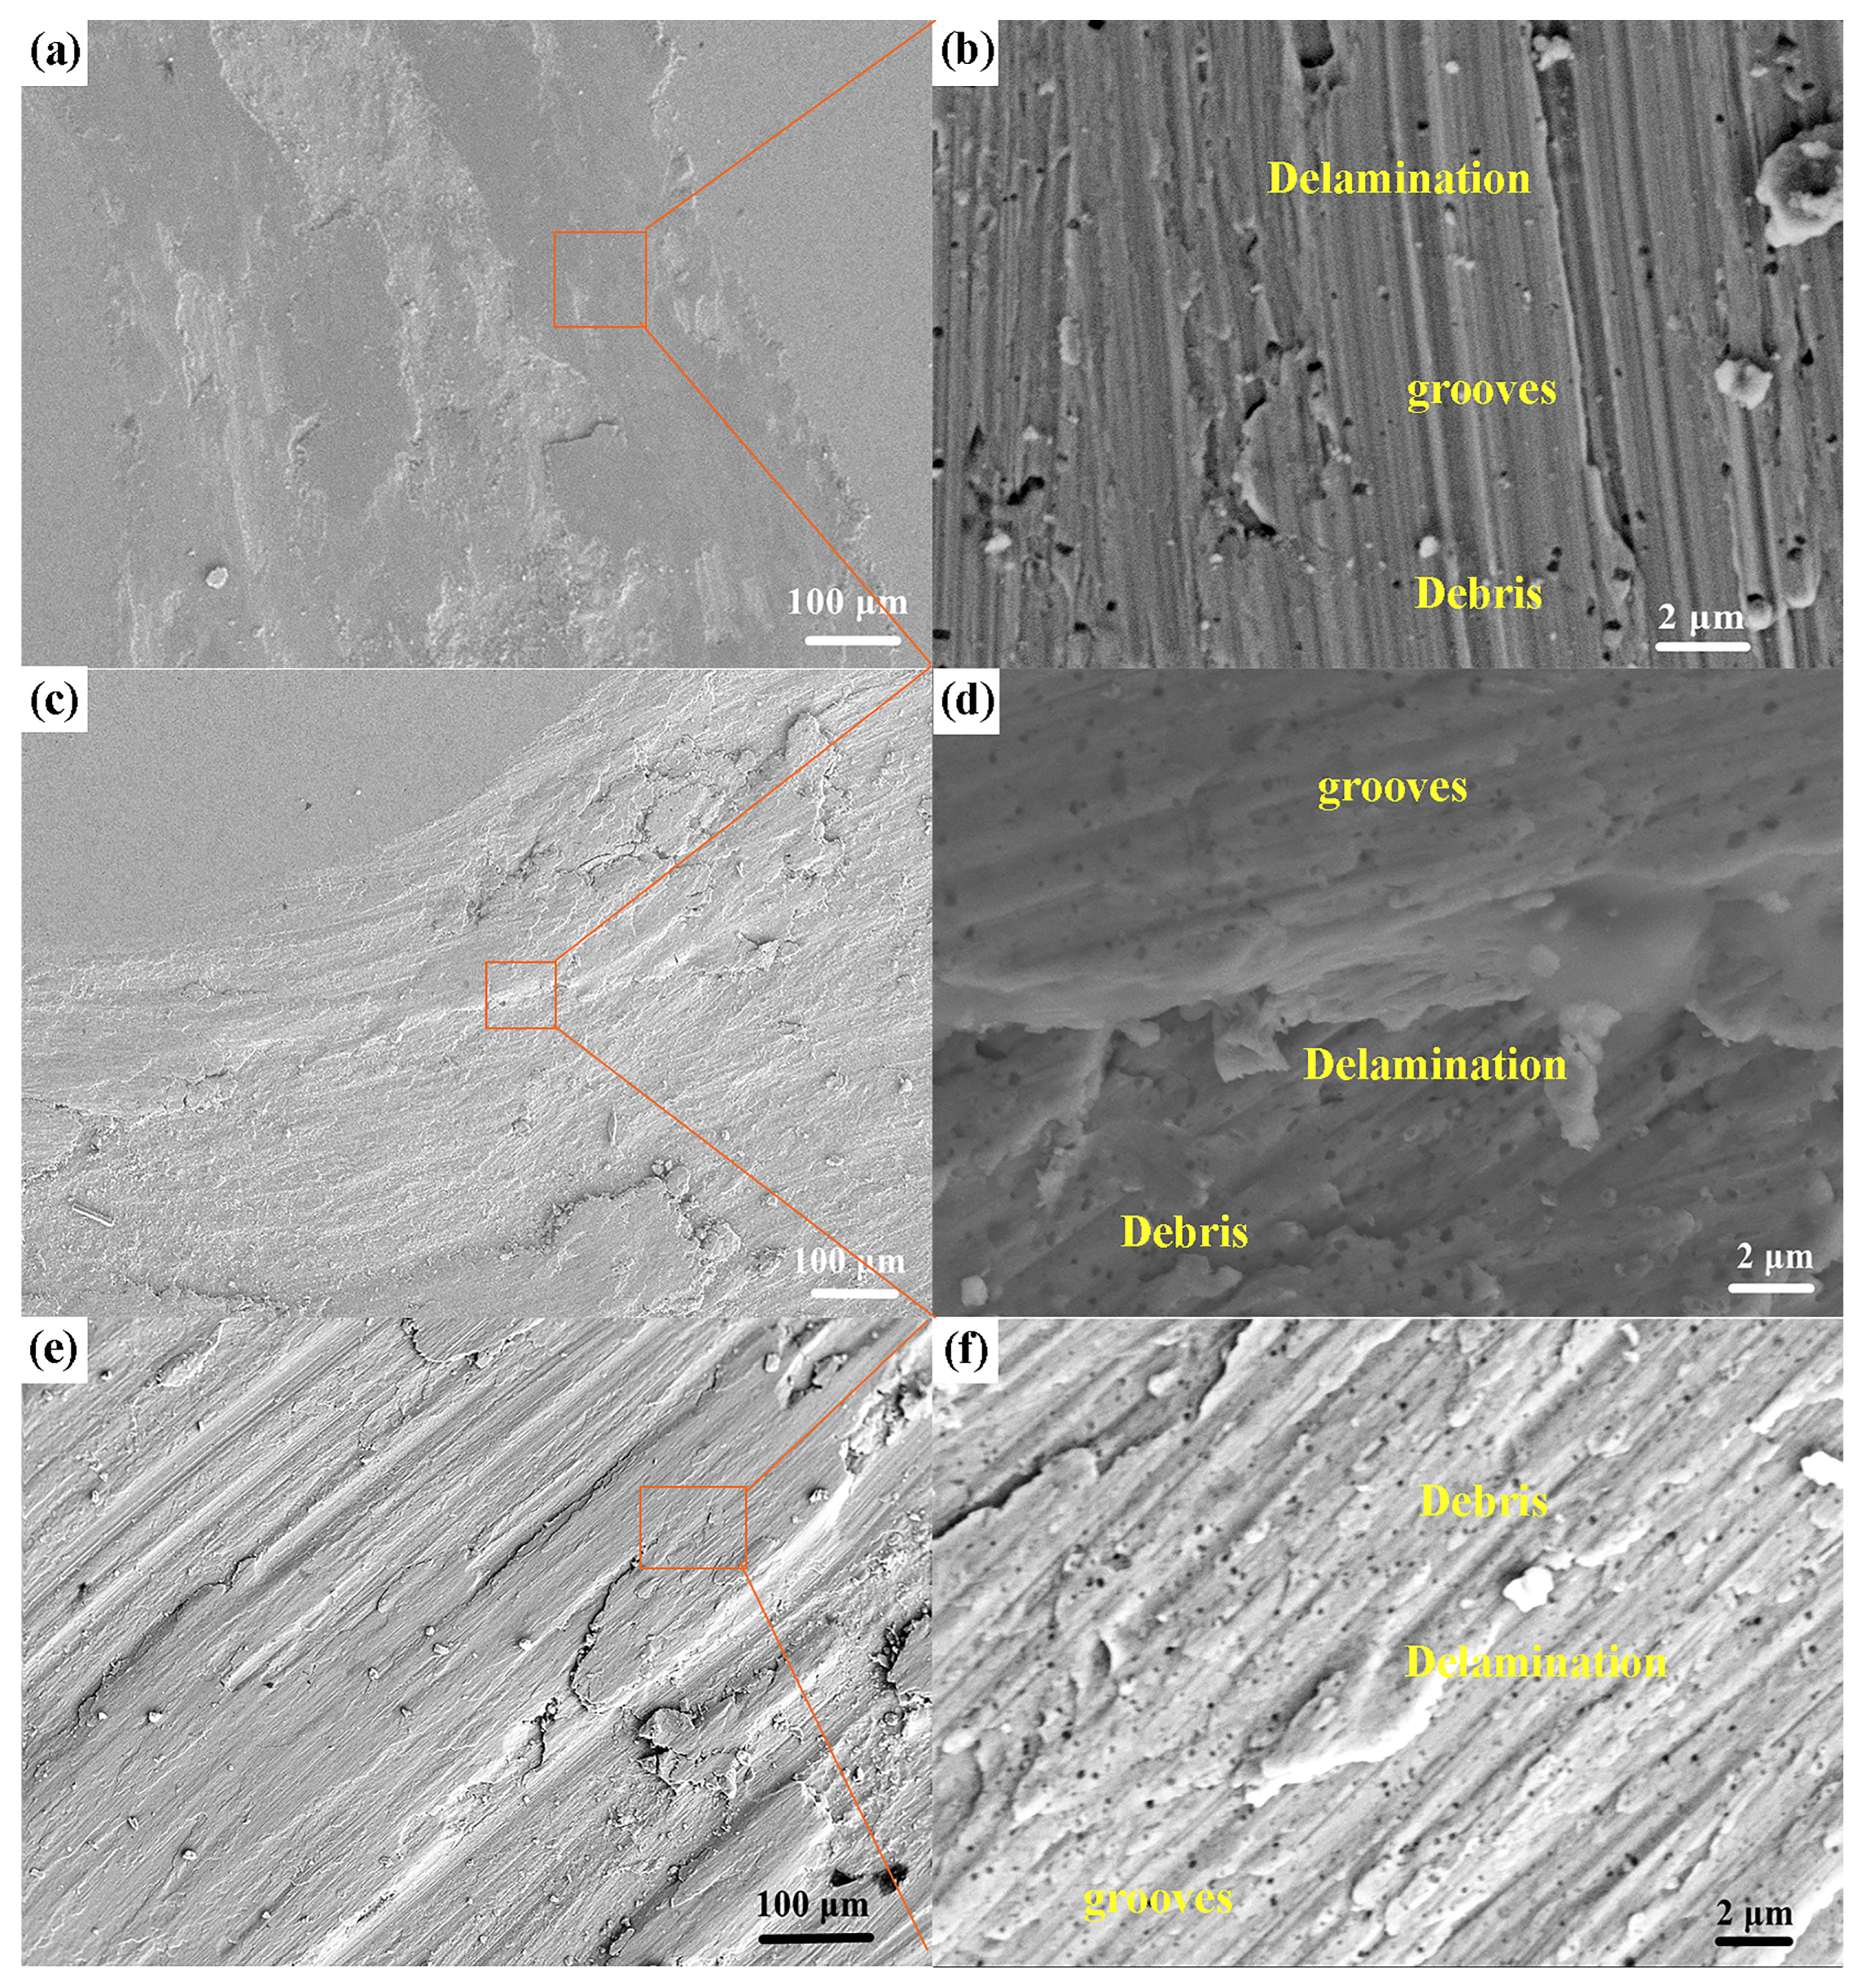
3.3. Wear Performance
4. Discussion
4.1. Effect of Nano-Al2O3 on Hardness
4.2. Effect of Nano-Al2O3 on Wear Performance
5. Conclusions
Author Contributions
Funding
Data Availability Statement
Conflicts of Interest
References
- Chen, X.; Wang, Q.; Cheng, Z.; Zhu, M.; Zhou, H.; Jiang, P.; Zhou, L.; Xue, Q.; Yuan, F.; Zhu, J.; et al. Direct observation of chemical short-range order in a medium-entropy alloy. Nature 2021, 592, 712–716. [Google Scholar] [CrossRef] [PubMed]
- Guo, B.; Cui, D.; Wu, Q.; Ma, Y.; Wei, D.; Kumara, L.S.R.; Zhang, Y.; Xu, C.; Wang, Z.; Li, J.; et al. Segregation-dislocation self-organized structures ductilize a work-hardened medium entropy alloy. Nat. Commun. 2025, 16, 1475. [Google Scholar] [CrossRef]
- Gou, J.; Liu, G.; Yang, T.; Liu, X.; Pan, Y.; Liu, C.; Qian, Y.; Liu, Y.; Chen, Y.; Zhang, X.; et al. A high-entropy alloy showing gigapascal superelastic stress and nearly temperature-independent modulus. Nat. Commun. 2025, 16, 1227. [Google Scholar] [CrossRef] [PubMed]
- Pacchioni, G. Designing ductile refractory high-entropy alloys. Nat. Rev. Mater. 2025, 10, 1. [Google Scholar] [CrossRef]
- Wang, T.; Jiang, W.; Wang, X.; Jiang, B.; Wang, X.; Wang, Y.; Xu, H.; Hu, M.; Zhu, D. An investigation on high-temperature properties of a lightweight AlNbTiV2 refractory high-entropy alloy reinforced by Si. Intermetallics 2025, 180, 108705. [Google Scholar] [CrossRef]
- Zhang, W.-H.; Li, T.; Chen, Y.; Tan, Y.-Y.; Wang, H.-Y.; Dai, L.-H. A novel reactive high-entropy alloy with ultra-strong strain-rate effect. Intermetallics 2025, 180, 108689. [Google Scholar] [CrossRef]
- Wang, G.-Y.; Hsu, W.-C.; Huang, Z.-W.; Yeh, J.-W.; Tsai, C.-W. The growth activation energy of sigma phase in nonequal molar CoCrFeNiV low entropy and high entropy alloys. J. Alloys Compd. 2025, 1017, 178863. [Google Scholar] [CrossRef]
- Yang, H.; Zeng, Z.; Xiong, T.; Shao, Z.; Lu, Q.; Zhang, S. High-temperature mechanical properties and radiation resistance properties of reduced-activation high-entropy alloys FeMnCrTi0.1. J. Alloys Compd. 2025, 1014, 178746. [Google Scholar] [CrossRef]
- Heidari, E.; Moazami, S.; Bahrami, A. On the microstructure, electrochemical properties, biocompatibility, and cytotoxicity of TiAlFeCoX (X = Ni, Cu) high-entropy alloy thin films, deposited by DC magnetron sputtering. Mater. Chem. Phys. 2025, 337, 130617. [Google Scholar] [CrossRef]
- Mazo, J.H.; Soares, C.; Inui, G.K. Structural and mechanical properties of refractory Nb30X25Ti25Al15V5 (X = Zr, Mo) high-entropy alloys. Mater. Sci. Eng. A 2025, 929, 148053. [Google Scholar] [CrossRef]
- Yang, Q.; Cai, X.; Huang, L.; Dong, P.; Ren, C.; Zhou, Y.; Li, J.; Shuai, M. High strength-ductile lightweight Al-Ti-Zr-Nb-Ta refractory high-entropy alloy via laser directed energy deposition. Mater. Sci. Eng. A 2025, 924, 147831. [Google Scholar] [CrossRef]
- Yeh, J.W.; Chen, S.K.; Lin, S.J.; Gan, J.Y.; Chin, T.S.; Shun, T.T.; Tsau, C.H.; Chang, S.Y. Nanostructured high-entropy alloys with multiple principal elements: Novel alloy design concepts and outcomes. Adv. Eng. Mater. 2004, 6, 299–303. [Google Scholar] [CrossRef]
- Cantor, B.; Chang, I.; Knight, P.; Vincent, A.J.B. Microstructural development in equiatomic multicomponent alloys. Mater. Sci. Eng. A 2004, 375–377, 213–218. [Google Scholar] [CrossRef]
- Cheng, H.; Liu, X.; Tang, Q.; Wang, W.; Yan, X.; Dai, P. Microstructure and mechanical properties of FeCoCrNiMnAlx high-entropy alloys prepared by mechanical alloying and hot-pressed sintering. J. Alloys Compd. 2018, 775, 742–751. [Google Scholar] [CrossRef]
- Salemi, F.; Karimzadeh, F.; Abbasi, M.H. Evaluation of thermal and mechanical behavior of CuNiCoZnAl high-entropy alloy fabricated using mechanical alloying and spark plasma sintering. Metall. Mater. Trans. A 2021, 52, 1947–1962. [Google Scholar] [CrossRef]
- Ji, W.; Fu, Z.; Wang, W.; Wang, H.; Zhang, J.; Wang, Y.; Zhang, F. Mechanical alloying synthesis and spark plasma sintering consolidation of CoCrFeNiAl high-entropy alloy. J. Alloys Compd. 2014, 589, 61–66. [Google Scholar] [CrossRef]
- Liang, H.J.H.; Cao, Z.; Jiang, L. Interesting ‘island-like’ microstructure and tribological evaluation of Al1.5CrFeNiWTi0.5 high entropy alloy coating manufactured by laser cladding. Tribol. Int. 2023, 179, 108171. [Google Scholar] [CrossRef]
- Joseph, J.; Haghdadi, N.; Shamlaye, K.; Hodgson, P.; Barnett, M.; Fabijanic, D. The sliding wear behaviour of CoCrFeMnNi and AlxCoCrFeNi high entropy alloys at elevated temperatures. Wear 2019, 428–429, 32–44. [Google Scholar] [CrossRef]
- Meng, A.; Liang, F.; Mao, Q.; Fan, Y.; Lin, Y.; Chen, X.; Zhao, Y. Tribo-induced microstructural changes and associated wear mechanisms of CoFeNi2 medium entropy alloy at elevated temperatures. Tribol. Int. 2023, 189, 108892. [Google Scholar] [CrossRef]
- Poulia, A.; Georgatis, E.; Lekatou, A.; Karantzalis, A. Dry-sliding wear response of MoTaWNbV high entropy alloy. Adv. Eng. Mater. 2023, 19, 1600535. [Google Scholar] [CrossRef]
- Guan, H.; Chai, L.; Wang, Y.; Xiang, K.; Wu, L.; Pan, H.; Yang, M.; Teng, C.; Zhang, W. Microstructure and hardness of NbTiZr and NbTaTiZr refractory medium-entropy alloy coatings on Zr alloy by laser cladding. Appl. Surf. Sci. 2021, 549, 149338. [Google Scholar] [CrossRef]
- Pradeep, K.G.; Wanderka, N.; Choi, P.; Banhart, J.; Murty, B.; Raabe, D. Atomic-scale compositional characterization of a nanocrystalline AlCrCuFeNiZn high-entropy alloy using atom probe tomography. Acta Mater. 2013, 61, 4696. [Google Scholar] [CrossRef]
- Wang, W.R.; Wang, W.L.; Wang, S.C.; Tsai, Y.C.; Lai, C.H.; Yeh, J.W. Effects of Al addition on the microstructure and mechanical property of AlxCoCrFeNi high-entropy alloys. Intermetallics 2012, 26, 44–51. [Google Scholar] [CrossRef]
- Edalati, P.; Floriano, R.; Tang, Y.; Mohammadi, A.; Pereira, K.D.; Luchessi, A.D.; Edalati, K. Ultrahigh hardness and biocompatibility of high-entropy alloy TiAlFeCoNi processed by high-pressure torsion. Mater. Sci. Eng. C 2020, 112, 110908. [Google Scholar] [CrossRef]
- Li, C.; Xue, Y.; Hua, M.; Cao, T.; Ma, L.; Wang, L. Microstructure and mechanical properties of AlxSi0.2CrFeCoNiCu1-x high-entropy alloys. Mater. Des. 2016, 90, 601–609. [Google Scholar] [CrossRef]
- Feng, C.; Wang, X.; Yang, L. Synergetic enhancements on the mechanical and tribological performance of Al10Cr17Fe20NiV4 medium entropy alloys induced by nano-Al2O3 particles. Adv. Eng. Mater. 2022, 25, 2201611. [Google Scholar] [CrossRef]
- Tabor, D. The hardness and strength of metals. J. Inst. Met. 1951, 79, 1–18. [Google Scholar]
- Carnot, A.; Frateur, I.; Zanna, S.; Tribollet, B.; Dubois-Brugger, I.; Marcus, P. Corrosion mechanisms of steel concrete moulds in contact with a demoulding agent studied by EIS and XPS. Corros. Sci. 2003, 45, 2513–2524. [Google Scholar] [CrossRef]
- Han, W.Z.; Zhang, Z.F.; Wu, S.D.; Li, S. Combined effects of crystallographic orientation, stacking fault energy and grain size on deformation twinning in fcc crystals. Philos. Mag. 2008, 88, 3011–3029. [Google Scholar] [CrossRef]
- Ganji, R.S.; Karthik, P.S.; Rao, K.B.S.; Rajulapati, K.V. Strengthening mechanisms in equiatomic ultrafine grained AlCoCrCuFeNi high-entropy alloy studied by micro- and nanoindentation methods. Acta Mater. 2017, 125, 58–68. [Google Scholar] [CrossRef]
- Tao, N.R.; Lu, K. Nanoscale structural refinement via deformation twinning in face-centered cubic metals. Scr. Mater. 2009, 60, 1039–1043. [Google Scholar] [CrossRef]
- Zhang, P.; Chen, J.; Cheng, Q. Microstructure and sliding wear behavior of (AlCoCrFeNi)1-x(WC)x. Ceram. Int. 2022, 48, 19399–19411. [Google Scholar] [CrossRef]
- Gan, Y.; Duan, S.; Mo, Y.; Dong, Y.; Yi, J.; Hu, Y. Effects of Al addition on the microstructure and mechanical properties of AlxCoCrFeNi2.1 high-entropy alloys. Intermetallics 2024, 166, 108172. [Google Scholar] [CrossRef]
- Wan, Q.; Hua, K.; Zhou, Z.; Zhang, F.; Wu, H.; Zhou, Q.; Wang, H. Revealing the B addition on tribology performance in TiZrHfTa0.5 refractory high-entropy alloy at ambient and elevated temperature. J. Alloys Compd. 2023, 931, 167521. [Google Scholar] [CrossRef]
- Chen, D.; Guan, Y.; Jin, G.; Cui, X.; Liu, E.; Feng, L.; Li, X. In-situ synthesis of a FeCoCrNiCu/FeCoCrNiAl composite high entropy alloy coating by laser cladding. Surf. Coat. Technol. 2023, 461, 129447. [Google Scholar] [CrossRef]
- Sun, Y.; Wang, Z.; Wang, W.; Zhao, X.; Zhu, K.; Li, H.; Zhao, Y.; Yin, Z. Wear and corrosion resistance of Al1.2CoCrFeNiScx high entropy alloys with scandium addition. J. Mater. Res. Technol. 2023, 27, 8023–8036. [Google Scholar]
- Ge, F.; Yuan, H.; Gao, Q.; Peng, T.; Guo, S.; Lyu, P.; Guan, Q.; Liu, H.; Liu, X.; Guan, J. Microstructure, hardness and wear resistance of AlCoCrFeNiTax (x = 0, 0.1, 0.3) high-entropy alloys enhanced by laser remelting and Ta addition. J. Alloys Compd. 2023, 949, 169741. [Google Scholar] [CrossRef]


| Sample | Hardness/HV | Er/GPa | Hardness/GPa |
|---|---|---|---|
| MEA | 727 ± 3 | 206 ± 5 | 7.2 ± 0.4 |
| MEA-1A | 823 ± 8 | 210 ± 3 | 8.6 ± 0.3 |
| MEA-2A | 779 ± 5 | 228 ± 4 | 8.3 ± 0.9 |
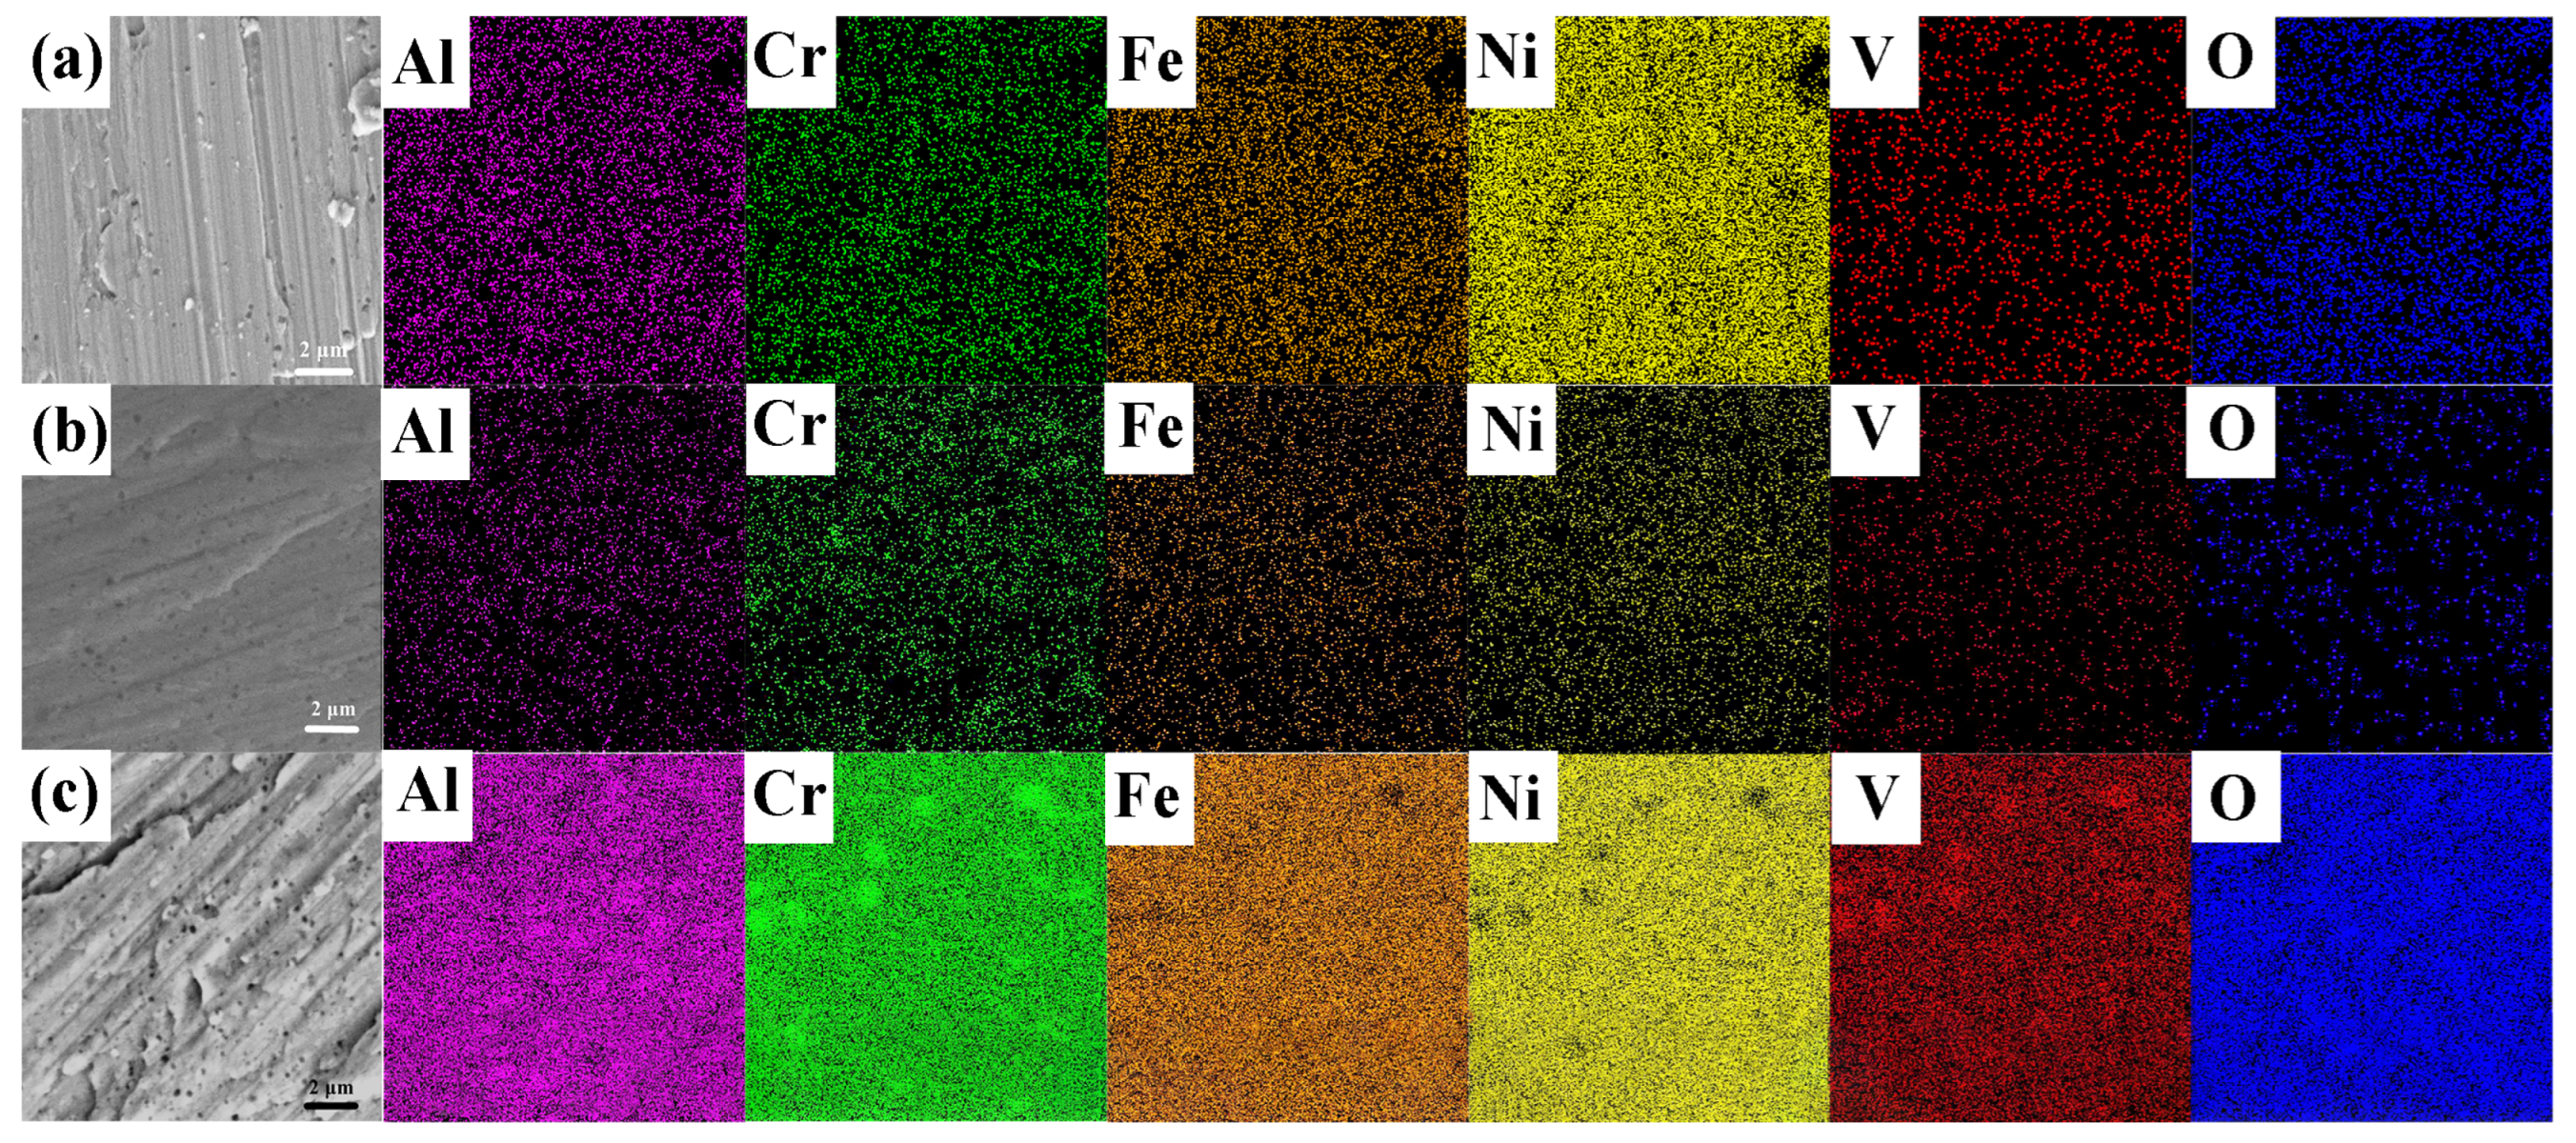
| Sample | Al | Cr | Fe | Ni | V | O |
|---|---|---|---|---|---|---|
| MEA | 7.7 | 18.4 | 17.5 | 47.8 | 3.2 | 5.1 |
| MEA-1A | 7.5 | 18.5 | 19.1 | 48.9 | 3.9 | 2.1 |
| MEA-2A | 8.6 | 13.6 | 18.3 | 49.7 | 3.6 | 6.2 |
Disclaimer/Publisher’s Note: The statements, opinions and data contained in all publications are solely those of the individual author(s) and contributor(s) and not of MDPI and/or the editor(s). MDPI and/or the editor(s) disclaim responsibility for any injury to people or property resulting from any ideas, methods, instructions or products referred to in the content. |
© 2025 by the authors. Licensee MDPI, Basel, Switzerland. This article is an open access article distributed under the terms and conditions of the Creative Commons Attribution (CC BY) license (https://creativecommons.org/licenses/by/4.0/).
Share and Cite
Feng, C.; Wang, H.; Wang, Y. Breaking the Hardness-Wear Trade-Off: Quantitative Correlation in Nano-Al2O3-Reinforced Al10Cr17Fe20NiV4 High-Entropy Alloys. Nanomaterials 2025, 15, 775. https://doi.org/10.3390/nano15100775
Feng C, Wang H, Wang Y. Breaking the Hardness-Wear Trade-Off: Quantitative Correlation in Nano-Al2O3-Reinforced Al10Cr17Fe20NiV4 High-Entropy Alloys. Nanomaterials. 2025; 15(10):775. https://doi.org/10.3390/nano15100775
Chicago/Turabian StyleFeng, Cong, Huan Wang, and Yaping Wang. 2025. "Breaking the Hardness-Wear Trade-Off: Quantitative Correlation in Nano-Al2O3-Reinforced Al10Cr17Fe20NiV4 High-Entropy Alloys" Nanomaterials 15, no. 10: 775. https://doi.org/10.3390/nano15100775
APA StyleFeng, C., Wang, H., & Wang, Y. (2025). Breaking the Hardness-Wear Trade-Off: Quantitative Correlation in Nano-Al2O3-Reinforced Al10Cr17Fe20NiV4 High-Entropy Alloys. Nanomaterials, 15(10), 775. https://doi.org/10.3390/nano15100775