Article

Sustainable Valorization of Rice Straw into Biochar and Carbon Dots Using a Novel One-Pot Approach for Dual Applications in Detection and Removal of Lead Ions

by
Jagpreet Singh
1,2,
Monika Bhattu
2,3,
Meenakshi Verma
4,
Mikhael Bechelany
5,6,
Satinder Kaur Brar
7,* and
Rajendrasinh Jadeja
1,*
1
Faculty of Engineering & Technology, Marwadi University, Rajkot-Morbi Road, Rajkot 360003, Gujarat, India
2
Department of Chemistry, Research and Incubation Centre, Rayat Bahra University, Mohali 140103, Punjab, India
3
Centre of Research Impact and Outcome, Chitkara University, Rajpura 140417, Punjab, India
4
Department of Applied Science, Chandigarh Engineering College, Chandigarh Group of Colleges Jhanjeri, Mohali 140307, Punjab, India
5
Institut Européen des Membranes (IEM), UMR-5635, University of Montpellier, ENSCM, CNRS, Place Eugène Bataillon, CEDEX 5, 34095 Montpellier, France
6
Functional Materials Group, Gulf University for Science and Technology (GUST), Mubarak Al-Abdullah 32093, Kuwait
7
Department of Civil Engineering, Lassonde School of Engineering, York University, Toronto, ON M3J 1P3, Canada
*
Authors to whom correspondence should be addressed.
Nanomaterials 2025, 15(1), 66; https://doi.org/10.3390/nano15010066
Submission received: 27 November 2024 / Revised: 23 December 2024 / Accepted: 28 December 2024 / Published: 3 January 2025

Abstract

:
Lead (Pb) is a highly toxic heavy metal that causes significant health hazards and environmental damage. Thus, the detection and removal of Pb2+ ions in freshwater sources are imperative for safeguarding public health and the environment. Moreover, the transformation of single resources into multiple high-value products is vital for achieving sustainable development goals (SDGs). In this regard, the present work focused on the preparation of two efficient materials, i.e., biochar (R-BC) and carbon dots (R-CDs) from a single resource (rice straw), via a novel approach by using extraction and hydrothermal process. The various microscopic and spectroscopy techniques confirmed the formation of porous structure and spherical morphology of R-BC and R-CDs, respectively. FTIR analysis confirmed the presence of hydroxyl (–OH), carboxyl (–COO) and amine (N–H) groups on the R-CDs’ surface. The obtained blue luminescent R-CDs were employed as chemosensors for the detection of Pb2+ ions. The sensor exhibited a strong linear correlation over a concentration range of 1 µM to 100 µM, with a limit of detection (LOD) of 0.11 µM. Furthermore, the BET analysis of R-BC indicated a surface area of 1.71 m2/g and a monolayer volume of 0.0081 cm3/g, supporting its adsorption potential for Pb2+. The R-BC showed excellent removal efficiency of 77.61%. The adsorption process followed the Langmuir isotherm model and second-order kinetics. Therefore, the dual use of rice straw-derived provides a cost-effective, environmentally friendly solution for Pb2+ detection and remediation to accomplish the SDGs.

Graphical Abstract

1. Introduction

The rapid increase in industrialization and population has led to continuous environmental depletion due to heavy metal contamination, which poses significant environmental challenges. The growth in anthropogenic activities, such as metal-based surface plating, mining, and the large-scale production of paper, steel, fertilizers, pesticides, and metal-based batteries, has significantly contributed to the increase of toxic inorganic contaminants in water bodies. This issue is particularly pronounced in developing regions, where industrial practices are often less regulated [1]. Nowadays, there has been a growing need to adopt highly efficient and sustainable techniques for the detection of heavy metals [2]. Heavy metals such as copper, lead, mercury, and chromium are extremely poisonous and pose serious threats to both humans as well as to the environment, even when present in trace amounts [3,4,5,6]. Moreover, consuming food and water contaminated by industrial metal effluent causes major health problems such as kidney, liver, central nervous system, bone, cancer, and tooth damage and may even lead to death [7,8]. Among the various heavy metal ions, lead (Pb2+) is considered the most toxic due to the associated health risks, including developmental delays in children, kidney dysfunction, hemolytic anemia, increased blood pressure, and neurodegenerative diseases such as Alzheimer’s and Parkinson’s. Chronic exposure to lead is also linked to hypertension, reproductive toxicity, and cognitive impairments [9]. Thus, reliable sensing and elimination methods are essential for accurately analyzing and sequestrating heavy metal levels in different sources to effectively control environmental pollution [10,11].
The growing concern regarding the toxicity of Pb2+ underscores the urgent need for reliable methods to sense and remediate these contaminants to ensure safe drinking and irrigation water. To date, there are various analytical techniques, including mass spectrometry, resonance light scattering method [12], X-ray fluorescence analysis [13,14,15,16,17], inductively coupled atomic emission spectrometry, UV–Vis spectrophotometric [18], and fluorescence spectroscopy, ref. [19] have been extensively utilized for the detection of Pb2+ in aqueous matrices. Additionally, conventional remediation methods like membrane separation, catalysis, chemical precipitation, adsorption, oxidation/reduction, and biological treatment are also employed for the removal of Pb2+ from wastewater [20]. Undoubtedly, these techniques possess high sensitivity and reliability. However, the performance might be hindered by various limitations like costliness, complexity, and lengthy procedures, limiting their widespread application. Therefore, there is a need for much simpler, more sensitive, faster, and cost-effective detection methods for remediating Pb2+ [21,22,23].
Along with water contamination, waste management is also considered the most pressing environmental challenge faced by modern society. In agriculture-dominant countries like India, this issue is particularly pronounced due to the substantial generation of crop residues and the lack of efficient management practices. The most common and expedient method for disposing of these biomass residues, particularly rice and wheat straw, is open burning, which is widely adopted due to its low cost and ease of implementation. However, this practice not only contributes to air pollution but also contributes to environmental degradation and poses significant risks to the public.
Therefore, addressing these challenges necessitates innovative approaches that align with the principles of circular economy and sustainability. For this purpose, the most effective strategy is the utilization of waste materials to create multiple valuable products, thereby minimizing waste and reducing the environmental footprint.
The conversion of agricultural waste residues into nanomaterials (NMs) and carbon-based materials with remarkable physicochemical properties has positioned them as promising candidates for various environmental applications [23,24]. Since their discovery in 2004, carbon dots (CDs) have emerged as a notable addition to the family of carbon nanomaterials. CDs have several advantages over conventional fluorescent dyes and semiconductor quantum dots, including cost-effectiveness, excellent water solubility, non-toxicity, and multicolor fluorescence. These attributes have garnered significant interest in CDs for diverse applications such as light-emitting diodes, polymerization, ionic detection, sensing, cell labeling, and photocatalysis [25]. Various synthesis techniques and precursors have been explored for CD synthesis, with an emphasis on cost-effective, environmentally friendly biomass sources [26]. Numerous biomass precursors have been studied for their potential in CD synthesis, including turtle shells [27], crop residues [28], straws, agricultural waste [29], gram shells [30], and mushrooms [31]. In addition to CDs, the preparation of biochar from agricultural waste is widely regarded as an eco-friendly approach for waste management and water remediation.
Considering the remarkable potential of CDs and BC, we have developed two efficient materials—biochar (R-BC) and carbon dots (R-CDs)—from a single agricultural waste resource (rice straw) using a novel green synthesis approach. This is the first time such a method has been applied to rice straw, demonstrating its potential for waste valorization and environment remediation. The R-CDs were found to be highly effective as lead (Pb) sensors, showing excellent sensitivity and selectivity in detecting lead ions in contaminated water. Furthermore, the R-BC produced from the same rice straw was successfully utilized for the removal of lead from aqueous solutions, offering an environmentally friendly and cost-effective solution for water purification. By producing multiple functional materials from a single waste resource, this approach not only reduces waste but also contributes to sustainable water management. The dual application of R-CDs as sensors and R-BC as adsorbents highlights the potential of rice straw as a valuable resource in environmental remediation efforts. Along with the dual applicability, cost-effectiveness is one of the most prominent factors, as rice straw is a cheap and plentiful agricultural residue that is being utilized as the single raw material for the synthesis of both R-BC and R-CDs. Moreover, in terms of reliability and efficiency, the study exhibits excellent consistency and stability in the detection of Pb2+ ions, with R-CDs showing a low detection limit of 0.11 µM and a broad linear range, which surpasses the sensitivity of many existing sensors for Pb2+ detection. Overall, this study underscores the importance of innovative green technologies in tackling the pressing challenges of heavy metal pollution and waste management.

2. Materials and Methods

2.1. Chemicals Reagents

The study employed analytical reagent (AR) grade materials, including metal salts viz lead nitrate, barium nitrate, ferric nitrate, ferrous nitrate, manganese nitrate, magnesium nitrate, sodium nitrate, chromium nitrate, copper nitrate, cobalt nitrate (90–98% purity, obtained from Sigma Aldrich, St. Louis, MO, USA). These materials were utilized without undergoing further purification procedures. Water samples were taken from the Majha region of Punjab in India. Deionized (DI) water was used as the solvent for solution preparation.

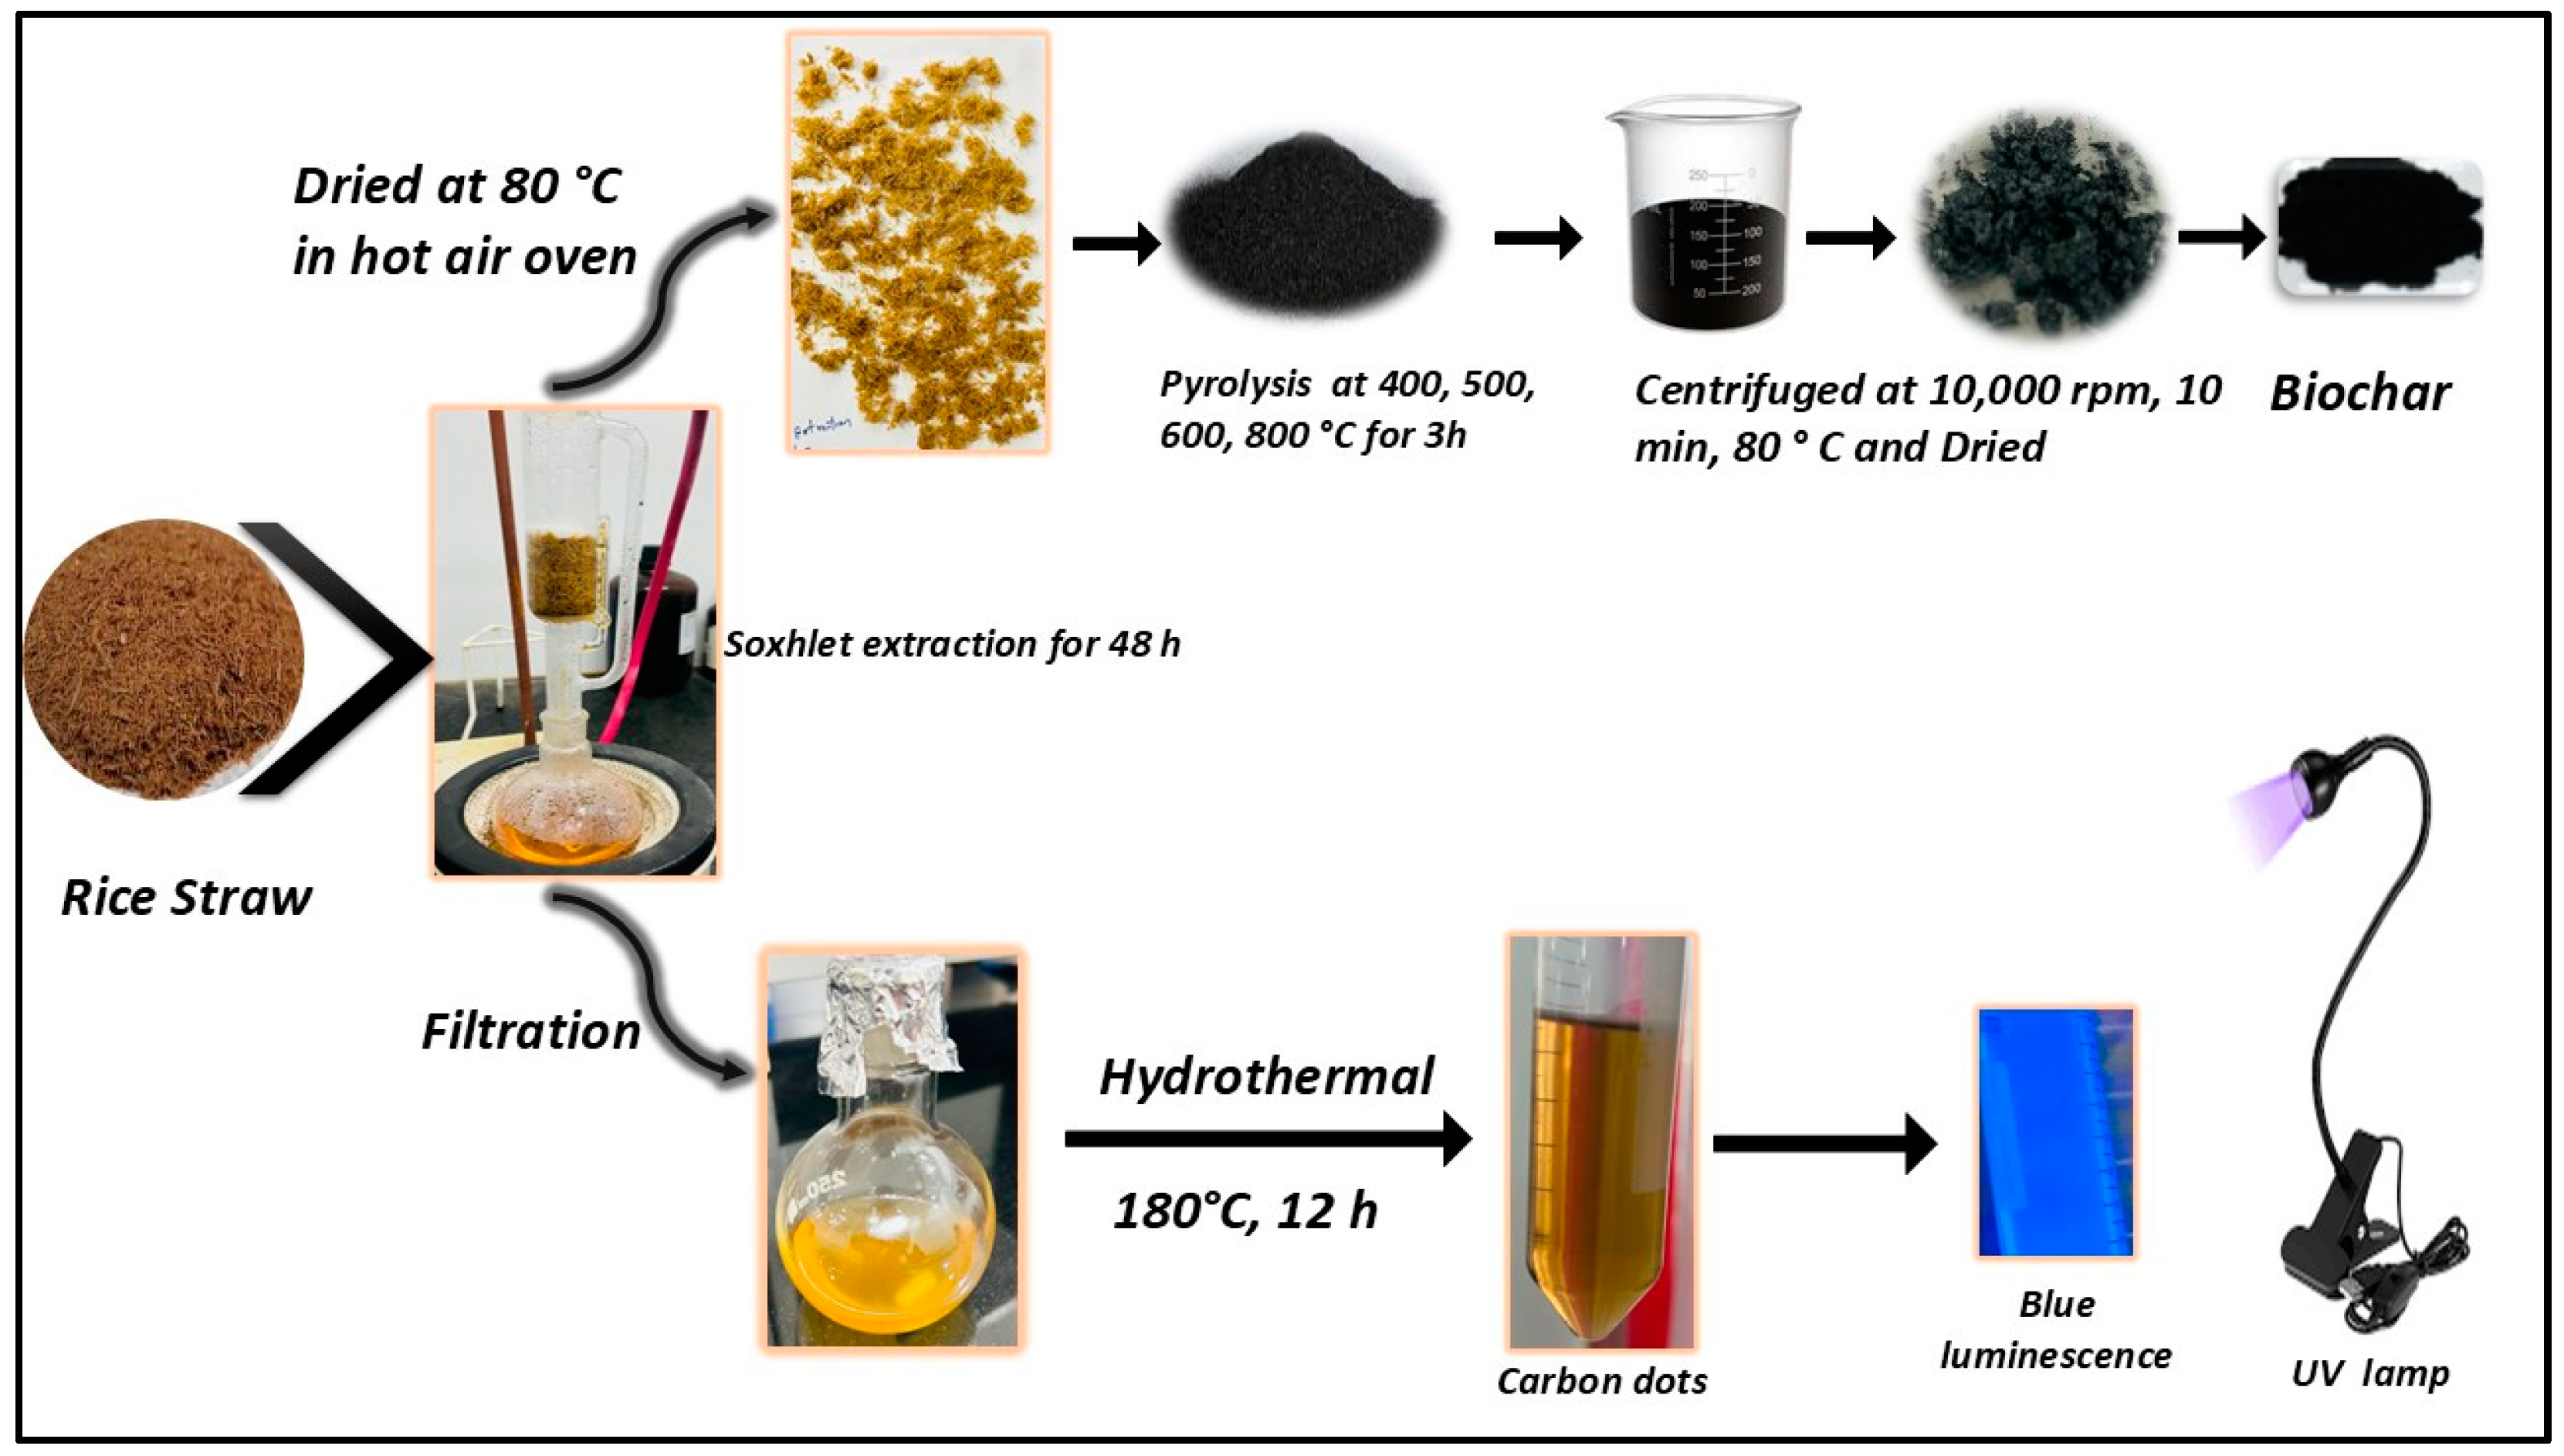
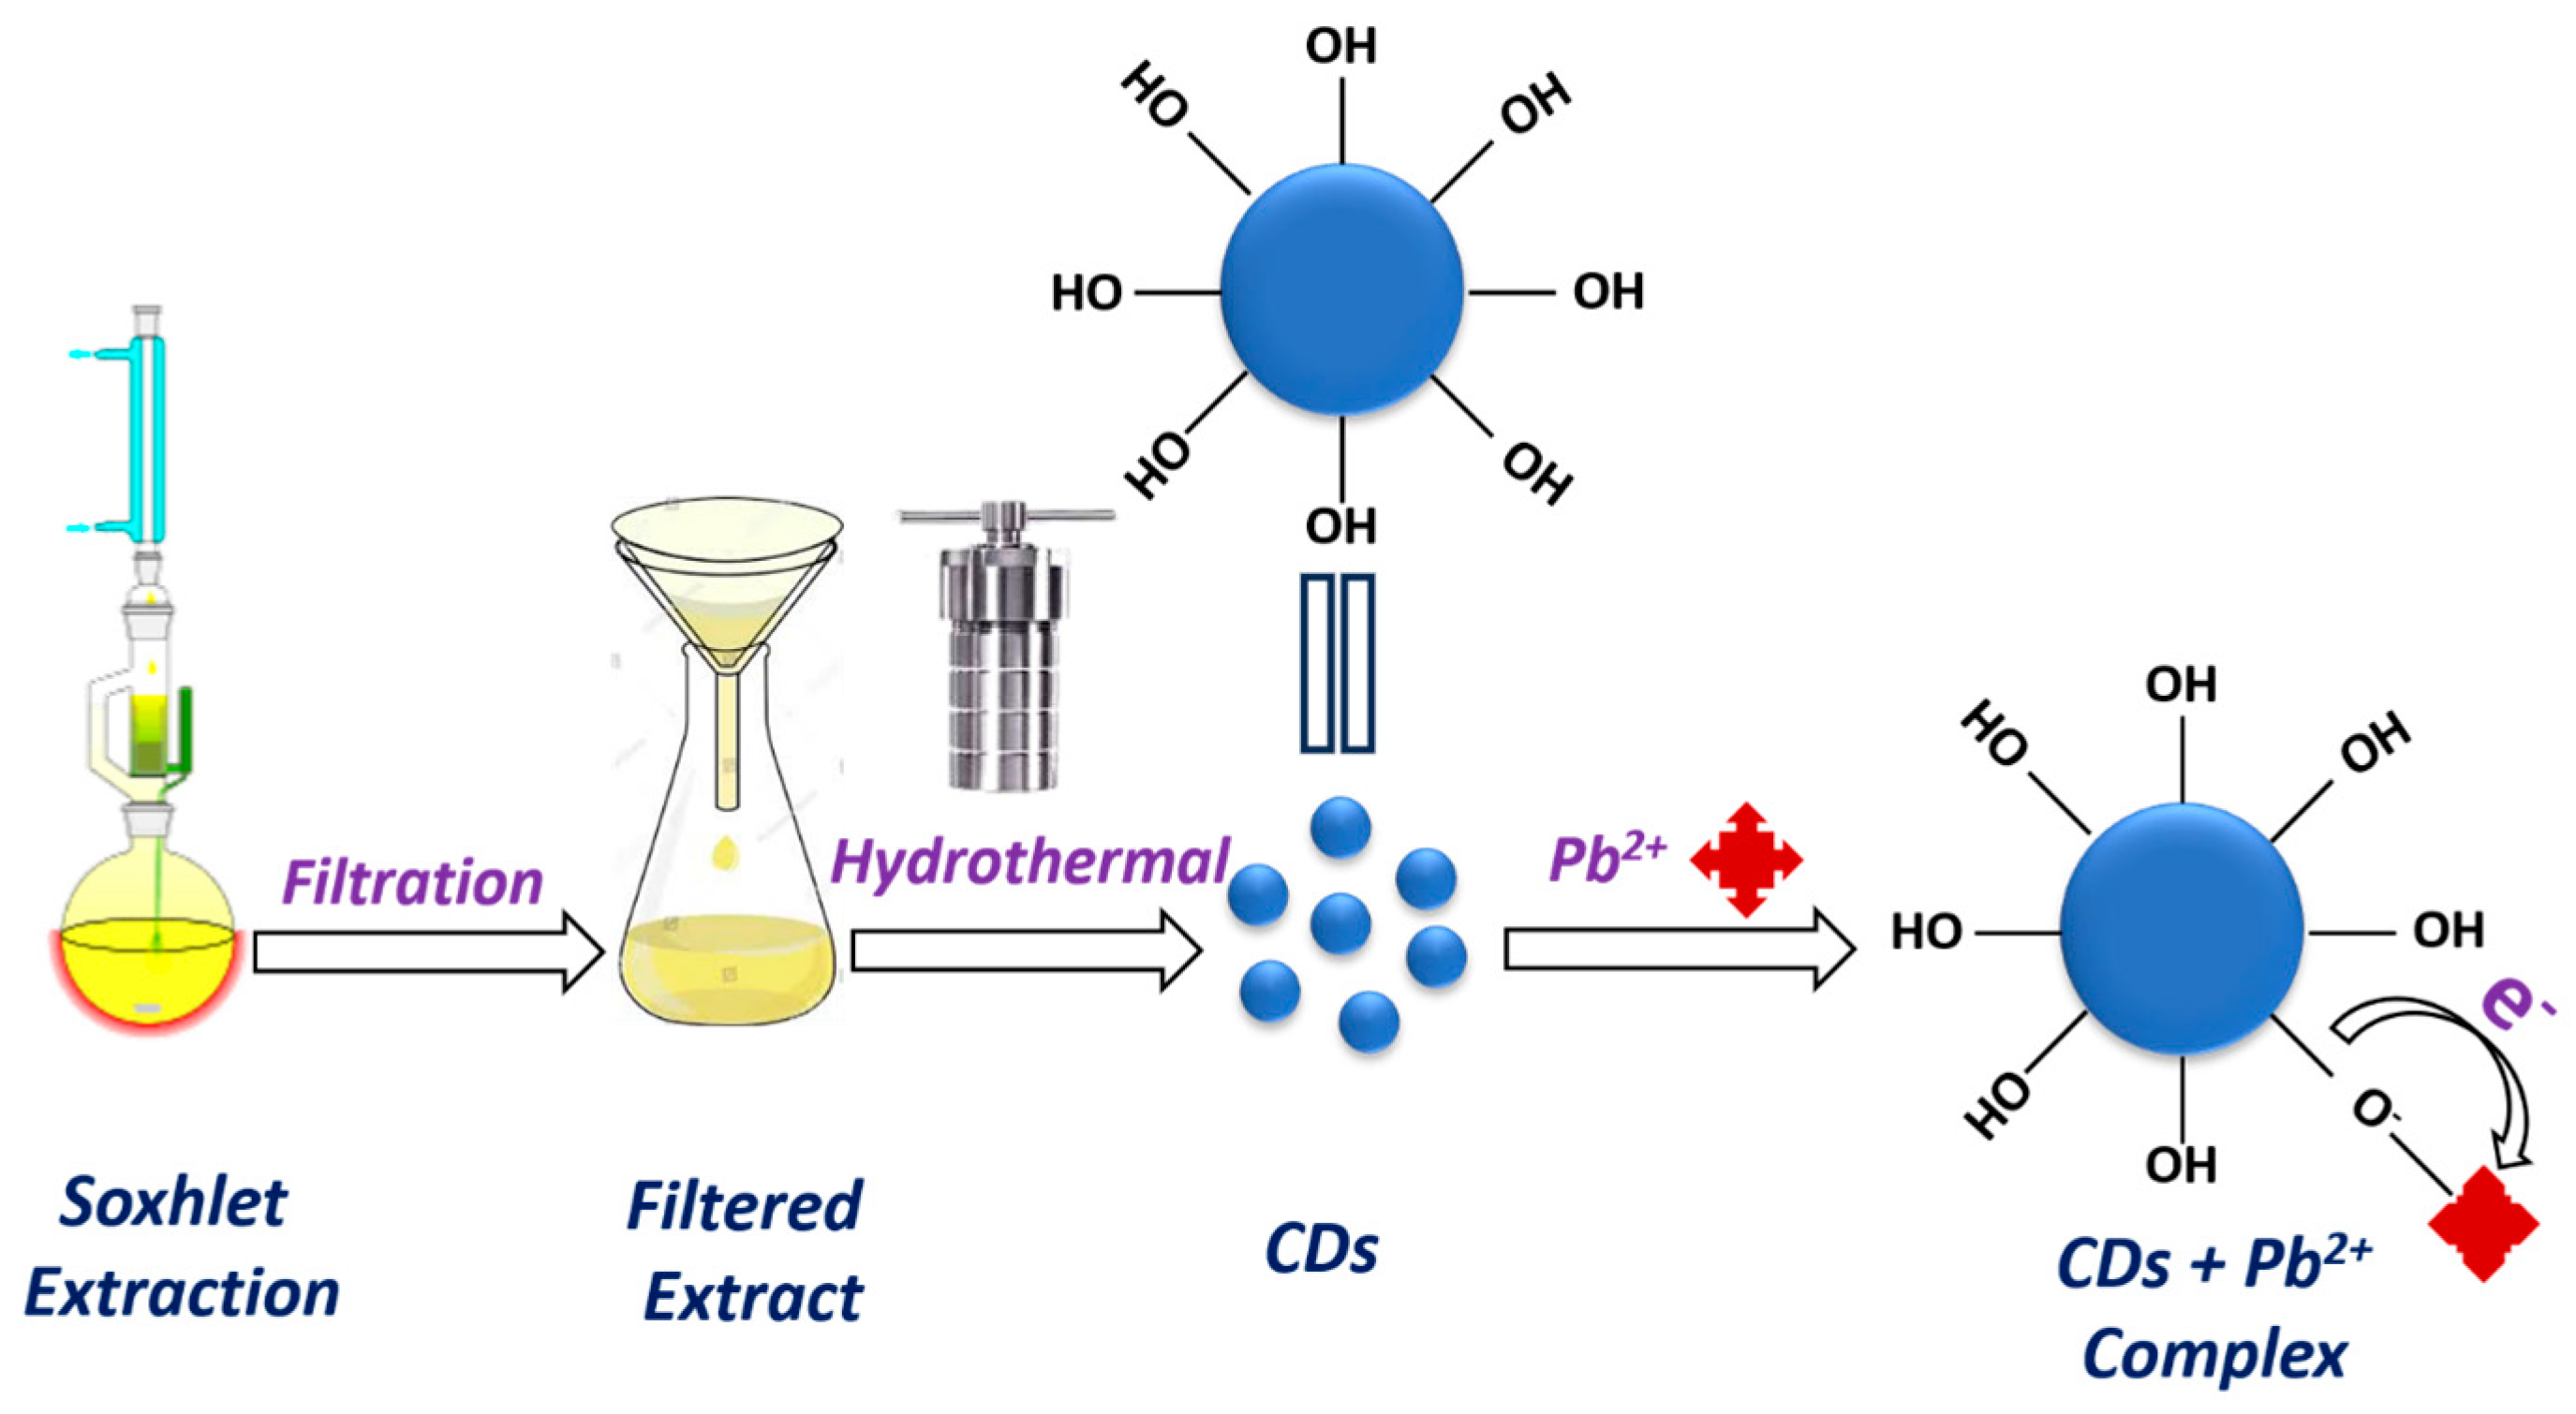
2.2. Synthesis of R-CDs

For the preparation of R-CDs, initially, the rice straw was thoroughly rinsed with tap water and then washed with distilled water. Afterward, the washed straw was dried in a hot air oven at 100 °C for 12 h and then ground into fine powder. A 5 g sample of powdered rice straw was subjected to Soxhlet extraction using water as the solvent for a duration of 48 h. The extended Soxhlet extraction process ensures the thorough recovery of phytochemicals from the precursor biomass. These phytochemicals, including phenolic compounds, organic acids, and flavonoids, are instrumental in forming functional groups such as hydroxyl (–OH), carboxyl (–COOH), and carbonyl (–C=O) on the biochar surface during pyrolysis. The presence of these functional groups enhances the material’s surface reactivity, facilitating interactions with target contaminants through mechanisms such as electrostatic attraction, hydrogen bonding, and metal-ligand coordination. The resulting extract was filtered, and 30 mL of the extract was transferred into a Teflon-lined autoclave. Initially, the extract was placed in the muffle furnace at varying temperature conditions, including 180 °C for 6 h, 12 h, and 18 h. Upon completion of the reaction, the mixture was allowed to cool to room temperature. The resulting solution was then centrifuged at 10,000 rpm for 15 min, followed by three subsequent washing with deionized water (Figure 1). The supernatant containing the R-CDs was subsequently analyzed and confirmed using UV-visible and fluorescence spectroscopy. Among all the optimization conditions for the R-CDs preparation, the best results were obtained at 180 °C for 12 h.

2.3. Preparation of R-BC

The residue obtained in the extraction process was further utilized for the R-BC preparation. The collected residue was dried at 80 °C for 24 h and then transferred to a crucible for further hydrothermal treatment. The R-BC is prepared at varying temperature conditions such as 400 °C, 500 °C, 600 °C, and 800 °C. The prepared biochar was further mixed in 50 mL of deionized water and subjected to sonication for half an hour. The suspension was then centrifuged at 10,000 rpm, with three sequential rinsing, each lasting 10 min. The remaining residue was again dried in a hot air oven for 2 h (Figure 1). The maximum yield of R-BC is obtained at 600 °C for 3 h, which is calculated using the below equation.
B i o c h a r   y i e l d % = ( M a s s   o f   B i o c h a r   ( g ) M a s s   o f   r a w m a t e r i a l   ( g ) )     100
The yield of the obtained R-BC was calculated to be 44.29%.

2.4. Characterization Techniques

The prepared R-CDs and R-BC were characterized using high-resolution transmission electron microscopy (HRTEM, JEOL-2100 Plus HRTEM, Tokyo, Japan) images and energy-dispersive X-ray spectroscopy (EDS). Furthermore, the images were analyzed using ImageJ (IJ 1.53k) to find out the average size of R-CDs. Fourier transform infrared (FTIR) spectra were analyzed using a PerkinElmer FTIR spectrophotometer, Shelton, CT, USA to monitor the presence of functional groups on R-CDs. Scanning electron microscopy (SEM), X-ray Diffraction (XRD), and Brauner Emmett Teller (BET) studies were conducted to analyze the surface morphology, surface area, and porosity of prepared biochar.

2.5. Photophysical Studies

The prepared R-CDs were screened against different heavy metals using photoluminescence spectroscopy. However, there is no significant change has been observed in the photoluminescence intensity of R-CDs with heavy metals except Pb2+. This signifies that the prepared R-CDs showed selectivity towards Pb2+. Therefore, further studies, such as titration and interference studies, were conducted to evaluate the sensitivity and selectivity of prepared R-CDs toward Pb2+.

2.6. Lead Ion (Pb2+) Adsorption Study

Pb2+ removal was conducted by preparing a stock solution with a known concentration of Pb2+ (100 ppm). This stock solution was diluted using DI water to make various concentrations varying from 5 to 20 ppm for experimental analysis. A calibration curve was generated by measuring concentrations between 5–20 ppm using spectroscopic analysis at λmax = 290 nm.
The adsorption capacity qt (mg/g) was measured as given below:
q t = ( C i   C t ) m × V
where, Ci is the initial concentration of Pb2+, Ct is the concentration at time t. m (g) is the weight of R-BC taken, and V (L) is the volume of Pb2+solution taken. Moreover, the percentage efficiency was measured by using the below equation (Equation (2)) [32]
%   d y e   r e m o v a l = C i   C t C i × 100

3. Results

This section has been divided into four sub-sections related to characterization, sensing, and adsorption studies of the prepared P-CDs and R-BC.

3.1. Characterization of R-BC

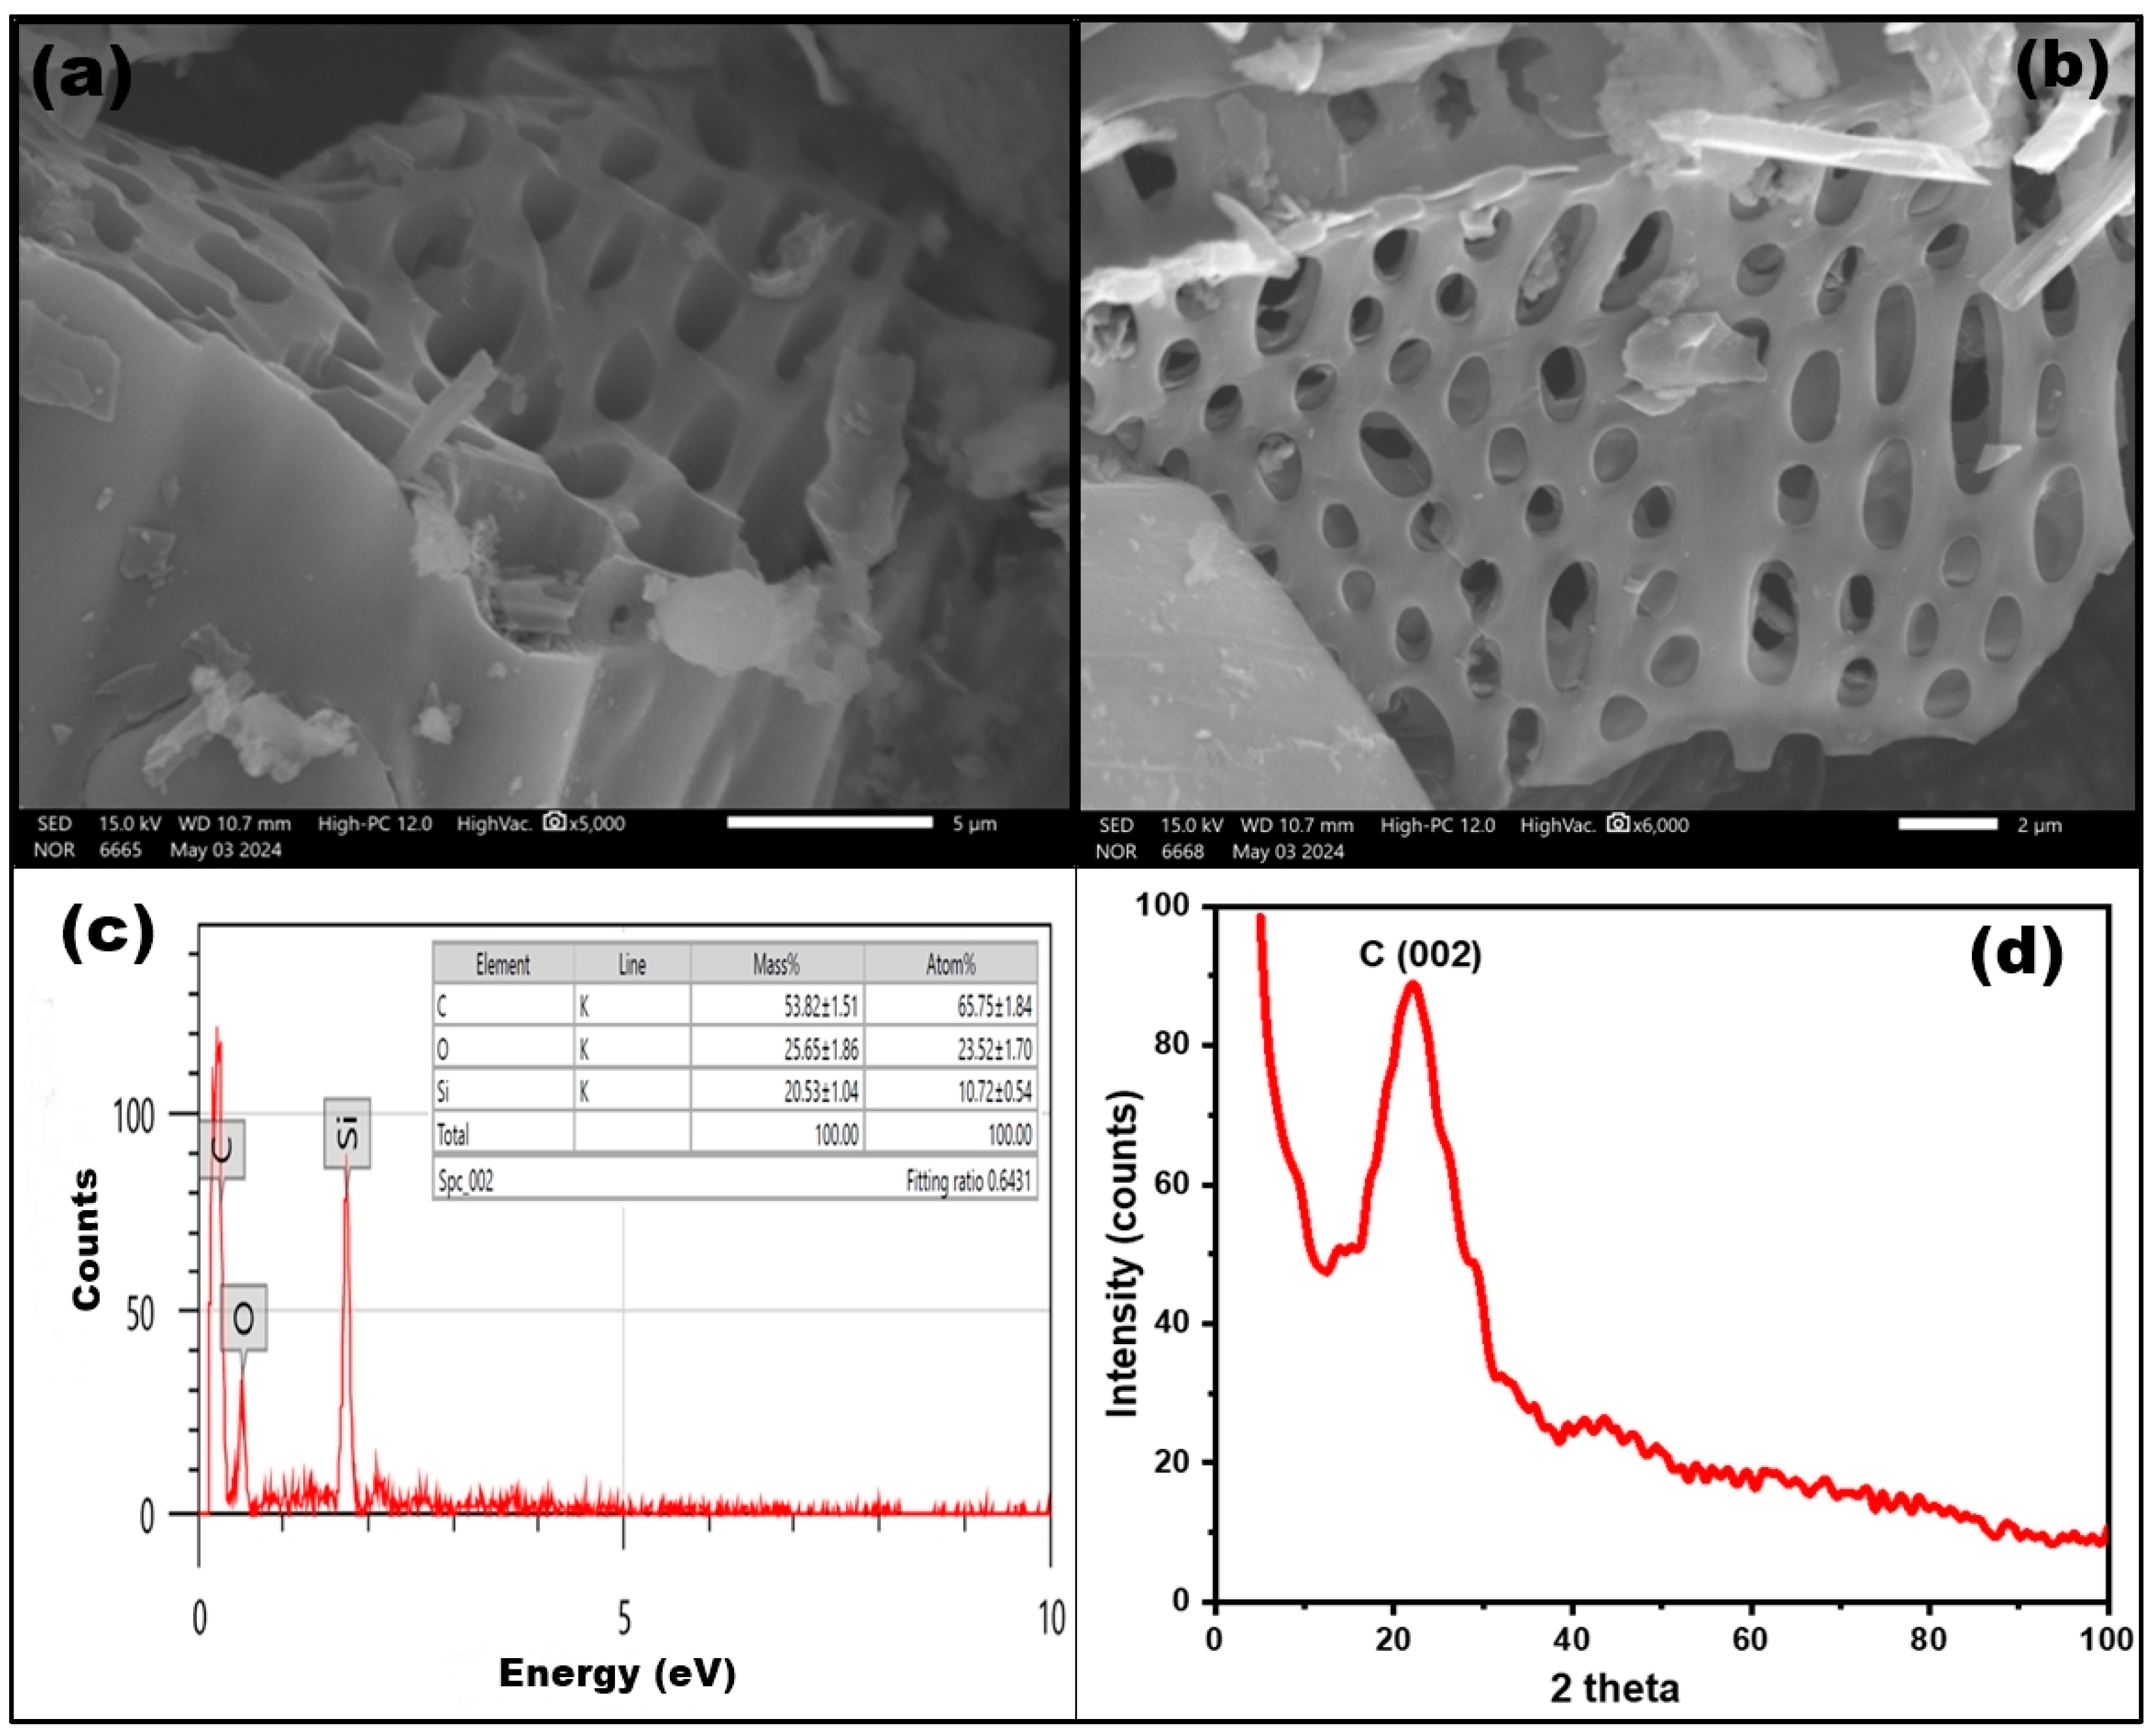
3.1.1. Scanning Electron Microscopy Analysis

The surface morphology of R-BC was analyzed using SEM (Figure 2a,b). The SEM images reveal isolated, thin cylindrical structures with a high density of pores. The surface of the R-BC was observed to be rough with repetitive, empty pore channels. The expansion of pore widths indicates structural evolution, where the BC matrix retains its rigidity, and the pore walls remain interconnected. These features suggest the presence of mesopores and macropores within the R-BC structure. The EDX spectra confirmed the presence of a larger extent of carbon in the prepared sample (Figure 2c).

3.1.2. XRD Analysis

The phase structure of R-BC was analyzed using XRD over a 2θ range of 10° to 80°. As shown in Figure 2d, the XRD pattern exhibits a broad peak around 2θ~22°, which corresponds to graphite carbon diffraction along the (002) planes. The extracted biochar showed a great variation from the XRD pattern of biochar derived from rice straw, as no additional peaks for silica were observed. This variation is attributed to the removal of volatile components during the extraction process, which leads to a reduction in the silica content and an increase in carbonaceous matter. The XRD data confirmed the highly amorphous nature of the synthesized biochar.

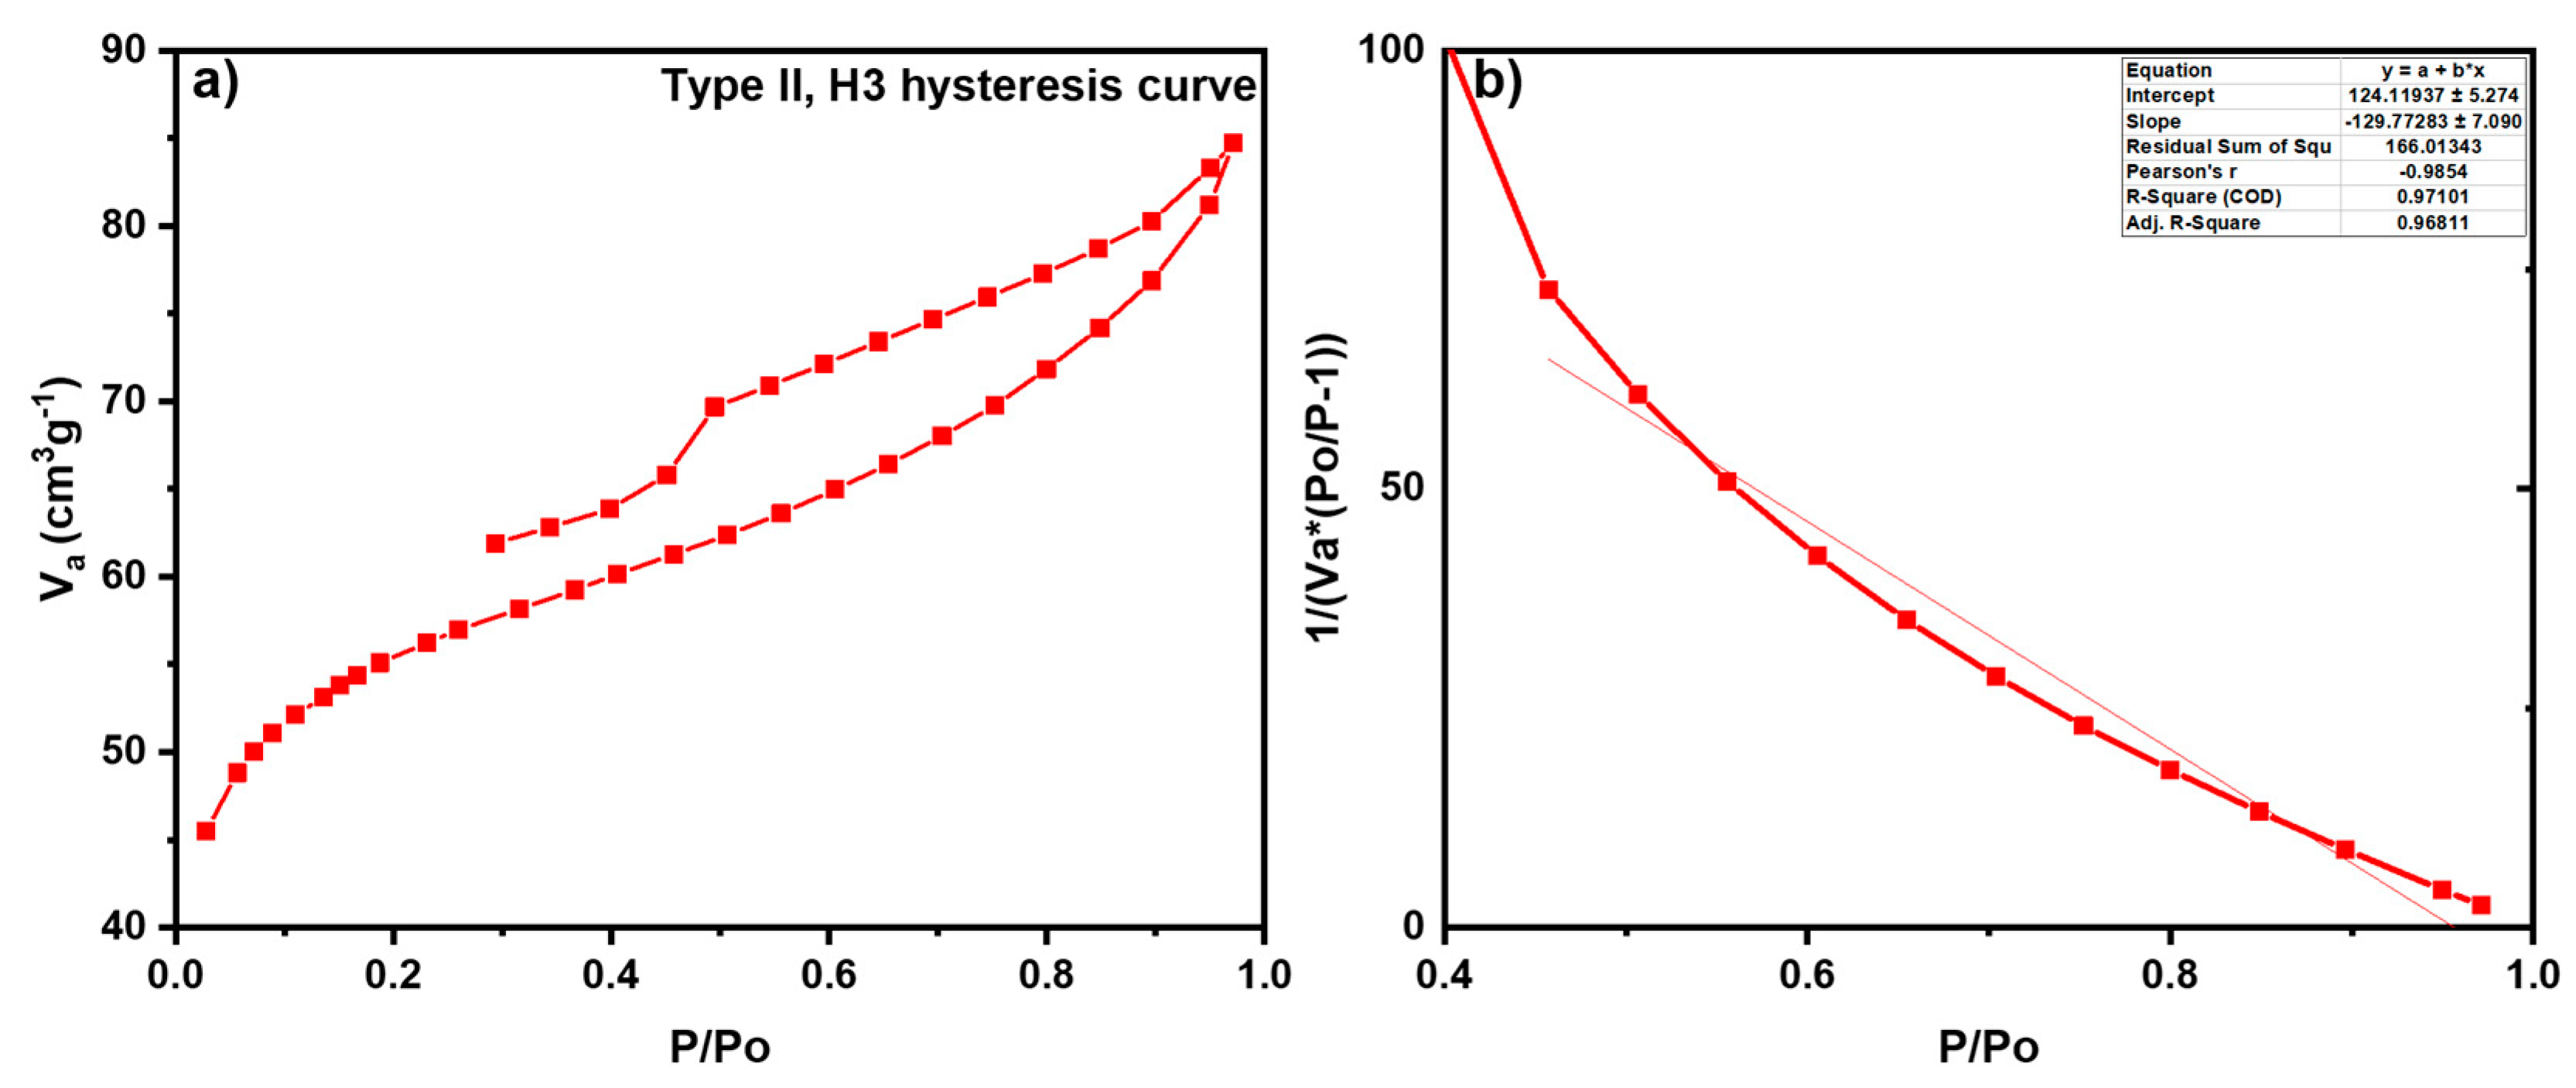
3.1.3. Brunauer–Emmett–Teller Analysis

The N2 adsorption and desorption analysis was performed to evaluate the porosity of the prepared biochar (Figure 3a). The N2 adsorption at STP follows Type II isotherm with H3 hysteresis loop, which suggests the simultaneous presence of meso and macropores in biochar, and the desorption closes abruptly due to the cavitation phenomenon. Furthermore, the BET analysis was performed using the equation,
1 V a ( P o P 1 ) = C 1 V m C P P o + 1 V m C
where, Va = Volume of gas adsorbed; Vo = saturation vapor pressure; Vm = monolayer volume; C = BET constant. The plot of P/Po against 1/Va (Po/P−1) gives a linear curve (Figure 4b), and the monolayer volume obtained was found to be 0.0081 cm3/g. Moreover, the surface area of biochar was observed to be 1.71 m2/g.

3.2. Characterization of R-CDs

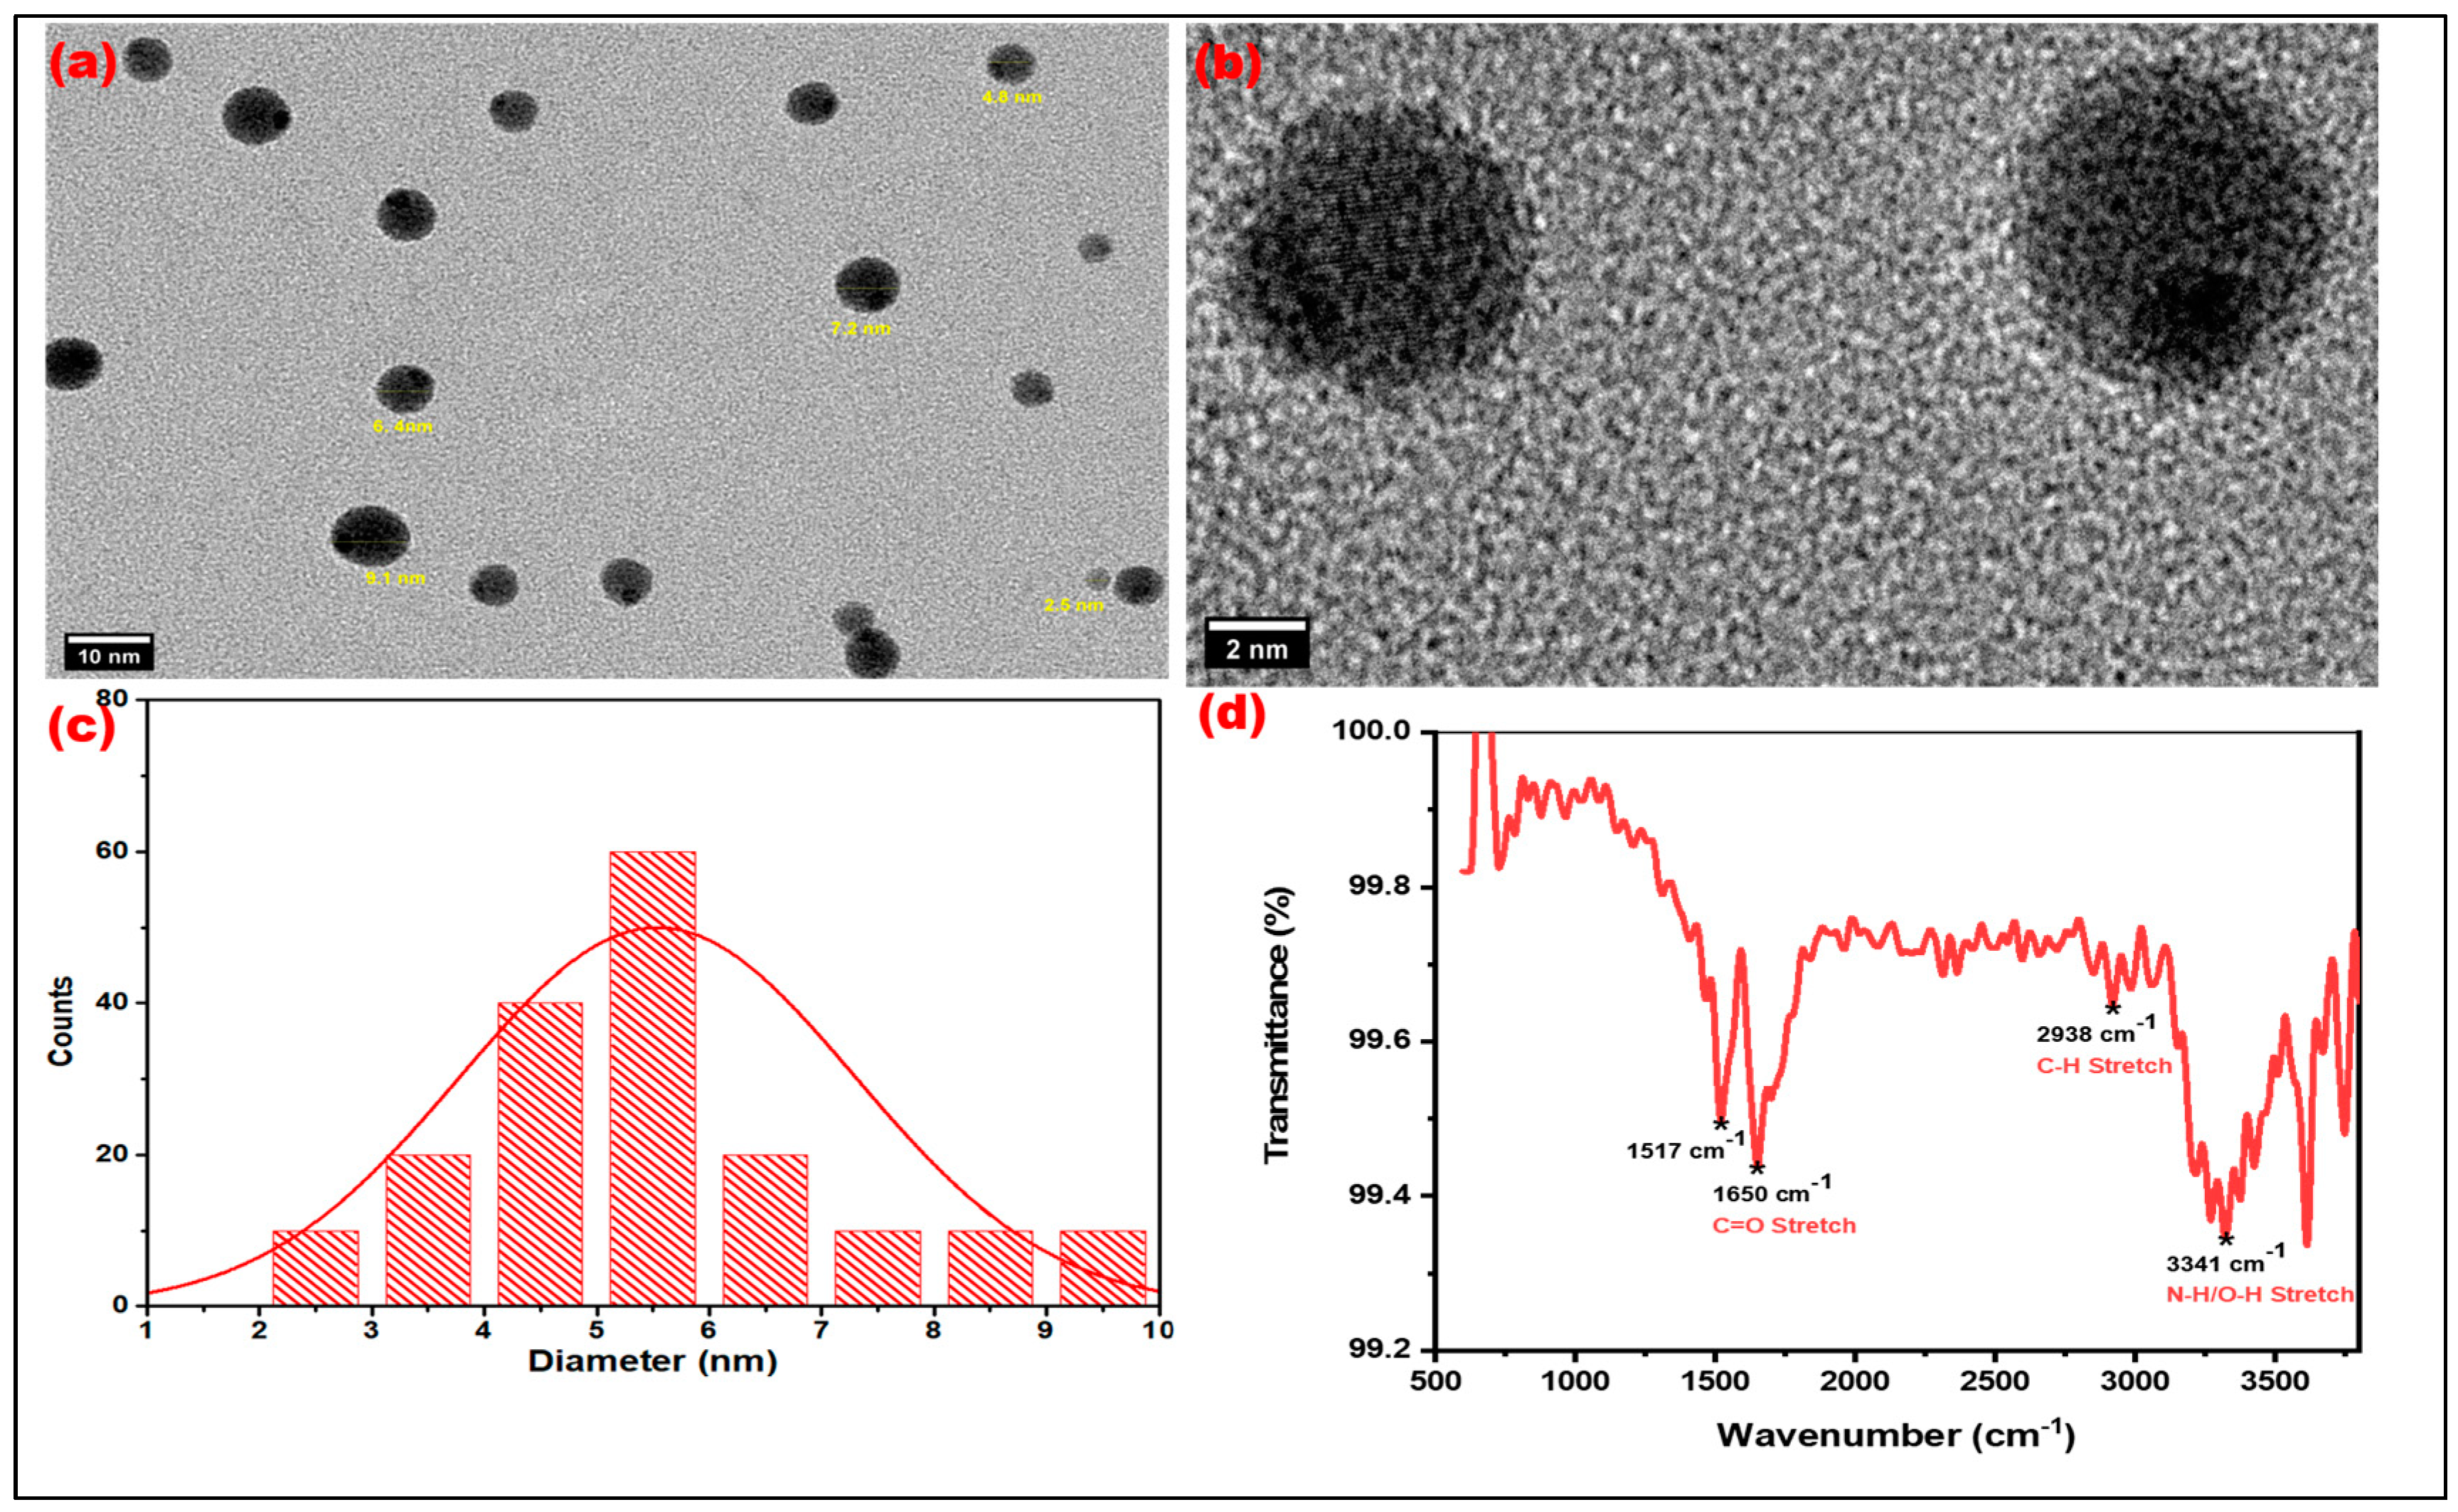
3.2.1. HRTEM Analysis

HRTEM analysis showed the presence of quasi-spherical particles with monodisperse structures with a diameter of 8–10 nm (Figure 4a–c). This narrow size range is significant as it suggests good control over the synthesis process, resulting in consistent particle sizes that can lead to improved properties for various applications, including sensing and remediation. Additionally, the analysis illustrates the amorphous nature of R-CDs. The amorphous nature of the R-CDs may contribute to their versatility in various applications, as they can offer advantages in terms of surface functionalization and chemical reactivity compared to crystalline counterparts. Additionally, the lack of crystallinity is attributed to enhanced fluorescence characteristics [33].

3.2.2. FTIR Spectroscopic Studies

FTIR analysis indicated the presence of various kinds of functional groups on R-CDs’ surface (Figure 4d). The broad transmittance band at 3611 and 3341 cm−1 corresponds to hydroxyl (–OH) groups and amine (N–H) groups, respectively, suggesting a high degree of hydrophilicity, which enhances their solubility in aqueous solutions. Additionally, the strong peaks observed at 1517 cm⁻1 and 1650 cm⁻1 indicate an increased presence of carboxylic functional groups [34,35].

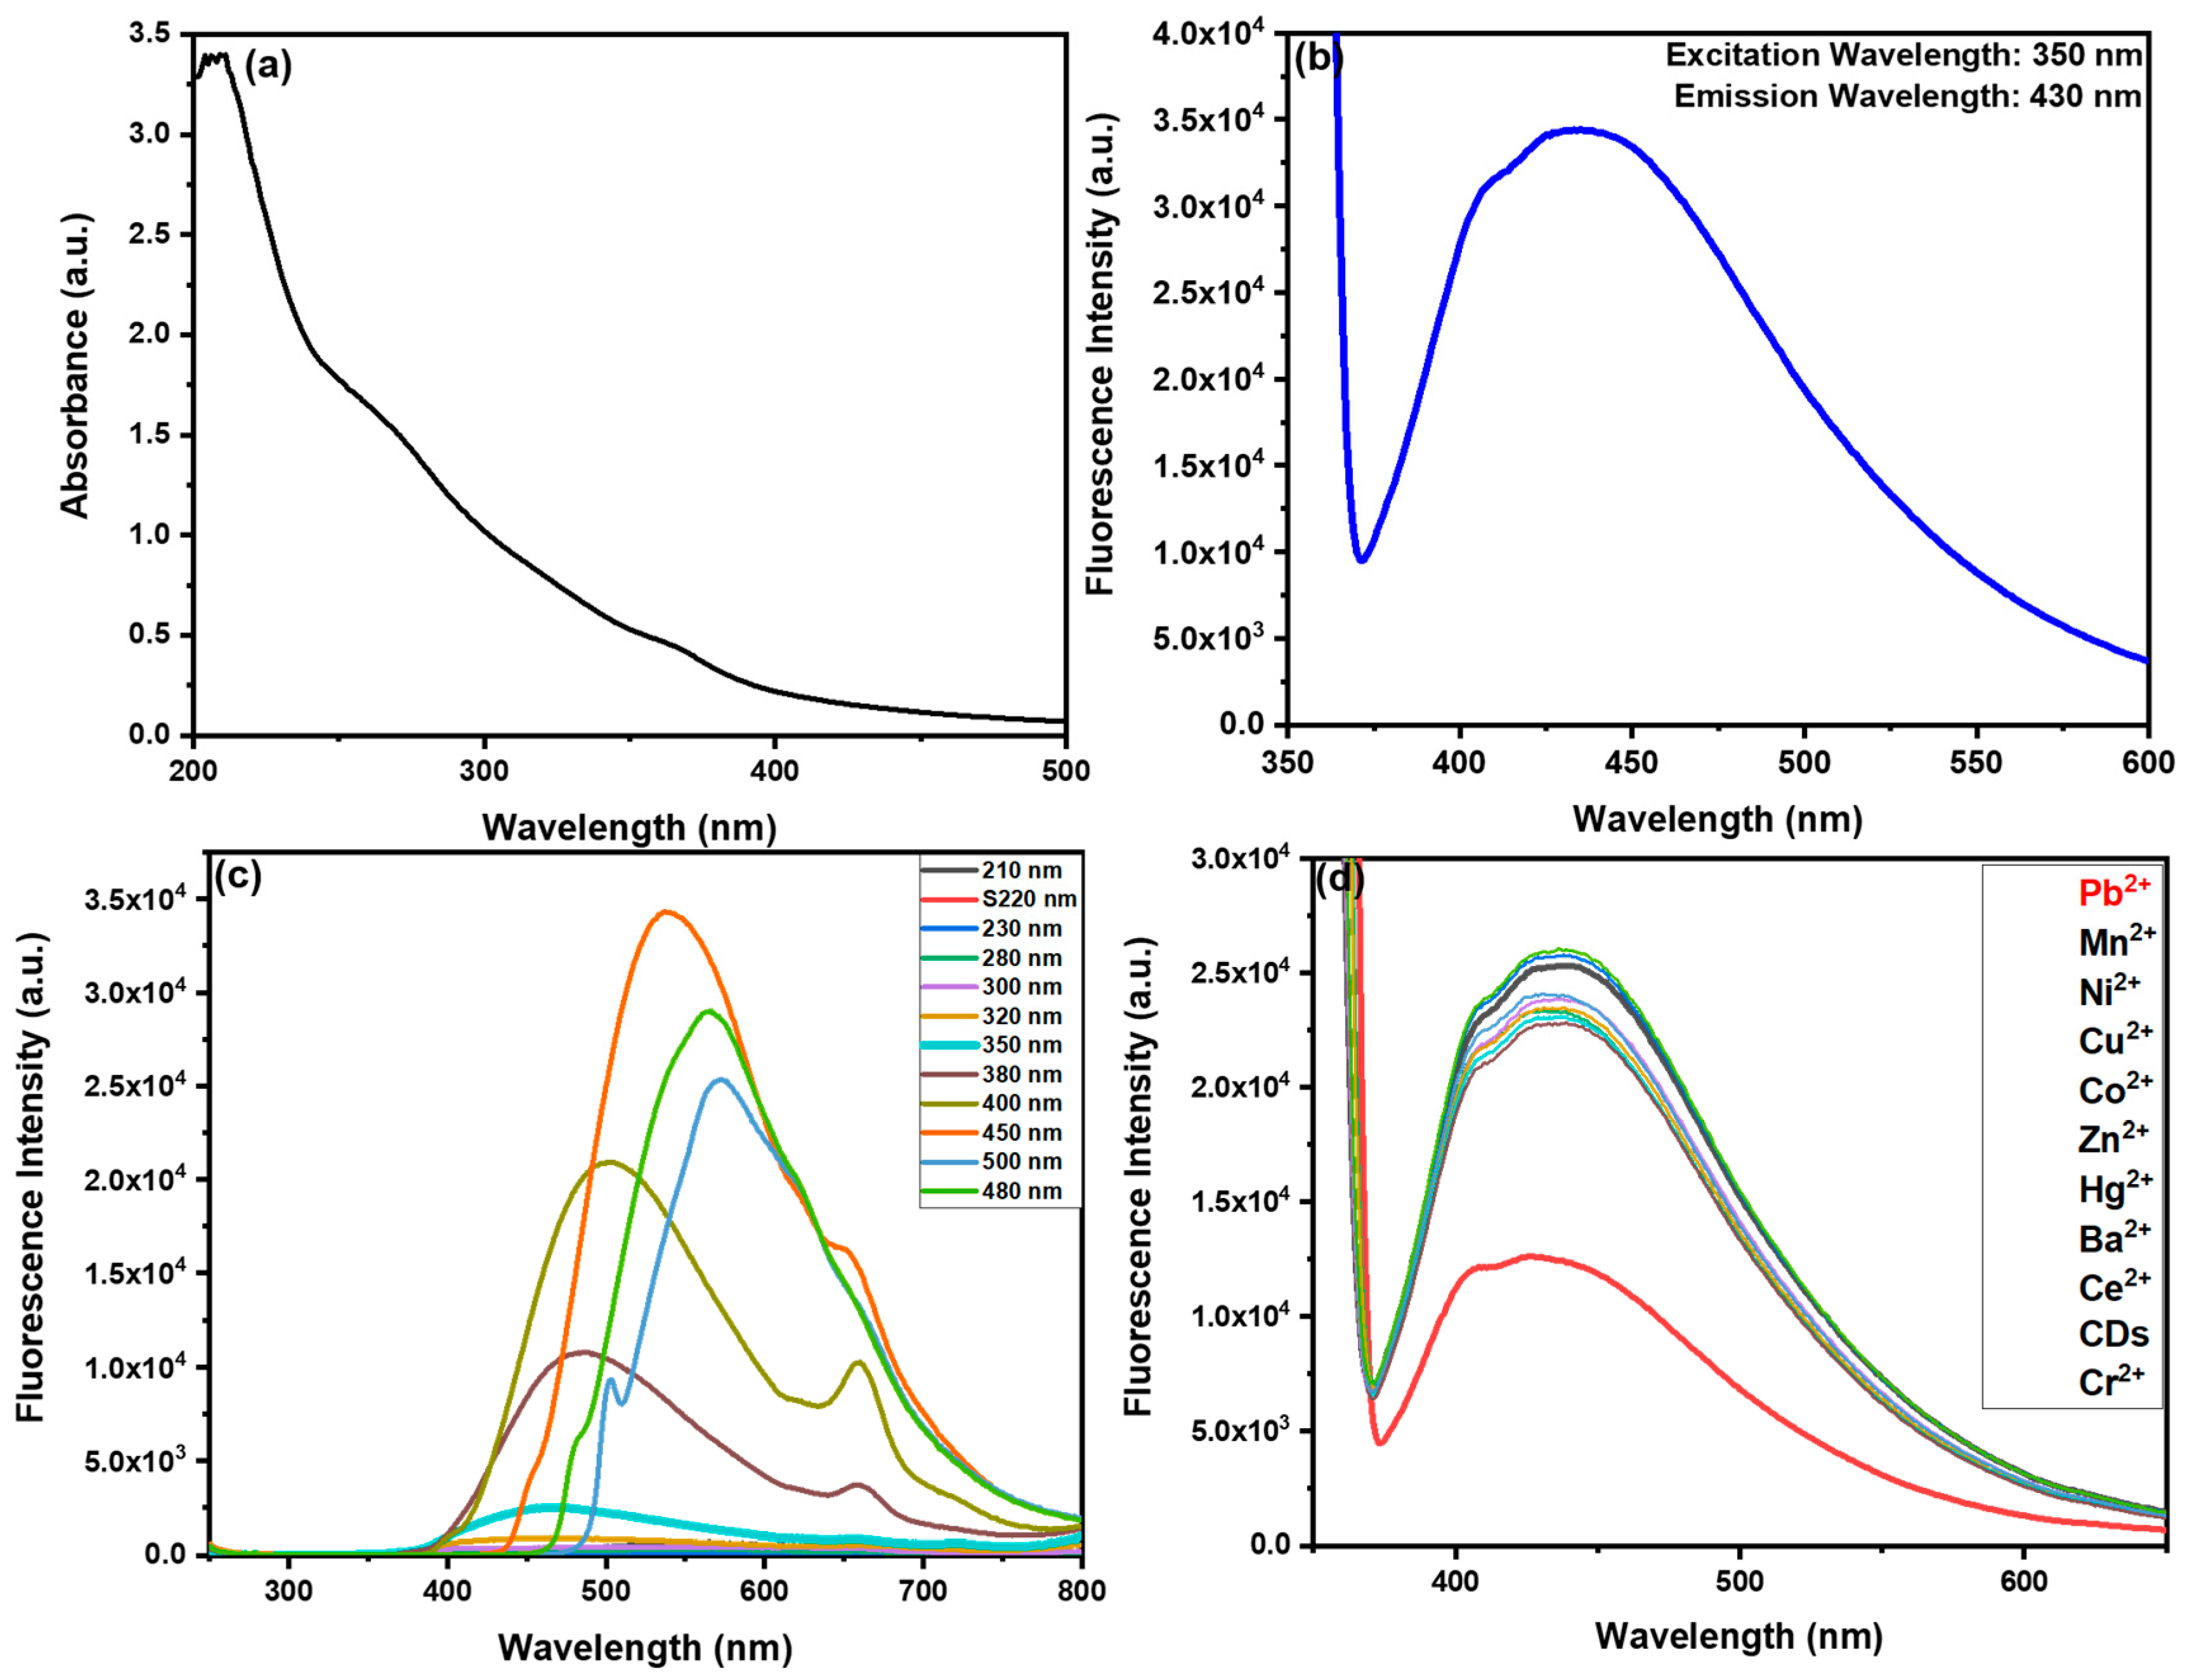
3.2.3. Optical Characterization of R-CDs

The optical characteristics were investigated using UV–visible (UV–Vis) and photoluminescence (PL) spectroscopy. The R-CDs exhibited distinctive absorbance spectra, featuring a prominent peak at 220 nm corresponding to π–π* transition (Figure 5a) [36]. R-CDs displayed negligible fluorescence under daylight conditions, whereas in the presence of UV light, CDs exhibit blue fluorescence with an emission peak at 430 nm (at λext. = 350 nm), consistent with characteristic emission profiles of CDs (Figure 5b). The synthesized R-CDs showed excitation-dependent fluorescence, a characteristic feature in carbon-based nanomaterials [37]. As depicted in Figure 5c, varying the excitation wavelength from 220 nm to 380 nm resulted in a progressive red shift of the fluorescence emission peak, along with variations in emission intensity. These shifts likely arise from differences in particle size distribution or diverse surface energy traps. As the size of CDs varies from 8–10 nm, thus quantum confinement effect is less pronounced in these dots as compared to smaller CDs. Even within the 8–10 nm range, slight variations in particle size can cause differences in electronic bandgap energies. This results in photons of different wavelengths being absorbed and emitted, leading to excitation-dependent PL [38,39]. Along with the energy band gaps, ensemble effects play a significant role. Although single CDs can exhibit excitation-dependent PL, in bulk samples, the size and surface variability across the ensemble lead to overlapping emissions from different subsets of particles [40].

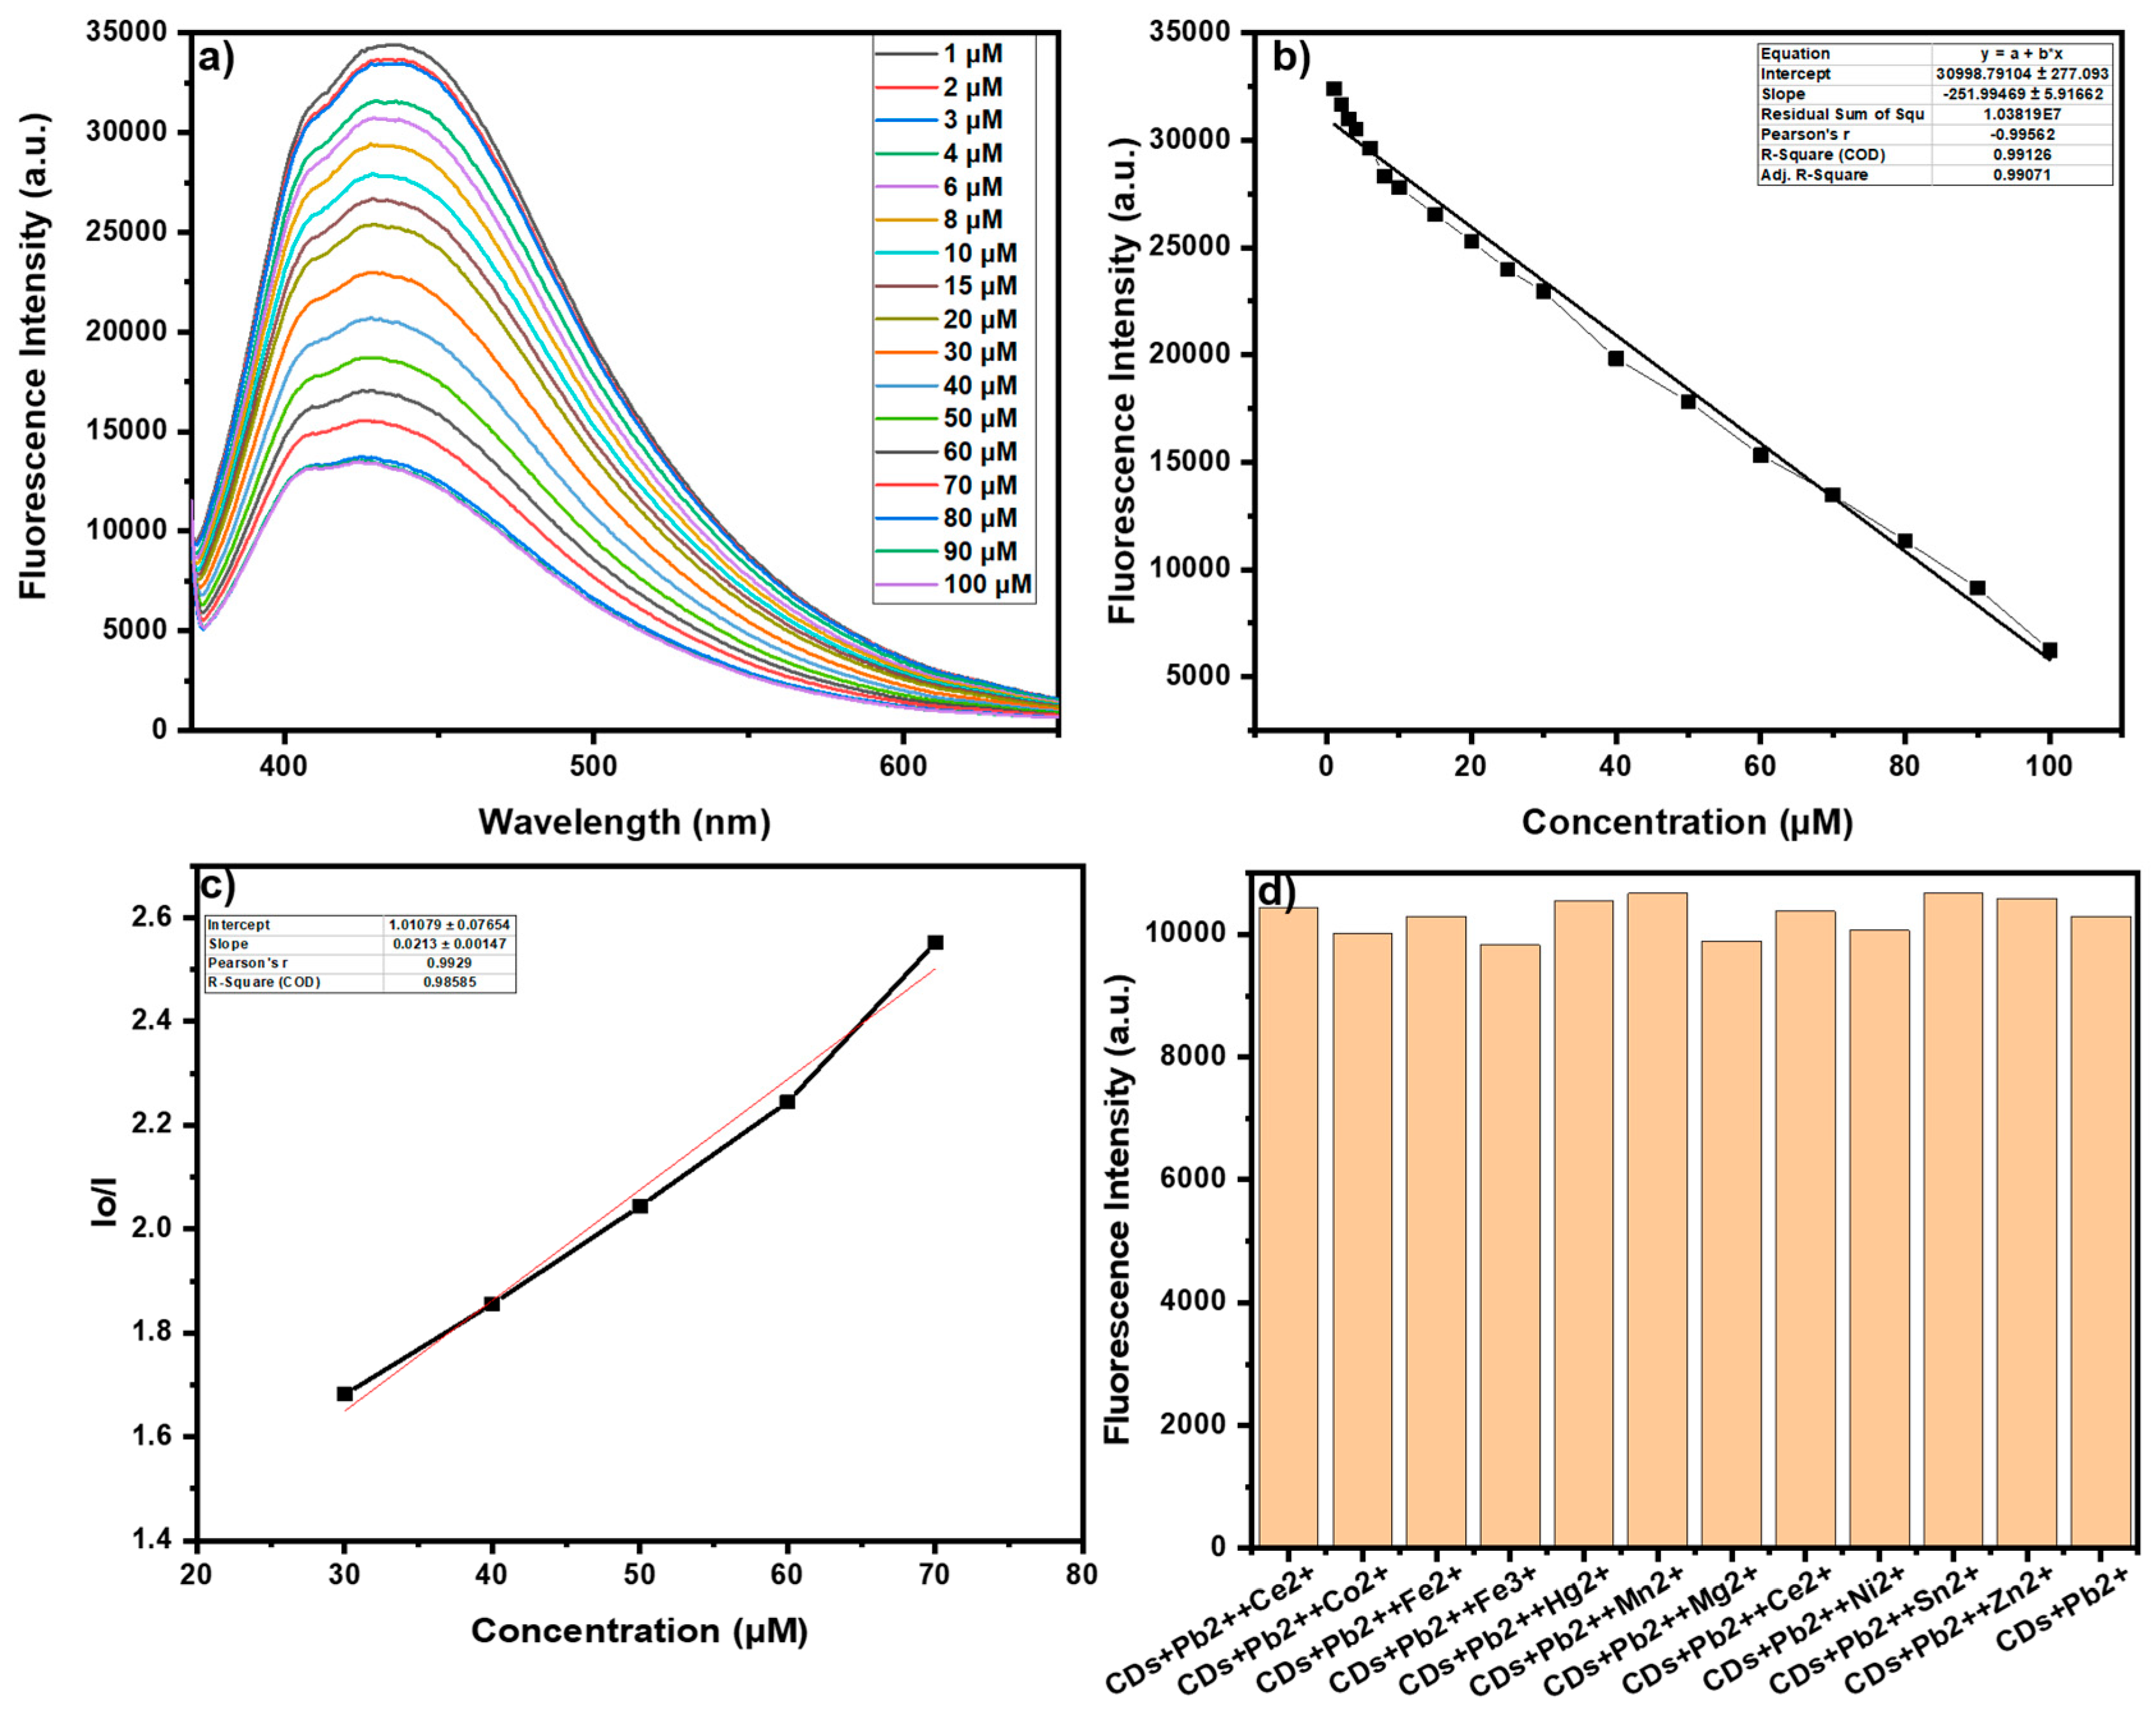
3.3. Sensing Study of Pb2+

The emission spectra of the R-CDs were analyzed at different concentrations, revealing that lower concentrations resulted in higher sensitivity and maximum emission. Additionally, the stability of the R-CD’s fluorescence was evaluated, which is a critical attribute for sensing applications. The R-CDs demonstrated remarkable colloidal stability, showing no visible precipitation or agglomeration even after one month of storage. Notably, the fluorescence intensity remained virtually unchanged over this period, indicating the R-CDs possess outstanding long-term fluorescent stability, making them promising candidates for sensor development. The synthesized R-CDs were screened for their sensing response against various heavy metal ions using a fluorescence spectrophotometer with λ ex = 350 nm. For this purpose, 60 µL of metal nitrate solution was introduced into 3 mL of a 10% diluted R-CDs solution. Among the metal ions tested, no significant change in the fluorescence emission of the R-CDs was observed, except in the case of Pb2+, which caused a quenching of the fluorescence intensity (Figure 5d).
The inhibition of fluorescence intensity might be attributed to the formation of metal (Pb2+) complexes with the surface functional groups of R-CDs. Furthermore, to assess the sensitivity of prepared R-CDs towards Pb2+, titration studies were conducted by subsequently adding the target analyte (Pb2+) solution to the diluted R-CDs solution ranging from 1 µM to 100 µM (Figure 6a). An increase in Pb2+ concentration led to a decrease in the emission spectra of R-CDs, which suggests that the fluorescent probe exhibits a linear response over a concentration range of 1 µM to 100 µM (Figure 6b).
Furthermore, the sensitivity and quenching efficiency of synthesized R-CDs were evaluated using a Stern–Volmer (SV) plot. By observing λem = 430 nm, a relationship was plotted (Stern–Volmer plot), representing the normalized inhibition of luminescent behavior in fluorescence intensity of the R-CDs with increasing concentrations of Pb2+ (1 µM to 100 µM), which was employed to plot SV and calculate the quenching constant by applying the SV Equation (3):
Io/Ii = 1 + Ksv[Q]
where Io and Ii present fluorescence intensities of unquenched R-CDs and on the addition of varying concentrations of quencher, [Pb2+]. The parameters [Q] and Ksv denote the quencher concentration and the SV constant, respectively. The SV equation was employed to determine the quenching constant. A plot of Io/Ii versus the quencher concentration [Q] was generated (Figure 6c). The quenching constant was measured to be 2.14 × 10⁴ M−1. For sensitivity analysis, the limit of detection (LOD) and the limit of quantification (LOQ) were estimated using the 3σ method. Equations (4) and (5) [19].
LOD = 3.3σ/s
LOQ = 10σ/s
In the above equation,
‘σ’ is the standard deviation,
‘s’ is related to the slope of the calibration plot.
The LOD and LOQ for Pb2+ ion were estimated to be 0.11 µM and 0.34 µM, respectively, over a linear range from 1 to 100 µM. The LOD was found to be below permissible limits set by regulatory agencies such as the WHO (10 µg/L or ~0.048 µM for drinking water). Thus, this approach is well-suited for on-site monitoring and practical applications in environmental remediation and water quality management. Table 1 illustrates the detection efficacy of various kinds already reported CDs in literature.
For the component to be a good sensor, it must be selective toward the target analyte in the presence of other potential interfering components. Hence, interference studies have been conducted in which 60 µL of metal nitrate solution (100 µM) was added to the solution of R-CDs and Pb2+ (3 mL of diluted R-CDs (10%) + 60 µL Pb2+). Interestingly, the other metal ions do not show any effect on the emissive response of R-CDs with Pb2+ (Figure 6d). All the abovementioned studies indicate that the fluorescent probe is highly selective and sensitive towards the detection of Pb2+.
Moreover, Pb2+ ion detection requires the effect of various important factors including pH, temperature, and the incubation time. In this regard, the fluorescence stability of R-CDs and R-CDs with Pb2+ was evaluated due to the reduced protonation of R-CDs. Intriguingly, the luminescent intensity of R-CDs exhibited negligible variation in alkaline conditions (pH 8–14). Furthermore, the fluorescence response of R-CDs and complex remained stable even under fluctuating temperature conditions (25–40 °C). Additionally, the synthesized R-CDs-based probes exhibited exceptional photostability evidenced by the consistent photoluminescence intensity observed even after prolonged excitation with a UV lamp. For the stability check, the R-CDs were kept for a time of two months, and interestingly, no precipitation (cm−1) or floating particles were found, and no considerable variation in the fluorescence response was observed, which signifies the higher stability of R-CDs.
Moreover, the relative quantum yield was measured by considering fluorescein as reference material as per the below equation:
φ A = φ S   *   ( F A / F S )   *   ( O . D . S / O . D . A )
where φ is the quantum yield; F is the relative emission; O.D. is the absorbance respectively; and the subscript “A” and “S” stands for the sample and standard. Thus, using the aforementioned parameters, the fluorescence yield was calculated to be 13%.

Mechanism Illustrated for Pb2+ Recognition Using R-CDs

The inhibition in the fluorescence response of R-CDs by the addition of Pb2+ is primarily attributed to the chelation between Pb2+ and –OH functionalities of R-CDs (Figure 6). This chelation results in an electron transfer process and promotes the non-radiative recombination of excitons, which results in a notable reduction in fluorescence intensity [41,42,43,44]. The selective detection is attributed to the strong affinity and rapid chelation of Pb2+ with –OH functionalities compared to other metal ions (Figure 7). The selective binding of Pb2+ towards CDs is owing to the soft Lewis acidic nature of metal and offers high affinity for electron-rich sites, especially by –OH groups. Additionally, the relatively large ionic radius and high polarizability of Pb2+ enhance its interaction with the –OH groups compared to smaller, harder metal ions like Na+ or Mg2⁺. The underlying mechanism involves the formation of a coordination bond between the lone pairs on the oxygen atoms of the –OH groups and the empty orbitals of Pb2+. This bond formation facilitates an efficient electron transfer from the R-CDs to the Pb2+ ions, which competes with the radiative recombination process responsible for fluorescence. Consequently, exciton recombination becomes predominantly non-radiative, leading to fluorescence quenching. The high stability of the Pb2+–R-CDs complex is crucial in this context, as it ensures a reliable and reproducible quenching response, thereby enhancing the selectivity and sensitivity of the detection system.
Table 1. Comparative analysis of recently reported techniques for Pb2+.
TechniquesDetection Range (ng/mL)Detection Limit (ng/mL)References
Pb2+-driven DNA molecular device 0.02–1 µM20 nM[45]
AGRO1000–1000 nM1.0 nM[46]
G-quadruplex DNAzyme0–1000 nM0.4 nM[46]
Blue and Red CDs Not Given 2.89 nM[47]
Fluorescent starch-based hydrogel 5–160 μg/L 0.06 μg/L[48]
Moringa oleifera gum derived CDs0–100 ppb11.62 nM[49]
Rice straw derived CDs1–100 µM0.11 µMThis Work

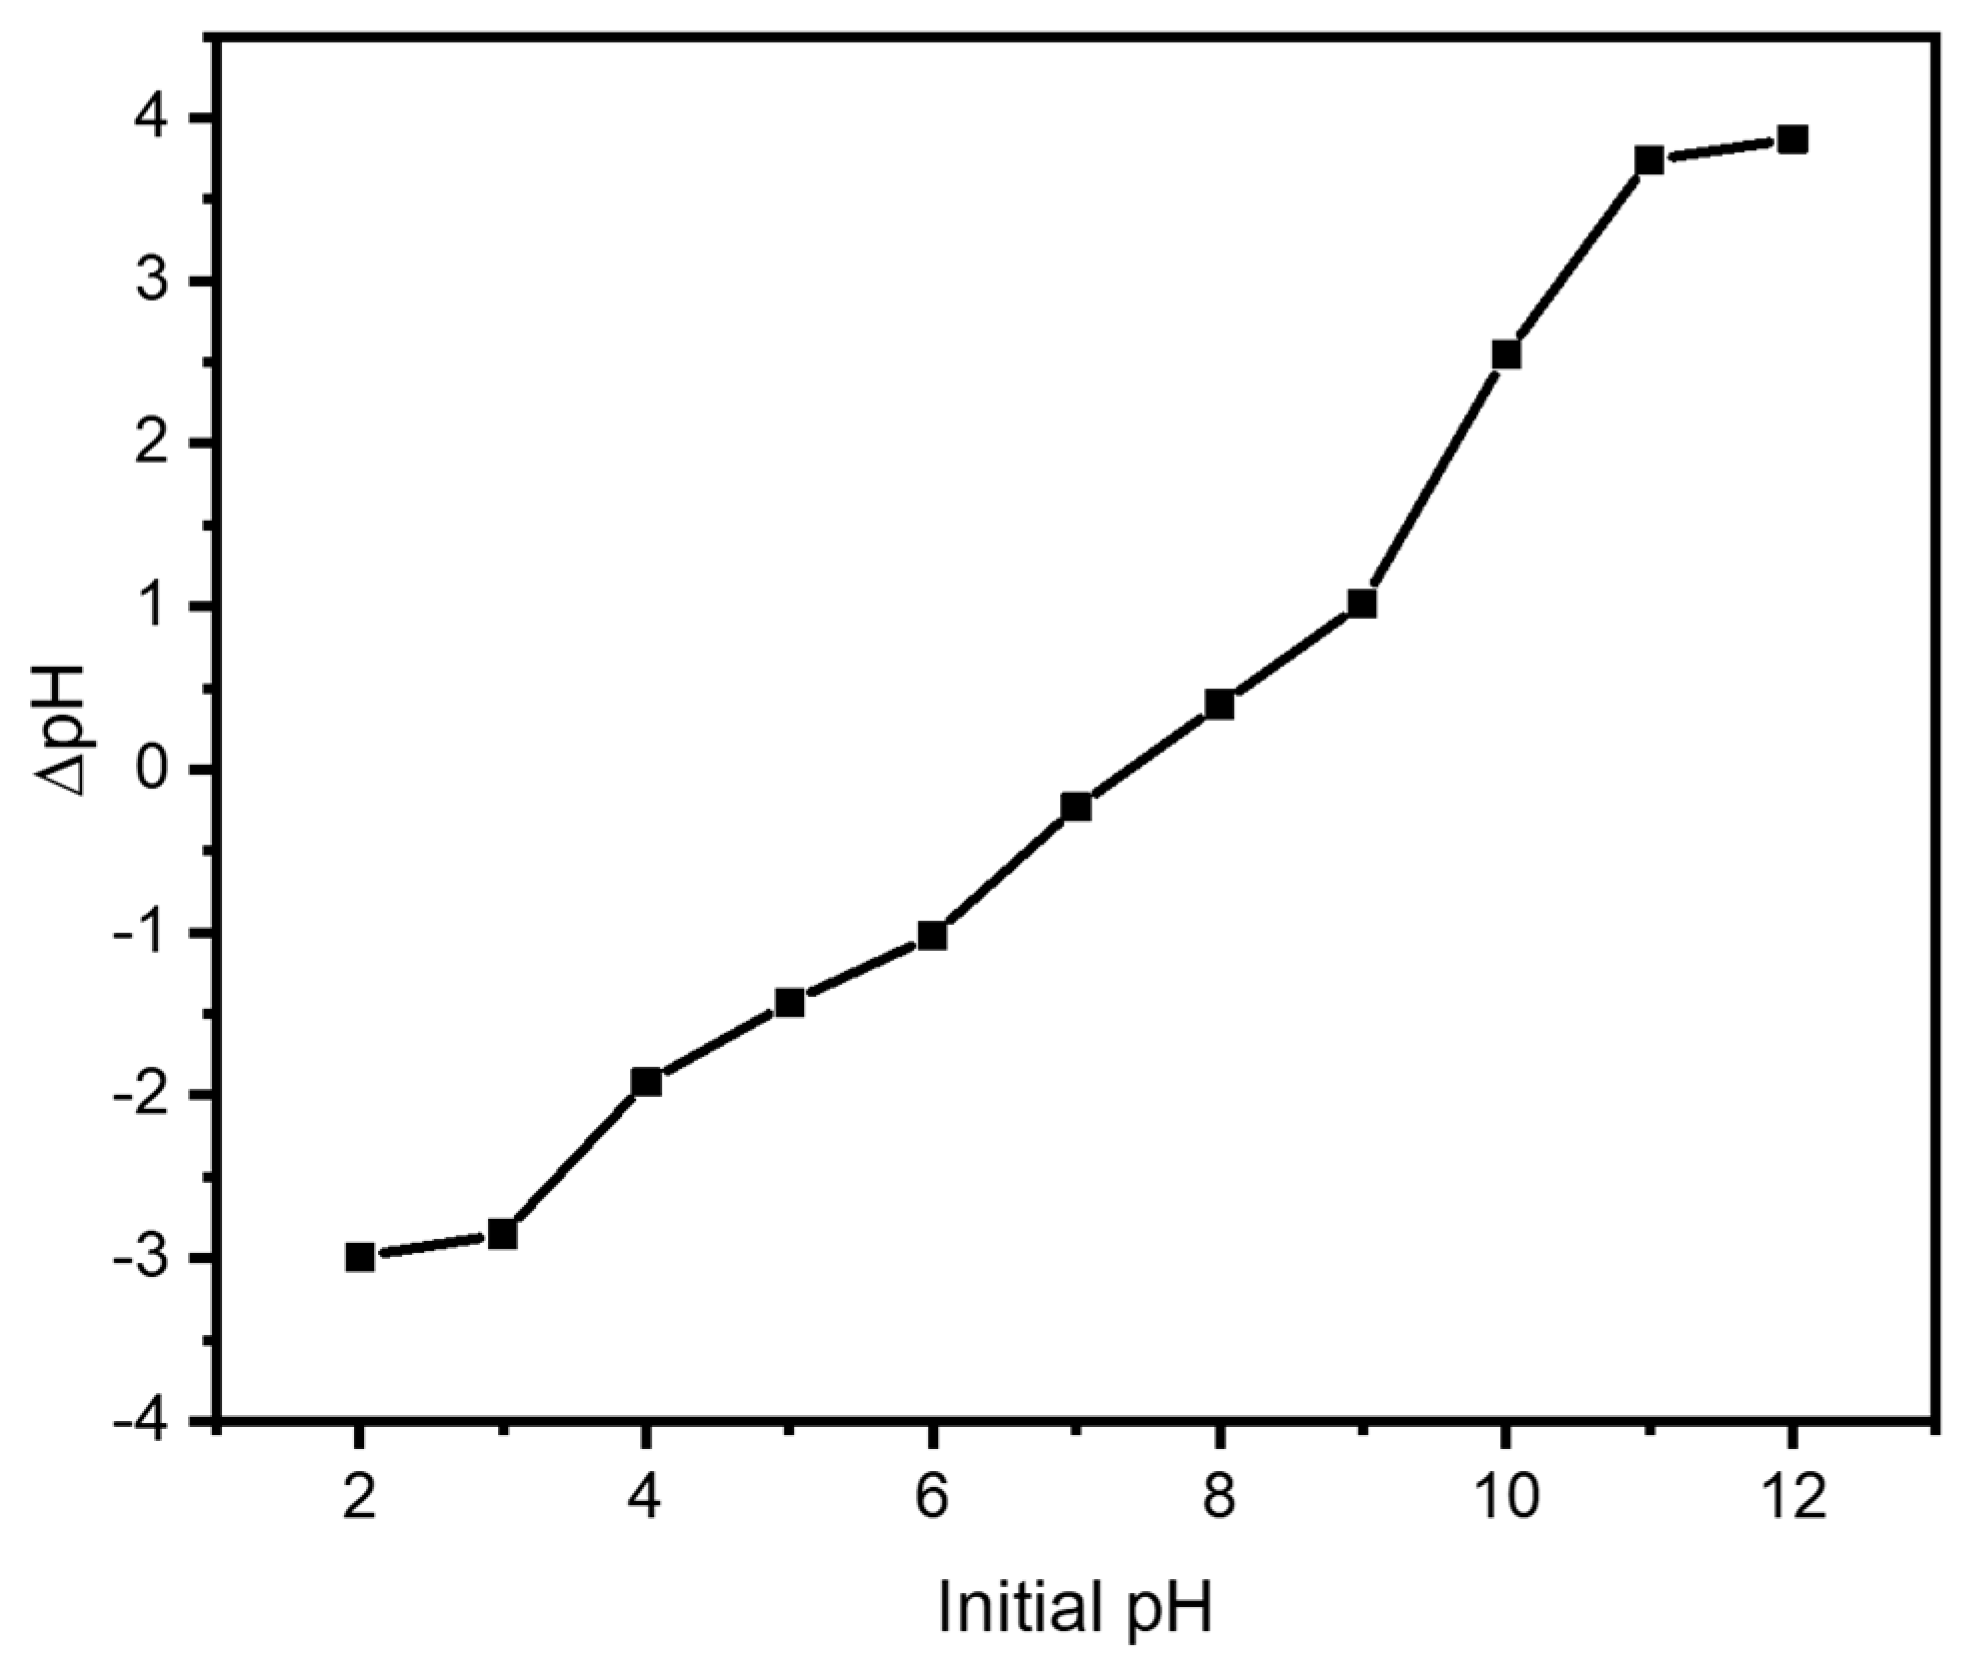
3.4. Point of Zero Charge (pHzpc)

The point of zero charge (pHzpc) of the adsorbents was determined using the salt addition method to evaluate the surface characteristics of the adsorbents and the role of pH in the adsorption process. In this regard, 0.01 M KNO3 solution was used in the studies to measure the pHzpc. For this, 0.1 M HCl or 0.1 M NaOH was used to bring the solution’s starting pH (pH 0) down to values between 2 and 10. In an Erlenmeyer flask, 100 mL of the pH-adjusted solution was mixed with a determined quantity of biosorbent (20 mg). To guarantee equilibrium, the mixture was shaken with a magnetic shaker for 48 h at room temperature. A plot of pHf vs. pH0 was created after the concentration of the supernatant was measured. The intersection of the curve with the line pHf = pH0 was determined to be the point of zero charge.
The pHzpc values for the Pb–R-BC were found to be 7.8. The increased concentration of H+ ions at low pH reduces the adsorption effectiveness by competing with Pb2+ ions for the active adsorption sites. The H+ ion concentration falls with increasing pH, which causes the functional groups on the adsorbent surface to deprotonate and increases the number of binding sites that are available. Because of the improved interaction with negatively charged adsorbent surfaces and less electrostatic repulsion, this promotes the adsorption of Pb2+ ions. Protonation causes the adsorbent surface to become positively charged at pH values lower than pHzpc, which promotes the adsorption of anionic species. On the other hand, the surface gains a negative charge at pH values higher than pHzpc, which improves the adsorption of cationic Pb2+ ions (Figure 8) [50].

3.5. Lead Removal Studies

The prepared biochar exhibits high potential for the removal of the Pb2+ owing to the abundance of oxygen and nitrogen-containing surface functionalities. Pb2+ ions display a maximum absorbance at λmax = 290 nm, and the addition of R-BC results in a significant decrease in absorbance over time. The adsorption process reaches equilibrium after 150 min, with no further decrease in absorbance observed beyond this point. The biochar demonstrates a removal efficiency of 77.61%, corresponding to an adsorption capacity of 155.234 mg/g (Figure 9a). This efficiency is largely due to the biochar’s surface charge properties, which promote electrostatic interactions with Pb2+ ions, facilitating effective sequestration (Figure 9b,c).
Furthermore, the variables, including R-BC dosage, temperature, and concentration of analyte, were optimized, and optimal conditions were achieved with 10 mg of R-BC in 100 mL of a 20-ppm lead solution, and the pH is maintained as depicted by the pHzpc study. The time course study depicts the rate of removal of Pb2+ and the rate of increasing adsorbent efficiency which are inversely proportional to each other (Figure 10a). A positive linear correlation has been observed between R-BC dosage and Pb2+ elimination efficiency though a saturation point is reached beyond which increasing the biochar amount has no further impact on removal efficiency. These results were observed due to the occupancy of available adsorption sites on the R-BC surface, limiting further lead ion uptake [51].
Moreover, the adsorption equilibrium data for the removal of Pb2+ ions were analyzed using the Langmuir, Freundlich, Temkin, Dubinin–Radushkevich, and Sips isotherm models to evaluate the relationship between the metal adsorption capacity (Q) and the equilibrium metal ion concentration (Ceq) [32]. The Langmuir model illustrates monolayer adsorption on a homogeneous surface, whereas the Freundlich model accounts for adsorption on heterogeneous surfaces and the formation of multilayers [52]. However, the Temkin model applies to systems where adsorbate–adsorbent interactions are minimal [53]. The adsorption parameters for Pb (II) derived from these models are summarized in Table 2.
The maximum adsorption capacity (Qm) for a complete monolayer, as estimated by the Langmuir equation, cannot be determined directly using the Freundlich model. The model suitability was evaluated based on determination coefficients (R2) and the consistency of equilibrium constants and maximum adsorption capacities with experimental data. The Langmuir, Freundlich, Temkin, Dubinin–Radushkevich and Sips fits are graphically depicted in Figure 10b. Further, the Dubinin–Radushkevich isotherm model was fitted, which suggests that the physical adsorption occurs in the adsorption of Pb2+ using R-BC via weak Vander Waal forces. Additionally, the Sips model combines elements of both the Langmuir and Freundlich isotherms and is applicable for localized adsorption without interactions between adsorbed molecules. At low adsorbate concentrations (CeC_eCe), the isotherm simplifies the Freundlich model. Conversely, at higher concentrations, it reflects the Langmuir model, predicting a maximum monolayer adsorption capacity. The general expression for the SIPS isotherm is given in Table 2, which illustrates a very low R2 value, i.e., 0.62.
Among all the fits, the Langmuir isotherm model yielded a maximum adsorption capacity (qmax) of 183 mg/g with the highest R2 value, demonstrating the high affinity of R-BC for Pb2+ ions. The Langmuir constant (KL = 0.01295 L/mg) further supports the material’s strong adsorption potential, reflecting efficient monolayer adsorption on homogenous active sites. These findings align with the structural and surface properties of R-BC, including its functional groups and porosity, which facilitate selective Pb2+ ion binding.
The Langmuir model yielded the highest correlation coefficient (R2), indicating its suitability in describing Pb2+ adsorption on R-BC, with a theoretical monolayer capacity (Qm) of 183.8 mg/g, closely matching the experimental value of 152.5 mg/g. This suggests a strong agreement between the experimental data and the Langmuir model, underscoring the biochar’s high potential as an adsorbent compared to other agricultural waste-derived materials (Table 3).

3.6. Kinetics Studies

The kinetics of Pb2+ onto R-BC were studied to understand the adsorption mechanism, optimized removal conditions, and assess the rate of Pb2+ uptake. Various kinetic models, including pseudo-first-order (PFOM), pseudo-second-order (PSOM), Elovich model and Intraparticle diffusion model, were employed.

3.6.1. PFOM

This model considers that during the initial phase of adsorption, the uptake of Pb2+ is directly proportional to the saturation concentration and adsorbent capacity [54]. It is typically observed when adsorption occurs through interfacial diffusion. The model is defined by the equation shown in Table 4.
A linear plot of log(qe − qt) versus time for Pb2+ adsorption is used to determine the rate constants, as shown in Figure 11a. The kinetic constants are summarized in Table 4. The high correlation coefficient (R2 = 0.93) indicates that the adsorption process follows PFOM. Similarly, both the modeling of Pb2+ adsorption onto R-BC often show rapid uptake in the initial stages, followed by equilibrium being reached after several hours.

3.6.2. PSOM

The model considers chemisorption as the rate-limiting step, where adsorption occurs through chemical interactions rather than solely through physical processes such as diffusion [55]. In this model, the adsorption rate depends on the availability of active adsorption sites rather than the concentration of adsorbate, making it more suitable for predicting adsorption behavior over the entire process [56]. The PSOM equation is shown in Table 4.
A plot of t/qt versus time (t) provides the correlation, as shown in Figure 11b, allowing for the determination of k2 and qe with the relevant parameters summarized in Table 5.
This model is often preferred over the pseudo-first-order model due to its better accuracy in predicting the equilibrium adsorption capacity and higher correlation coefficient (R2 = 0.98). In studies of Pb2+ removal using biochar, the PSOM has been shown to more accurately define the adsorption kinetics, indicating that chemisorption plays a dominant role in the process, similar to findings in other adsorbent systems [57].

3.6.3. Intraparticle Diffusion Model

The intraparticle diffusion model (IDM) is employed to elucidate the adsorption mechanism of Pb2+. This model establishes a relationship between adsorption equilibrium and the adsorption uptake as a function of the square root of time (t1/2), providing insights into the diffusion-controlled processes governing the adsorption behavior (Table 4, Figure 11c).

3.6.4. Elovich Model

The Elovich model (EKM) is widely employed to describe adsorption processes and is well-suited for adsorption occurring on heterogeneous surfaces. It is often utilized to analyze second-order kinetic processes, assuming a high degree of heterogeneity at the solid adsorbent interfaces. The general form of the Elovich equation, as given in Table 4, provides a framework for understanding the adsorption dynamics under these conditions. The plot of lnt against qt was utilized to calculate the constants as described in Table 5 (Figure 11d).
Among the models fit, the R2 values for the models (PFOM and PSOM) are quite close (0.93 and 0.98). Hence, MRD (%) was calculated for both the models using the equation below and the values were found to be 9.4% and 22.3% for PFOM and PSOM, respectively. Hence, the model with a lower MRD% value, i.e., PFOM, shows better agreement with the experimental results.
To further analyze the adsorption kinetics and evaluate the role of diffusion during the adsorption process, the intraparticle diffusion model was applied (Table 4). For the BC0, the model exhibited a moderate fit with an R2 value of 0.89, suggesting that lead (Pb2+) adsorption involved multiple mechanisms beyond simple diffusion. While the diffusion of Pb2+ ions from the bulk solution to the external surface of the biochar played a significant role, the rate-limiting step could be attributed to intraparticle diffusion into the pores. These findings indicate that while intraparticle diffusion contributes to the overall adsorption process, its extent is strongly influenced by the structural characteristics of the biochar, including pore size distribution and surface modifications.

4. Real Sample Analysis

The synthesized R-CDs exhibited notable sensitivity and specificity towards Pb2+ ions. To assess the practical utility and viability of the R-CDs, three water samples were employed using control and spiked particulars, in which a Pb2+ solution of different concentrations was spiked in the collected samples. The spiked samples were found to show a recovery varying from 96 to 101%, and the detailed recovery analysis is given in the table. The sample analysis suggests that CDs exhibit potential fluorescent probes for Pb2+ recognition (Table 6).

5. Conclusions and Future Perspectives

In this study, R-CDs and R-BC were successfully synthesized using a hydrothermal method involving rice straw as a precursor. TEM and BET studies confirmed that the prepared R-BC showed a porous structure and followed Type II isotherm with an H3 hysteresis loop, which confirmed the presence of meso and macropores. HRTEM analysis showed the presence of quasi-spherical particles with a diameter of 8–10 nm. The R-CDs exhibited a blue emission spectrum around λem = 430 nm at λex = 350 nm. The resulting R-CDs showed remarkable sensing potential towards Pb2+ ions with an LOD of 0.11 µM. Furthermore, the R-BC showed a Pb2+ removal efficiency of 77.61%, with the adsorption process fitting the Langmuir isotherm and following second-order kinetics. These results demonstrate that the dual use of rice straw-derived materials offers a cost-effective, sustainable alternative for the detection and remediation of environmental pollutants. The developed method demonstrated a practical applicability by validated real water samples which gives satisfactory spiked recoveries.
However, one of the primary challenges is the relatively low surface area of R-BC, which might limit its adsorption capacity, particularly at higher pollutant concentrations. Thus, there is an imperative need for further optimization of synthesis methods to enhance the surface area and pore structure of R-BC for improved adsorption performance. Future studies should focus on optimizing the synthesis process to enhance the surface area and functionalization of R-BC for broader pollutant removal capabilities. Incorporating these materials into advanced systems, such as integrated remediation platforms or microfluidic devices, could significantly improve their practical application.

Author Contributions

J.S.: Writing—Original draft preparation, Writing—Reviewing and Editing, Methodology, Visualization. M.B. (Monika Bhattu): Writing—Reviewing and Editing, Data curation, Visualization, Software. M.V.: Supervision, Writing—Reviewing and Editing, Investigation. S.K.B.: Conceptualization, Supervision, Methodology. M.B. (Mikhael Bechelany): Writing—Reviewing and Editing, Investigation. R.J.: Conceptualization, Supervision, Methodology. All authors have read and agreed to the published version of the manuscript.

Funding

This research received no external funding.

Data Availability Statement

Data will be available on request.

Acknowledgments

The authors gratefully acknowledge Marwadi University, Gujarat, India, Rayat Bahra University, Punjab, (India), and York University, Canada for providing the necessary resources to carry out this work.

Conflicts of Interest

The authors declare no conflicts of interest.

References

  1. Gahrouei, A.E.; Rezapour, A.; Pirooz, M.; Pourebrahimi, S. From Classic to Cutting-Edge Solutions: A Comprehensive Review of Materials and Methods for Heavy Metal Removal from Water Bodies. Desalination Water Treat. 2024, 319, 100446. [Google Scholar] [CrossRef]
  2. Das, P.; Maruthapandi, M.; Saravanan, A.; Natan, M.; Jacobi, G.; Banin, E.; Gedanken, A. Carbon Dots for Heavy-Metal Sensing, PH-Sensitive Cargo Delivery, and Antibacterial Applications. ACS Appl. Nano Mater. 2020, 3, 11777–11790. [Google Scholar] [CrossRef]
  3. Lee, A.; Chin, J.; Park, O.K.; Chung, H.; Kim, J.W.; Yoon, S.-Y.; Park, K. A Novel Near-Infrared Fluorescence Chemosensor for Copper Ion Detection Using Click Ligation and Energy Transfer. Chem. Commun. 2013, 49, 5969–5971. [Google Scholar] [CrossRef] [PubMed]
  4. Zhou, R.; Li, B.; Wu, N.; Gao, G.; You, J.; Lan, J. Cyclen-Functionalized Perylenebisimides as Sensitive and Selective Fluorescent Sensors for Pb 2+ in Aqueous Solution. Chem. Commun. 2011, 47, 6668–6670. [Google Scholar] [CrossRef] [PubMed]
  5. Wang, Z.; Lee, J.H.; Lu, Y. Highly Sensitive “Turn-on” Fluorescent Sensor for Hg2+ in Aqueous Solution Based on Structure-Switching DNA. Chem. Commun. 2008, 45, 6005–6007. [Google Scholar] [CrossRef] [PubMed]
  6. Barba-Bon, A.; Costero, A.M.; Gil, S.; Parra, M.; Soto, J.; Martínez-Máñez, R.; Sancenón, F. A New Selective Fluorogenic Probe for Trivalent Cations. Chem. Commun. 2012, 48, 3000–3002. [Google Scholar] [CrossRef] [PubMed]
  7. Wang, J.; Li, Y.; Patel, N.G.; Zhang, G.; Zhou, D.; Pang, Y. A Single Molecular Probe for Multi-Analyte (Cr3+, Al3+ and Fe3+) Detection in Aqueous Medium and Its Biological Application. Chem. Commun. 2014, 50, 12258–12261. [Google Scholar] [CrossRef] [PubMed]
  8. Liang, J.; Qin, M.; Xu, R.; Gao, X.; Shen, Y.; Xu, Q.; Cao, Y.; Wang, W. A Genetically Encoded Copper (I) Sensor Based on Engineered Structural Distortion of EGFP. Chem. Commun. 2012, 48, 3890–3892. [Google Scholar] [CrossRef] [PubMed]
  9. Mostafa, M.S.; Bakr, A.-S.A.; El Naggar, A.M.A.; Sultan, E.-S.A. Water Decontamination via the Removal of Pb (II) Using a New Generation of Highly Energetic Surface Nano-Material: Co+2Mo+6 LDH. J. Colloid Interface Sci. 2016, 461, 261–272. [Google Scholar] [CrossRef]
  10. Briffa, J.; Sinagra, E.; Blundell, R. Heavy Metal Pollution in the Environment and Their Toxicological Effects on Humans. Heliyon 2020, 6, e04691. [Google Scholar] [CrossRef] [PubMed]
  11. Patrick, L. Lead Toxicity, a Review of the Literature. Part I: Exposure, Evaluation, and Treatment. Altern. Med. Rev. 2006, 11, 2. [Google Scholar] [PubMed]
  12. Lan, T.; Furuya, K.; Lu, Y. A Highly Selective Lead Sensor Based on a Classic Lead DNAzyme. Chem. Commun. 2010, 46, 3896–3898. [Google Scholar] [CrossRef] [PubMed]
  13. Salimi, F.; Kiani, M.; Karami, C.; Taher, M.A. Colorimetric Sensor of Detection of Cr (III) and Fe (II) Ions in Aqueous Solutions Using Gold Nanoparticles Modified with Methylene Blue. Optik 2018, 158, 813–825. [Google Scholar] [CrossRef]
  14. Ismail, M.; Khan, M.I.; Akhtar, K.; Khan, M.A.; Asiri, A.M.; Khan, S.B. Biosynthesis of Silver Nanoparticles: A Colorimetric Optical Sensor for Detection of Hexavalent Chromium and Ammonia in Aqueous Solution. Phys. E Low-Dimens. Syst. Nanostructures 2018, 103, 367–376. [Google Scholar] [CrossRef]
  15. Sang, F.; Li, X.; Zhang, Z.; Liu, J.; Chen, G. Recyclable Colorimetric Sensor of Cr3+ and Pb2+ Ions Simultaneously Using a Zwitterionic Amino Acid Modified Gold Nanoparticles. Spectrochim. Acta Part A Mol. Biomol. Spectrosc. 2018, 193, 109–116. [Google Scholar] [CrossRef]
  16. Xiao, S.; Chen, L.; Xiong, X.; Zhang, Q.; Feng, J.; Deng, S.; Zhou, L. A New Impedimetric Sensor Based on Anionic Intercalator for Detection of Lead Ions with Low Cost and High Sensitivity. J. Electroanal. Chem. 2018, 827, 175–180. [Google Scholar] [CrossRef]
  17. Bhatt, R.; Bhatt, R.; Padmaja, P. DTPA Capped Gold and Silver Nanofluids-Facile Synthesis and Their Application as Chromium Sensors. Sens. Actuators B Chem. 2018, 258, 602–611. [Google Scholar] [CrossRef]
  18. Sekar, A.; Yadav, R.; Basavaraj, N. Fluorescence Quenching Mechanism and the Application of Green Carbon Nanodots in the Detection of Heavy Metal Ions: A Review. New J. Chem. 2021, 45, 2326–2360. [Google Scholar] [CrossRef]
  19. Bhattu, M.; Verma, M.; Wani, A.A.; Bharatam, P.V.; Sareen, S.; Kathuria, D. Tuning of (E)-(4-Fluorophenyl)-1, 1-Diamino-2, 3-Diazabuta-1, 3-Diene Nanostructures for the Selective Detection of Imidacloprid. Environ. Res. 2023, 216, 114494. [Google Scholar] [CrossRef] [PubMed]
  20. Jiang, M.; Jin, X.; Lu, X.-Q.; Chen, Z. Adsorption of Pb (II), Cd (II), Ni (II) and Cu (II) onto Natural Kaolinite Clay. Desalination 2010, 252, 33–39. [Google Scholar] [CrossRef]
  21. Helal, A.; Nguyen, H.L.; Al-Ahmed, A.; Cordova, K.E.; Yamani, Z.H. An Ultrasensitive and Selective Metal–Organic Framework Chemosensor for Palladium Detection in Water. Inorg. Chem. 2019, 58, 1738–1741. [Google Scholar] [CrossRef]
  22. Chen, M.; Kutsanedzie, F.Y.H.; Cheng, W.; Li, H.; Chen, Q. Ratiometric Fluorescence Detection of Cd2+ and Pb2+ by Inner Filter-Based Upconversion Nanoparticle-Dithizone Nanosystem. Microchem. J. 2019, 144, 296–302. [Google Scholar] [CrossRef]
  23. Pankajakshan, A.; Kuznetsov, D.; Mandal, S. Ultrasensitive Detection of Hg (II) Ions in Aqueous Medium Using Zinc-Based Metal–Organic Framework. Inorg. Chem. 2019, 58, 1377–1381. [Google Scholar] [CrossRef] [PubMed]
  24. Raj, R.; Bhattu, M.; Verma, M.; Acevedo, R.; Duc, N.D.; Singh, J. Biogenic Silver Based Nanostructures: Synthesis, Mechanistic Approach and Biological Applications. Environ. Res. 2023, 231, 116045. [Google Scholar] [CrossRef]
  25. Bhattu, M.; Singh, J. Recent Advances in Nanomaterials Based Sustainable Approaches for Mitigation of Emerging Organic Pollutants. Chemosphere 2023, 321, 138072. [Google Scholar] [CrossRef] [PubMed]
  26. Soni, H.; Bhattu, M.; Priya, S.D.; Kaur, M.; Verma, M.; Singh, J. Recent Advances in Waste-Derived Carbon Dots and Their Nanocomposites for Environmental Remediation and Biological Applications. Environ. Res. 2024, 251, 118560. [Google Scholar] [CrossRef] [PubMed]
  27. Guo, J.; Li, H.; Ling, L.; Li, G.; Cheng, R.; Lu, X.; Xie, A.-Q.; Li, Q.; Wang, C.-F.; Chen, S. Green Synthesis of Carbon Dots toward Anti-Counterfeiting. ACS Sustain. Chem. Eng. 2019, 8, 1566–1572. [Google Scholar] [CrossRef]
  28. Monje, D.S.; Chacon, K.M.; Galindo, I.C.; Castaño, C.; Ballesteros-Rueda, L.M.; Valencia, G.C.; Gonzalez, M.C.; Mercado, D.F. Carbon Dots from Agroindustrial Residues: A Critical Comparison of the Effect of Physicochemical Properties on Their Performance as Photocatalyst and Emulsion Stabilizer. Mater. Today Chem. 2021, 20, 100445. [Google Scholar] [CrossRef]
  29. Manjubaashini, N.; Bargavi, P.; Balakumar, S. Carbon Quantum Dots Derived from Agro Waste Biomass for Pioneering Bioanalysis and in Vivo Bioimaging. J. Photochem. Photobiol. A Chem. 2024, 454, 115702. [Google Scholar] [CrossRef]
  30. Wu, F.; Zhang, R.; Zhou, J. Shrimp-Shell-Derived Carbon Dots for Quantitative Detection by Fluorometry and Colorimetry: A New Analytic Chemistry Experiment for University Education. J. Chem. Educ. 2024, 101, 2784–2789. [Google Scholar] [CrossRef]
  31. Kumar, M.; Chinnathambi, S.; Bakhori, N.; Abu, N.; Etezadi, F.; Thangavel, V.; Packwood, D.; Sivaniah, E.; Pandian, G.N. Biomass-Derived Carbon Dots as Fluorescent Quantum Probes to Visualize and Modulate Inflammation. Sci. Rep. 2024, 14, 12665. [Google Scholar] [CrossRef]
  32. Singh, J.; Bhattu, M.; Verma, M. Rice Straw Derived Mesoporous Biochar for the Removal of Coomassie Brilliant Blue Dye. Top. Catal. 2024, 1–10. [Google Scholar] [CrossRef]
  33. Zhao, B.; Tan, Z. Fluorescent Carbon Dots: Fantastic Electroluminescent Materials for Light-emitting Diodes. Adv. Sci. 2021, 8, 2001977. [Google Scholar] [CrossRef]
  34. Limosani, F.; Bauer, E.M.; Cecchetti, D.; Biagioni, S.; Orlando, V.; Pizzoferrato, R.; Prosposito, P.; Carbone, M. Top-down n-Doped Carbon Quantum Dots for Multiple Purposes: Heavy Metal Detection and Intracellular Fluorescence. Nanomaterials 2021, 11, 2249. [Google Scholar] [CrossRef] [PubMed]
  35. Shabbir, H.; Csapó, E.; Wojnicki, M. Carbon Quantum Dots: The Role of Surface Functional Groups and Proposed Mechanisms for Metal Ion Sensing. Inorganics 2023, 11, 262. [Google Scholar] [CrossRef]
  36. Ren, J.; Weber, F.; Weigert, F.; Wang, Y.; Choudhury, S.; Xiao, J.; Lauermann, I.; Resch-Genger, U.; Bande, A.; Petit, T. Influence of Surface Chemistry on Optical, Chemical and Electronic Properties of Blue Luminescent Carbon Dots. Nanoscale 2019, 11, 2056–2064. [Google Scholar] [CrossRef] [PubMed]
  37. van Dam, B.; Nie, H.; Ju, B.; Marino, E.; Paulusse, J.M.J.; Schall, P.; Li, M.; Dohnalová, K. Excitation-Dependent Photoluminescence from Single-Carbon Dots. Small 2017, 13, 1702098. [Google Scholar] [CrossRef] [PubMed]
  38. Papaioannou, N.; Titirici, M.M.; Sapelkin, A. Investigating the Effect of Reaction Time on Carbon Dot Formation, Structure, and Optical Properties. ACS Omega 2019, 4, 21658–21665. [Google Scholar] [CrossRef]
  39. Issa, M.A.; Abidin, Z.Z.; Sobri, S.; Rashid, S.; Mahdi, M.A.; Ibrahim, N.A.; Pudza, M.Y. Facile Synthesis of Nitrogen-Doped Carbon Dots from Lignocellulosic Waste. Nanomaterials 2019, 9, 1500. [Google Scholar] [CrossRef] [PubMed]
  40. Jiang, Z.; Krysmann, M.J.; Kelarakis, A.; Koutnik, P.; Anzenbacher, P.; Roland, P.J.; Ellingson, R.; Sun, L. Understanding the Photoluminescence Mechanism of Carbon Dots. MRS Adv. 2017, 2, 2927–2934. [Google Scholar] [CrossRef]
  41. Yang, M.; Li, H.; Liu, J.; Kong, W.; Zhao, S.; Li, C.; Huang, H.; Liu, Y.; Kang, Z. Convenient and Sensitive Detection of Norfloxacin with Fluorescent Carbon Dots. J. Mater. Chem. B 2014, 2, 7964–7970. [Google Scholar] [CrossRef] [PubMed]
  42. De, B.; Karak, N. A Green and Facile Approach for the Synthesis of Water Soluble Fluorescent Carbon Dots from Banana Juice. Rsc Adv. 2013, 3, 8286–8290. [Google Scholar] [CrossRef]
  43. Xu, Y.; Wu, M.; Liu, Y.; Feng, X.; Yin, X.; He, X.; Zhang, Y. Nitrogen-doped Carbon Dots: A Facile and General Preparation Method, Photoluminescence Investigation, and Imaging Applications. Chem. –A Eur. J. 2013, 19, 2276–2283. [Google Scholar] [CrossRef]
  44. Hou, Y.; Lu, Q.; Deng, J.; Li, H.; Zhang, Y. One-Pot Electrochemical Synthesis of Functionalized Fluorescent Carbon Dots and Their Selective Sensing for Mercury Ion. Anal. Chim. Acta 2015, 866, 69–74. [Google Scholar] [CrossRef]
  45. Li, T.; Dong, S.; Wang, E. A Lead (II)-Driven DNA Molecular Device for Turn-on Fluorescence Detection of Lead (II) Ion with High Selectivity and Sensitivity. J. Am. Chem. Soc. 2010, 132, 13156–13157. [Google Scholar] [CrossRef]
  46. Li, C.-L.; Liu, K.-T.; Lin, Y.-W.; Chang, H.-T. Fluorescence Detection of Lead (II) Ions through Their Induced Catalytic Activity of DNAzymes. Anal. Chem. 2011, 83, 225–230. [Google Scholar] [CrossRef]
  47. Wang, H.; Yang, L.; Chu, S.; Liu, B.; Zhang, Q.; Zou, L.; Yu, S.; Jiang, C. Semiquantitative Visual Detection of Lead Ions with a Smartphone via a Colorimetric Paper-Based Analytical Device. Anal. Chem. 2019, 91, 9292–9299. [Google Scholar] [CrossRef] [PubMed]
  48. Zhang, Z.; Huang, Z.; Qin, D.; Liu, D.; Guo, X.; Lin, H. Fluorescent Starch-Based Hydrogel with Cellulose Nanofibrils and Carbon Dots for Simultaneous Adsorption and Detection of Pb (II). Carbohydr. Polym. 2024, 323, 121427. [Google Scholar] [CrossRef]
  49. Mandal, A.; Karmakar, A.; Varanasi, S. “Turn ON–OFF” Detection of Lead Using Moringa Oleifera Gum-Derived Cyan-Emissive Carbon Dots Integrated with a Smartphone-Assisted Sensing Platform. Chem. Pap. 2024, 78, 2493–2507. [Google Scholar] [CrossRef]
  50. Okolo, B.I.; Oke, E.O.; Agu, C.M.; Adeyi, O.; Nwoso-Obieogu, K.; Akatobi, K.N. Adsorption of Lead (II) from Aqueous Solution Using Africa Elemi Seed, Mucuna Shell and Oyster Shell as Adsorbents and Optimization Using Box–Behnken Design. Appl. Water Sci. 2020, 10, 201. [Google Scholar] [CrossRef]
  51. Filipović, K.; Petrović, M.; Najdanović, S.; Velinov, N.; Hurt, A.; Bojić, A.; Kostić, M. Highly Efficient Nano Sorbent as a Superior Material for the Purification of Wastewater Contaminated with Anthraquinone Dye RB19. J. Water Process Eng. 2024, 67, 106118. [Google Scholar] [CrossRef]
  52. Karnib, M.; Kabbani, A.; Holail, H.; Olama, Z. Heavy Metals Removal Using Activated Carbon, Silica and Silica Activated Carbon Composite. Energy Procedia 2014, 50, 113–120. [Google Scholar] [CrossRef]
  53. Novoseltseva, V.; Yankovych, H.; Kovalenko, O.; Václavíková, M.; Melnyk, I. Production of High-Performance Lead (II) Ions Adsorbents from Pea Peels Waste as a Sustainable Resource. Waste Manag. Res. 2021, 39, 584–593. [Google Scholar] [CrossRef] [PubMed]
  54. Qu, Y.; Zhang, C.; Li, F.; Bo, X.; Liu, G.; Zhou, Q. Equilibrium and Kinetics Study on the Adsorption of Perfluorooctanoic Acid from Aqueous Solution onto Powdered Activated Carbon. J. Hazard. Mater. 2009, 169, 146–152. [Google Scholar] [CrossRef]
  55. Fagbayigbo, B.O.; Opeolu, B.O.; Fatoki, O.S.; Akenga, T.A.; Olatunji, O.S. Removal of PFOA and PFOS from Aqueous Solutions Using Activated Carbon Produced from Vitis Vinifera Leaf Litter. Environ. Sci. Pollut. Res. 2017, 24, 13107–13120. [Google Scholar] [CrossRef]
  56. Yang, Y.; Ding, Q.; Yang, M.; Wang, Y.; Liu, N.; Zhang, X. Magnetic Ion Exchange Resin for Effective Removal of Perfluorooctanoate from Water: Study of a Response Surface Methodology and Adsorption Performances. Environ. Sci. Pollut. Res. 2018, 25, 29267–29278. [Google Scholar] [CrossRef] [PubMed]
  57. Tian, D.; Geng, D.; Mehler, W.T.; Goss, G.; Wang, T.; Yang, S.; Niu, Y.; Zheng, Y.; Zhang, Y. Removal of Perfluorooctanoic Acid (PFOA) from Aqueous Solution by Amino-Functionalized Graphene Oxide (AGO) Aerogels: Influencing Factors, Kinetics, Isotherms, and Thermodynamic Studies. Sci. Total Environ. 2021, 783, 147041. [Google Scholar] [CrossRef] [PubMed]
Figure 1. Stepwise process of biochar and carbon dots synthesis.
Nanomaterials 15 00066 g001
Figure 2. Morphological and elemental analysis of Biochar: (a,b) SEM images, (c) EDX analysis spectrum, (d) XRD pattern.
Nanomaterials 15 00066 g002
Figure 3. (a) N2 adsorption–desorption isotherm of biochar; (b) BET curve illustrating the surface area and monolayer volume of biochar.
Nanomaterials 15 00066 g003
Figure 4. Microscopic and surface chemistry analysis of R-CDs: (a,b) TEM images of R-CDs illustrating the spherical-shaped R-CDs, (c) Size distribution histogram illustrating the average size of R-CDs from 8–10 nm, and (d) FTIR spectra to explore the surface functionality.
Nanomaterials 15 00066 g004
Figure 5. (a) Absorption spectra of R-CDs; (b) fluorescence spectra of synthesized R-CDs exhibiting an emission band at 430 nm; (c) Excitation-dependent emissive fluorescence profile of R-CDs exhibiting a red shift in λem; (d) Screening of R-CDs against various heavy metals illustrating a high quench in the presence of Pb2+ and the other metal ions do not exhibit any effect on the fluorescence behaviour of CDs.
Nanomaterials 15 00066 g005
Figure 6. (a) Declination in fluorescence spectra of R-CDs on titration with Pb2+ (1 µM–100 µM); (b) Linear decreasing response of R-CDs towards the subsequential increase in the Pb2+ over 1 µM–100 µM; (c) Stern Volmer Plot of R-CDs towards the detection of Pb2+; (d) Interference studies of other potential competing ions for R-CDs towards Pb2+.
Nanomaterials 15 00066 g006
Figure 7. Illustration of the chelation between R-CDs and Pb2+ via the formation of coordination bonds between the lone pairs present on the surface functional groups with the electron-deficient Pb2+.
Nanomaterials 15 00066 g007
Figure 8. Point of zero charge study for R-BC.
Nanomaterials 15 00066 g008
Figure 9. (a) Illustration of decrease in Pb2+ concentration with time on the addition of biochar-BC; (b,c) Trend in Pb2+ removal efficiency with time.
Nanomaterials 15 00066 g009
Figure 10. (a) Illustration of decrease in Pb2+ concentration with time on the addition of R-BC; (b) Graphical representation for Langmuir adsorption isotherm, Freundlich adsorption isotherm, Temkin isotherm model, DR Adsorption model, and Sips isotherm model.
Nanomaterials 15 00066 g010
Figure 11. Graphical representation for PFOM (a), PSOM (b), Intraparticle diffusion model (c), and Elovich model (d).
Nanomaterials 15 00066 g011
Table 2. Different isotherm models for adsorbent.
Sr. No.ModelsEquationsParameters
1.Langmuir q e = q m   *   K L   *   C e 1 + K L   *   C e qe = amount of adsorbate per mass of adsorbent in equilibrium (mg/g),
qm = adsorption capacity in monolayer (mg/g)
KL = constant of the Langmuir model related to the binding energy.
2.Freundlich q e = K f     C e 1 n Kf = Freundlich capacity constant
1/n = Freundlich intensity
3.Temkin Isotherm Model q e = R T b T ln ( K T   *   C e ) T = reaction temperature in Kelvin (K),
R = gas constant
b = Temkin constant
4.Dubinin–Radushkevich Isotherm Model q e = q m e x p K ( R T l n ( 1 + 1 + 1 C e ) 2 T = reaction temperature (K)
R = gas constant
K = D–R constant
qm = maximal adsorption capacity
5.Sips Isotherm model q e = q m ( K   *   C e n ) / (   1 + K   *   C e n ) K = Sips Constant
Table 3. Determination of constant values for isotherms.
Sr. No.IsothermsDetermination Constants
1.Langmuirqm KLRLR2
1830.012950.7942811760.9909
2.Freundlich1/nKfR2
2.166.410.81
3.TemkinBTATR2
147.820.630.9
4.Dubinin–Radushkevich qmKDRR2
241.611.310.98
5.Sips modelqmKsR2
440.2824.090.94
Table 4. Different Kinetic models for adsorbent.
Sr. No.ModelsEquationsParameters
1.PFOM l o g q e q t = l o g q e k 1 2.303 t qe (mg/g) and qt (mg/g) = quantity of Pb2+ adsorbed initially and at time t;
k1 (L/min) = PFO rate constant.
2.PSOM t q t = 1 k 2 q e 2 + t q e qe (mg/g) = quantity of Pb2+ adsorbed at equilibrium;
k2 (g/mgmin) = PSO rate constant.
3.Intraparticle diffusion model q t = K i p t 0.5 + C Kip = intraparticle diffusion apparent adsorption rate constant
C = intraparticle diffusion model constant
4.Elovich model q t = 1 b ( ln t + ln a b ) a = primary rate of adsorption
b = desorption constant during each experiment
Table 5. Correlation constants for kinetic models.
Sr. No.Kinetics ModelParameters
1.PFOMK1 (gmg−1 min−1)R2MRD (%)
0.02570.937.57
2.PSOMK2 (gmg−1 min−1)R2MRD (%)
0.0000470.982.77
3.Intraparticle diffusion modelKipR2MRD (%)
13.290.8927.23
4.Elovich modelbR2MRD (%)
0.0120.9021.53
Table 6. Real sample analysis using the synthesized sensor.
Real SampleConcentration of Pb2+ (µM)Recovery of Pb2+ (µM)Recovery of Pb2+ (%)
River Water0.110.10797.27
10.9898
109.898
Tap Water0.110.10595.45
10.9696
109.797
RO Water0.110.10797.27
10.9999
109.75397.53
Disclaimer/Publisher’s Note: The statements, opinions and data contained in all publications are solely those of the individual author(s) and contributor(s) and not of MDPI and/or the editor(s). MDPI and/or the editor(s) disclaim responsibility for any injury to people or property resulting from any ideas, methods, instructions or products referred to in the content.

