
Physiochemical and Electrochemical Properties of a Heat-Treated Electrode for All-Iron Redox Flow Batteries


Abstract
1. Introduction
2. Materials and Methods
2.1. Heat Treatment of GFs
2.2. Electrolyte Preparation and Cell Formation
2.3. Characterization of Electrodes
2.4. Electrochemical Test
3. Results and Discussion
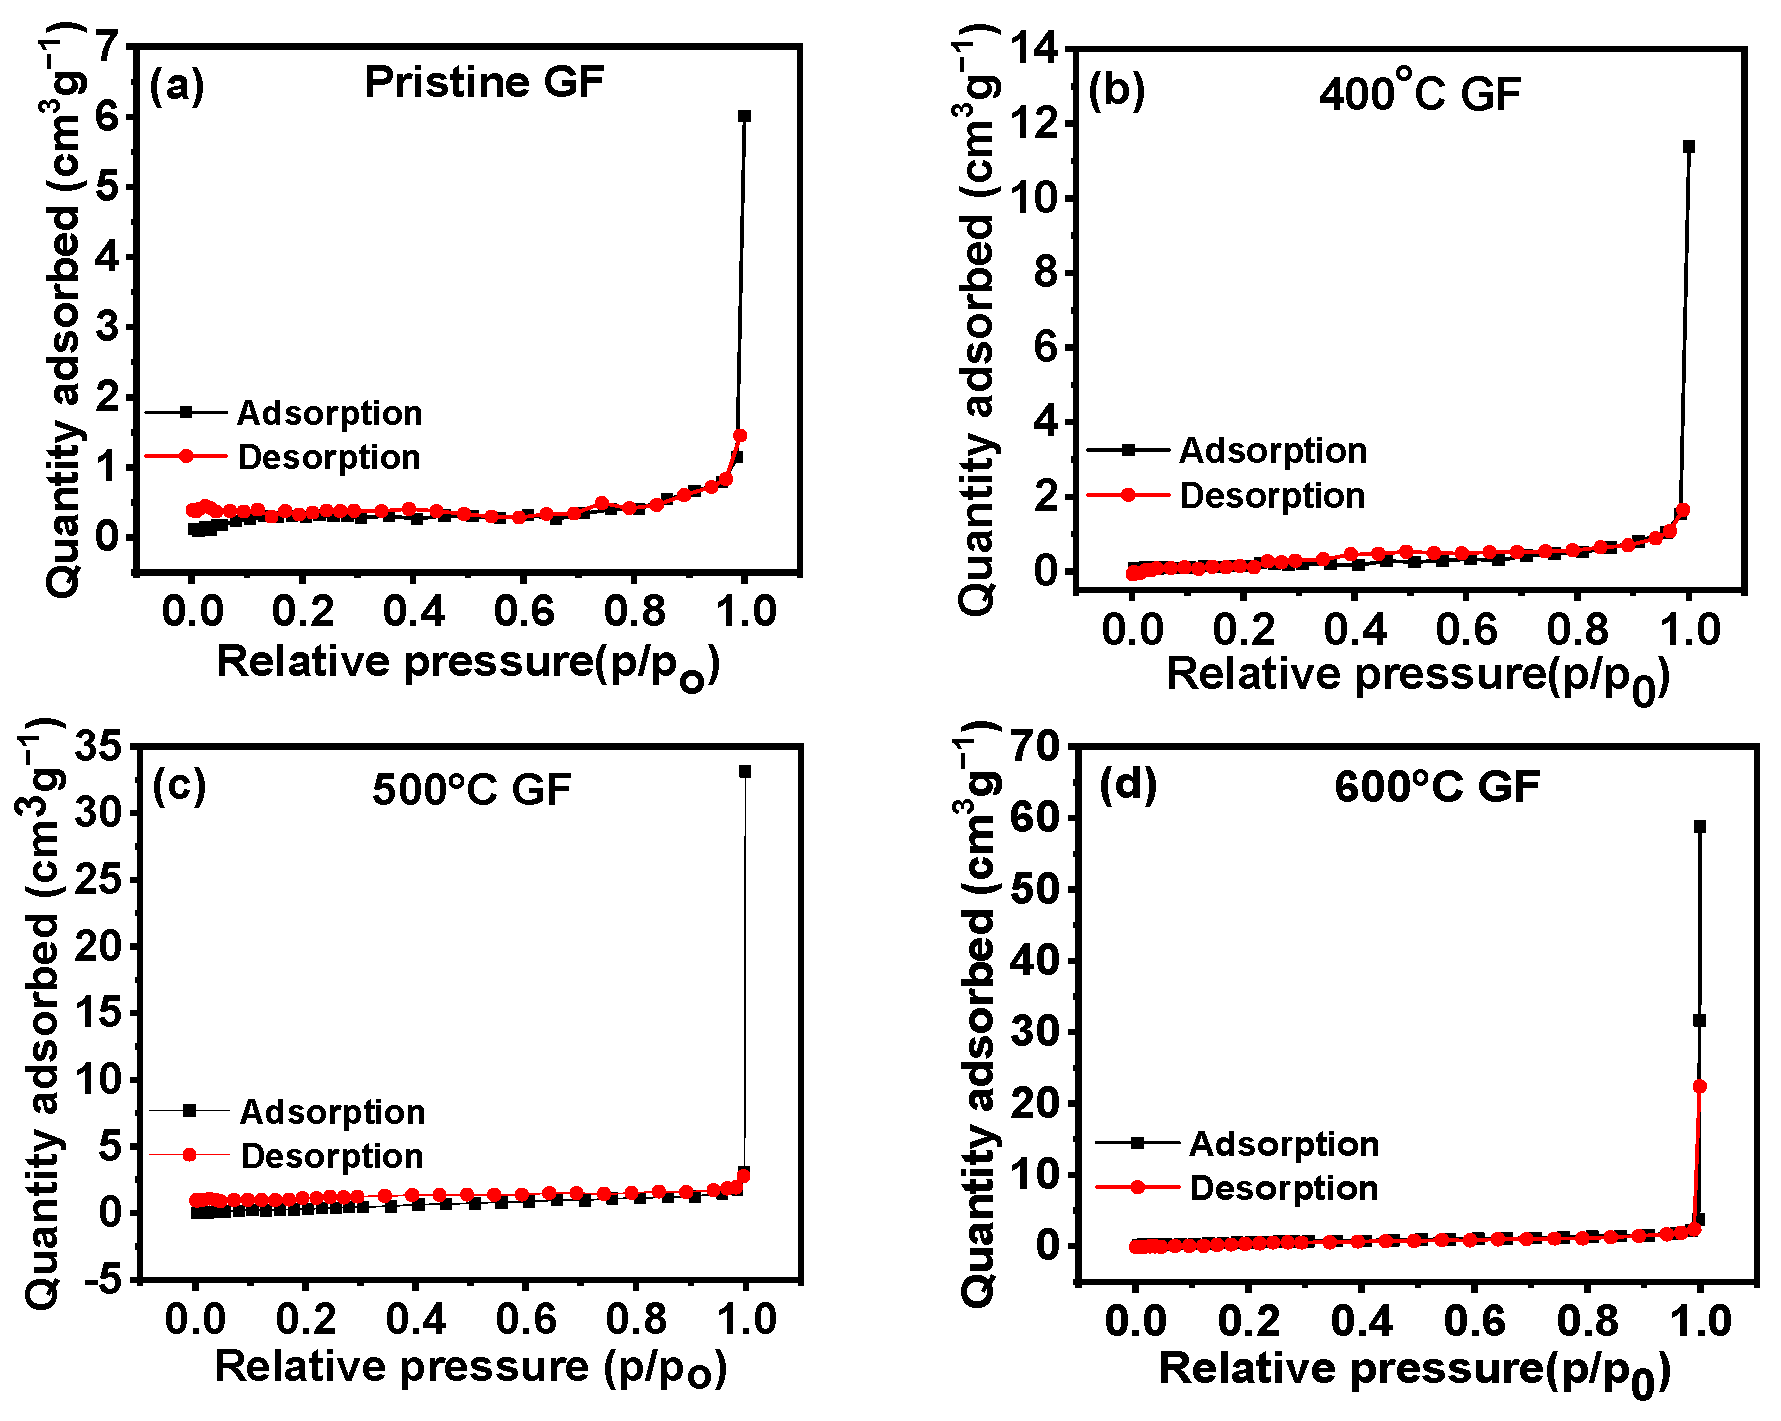
3.1. Structural and Morphological Characterizations
3.2. Electrochemical Characterizations
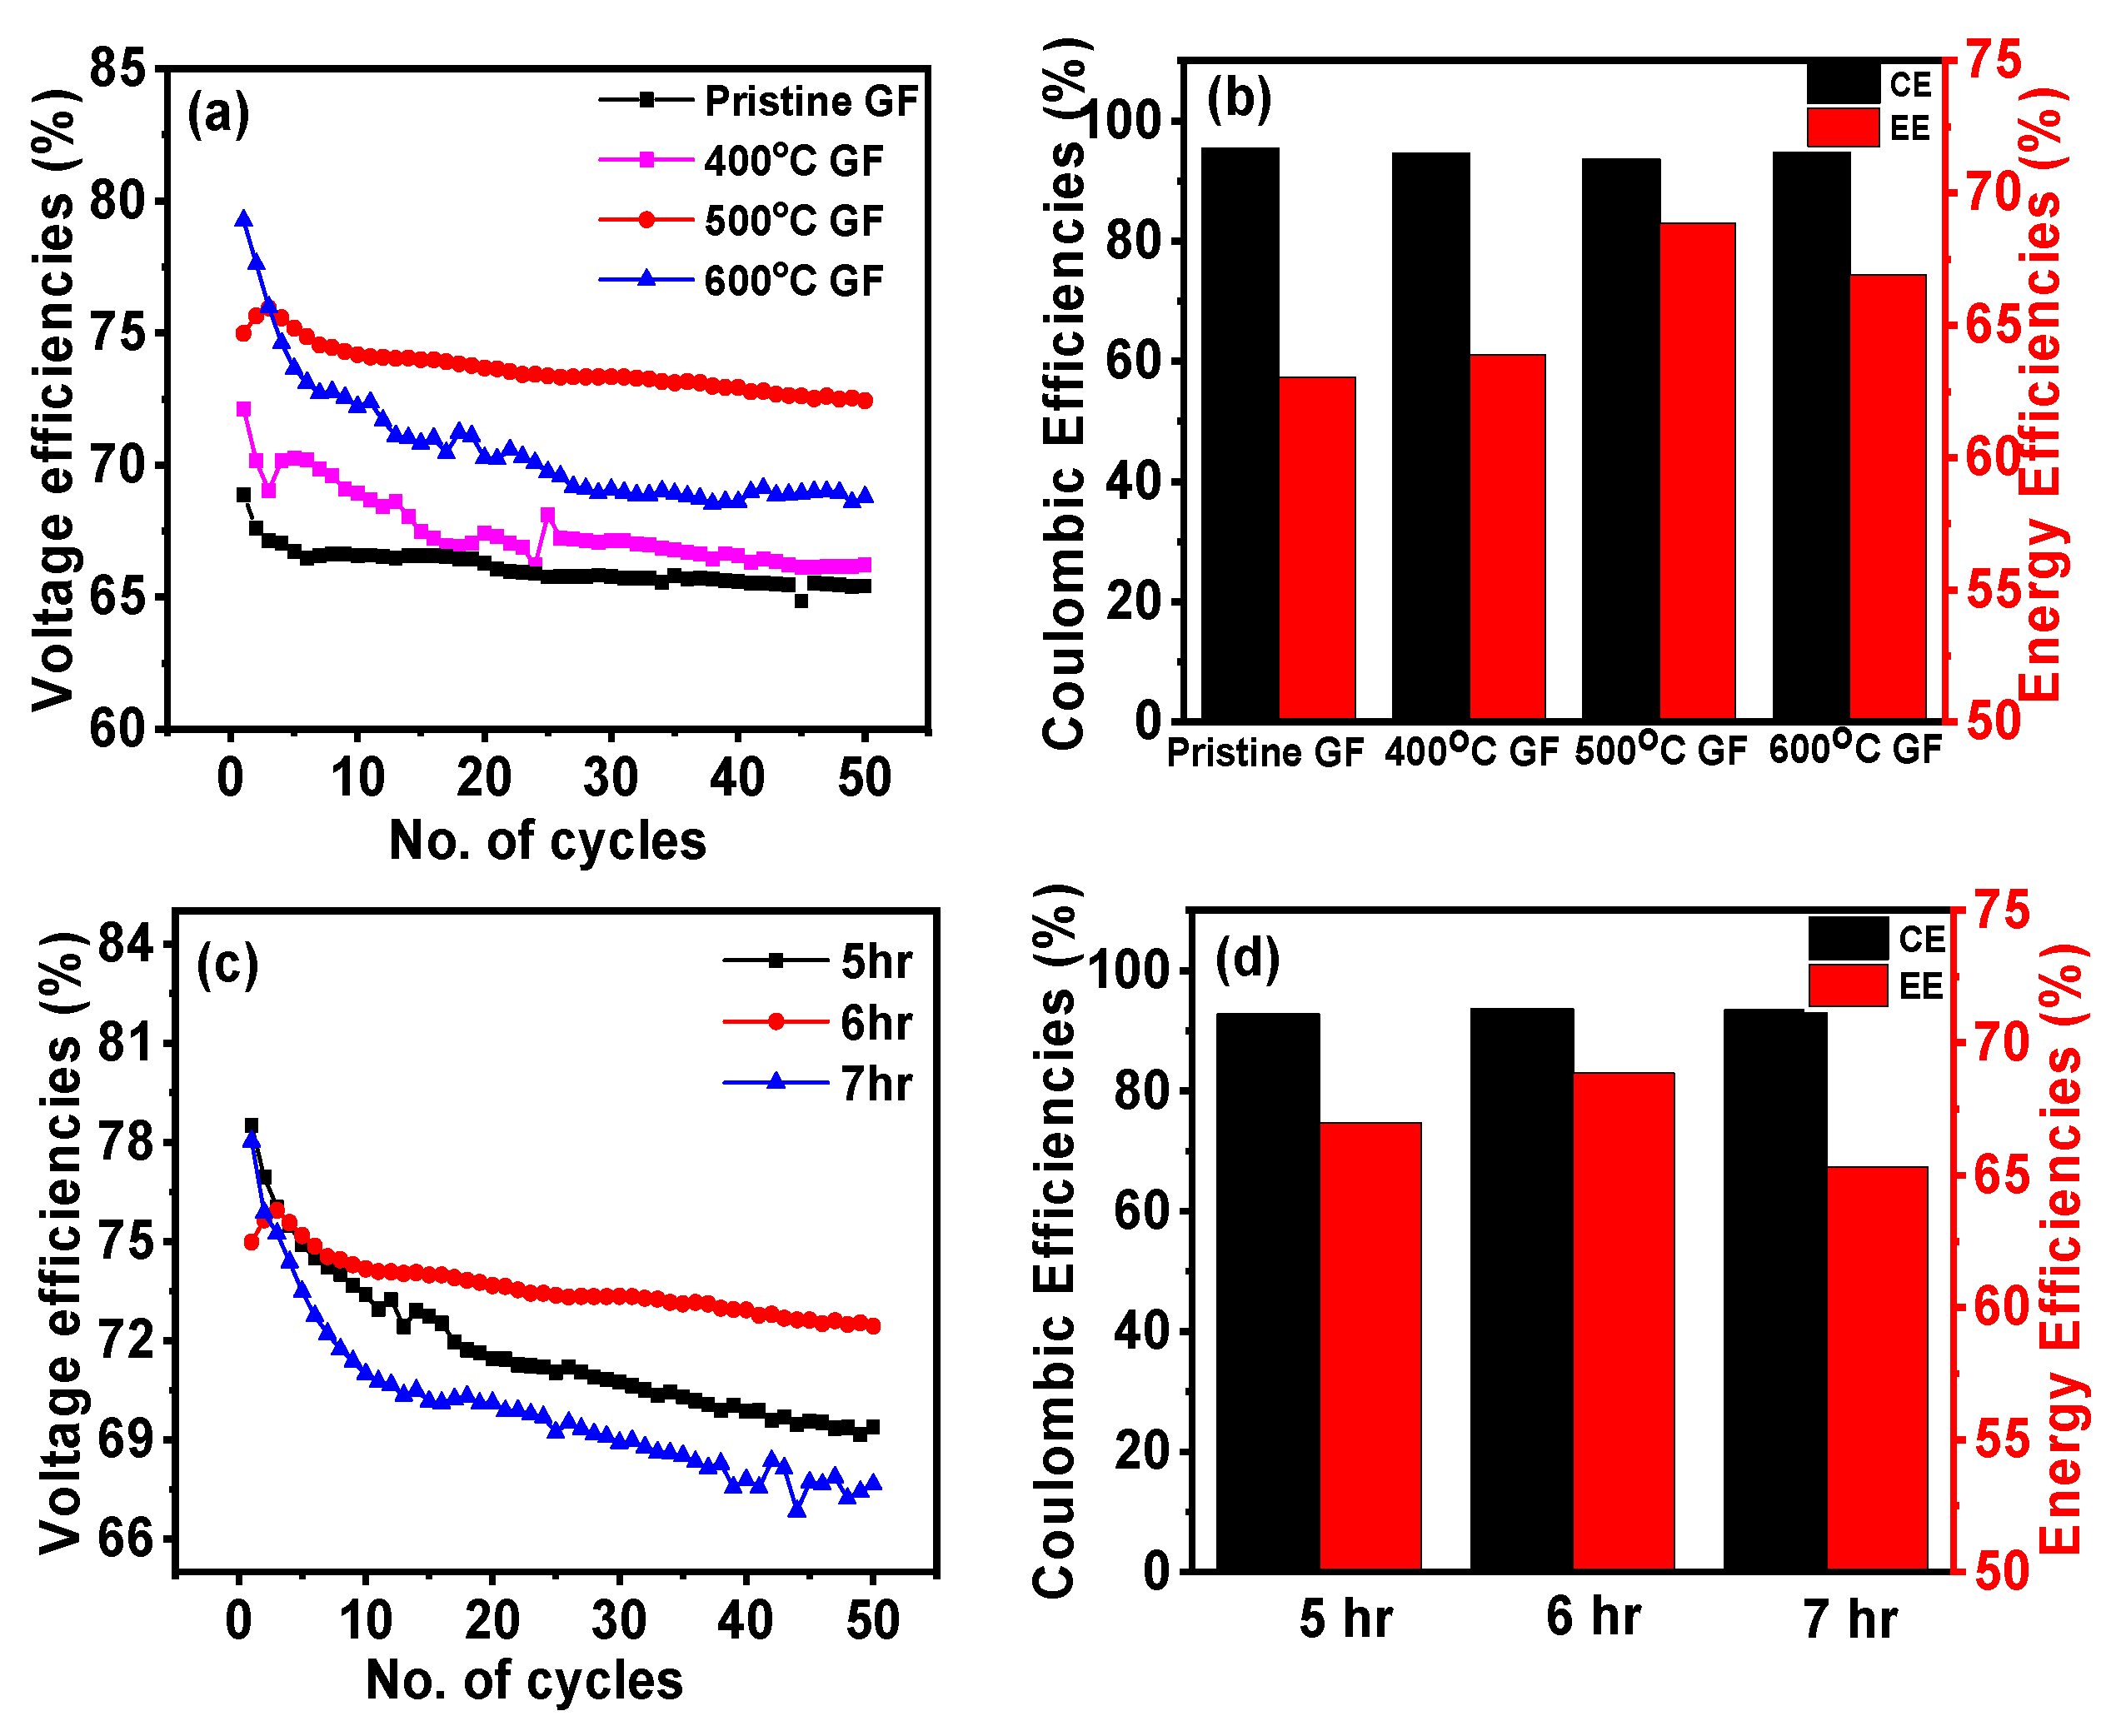
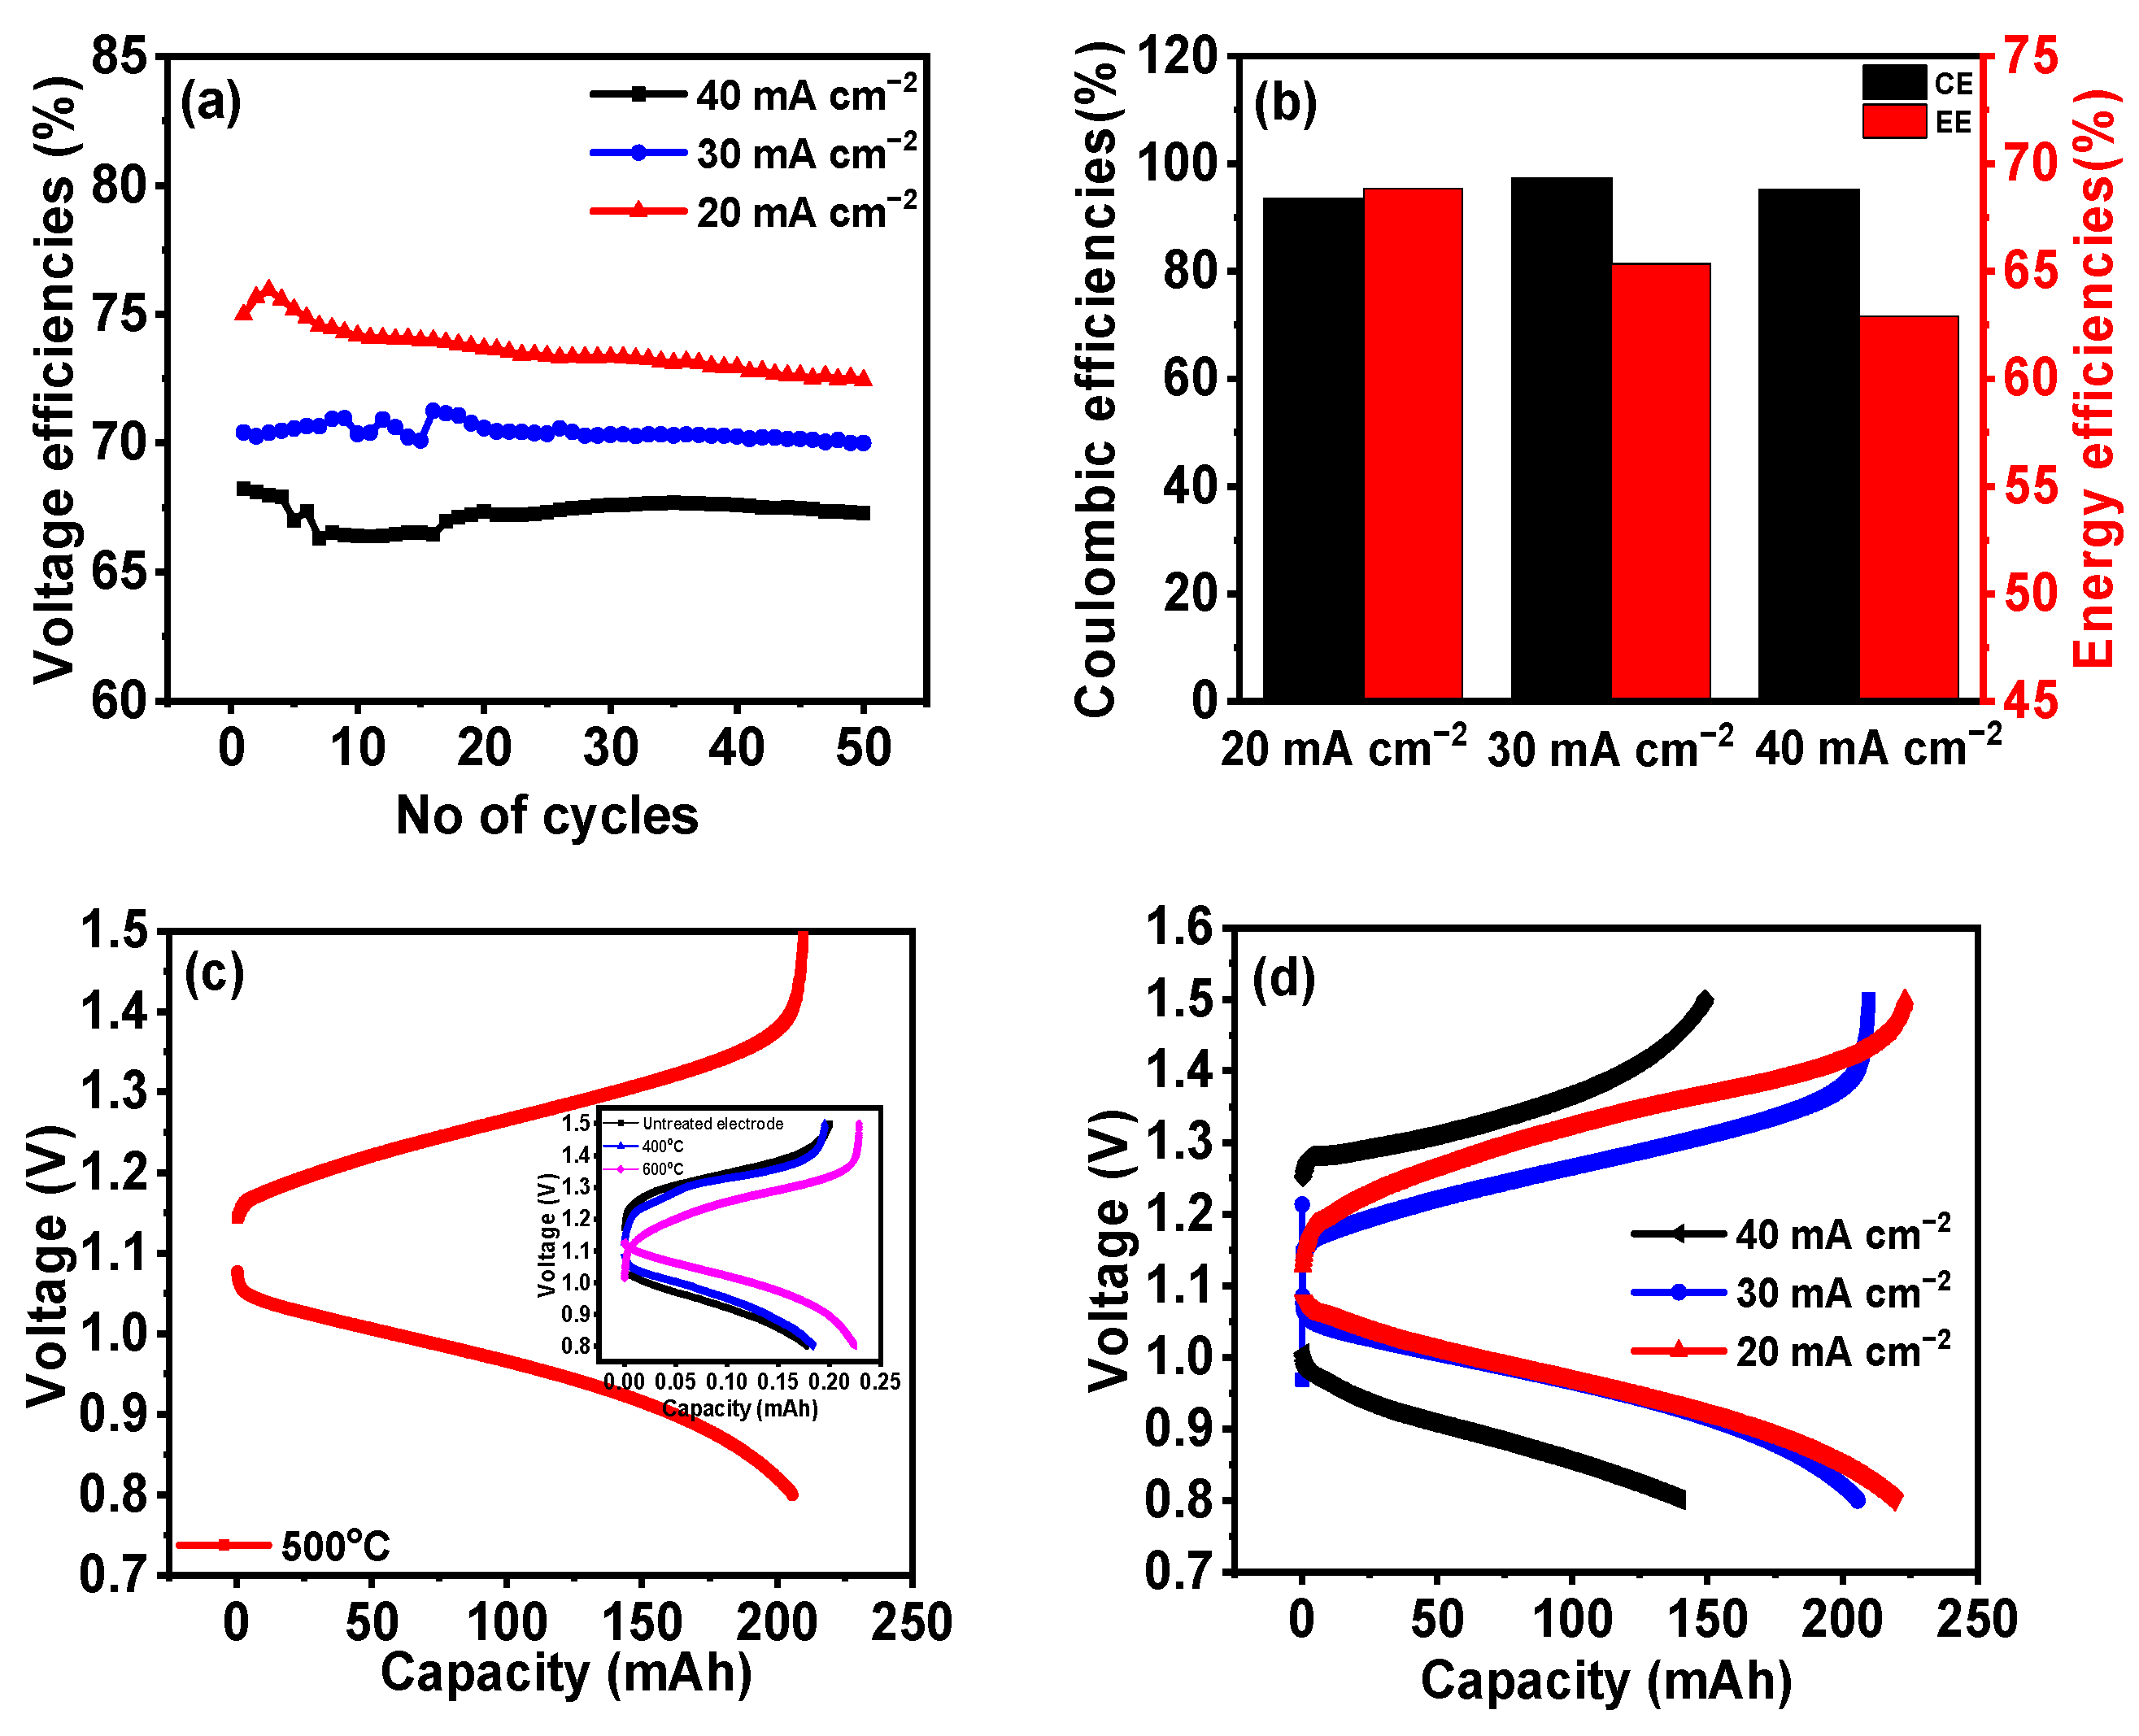
3.3. Battery Performance
4. Conclusions
Supplementary Materials
Author Contributions
Funding
Data Availability Statement
Conflicts of Interest
References
- Martins, F.; Felgueiras, C.; Smitkova, M.; Caetano, N. Analysis of fossil fuel energy consumption and environmental impacts in European countries. Energies 2019, 12, 964. [Google Scholar] [CrossRef]
- Sayed, E.T.; Olabi, A.G.; Alami, A.H.; Radwan, A.; Mdallal, A.; Rezk, A.; Abdelkareem, M.A. Renewable energy and energy storage systems. Energies 2023, 16, 1415. [Google Scholar] [CrossRef]
- Vasudevan, S.; Manickam, M.; Sivasubramanian, R. A sol–gel derived LaCoO3 perovskite as an electrocatalyst for Al–air batteries. Dalton Trans. 2024, 53, 3713–3721. [Google Scholar] [CrossRef] [PubMed]
- Doetsch, C.; Pohlig, A. The use of flow batteries in storing electricity for national grids. In Future Energy; Elsevier: Amsterdam, The Netherlands, 2020; pp. 263–277. [Google Scholar]
- Leung, P.; Li, X.; Ponce de León, C.; Berlouis, L.; Low, C.T.J.; Walsh, F.C. Progress in redox flow batteries, remaining challenges and their applications in energy storage. RSC Adv. 2012, 2, 10125–10156. [Google Scholar] [CrossRef]
- Wang, W.; Luo, Q.; Li, B.; Wei, X.; Li, L.; Yang, Z. Recent progress in redox flow battery research and development. Adv. Funct. Mater. 2013, 23, 970–986. [Google Scholar] [CrossRef]
- Weber, A.Z.; Mench, M.M.; Meyers, J.P.; Ross, P.N.; Gostick, J.T.; Liu, Q. Redox flow batteries: A review. J. Appl. Electrochem. 2011, 41, 1137–1164. [Google Scholar] [CrossRef]
- Zhang, H.; Sun, C.; Ge, M. Review of the research status of cost-effective zinc–iron redox flow batteries. Batteries 2022, 8, 202. [Google Scholar] [CrossRef]
- Puleston, T.; Clemente, A.; Costa-Castelló, R.; Serra, M. Modelling and estimation of vanadium redox flow batteries: A review. Batteries 2022, 8, 121. [Google Scholar] [CrossRef]
- Yufit, V.; Hale, B.; Matian, M.; Mazur, P.; Brandon, N.P. Development of a regenerative hydrogen-vanadium fuel cell for energy storage applications. J. Electrochem. Soc. 2013, 160, A856–A861. [Google Scholar] [CrossRef]
- Sankaralingam, R.K.; Seshadri, S.; Sunarso, J.; Bhatt, A.I.; Kapoor, A. Overview of the factors affecting the performance of vanadium redox flow batteries. J. Energy Storage 2021, 41, 102857. [Google Scholar] [CrossRef]
- Dinesh, A.; Olivera, S.; Venkatesh, K.; Santosh, M.S.; Priya, M.G.; Inamuddin; Asiri, A.M.; Muralidhara, H.B. Iron-based flow batteries to store renewable energies. Environ. Chem. Lett. 2018, 16, 683–694. [Google Scholar] [CrossRef]
- Gong, K.; Xu, F.; Grunewald, J.B.; Ma, X.; Zhao, Y.; Gu, S.; Yan, Y. All-soluble all-iron aqueous redox-flow battery. ACS Energy Lett. 2016, 1, 89–93. [Google Scholar] [CrossRef]
- Jayathilake, B.S.; Plichta, E.J.; Hendrickson, M.A.; Narayanan, S.R. Improvements to the coulombic efficiency of the iron electrode for an all-iron redox-flow battery. J. Electrochem. Soc. 2018, 165, A1630. [Google Scholar] [CrossRef]
- Chang, C.-H.; Chou, H.-W.; Hsu, N.-Y.; Chen, Y.-S. Development of integrally molded bipolar plates for all-vanadium redox flow Batteries. Energies 2016, 9, 350. [Google Scholar] [CrossRef]
- Hsieh, C.-L.; Tsai, P.-H.; Hsu, N.-Y.; Chen, Y.-S. Effect of compression ratio of graphite felts on the performance of an all-vanadium redox flow battery. Energies 2019, 12, 313. [Google Scholar] [CrossRef]
- Li, R.; Sato, Y. Recent development of carbon-based electrode for vanadium redox flow battery. Electrochemistry 2020, 88, 344–346. [Google Scholar] [CrossRef]
- Faggiano, L.; Lacarbonara, G.; Badenhorst, W.D.; Murtomäki, L.; Sanz, L.; Arbizzani, C. Short thermal treatment of carbon felts for copper-based redox flow batteries. J. Power Sources 2022, 520, 230846. [Google Scholar] [CrossRef]
- Sun, B.; Skyllas-Kazacos, M. Chemical modification of graphite electrode materials for vanadium redox flow battery application—Part II. Acid treatments. Electrochim. Acta 1992, 37, 2459–2465. [Google Scholar] [CrossRef]
- Huang, P.; Ling, W.; Sheng, H.; Zhou, Y.; Wu, X.; Zeng, X.-X.; Wu, X.; Guo, Y.-G. Heteroatom-doped electrodes for all-vanadium redox flow batteries with ultralong lifespan. J. Mater. Chem. A 2018, 6, 41–44. [Google Scholar] [CrossRef]
- Chen, N.; Zhang, H.; Luo, X.-D.; Sun, C.-Y. SiO2-decorated graphite felt electrode by silicic acid etching for iron-chromium redox flow battery. Electrochim. Acta 2020, 336, 135646. [Google Scholar] [CrossRef]
- Pezeshki, A.M.; Clement, J.T.; Veith, G.M.; Zawodzinski, T.A.; Mench, M.M. High performance electrodes in vanadium redox flow batteries through oxygen-enriched thermal activation. J. Power Sources 2015, 294, 333–338. [Google Scholar] [CrossRef]
- Eifert, L.; Banerjee, R.; Jusys, Z.; Zeis, R. Characterization of carbon felt electrodes for vanadium redox flow batteries: Impact of treatment methods. J. Electrochem. Soc. 2018, 165, A2577. [Google Scholar] [CrossRef]
- Wu, X.; Xu, H.; Xu, P.; Shen, Y.; Lu, L.; Shi, J.; Fu, J.; Zhao, H. Microwave-treated graphite felt as the positive electrode for all-vanadium redox flow battery. J. Power Sources 2014, 263, 104–109. [Google Scholar] [CrossRef]
- Lim, H.; Shin, M.; Noh, C.; Koo, E.; Kwon, Y.; Chung, K.Y. Performance evaluation of aqueous all iron redox flow batteries using heat treated graphite felt electrode. Korean J. Chem. Eng. 2022, 39, 3146–3154. [Google Scholar] [CrossRef]
- Paton-Carrero, A.; Valverde, J.; García-Alvarez, E.; Lavin-Lopez, P.; Romero, A. Influence of the oxidizing agent in the synthesis of graphite oxide. J. Mater. Sci. 2020, 55, 2333–2342. [Google Scholar] [CrossRef]
- Wang, Y.-H.; Hung, I.-M.; Wu, C.-Y. V2O5-activated graphite felt with enhanced activity for vanadium redox flow battery. Catalysts 2021, 11, 800. [Google Scholar] [CrossRef]
- Liu, T.; Wang, K.; Chen, Y.; Zhao, S.; Han, Y. Dominant role of wettability in improving the specific capacitance. Green Energy Environ. 2019, 4, 171–179. [Google Scholar] [CrossRef]
- Park, S.; Kim, H. Fabrication of nitrogen-doped graphite felts as positive electrodes using polypyrrole as a coating agent in vanadium redox flow batteries. J. Mater. Chem. A 2015, 3, 12276–12283. [Google Scholar] [CrossRef]
- Zhang, H.; Chen, N.; Sun, C.; Luo, X. Investigations on physicochemical properties and electrochemical performance of graphite felt and carbon felt for iron-chromium redox flow battery. Int. J. Energy Res. 2020, 44, 3839–3853. [Google Scholar] [CrossRef]
- Kaur, A.; Il Jeong, K.; Su Kim, S.; Woo Lim, J. Optimization of thermal treatment of carbon felt electrode based on the mechanical properties for high-efficiency vanadium redox flow batteries. Compos. Struct. 2022, 290, 115546. [Google Scholar] [CrossRef]
- Minakshi, M.; Sharma, N.; Ralph, D.; Appadoo, D.; Nallathamby, K. Synthesis and characterization of Li (Co0. 5Ni0. 5) PO4 cathode for Li-ion aqueous battery applications. Electrochem. Solid-State Lett. 2011, 14, A86. [Google Scholar] [CrossRef]
- Hilário, R.B.; de Moraes, T.H.; da Rocha Pimentel Gonçalves, J.M.; Gandara, M.; Gonçalves, E.S. Influence of heat treatment and electrochemical treatment on the properties of PANI electrodeposited on carbon fiber felt. Diam. Relat. Mater. 2022, 123, 108867. [Google Scholar] [CrossRef]
- Vadiyar, M.M.; Bhise, S.C.; Patil, S.K.; Kolekar, S.S.; Shelke, A.R.; Deshpande, N.G.; Chang, J.-Y.; Ghule, K.S.; Ghule, A.V. Contact angle measurements: A preliminary diagnostic tool for evaluating the performance of ZnFe2O4 nano-flake based supercapacitors. Chem. Commun. 2016, 52, 2557–2560. [Google Scholar] [CrossRef] [PubMed]
- Kumar, N.; Kim, S.-B.; Lee, S.-Y.; Park, S.-J. Recent advanced supercapacitor: A review of storage mechanisms, electrode materials, modification, and perspectives. Nanomaterials 2022, 12, 3708. [Google Scholar] [CrossRef] [PubMed]
- Wu, Y.; Holze, R. Electrocatalysis at electrodes for vanadium redox flow batteries. Batteries 2018, 4, 47. [Google Scholar] [CrossRef]
- Khaki, B.; Das, P. Voltage loss and capacity fade reduction in vanadium redox battery by electrolyte flow control. Electrochim. Acta 2022, 405, 139842. [Google Scholar] [CrossRef]
- Nourani, M.; Dennison, C.R.; Jin, X.; Liu, F.; Agar, E. Elucidating effects of faradaic imbalance on vanadium redox flow battery performance: Experimental characterization. J. Electrochem. Soc. 2019, 166, A3844. [Google Scholar] [CrossRef]
- Jiang, H.R.; Sun, J.; Wei, L.; Wu, M.C.; Shyy, W.; Zhao, T.S. A high power density and long cycle life vanadium redox flow battery. Energy Storage Mater. 2020, 24, 529–540. [Google Scholar] [CrossRef]


| Sample Name | Pristine GF | 400 °C GF | 500 °C GF | 600 °C GF |
|---|---|---|---|---|
| Surface Area (m2 g−1) | 0.063 | 0.081 | 0.192 | 0.254 |
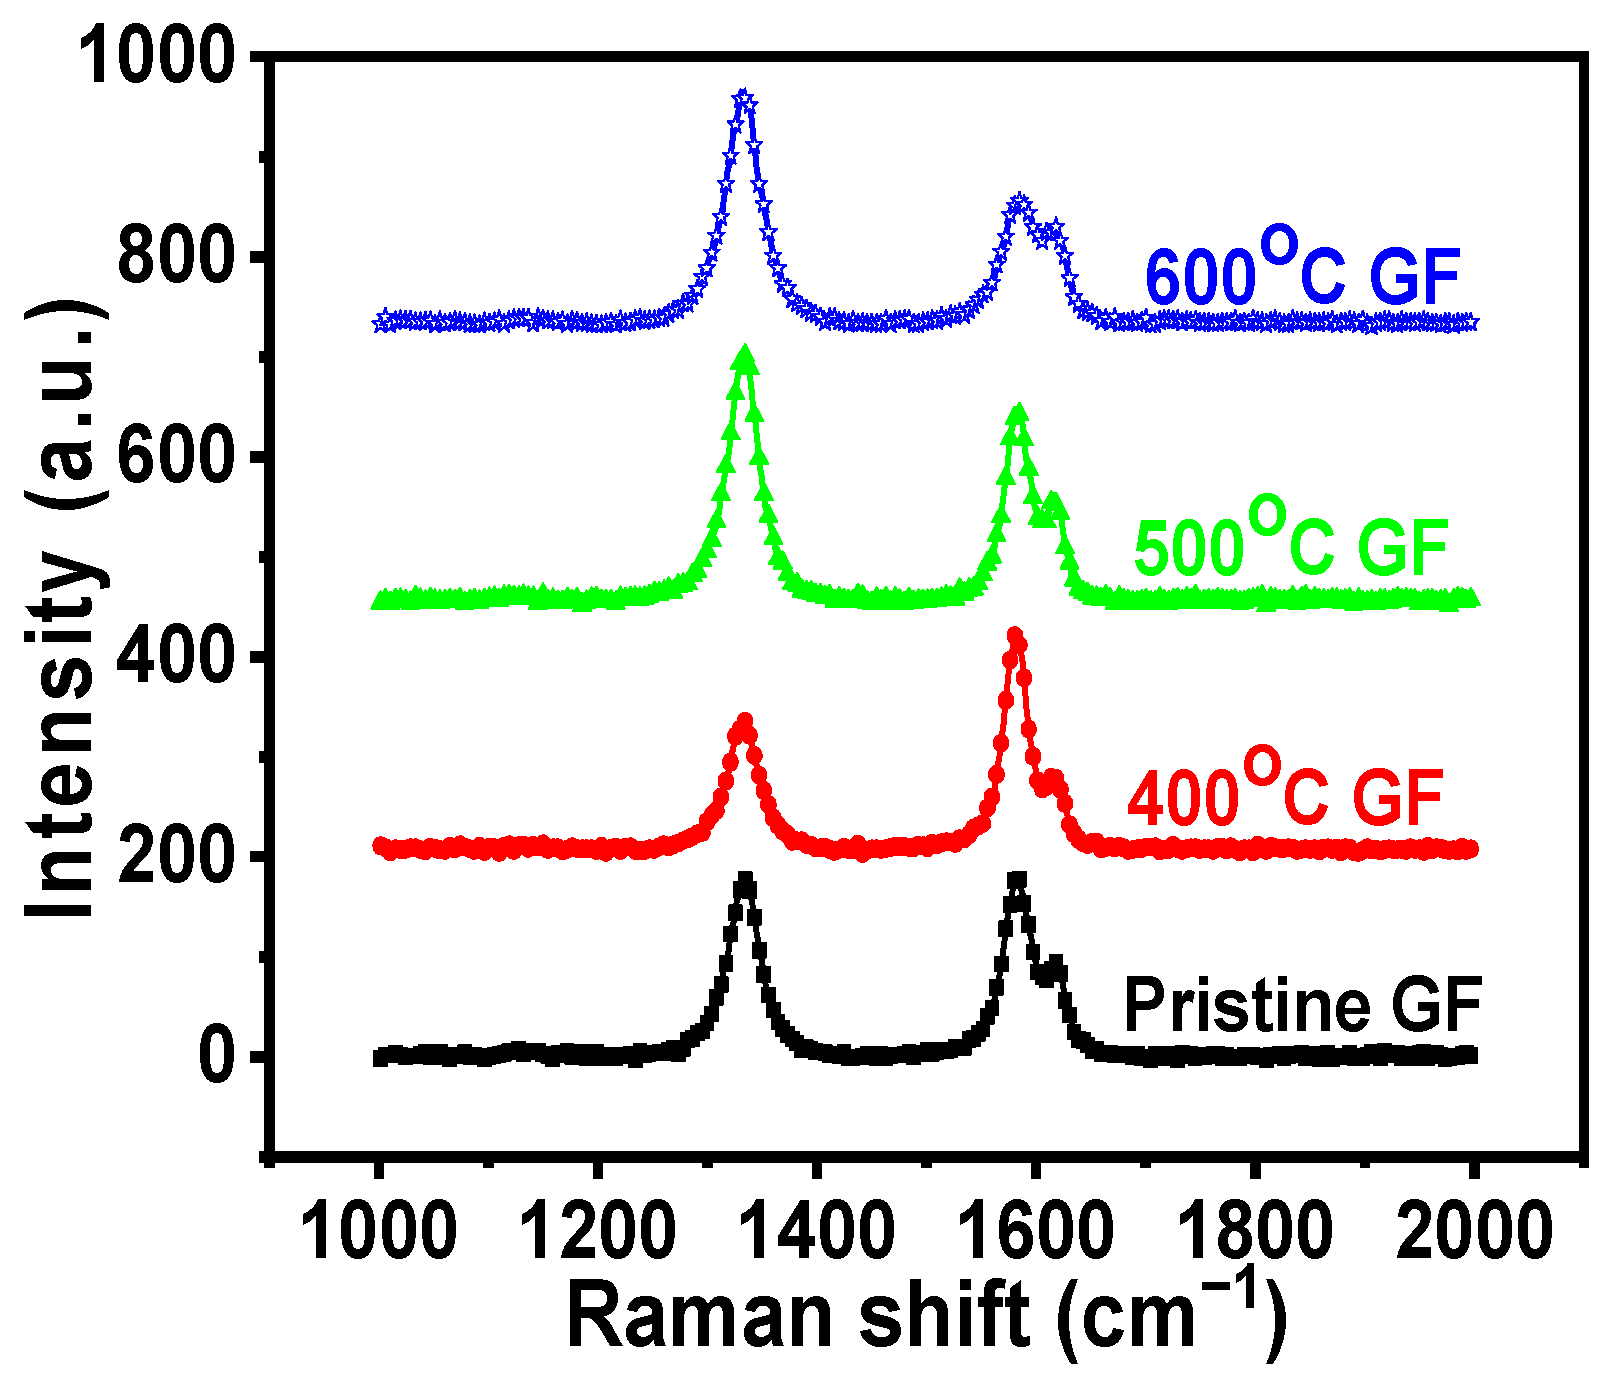
| ID/IG ratio from Raman spectra | 0.89 | 0.78 | 1.10 | 1.12 |
| Sample | C1s (%) | O1s (%) | O/C Ratio | C=O (%) (531.5 eV) | C-OH (%) (532.5 eV) | COOH (%) (533.8 eV) |
|---|---|---|---|---|---|---|
| Pristine GF | 96.53 | 3.47 | 0.036 | 59.11 | 14.42 | 16.29 |
| 400 °C GF | 95.36 | 4.64 | 0.049 | 30.87 | 37.30 | 31.82 |
| 500 °C GF | 94.16 | 5.84 | 0.062 | 25.04 | 41.04 | 33.91 |
| 600 °C GF | 94.03 | 5.97 | 0.064 | 22.66 | 44.88 | 32.43 |
| Sample Name | Pristine GF | 400 °C GF | 500 °C GF | 600 °C GF |
|---|---|---|---|---|
| Voltage efficiencies (VE) (%) | 66.09 | 67.55 | 73.61 | 70.58 |
| Coulombic efficiencies (CE) (%) | 95.36 | 94.56 | 93.55 | 94.73 |
| Energy efficiencies (EE) (%) | 63.03 | 63.89 | 69.50 | 66.89 |
| Current Densities | VE (%) | CE (%) | EE (%) |
|---|---|---|---|
| 20 mA cm−2 | 73.62 | 94.55 | 69.60 |
| 30 mA cm−2 | 67.23 | 97.29 | 65.35 |
| 40 mA cm−2 | 66.09 | 95.20 | 63.00 |
Disclaimer/Publisher’s Note: The statements, opinions and data contained in all publications are solely those of the individual author(s) and contributor(s) and not of MDPI and/or the editor(s). MDPI and/or the editor(s) disclaim responsibility for any injury to people or property resulting from any ideas, methods, instructions or products referred to in the content. |
© 2024 by the authors. Licensee MDPI, Basel, Switzerland. This article is an open access article distributed under the terms and conditions of the Creative Commons Attribution (CC BY) license (https://creativecommons.org/licenses/by/4.0/).
Share and Cite
Devi, N.; Mishra, J.N.; Singh, P.; Chen, Y.-S. Physiochemical and Electrochemical Properties of a Heat-Treated Electrode for All-Iron Redox Flow Batteries. Nanomaterials 2024, 14, 800. https://doi.org/10.3390/nano14090800
Devi N, Mishra JN, Singh P, Chen Y-S. Physiochemical and Electrochemical Properties of a Heat-Treated Electrode for All-Iron Redox Flow Batteries. Nanomaterials. 2024; 14(9):800. https://doi.org/10.3390/nano14090800
Chicago/Turabian StyleDevi, Nitika, Jay N. Mishra, Prabhakar Singh, and Yong-Song Chen. 2024. "Physiochemical and Electrochemical Properties of a Heat-Treated Electrode for All-Iron Redox Flow Batteries" Nanomaterials 14, no. 9: 800. https://doi.org/10.3390/nano14090800
APA StyleDevi, N., Mishra, J. N., Singh, P., & Chen, Y.-S. (2024). Physiochemical and Electrochemical Properties of a Heat-Treated Electrode for All-Iron Redox Flow Batteries. Nanomaterials, 14(9), 800. https://doi.org/10.3390/nano14090800