
Sub-Nanomolar Detection of Oligonucleotides Using Molecular Beacons Immobilized on Lightguiding Nanowires

 , , , , and
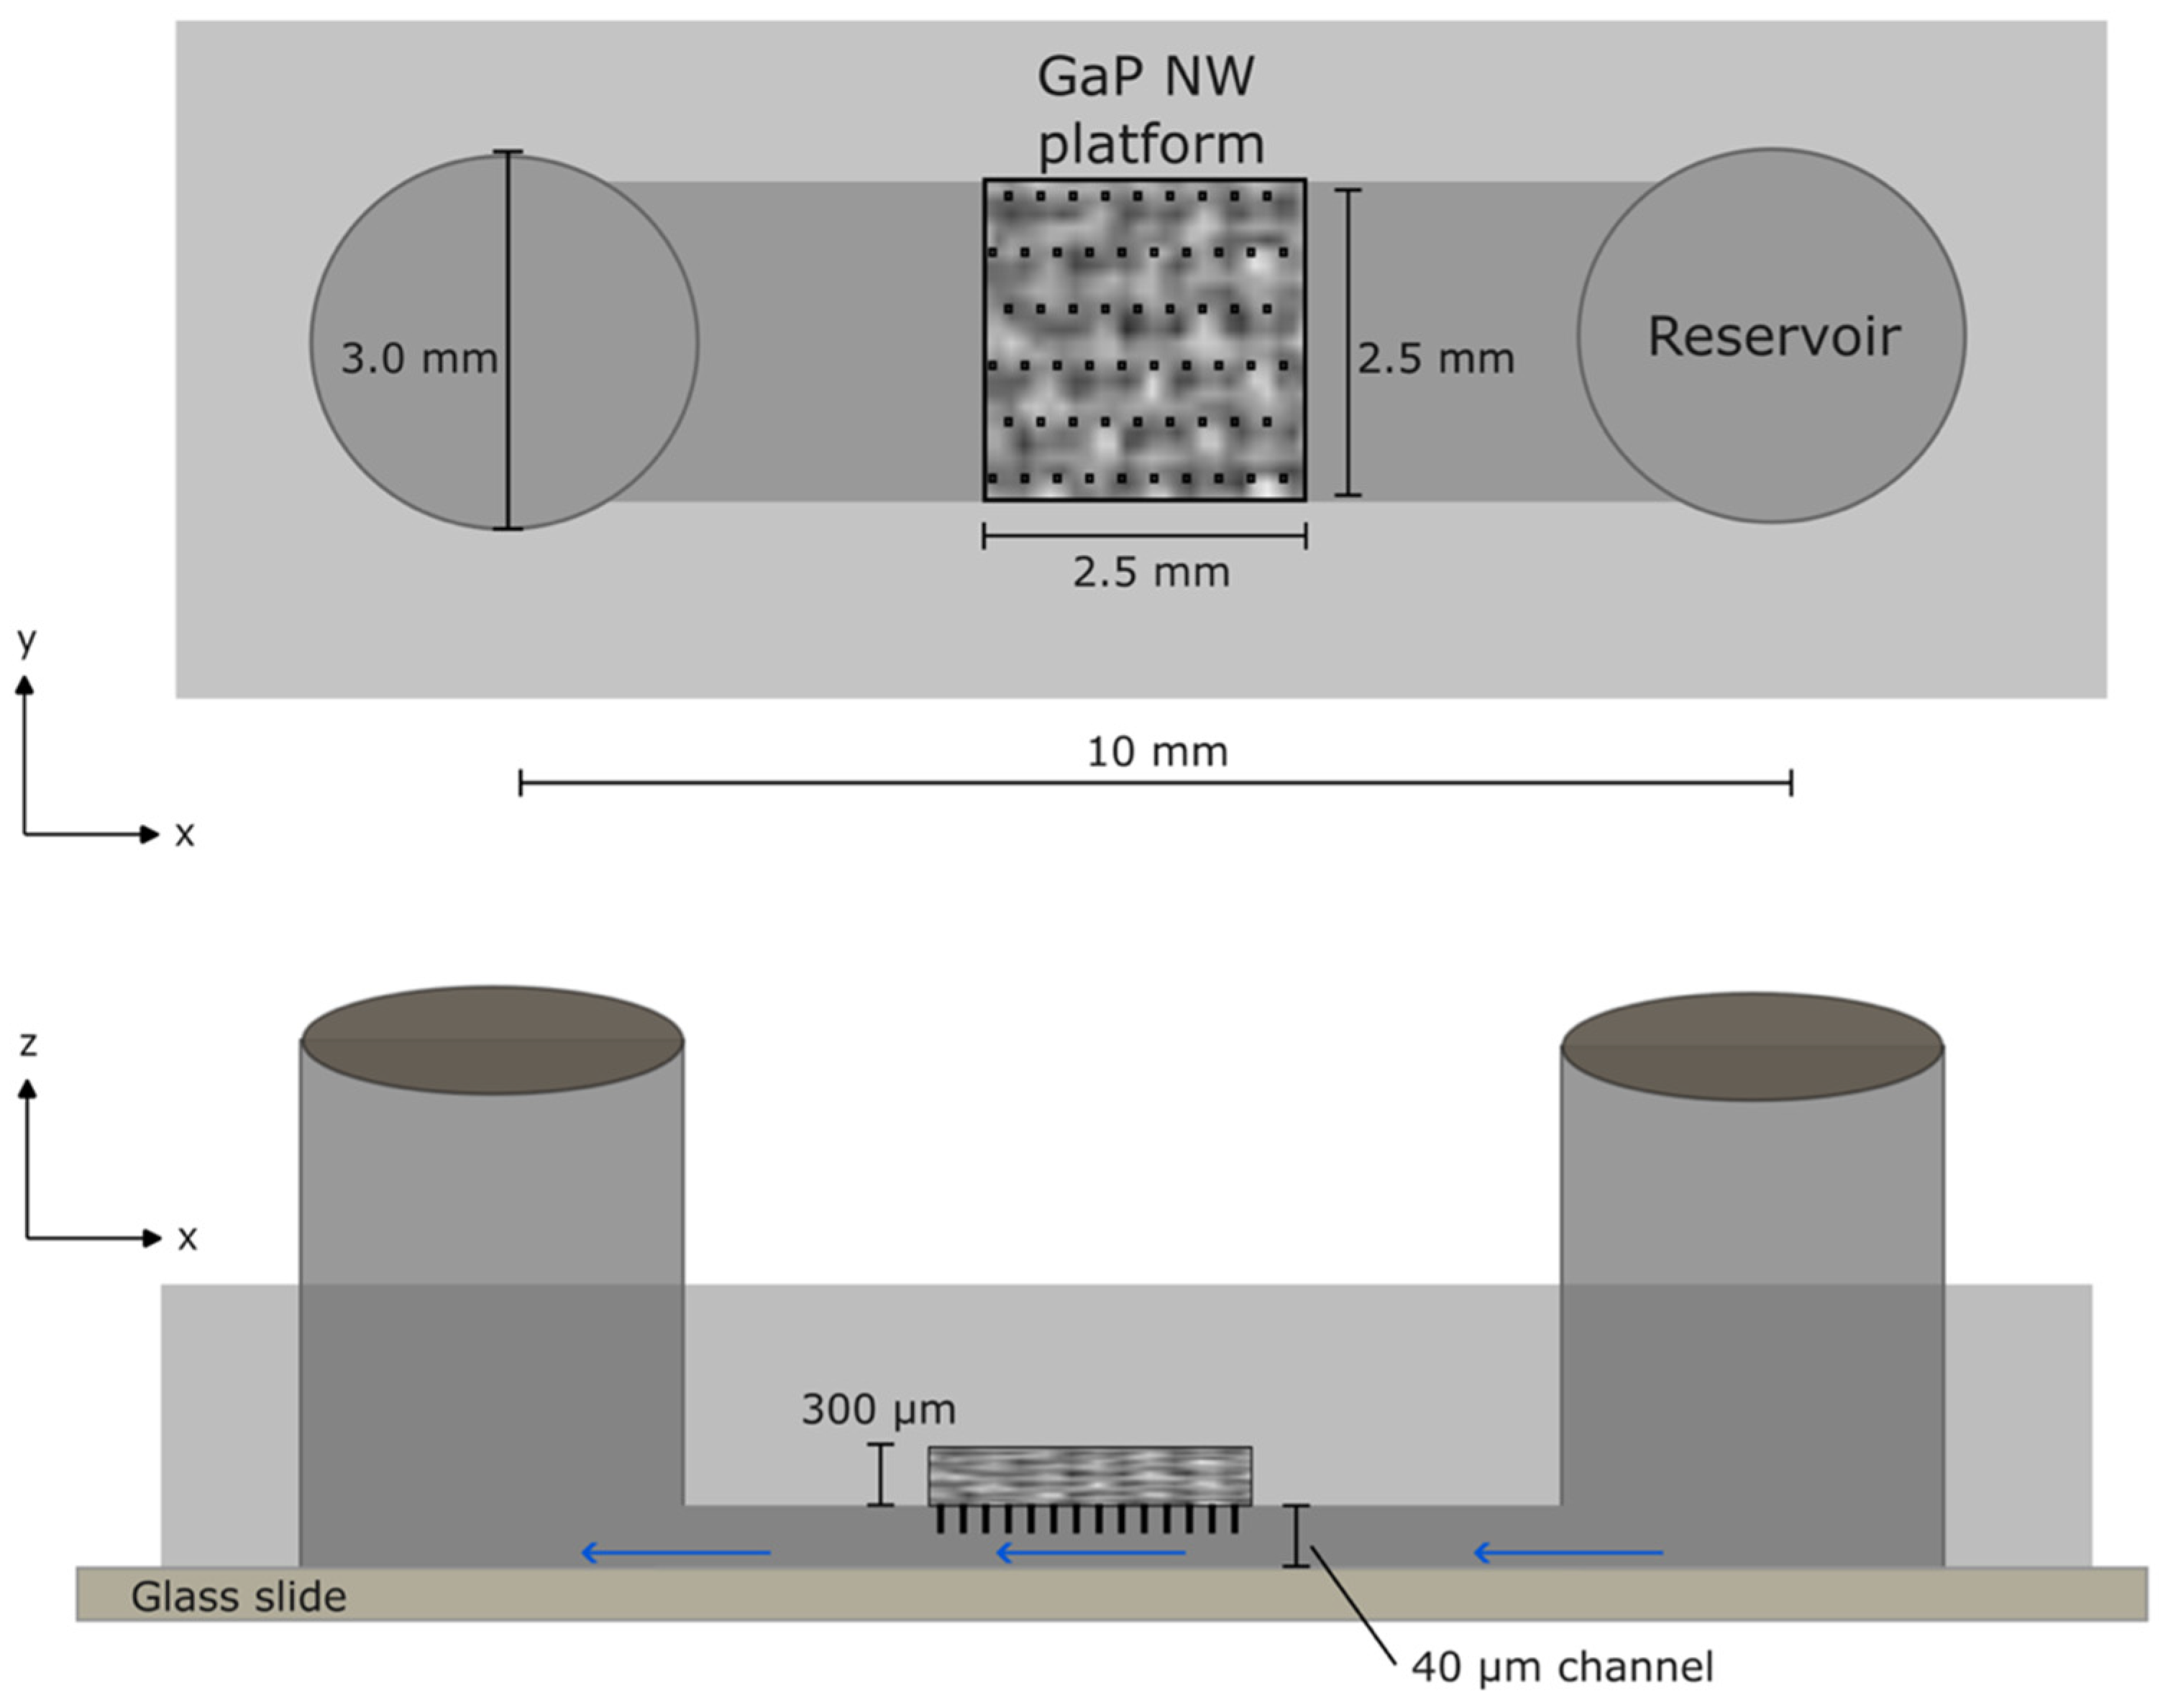
Abstract
1. Introduction
2. Materials and Methods
2.1. MB Design
2.2. MB Functionality Control
2.3. Nanowire Platform Fabrication and Characterization
2.4. Device Design
2.5. Immobilization of MBs on the Nanowire Platform
2.6. Image Acquisition
2.7. Data Analysis
3. Results
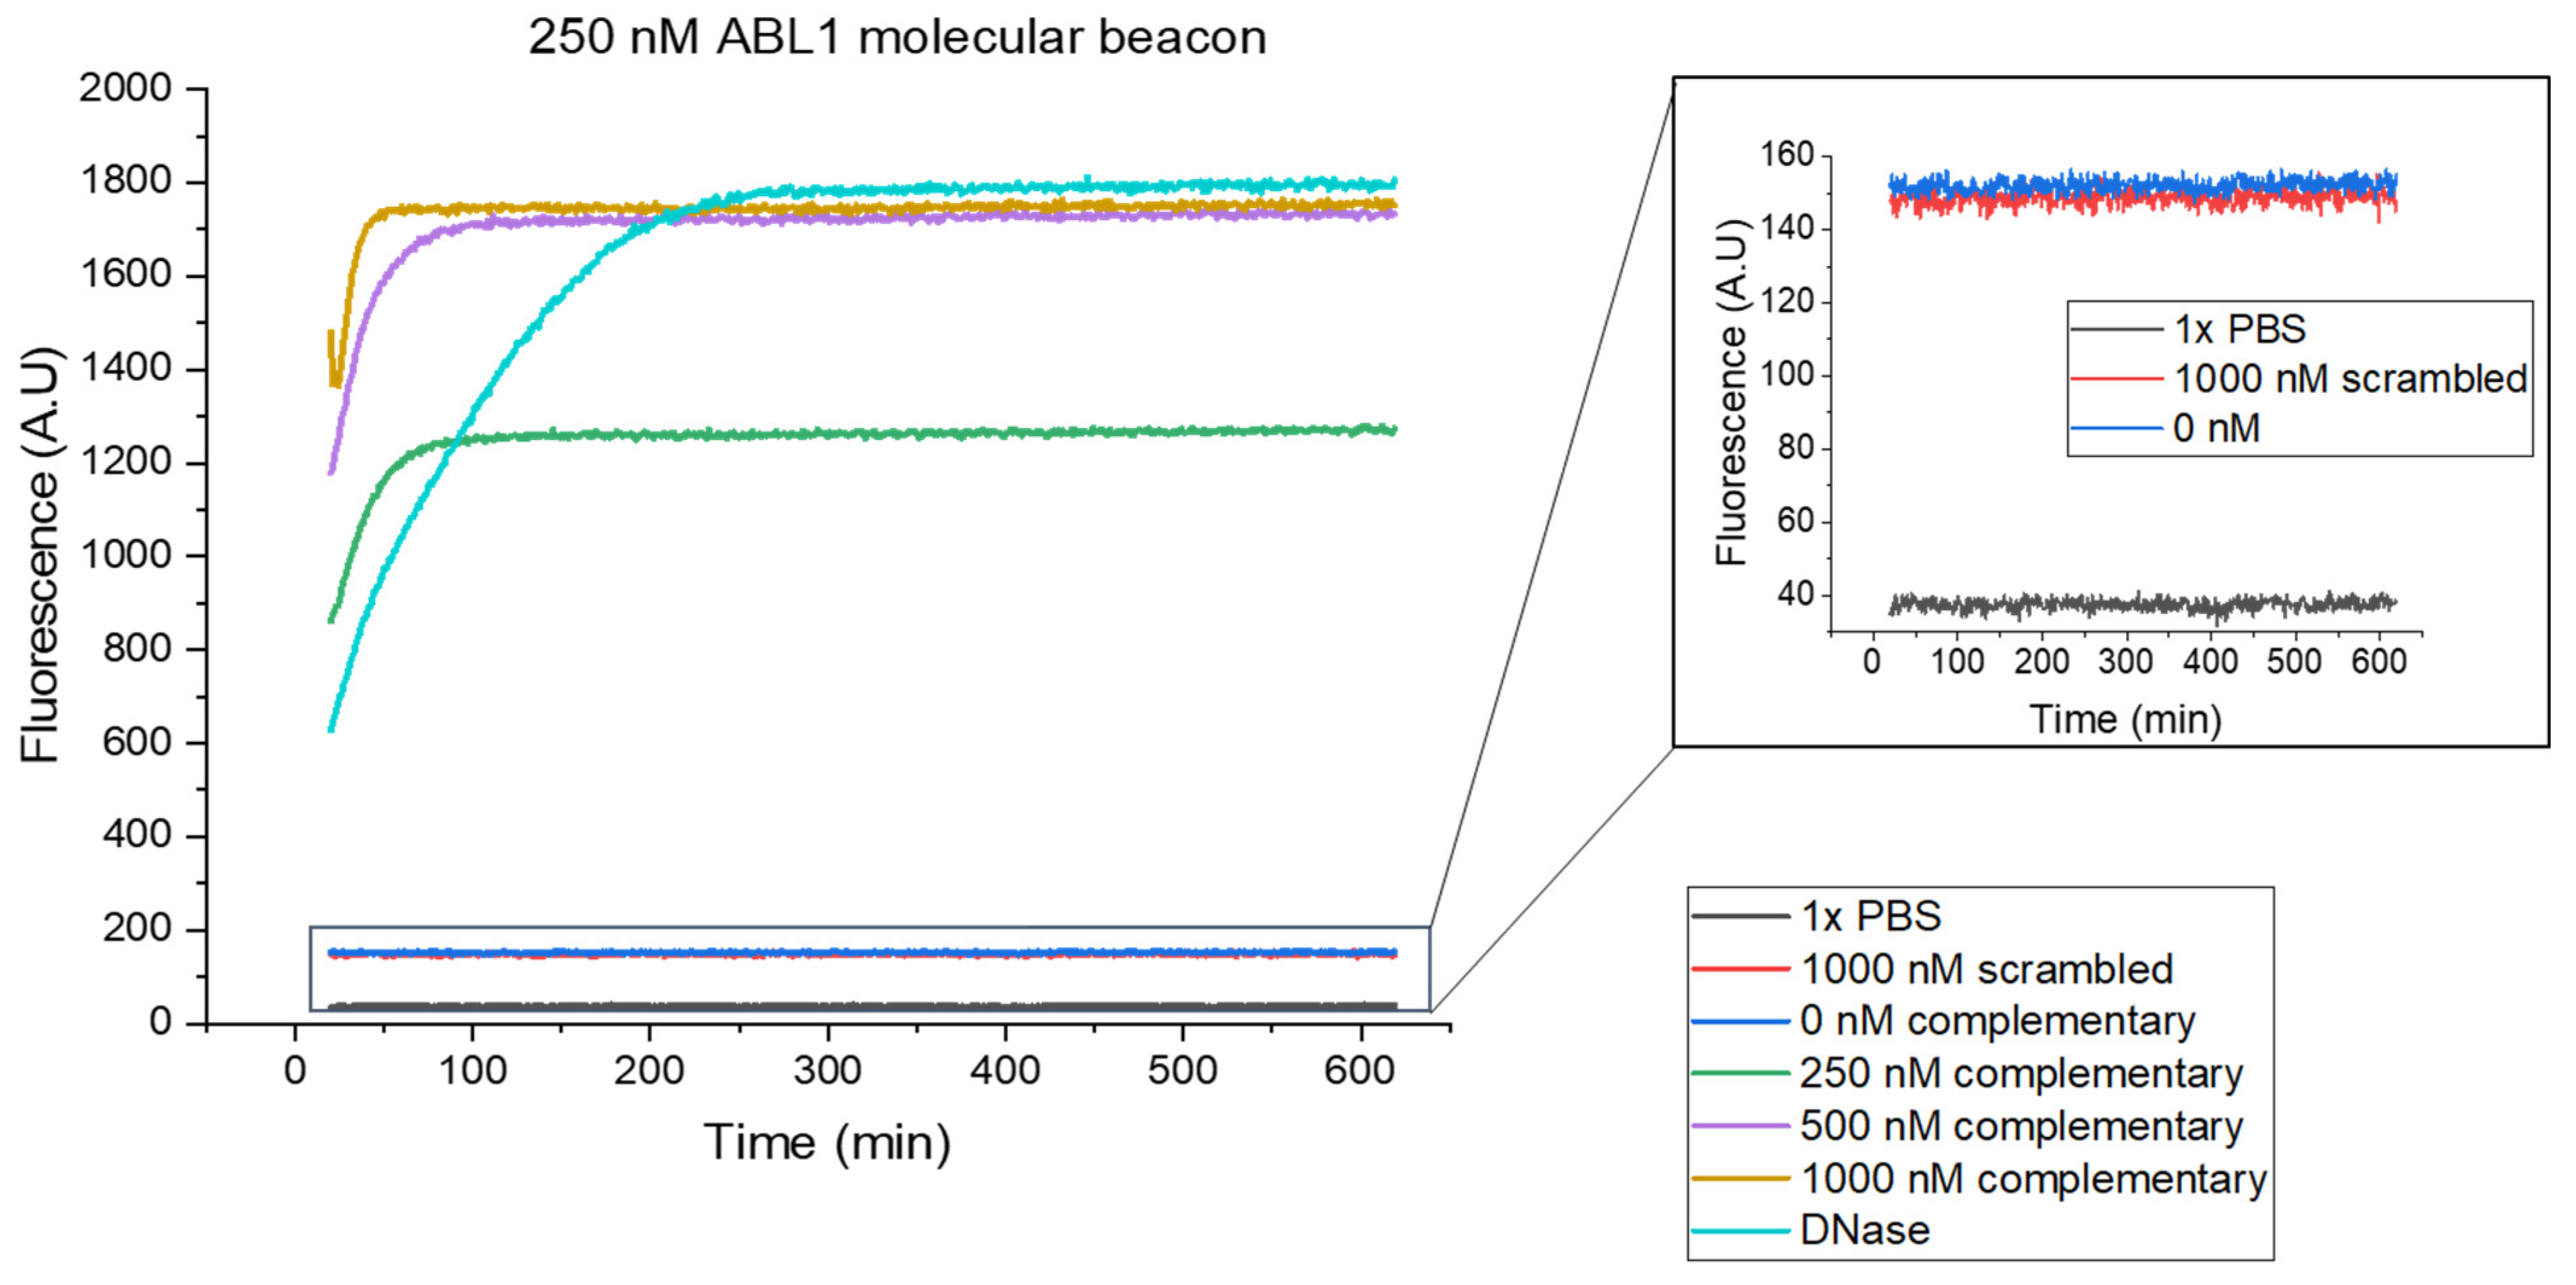
3.1. MB Functionality in Solution
3.2. Detection of Complementary Oligonucleotide on the NW Platform
4. Discussion
5. Conclusions
Supplementary Materials
Author Contributions
Funding
Data Availability Statement
Acknowledgments
Conflicts of Interest
References
- Chen, M.; Ma, Z.; Wu, X.; Mao, S.; Yang, Y.; Tan, J.; Krueger, C.J.; Chen, A.K. A molecular beacon-based approach for live-cell imaging of RNA transcripts with minimal target engineering at the single-molecule level. Sci. Rep. 2017, 7, 1550. [Google Scholar] [CrossRef]
- Lipshutz, R.J.; Morris, D.; Chee, M.; Hubbell, E.; Kozal, M.J.; Shah, N.; Shen, N.; Yang, R.; Fodor, S.P. Using oligonucleotide probe arrays to access genetic diversity. Biotechniques 1995, 19, 442–447. [Google Scholar] [PubMed]
- Ferrier, D.C.; Shaver, M.P.; Hands, P.J.W. Micro- and nano-structure based oligonucleotide sensors. Biosens. Bioelectron. 2015, 68, 798–810. [Google Scholar] [CrossRef] [PubMed]
- Tyagi, S.; Kramer, F.R. Molecular Beacons: Probes that Fluoresce upon Hybridization. Nat. Biotechnol. 1996, 14, 303–308. [Google Scholar] [CrossRef] [PubMed]
- Yao, G.; Fang, X.; Yokota, H.; Yanagida, T.; Tan, W. Monitoring molecular beacon DNA probe hybridization at the single-molecule level. Chemistry 2003, 9, 5686–5692. [Google Scholar] [CrossRef] [PubMed]
- Situma, C.; Moehring, A.J.; Noor, M.A.F.; Soper, S.A. Immobilized molecular beacons: A new strategy using UV-activated poly(methyl methacrylate) surfaces to provide large fluorescence sensitivities for reporting on molecular association events. Anal. Biochem. 2007, 363, 35–45. [Google Scholar] [CrossRef][Green Version]
- Du, H.; Disney, M.D.; Miller, B.L.; Krauss, T.D. Hybridization-based unquenching of DNA hairpins on au surfaces: Prototypical “molecular beacon” biosensors. J. Am. Chem. Soc. 2003, 125, 4012–4013. [Google Scholar] [CrossRef] [PubMed]
- Du, H.; Strohsahl, C.M.; Camera, J.; Miller, B.L.; Krauss, T.D. Sensitivity and Specificity of Metal Surface-Immobilized “Molecular Beacon” Biosensors. J. Am. Chem. Soc. 2005, 127, 7932–7940. [Google Scholar] [CrossRef] [PubMed]
- Cederquist, K.B.; Keating, C.D. Hybridization Efficiency of Molecular Beacons Bound to Gold Nanowires: Effect of Surface Coverage and Target Length. Langmuir 2010, 26, 18273–18280. [Google Scholar] [CrossRef]
- Moazeni, M.; Berger, P.; Padeste, C. Polymer brush structures functionalized with molecular beacon for point-of-care diagnostics. Micro Nano Eng. 2023, 19, 100184. [Google Scholar] [CrossRef]
- Li, J.J.; Chu, Y.; Lee, B.Y.-H.; Xie, X.S. Enzymatic signal amplification of molecular beacons for sensitive DNA detection. Nucleic Acids Res. 2008, 36, e36. [Google Scholar] [CrossRef]
- Liu, X.; Tan, W. A fiber-optic evanescent wave DNA biosensor based on novel molecular beacons. Anal. Chem. 1999, 71, 5054–5059. [Google Scholar] [CrossRef]
- Ruiz-Tórtola, Á.; Prats-Quílez, F.; González-Lucas, D.; Bañuls, M.-J.; Maquieira, Á.; Wheeler, G.; Dalmay, T.; Griol, A.; Hurtado, J.; García-Rupérez, J. High sensitivity and label-free oligonucleotides detection using photonic bandgap sensing structures biofunctionalized with molecular beacon probes. Biomed. Opt. Express 2018, 9, 1717–1727. [Google Scholar] [CrossRef]
- Frascella, F.; Ricciardi, S.; Pasquardini, L.; Potrich, C.; Angelini, A.; Chiadò, A.; Pederzolli, C.; Leo, N.D.; Rivolo, P.; Pirri, C.F.; et al. Enhanced fluorescence detection of miRNA-16 on a photonic crystal. Analyst 2015, 140, 5459–5463. [Google Scholar] [CrossRef]
- Xiong, Y.; Shepherd, S.; Tibbs, J.; Bacon, A.; Liu, W.; Akin, L.D.; Ayupova, T.; Bhaskar, S.; Cunningham, B.T. Photonic Crystal Enhanced Fluorescence: A Review on Design Strategies and Applications. Micromachines 2023, 14, 668. [Google Scholar] [CrossRef] [PubMed]
- Unksov, I.N.; Anttu, N.; Verardo, D.; Höök, F.; Prinz, C.N.; Linke, H. Fluorescence excitation enhancement by waveguiding nanowires. Nanoscale Adv. 2023, 5, 1760–1766. [Google Scholar] [CrossRef] [PubMed]
- Verardo, D.; Lindberg, F.W.; Anttu, N.; Niman, C.S.; Lard, M.; Dabkowska, A.P.; Nylander, T.; Månsson, A.; Prinz, C.N.; Linke, H. Nanowires for Biosensing: Lightguiding of Fluorescence as a Function of Diameter and Wavelength. Nano Lett. 2018, 18, 4796–4802. [Google Scholar] [CrossRef] [PubMed]
- Lard, M.; Linke, H.; Prinz, C.N. Biosensing using arrays of vertical semiconductor nanowires: Mechanosensing and biomarker detection. Nanotechnology 2019, 30, 214003. [Google Scholar] [CrossRef] [PubMed]
- Verardo, D.; Liljedahl, L.; Richter, C.; Agnarsson, B.; Axelsson, U.; Prinz, C.N.; Höök, F.; Borrebaeck, C.A.K.; Linke, H. Fluorescence Signal Enhancement in Antibody Microarrays Using Lightguiding Nanowires. Nanomater 2021, 11, 227. [Google Scholar] [CrossRef]
- Frederiksen, R.S.; Alarcon-Llado, E.; Krogstrup, P.; Bojarskaite, L.; Buch-Månson, N.; Bolinsson, J.; Nygård, J.; Fontcuberta i Morral, A.; Martinez, K.L. Nanowire-Aperture Probe: Local Enhanced Fluorescence Detection for the Investigation of Live Cells at the Nanoscale. ACS Photonics 2016, 3, 1208–1216. [Google Scholar] [CrossRef]
- van Dam, D.; Abujetas, D.R.; Paniagua-Domínguez, R.; Sánchez-Gil, J.A.; Bakkers, E.P.A.M.; Haverkort, J.E.M.; Gómez Rivas, J. Directional and Polarized Emission from Nanowire Arrays. Nano Lett. 2015, 15, 4557–4563. [Google Scholar] [CrossRef]
- Wang, J.Y.J. The Capable ABL: What Is Its Biological Function? Mol. Cell. Biol. 2014, 34, 1188–1197. [Google Scholar] [CrossRef]
- Home—Nucleotide—NCBI. Available online: https://www.ncbi.nlm.nih.gov/nuccore/ (accessed on 20 September 2023).
- RNAfold Web Server. Available online: http://rna.tbi.univie.ac.at/cgi-bin/RNAWebSuite/RNAfold.cgi (accessed on 4 September 2023).
- BLAST: Basic Local Alignment Search Tool. Available online: https://blast.ncbi.nlm.nih.gov/Blast.cgi (accessed on 4 September 2023).
- Freiburg RNA Tools. Available online: http://rna.informatik.uni-freiburg.de/ (accessed on 4 September 2023).
- Integrated DNA TechnologiesǀIDT. Available online: https://eu.idtdna.com/pages (accessed on 4 September 2023).
- Adolfsson, K.; Schneider, M.; Hammarin, G.; Häcker, U.; Prinz, C.N. Ingestion of gallium phosphide nanowires has no adverse effect on Drosophila tissue function. Nanotechnology 2013, 24, 285101. [Google Scholar] [CrossRef]
- SanMartin, A.; Johansson, F.; Samuelson, L.; Prinz, C.N. Microarray Analysis Reveals Moderate Gene Expression Changes in Cortical Neural Stem Cells Cultured on Nanowire Arrays. J. Nanosci. Nanotechnol. 2014, 14, 4880–4885. [Google Scholar] [CrossRef]
- Valderas-Gutiérrez, J.; Davtyan, R.; Sivakumar, S.; Anttu, N.; Li, Y.; Flatt, P.; Shin, J.Y.; Prinz, C.N.; Höök, F.; Fioretos, T.; et al. Enhanced Optical Biosensing by Aerotaxy Ga(As)P Nanowire Platforms Suitable for Scalable Production. ACS Appl. Nano Mater. 2022, 5, 9063–9071. [Google Scholar] [CrossRef] [PubMed]
- Luan, Q.; Xue, Y.; Yao, X. A simple hairpin DNA sensor for label-free detection of sub-attomole DNA target. Sens. Actuators B Chem. 2010, 147, 561–565. [Google Scholar] [CrossRef]
- Moon, Y.; Moon, H.; Chang, J.; Kim, H.D.; Lee, J.H.; Lee, J. Development of a highly sensitive lateral flow strip device for nucleic acid detection using molecular beacons. Front. Sens. 2022, 3, 1012775. [Google Scholar] [CrossRef]
- Sjövall, P.; Agnarsson, B.; Carlred, L.; Gunnarsson, A.; Höök, F. Liposome binding for multiplexed biomolecule detection and imaging using ToF-SIMS. Surf. Interface Anal. 2014, 46, 707–711. [Google Scholar] [CrossRef]
- Grain, N.; Kim, S. Insight into refractive index modulation as route to enhanced light coupling in semiconductor nanowires. Opt. Lett. 2023, 48, 227–230. [Google Scholar] [CrossRef]
- Cretì, A.; Prete, P.; Lovergine, N.; Lomascolo, M. Enhanced Optical Absorption of GaAs Near-Band-Edge Transitions in GaAs/AlGaAs Core–Shell Nanowires: Implications for Nanowire Solar Cells. ACS Appl. Nano Mater. 2022, 5, 18149–18158. [Google Scholar] [CrossRef]
- Heurlin, M.; Magnusson, M.H.; Lindgren, D.; Ek, M.; Wallenberg, L.R.; Deppert, K.; Samuelson, L. Continuous gas-phase synthesis of nanowires with tunable properties. Nature 2012, 492, 90–94. [Google Scholar] [CrossRef] [PubMed]


Disclaimer/Publisher’s Note: The statements, opinions and data contained in all publications are solely those of the individual author(s) and contributor(s) and not of MDPI and/or the editor(s). MDPI and/or the editor(s) disclaim responsibility for any injury to people or property resulting from any ideas, methods, instructions or products referred to in the content. |
© 2024 by the authors. Licensee MDPI, Basel, Switzerland. This article is an open access article distributed under the terms and conditions of the Creative Commons Attribution (CC BY) license (https://creativecommons.org/licenses/by/4.0/).
Share and Cite
Johansson, T.B.; Davtyan, R.; Valderas-Gutiérrez, J.; Gonzalez Rodriguez, A.; Agnarsson, B.; Munita, R.; Fioretos, T.; Lilljebjörn, H.; Linke, H.; Höök, F.; et al. Sub-Nanomolar Detection of Oligonucleotides Using Molecular Beacons Immobilized on Lightguiding Nanowires. Nanomaterials 2024, 14, 453. https://doi.org/10.3390/nano14050453
Johansson TB, Davtyan R, Valderas-Gutiérrez J, Gonzalez Rodriguez A, Agnarsson B, Munita R, Fioretos T, Lilljebjörn H, Linke H, Höök F, et al. Sub-Nanomolar Detection of Oligonucleotides Using Molecular Beacons Immobilized on Lightguiding Nanowires. Nanomaterials. 2024; 14(5):453. https://doi.org/10.3390/nano14050453
Chicago/Turabian StyleJohansson, Therese B., Rubina Davtyan, Julia Valderas-Gutiérrez, Adrian Gonzalez Rodriguez, Björn Agnarsson, Roberto Munita, Thoas Fioretos, Henrik Lilljebjörn, Heiner Linke, Fredrik Höök, and et al. 2024. "Sub-Nanomolar Detection of Oligonucleotides Using Molecular Beacons Immobilized on Lightguiding Nanowires" Nanomaterials 14, no. 5: 453. https://doi.org/10.3390/nano14050453
APA StyleJohansson, T. B., Davtyan, R., Valderas-Gutiérrez, J., Gonzalez Rodriguez, A., Agnarsson, B., Munita, R., Fioretos, T., Lilljebjörn, H., Linke, H., Höök, F., & Prinz, C. N. (2024). Sub-Nanomolar Detection of Oligonucleotides Using Molecular Beacons Immobilized on Lightguiding Nanowires. Nanomaterials, 14(5), 453. https://doi.org/10.3390/nano14050453