
Vibrational Spectrum of Magnesium Monochalcogenide Nanoparticles


Abstract
1. Introduction
2. Computational Method
3. Results
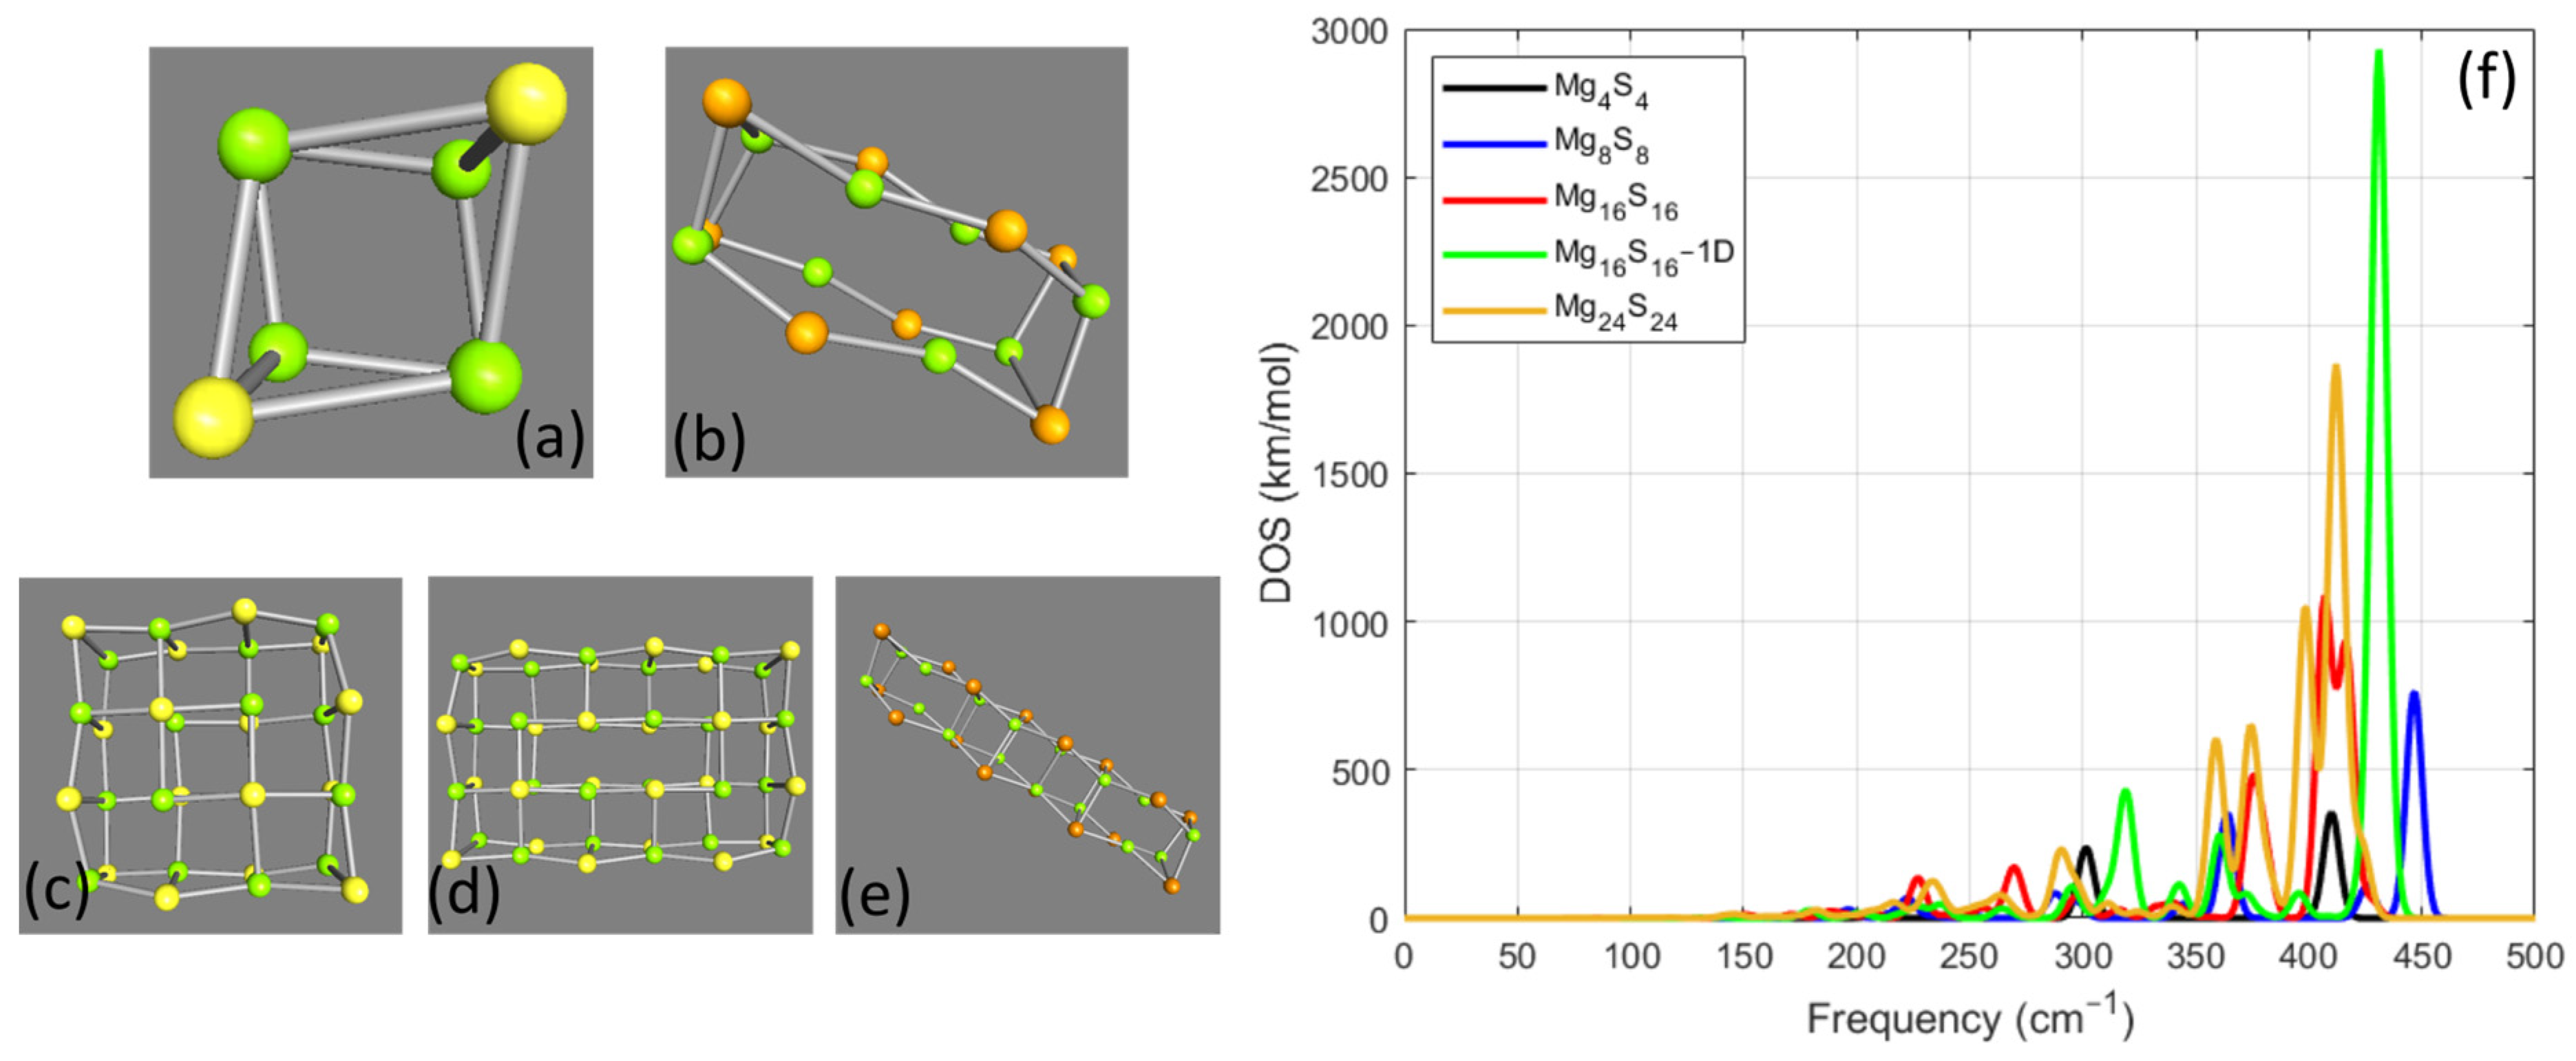
3.1. MgxSx Cases
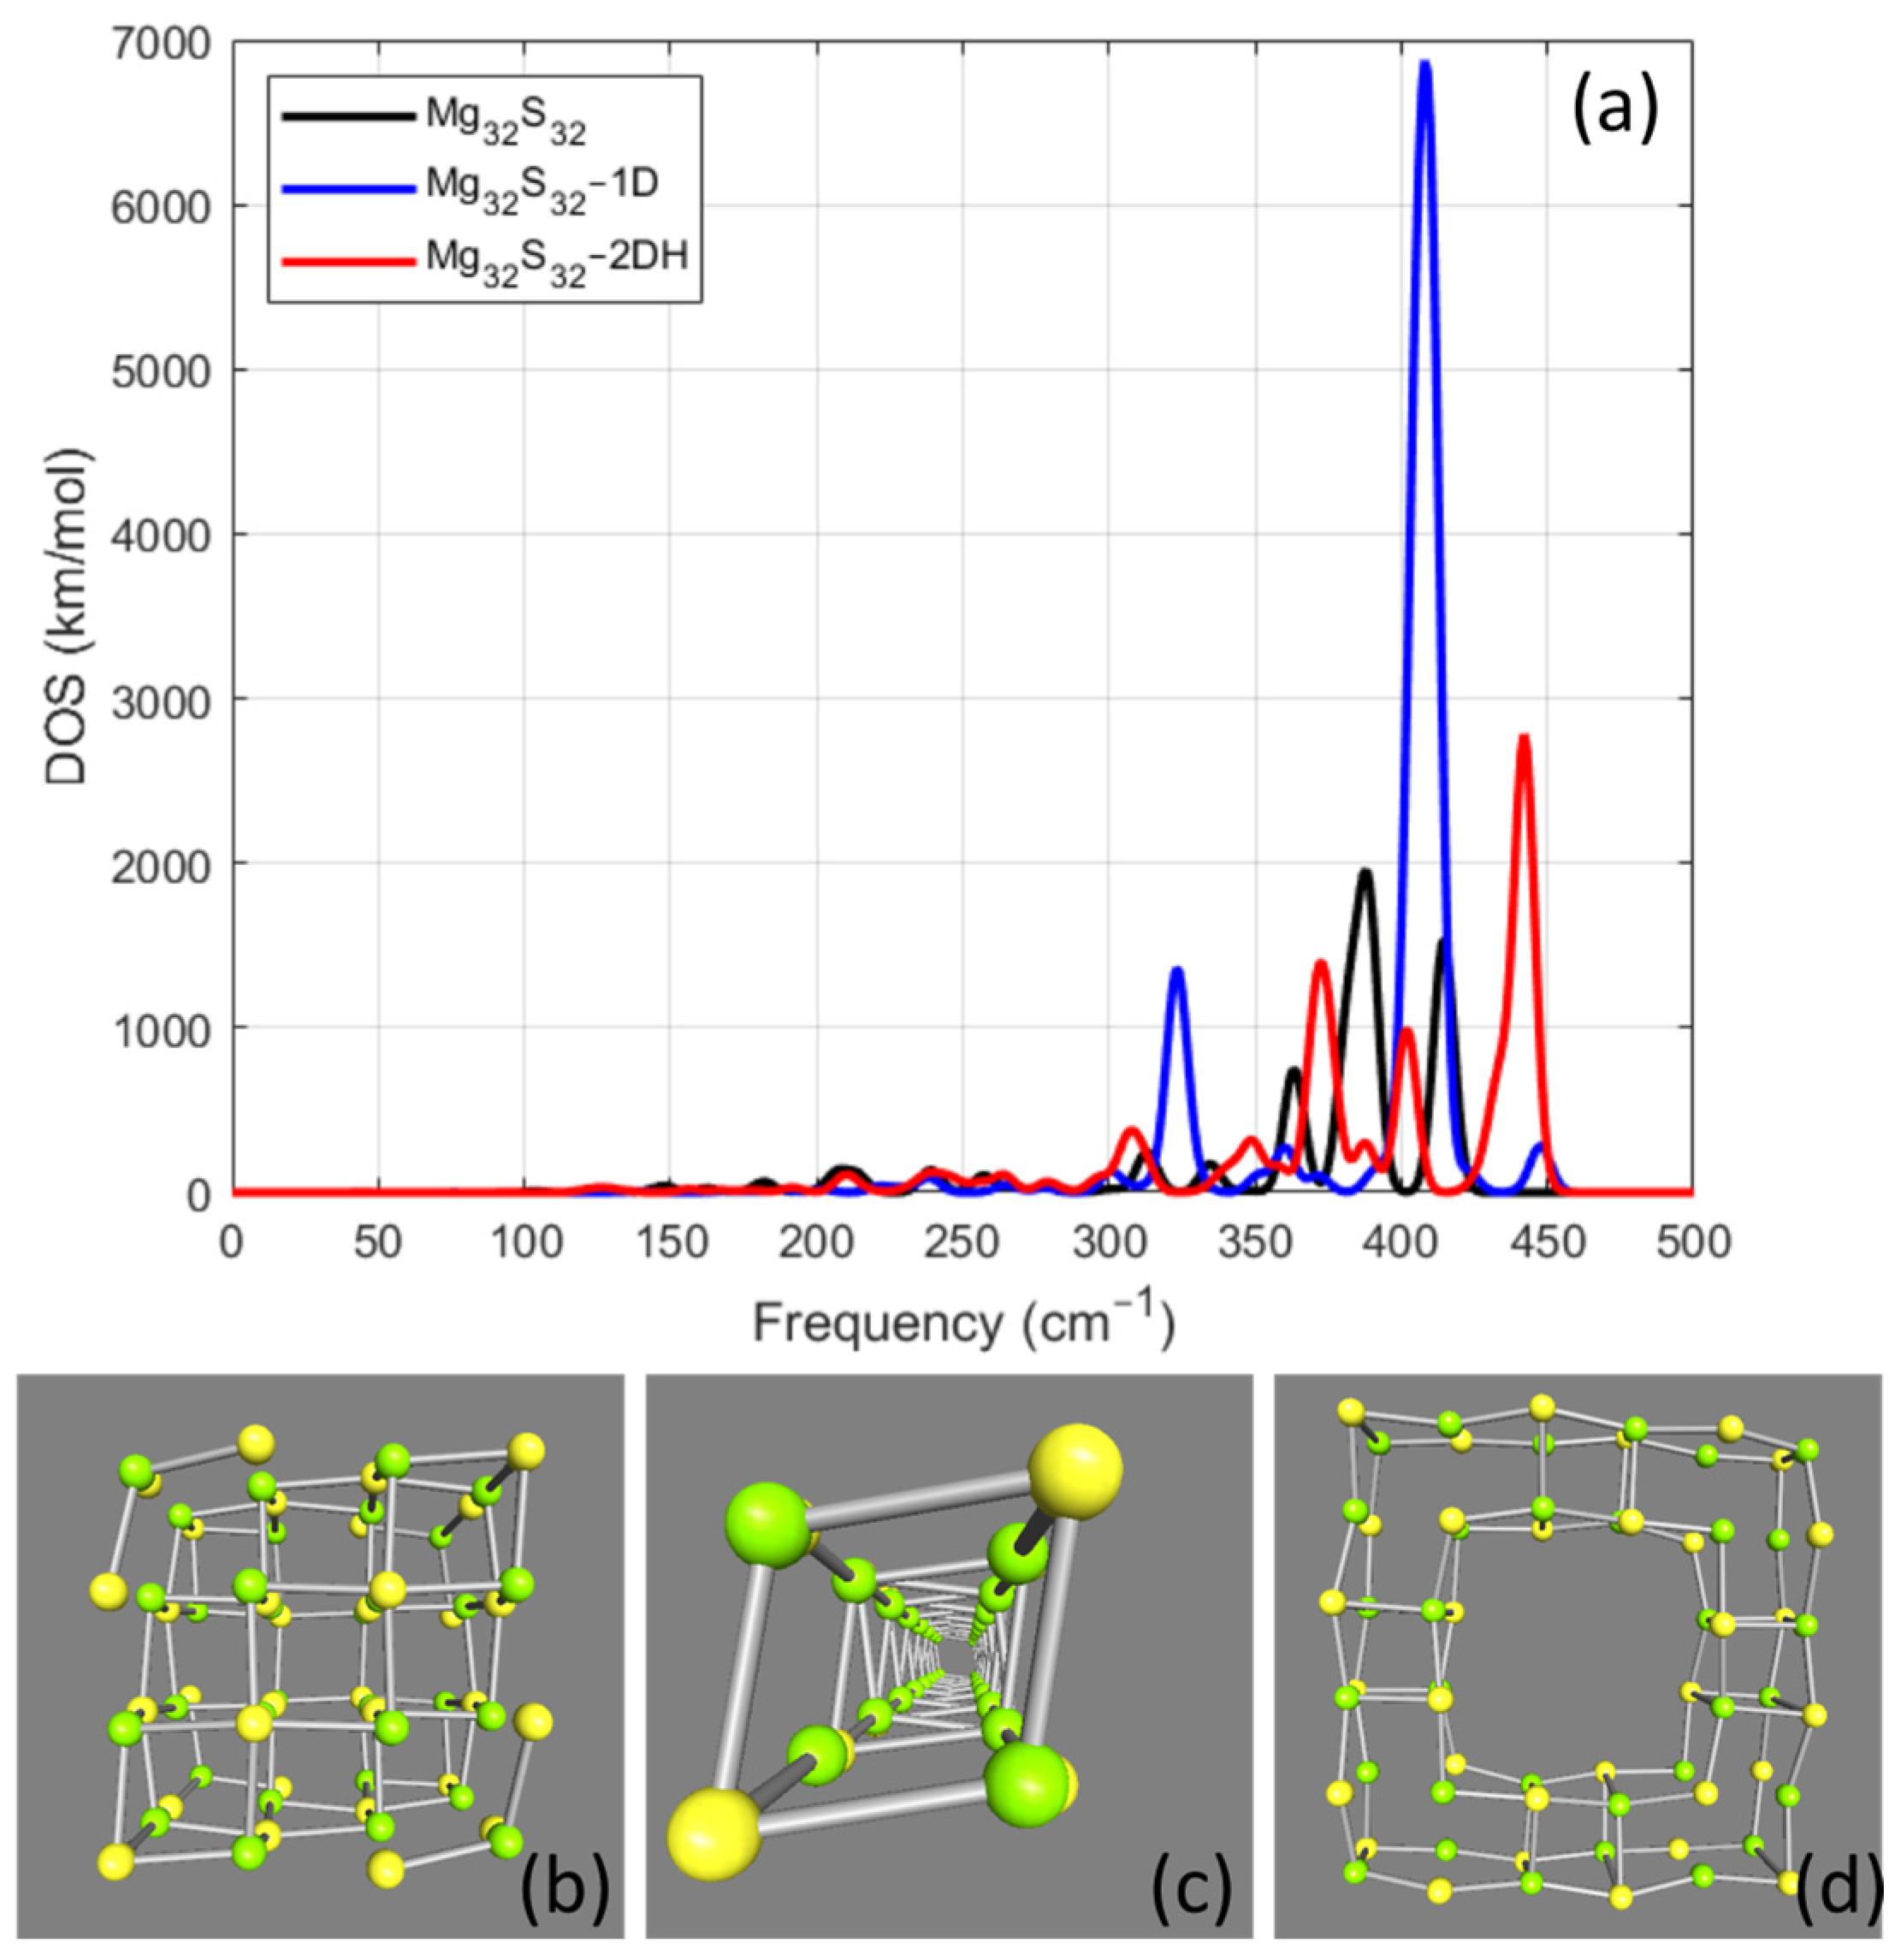
Mg32S32 Cases
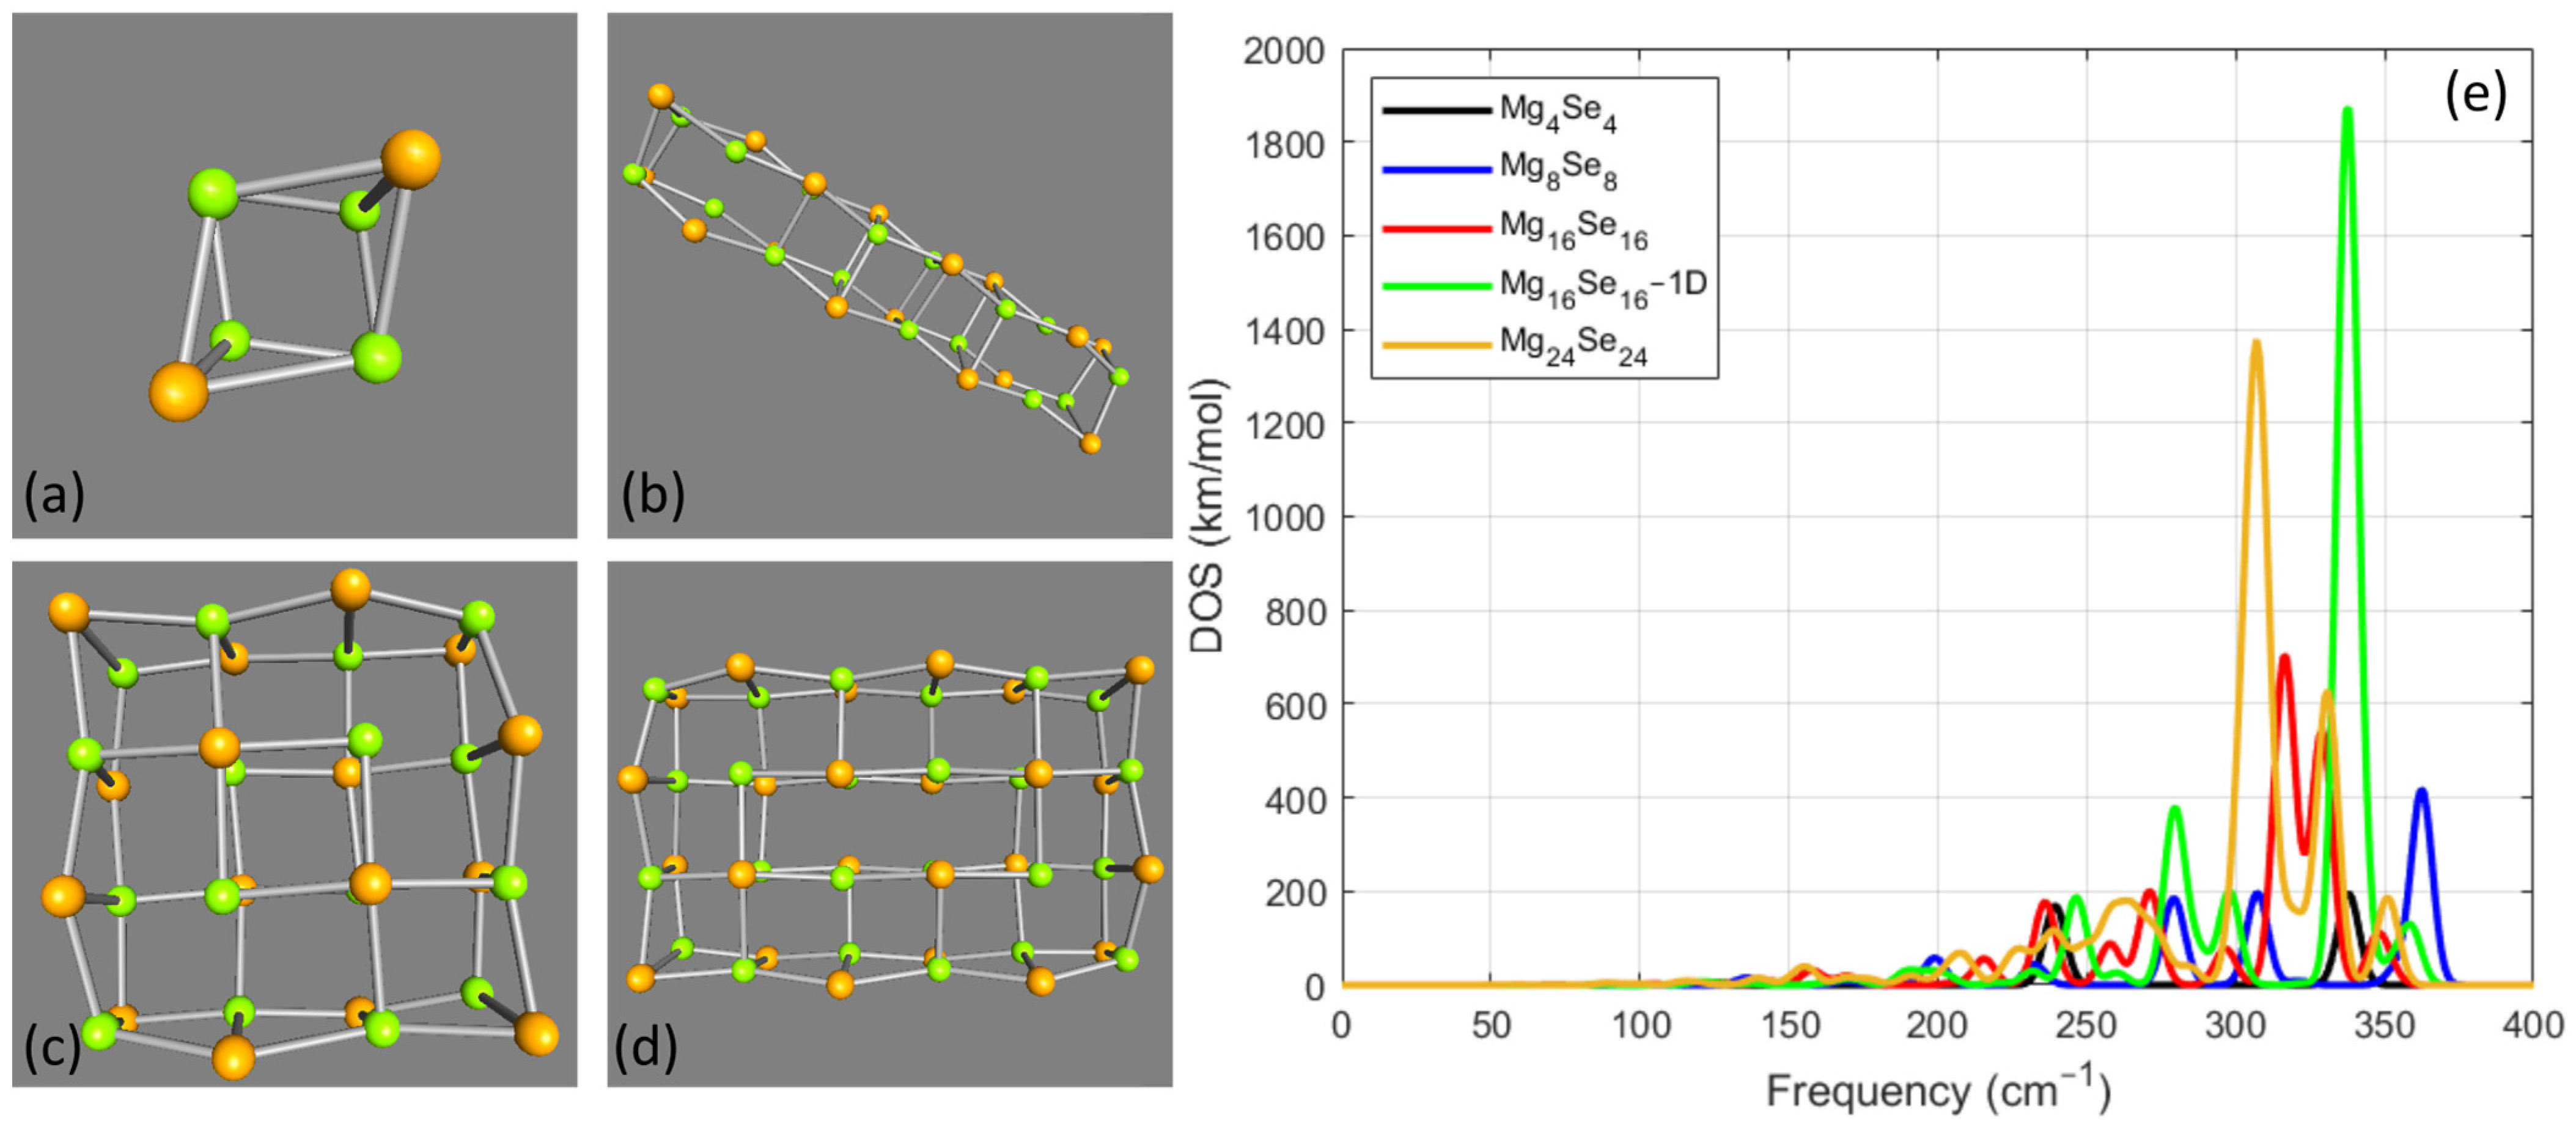
3.2. MgxSex Cases
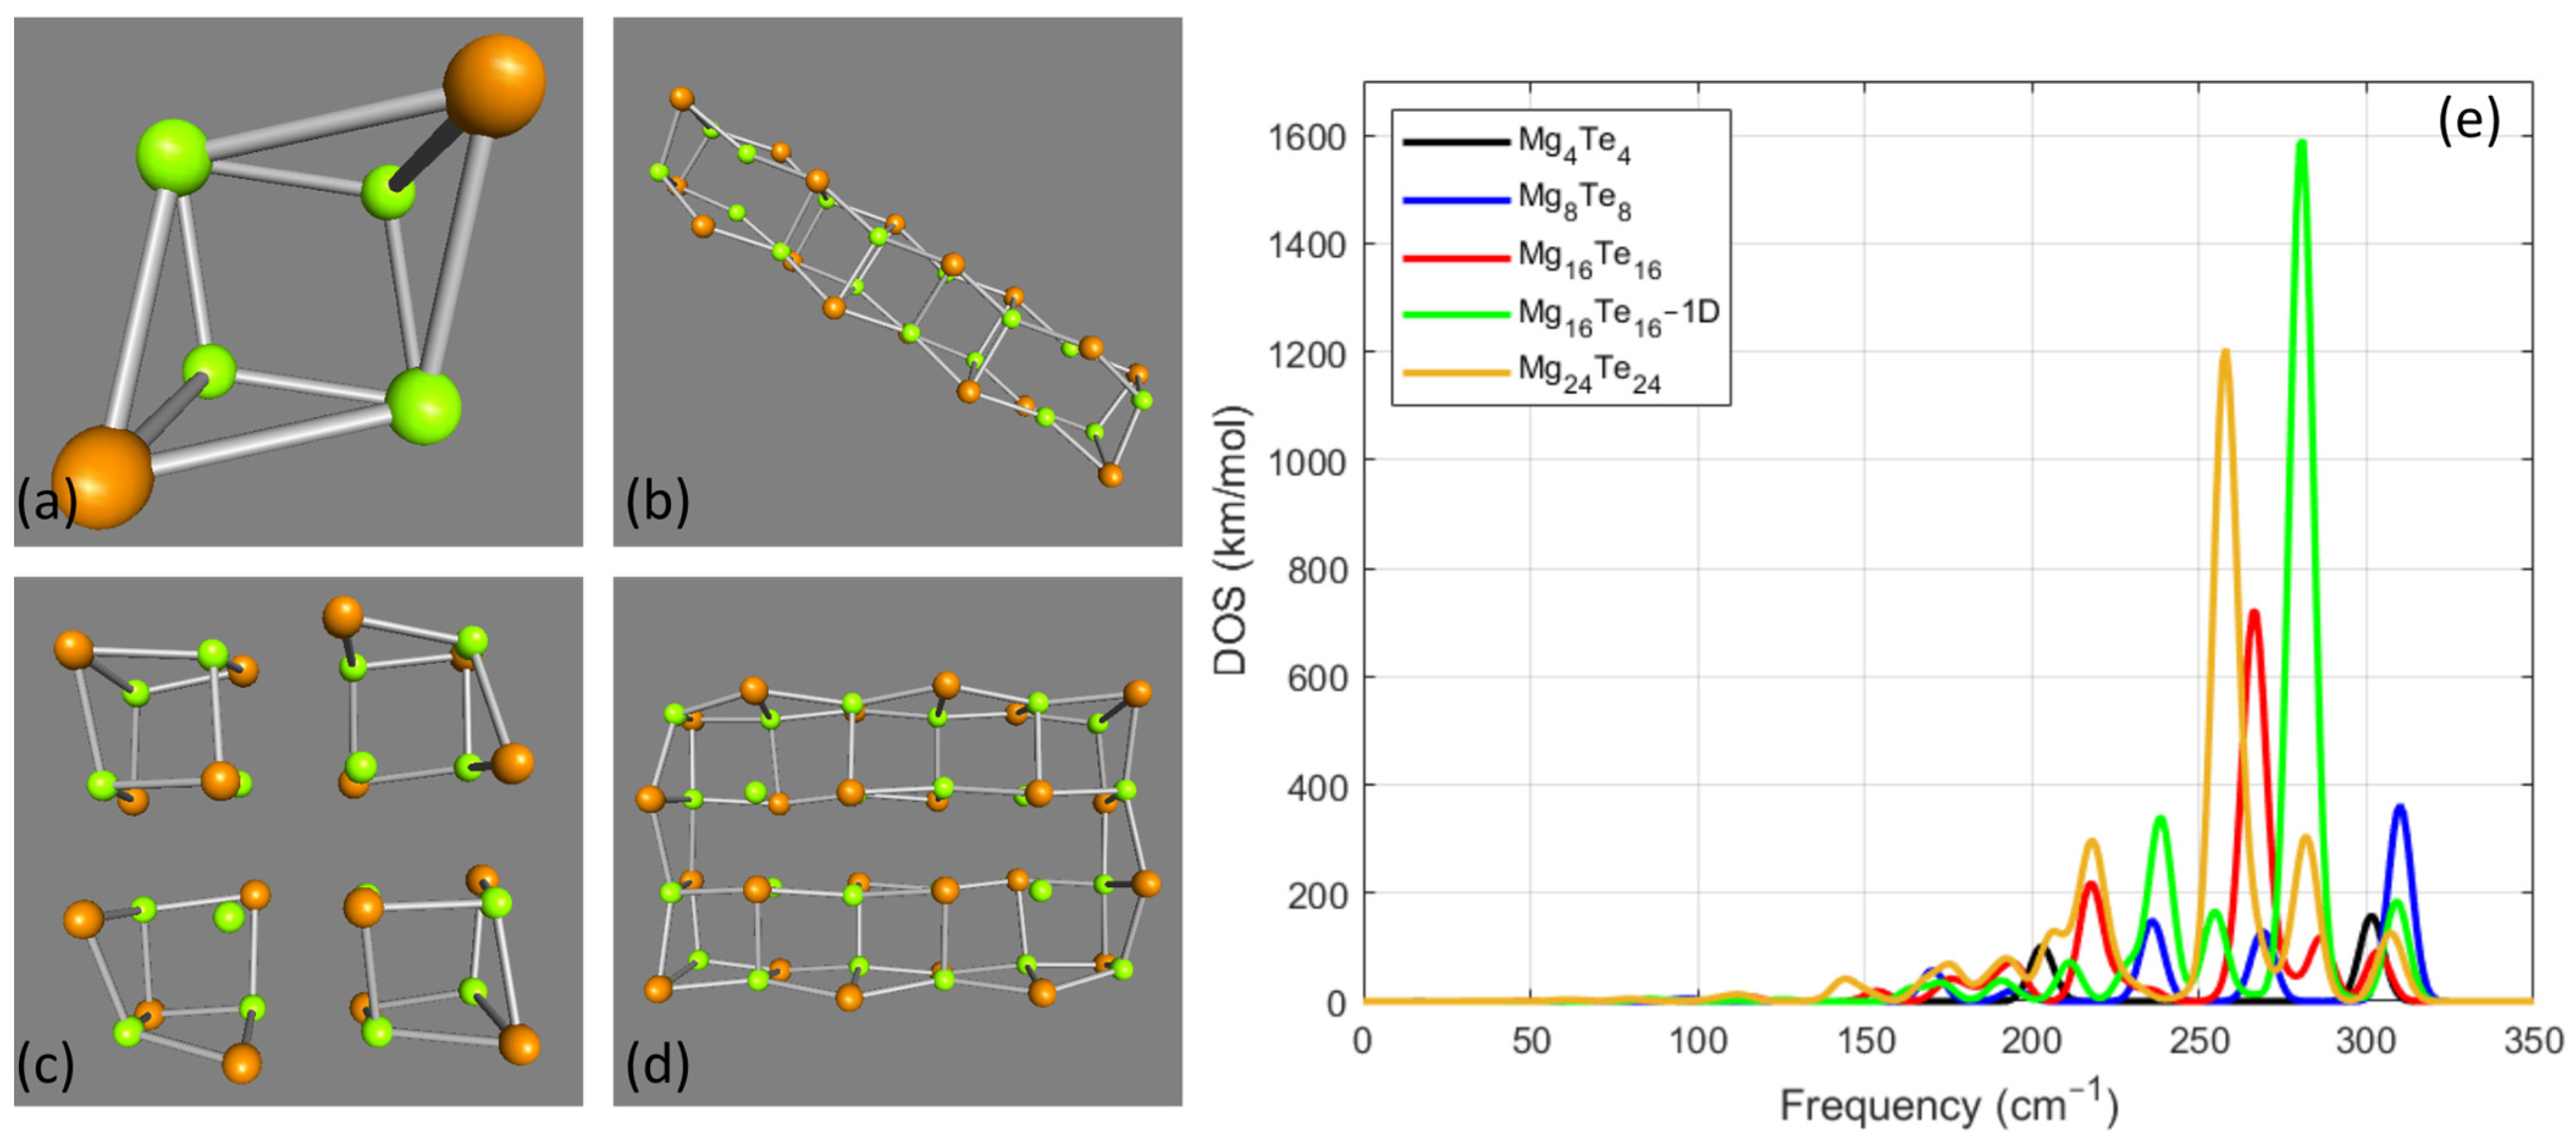
3.3. MgxTex Cases
4. Discussion
5. Conclusions
Supplementary Materials
Author Contributions
Funding
Data Availability Statement
Conflicts of Interest
References
- Maldovan, M. Sound and heat revolutions in phononics. Nature 2013, 503, 209–217. [Google Scholar] [CrossRef] [PubMed]
- Priya, E.R.; de Oliveira, E.R.C.; Lanzillotti-Kimura, N.D. Perspectives on high-frequency nanomechanics, nanoacoustics, and nanophononics. Appl. Phys. Lett. 2023, 122, 140501. [Google Scholar] [CrossRef]
- Yu, K.; Wang, G.P. Coherent Acoustic Vibrational Spectrum of Single and Coupled Nanoresonators. J. Phys. Chem. C 2024, 128, 5394–5407. [Google Scholar] [CrossRef]
- Vasileiadis, T.; Varghese, J.; Babacic, V.; Gomis-Bresco, J.; Urrios, D.N.; Graczykowski, B. Progress and perspectives on phononic crystals. J. Appl. Phys. 2021, 129, 160901. [Google Scholar] [CrossRef]
- Cang, Y.; Jin, Y.; Djafari-Rouhani, B.; Fytas, G. Fundamentals, progress and perspectives on high-frequency phononic crystals. J. Phys. D Appl. Phys. 2022, 55, 193002. [Google Scholar] [CrossRef]
- Alivisatos, A.P. Semiconductor Clusters, Nanocrystals, and Quantum Dots. Science 1996, 271, 933–937. [Google Scholar] [CrossRef]
- Alivisatos, A.P. Perspectives on the Physical Chemistry of Semiconductor Nanocrystals. J. Phys. Chem. 1996, 100, 13226–13239. [Google Scholar] [CrossRef]
- Yanar, F.; Carugo, D.; Zhang, X. Hybrid Nanoplatforms Comprising Organic Nanocompartments Encapsulating Inorganic Nanoparticles for Enhanced Drug Delivery and Bioimaging Applications. Molecules 2023, 28, 5694. [Google Scholar] [CrossRef]
- Lu, S.; Morrow, D.J.; Li, Z.; Guo, C.; Yu, X.; Wang, H.; Schultz, J.D.; O’connor, J.P.; Jin, N.; Fang, F.; et al. Encapsulating Semiconductor Quantum Dots in Supramolecular Cages Enables Ultrafast Guest–Host Electron and Vibrational Energy Transfer. J. Am. Chem. Soc. 2023, 145, 5191–5202. [Google Scholar] [CrossRef]
- Adaikalam, K.; Vikraman, D.; Lee, D.-H.; Cho, Y.-A.; Kim, H.-S. Optical and UV Shielding Properties of Inorganic Nanoparticles Embedded in Polymethyl Methacrylate Nanocomposite Freestanding Films. Polymers 2024, 16, 1048. [Google Scholar] [CrossRef]
- Major, T.A.; Lo, S.S.; Yu, K.; Hartland, G.V. Time-Resolved Studies of the Acoustic Vibrational Modes of Metal and Semiconductor Nano-objects. J. Phys. Chem. Lett. 2014, 5, 866–874. [Google Scholar] [CrossRef] [PubMed]
- Jellinek, J.; Acioli, P.H. Magnesium Clusters: Structural and Electronic Properties and the Size-Induced Nonmetal-to-Metal Transition. J. Phys. Chem. A 2002, 106, 10919–10925. [Google Scholar] [CrossRef]
- El-Achari, T.; Rami, R.; Goumrhar, F.; Drissi, L.; El Bouzaidi, M.D.; Laamara, R.A. Ti, V, Cr, Mn, Co, and Ni substitution effect on structural, electronic, thermodynamic and magnetic properties of MgS and MgSe for spintronics. Mater. Sci. Eng. B 2023, 297, 116723. [Google Scholar] [CrossRef]
- Mohanta, M.K.; Arora, A.; De Sarkar, A. Conflux of tunable Rashba effect and piezoelectricity in flexible magnesium monochalcogenide monolayers for next-generation spintronic devices. Nanoscale 2021, 13, 8210–8223. [Google Scholar] [CrossRef]
- Chand, S.; Thakur, N.; Katyal, S.; Barman, P.; Sharma, V.; Sharma, P. Recent developments on the synthesis, structural and optical properties of chalcogenide quantum dots. Sol. Energy Mater. Sol. Cells 2017, 168, 183–200. [Google Scholar] [CrossRef]
- Varshney, D.; Kaurav, N.; Sharma, U.; Singh, R. Phase transformation and elastic behavior of MgX (X=S, Se, Te) alkaline earth chalcogenides. J. Phys. Chem. Solids 2008, 69, 60–69. [Google Scholar] [CrossRef]
- Gökoğlu, G.; Durandurdu, M.; Gülseren, O. First principles study of structural phase stability of wide-gap semiconductors MgTe, MgS and MgSe. Comput. Mater. Sci. 2009, 47, 593–598. [Google Scholar] [CrossRef]
- Jun, H.; Careem, M.; Arof, A. Quantum dot-sensitized solar cells—Perspective and recent developments: A review of Cd chalcogenide quantum dots as sensitizers. Renew. Sustain. Energy Rev. 2013, 22, 148–167. [Google Scholar] [CrossRef]
- Matthews, P.D.; Akhtar, M.; Malik, M.A.; Revaprasadu, N.; O’Brien, P. Synthetic routes to iron chalcogenide nanoparticles and thin films. Dalton Trans. 2016, 45, 18803–18812. [Google Scholar] [CrossRef]
- Pejjai, B.; Reddy, V.R.M.; Gedi, S.; Park, C. Status review on earth-abundant and environmentally green Sn-X (X = Se, S) nanoparticle synthesis by solution methods for photovoltaic applications. Int. J. Hydrogen Energy 2017, 42, 2790–2831. [Google Scholar] [CrossRef]
- Abutbul, R.E.; Segev, E.; Argaman, U.; Makov, G.; Golan, Y. π-Phase Tin and Germanium Monochalcogenide Semiconductors: An Emerging Materials System. Adv. Mater. 2018, 30, e1706285. [Google Scholar] [CrossRef] [PubMed]
- Peccerillo, E.; Durose, K. Copper–Antimony and copper–Bismuth chalcogenides—Research opportunities and review for solar photovoltaics. MRS Energy Sustain. 2018, 5, E13. [Google Scholar] [CrossRef]
- Karantagli, E.; Sigalas, M.; Garoufalis, C.S. Exotic nanoparticles of group IV monochalcogenides. Solid State Commun. 2019, 295, 38–42. [Google Scholar] [CrossRef]
- Wobbe, M.C.C.; Zwijnenburg, M.A. Chemical trends in the optical properties of rocksalt nanoparticles. Phys. Chem. Chem. Phys. 2015, 17, 28892–28900. [Google Scholar] [CrossRef]
- Chronis, A.G.; Sigalas, M.M.; Koukaras, E.N. Absorption spectrum of magnesium and aluminum hydride nanoparticles. Mater. Chem. Phys. 2019, 228, 244–253. [Google Scholar] [CrossRef]
- Chronis, A.G.; Michos, F.I.; Garoufalis, C.S.; Sigalas, M.M. Structural and optical properties of Be, Mg and Ca nanorods and nanodisks. Phys. Chem. Chem. Phys. 2021, 23, 1849–1858. [Google Scholar] [CrossRef]
- Aravantinos-Zafiris, N.; Chronis, A.G.; Sigalas, M.M. Structural and optical properties of exotic magnesium monochalcogenide nanoparticles. Mater. Today Commun. 2021, 28, 102622. [Google Scholar] [CrossRef]
- Perdew, J.P.; Burke, K.; Ernzerhof, M. Generalized gradient approximation made simple. Phys. Rev. Lett. 1996, 77, 3865–3868. [Google Scholar] [CrossRef]
- Weigend, F.; Ahlrichs, R. Balanced basis sets of split valence, triple zeta valence and quadruple zeta valence quality for H to Rn: Design and assessment of accuracy. Phys. Chem. Chem. Phys. 2005, 7, 3297–3305. [Google Scholar] [CrossRef]
- TURBOMOLE; TURBOMOLE GmbH: Karlsruhe, Germany, 2019.
- Aravantinos-Zafiris, N.; Sigalas, M.M. Phononic Band Gaps in Graphene-Like Materials and Nanotubes. J. Surfaces Interfaces Mater. 2013, 1, 184–188. [Google Scholar] [CrossRef]
- Sgouros, A.P.; Neupane, M.R.; Sigalas, M.M.; Aravantinos-Zafiris, N.; Lake, R.K. Nanoscale phononic interconnects in THz frequencies. Phys. Chem. Chem. Phys. 2014, 16, 23355–23364. [Google Scholar] [CrossRef]
Disclaimer/Publisher’s Note: The statements, opinions and data contained in all publications are solely those of the individual author(s) and contributor(s) and not of MDPI and/or the editor(s). MDPI and/or the editor(s) disclaim responsibility for any injury to people or property resulting from any ideas, methods, instructions or products referred to in the content. |
© 2024 by the authors. Licensee MDPI, Basel, Switzerland. This article is an open access article distributed under the terms and conditions of the Creative Commons Attribution (CC BY) license (https://creativecommons.org/licenses/by/4.0/).
Share and Cite
Aravantinos-Zafiris, N.; Michos, F.I.; Sigalas, M.M. Vibrational Spectrum of Magnesium Monochalcogenide Nanoparticles. Nanomaterials 2024, 14, 1918. https://doi.org/10.3390/nano14231918
Aravantinos-Zafiris N, Michos FI, Sigalas MM. Vibrational Spectrum of Magnesium Monochalcogenide Nanoparticles. Nanomaterials. 2024; 14(23):1918. https://doi.org/10.3390/nano14231918
Chicago/Turabian StyleAravantinos-Zafiris, Nikos, Fotios I. Michos, and Michail M. Sigalas. 2024. "Vibrational Spectrum of Magnesium Monochalcogenide Nanoparticles" Nanomaterials 14, no. 23: 1918. https://doi.org/10.3390/nano14231918
APA StyleAravantinos-Zafiris, N., Michos, F. I., & Sigalas, M. M. (2024). Vibrational Spectrum of Magnesium Monochalcogenide Nanoparticles. Nanomaterials, 14(23), 1918. https://doi.org/10.3390/nano14231918