Article

Core-Shell Fe3O4@C Nanoparticles as Highly Effective T2 Magnetic Resonance Imaging Contrast Agents: In Vitro and In Vivo Studies

1
Department of Chemistry, College of Natural Sciences, Kyungpook National University, Taegu 41566, Republic of Korea
2
Division of Biomedical Science, School of Medicine, Kyungpook National University, Taegu 41944, Republic of Korea
3
Theranocure, Medlifescience Bldg. 1, Chilgok, Bukgu, Taegu 41405, Republic of Korea
4
Department of Biology Education, Teachers’ College, Kyungpook National University, Taegu 41566, Republic of Korea
5
Department of Molecular Medicine, School of Medicine, Kyungpook National University, Taegu 41944, Republic of Korea
*
Authors to whom correspondence should be addressed.
These authors contributed equally to this work.
Current address: School of Chemical & Environmental Engineering, Pingdingshan University, Pingdingshan 467000, China.
Nanomaterials 2024, 14(2), 177; https://doi.org/10.3390/nano14020177
Submission received: 19 December 2023 / Revised: 8 January 2024 / Accepted: 9 January 2024 / Published: 12 January 2024
(This article belongs to the Section Biology and Medicines)

Abstract

:
Magnetite nanoparticles (Fe3O4 NPs) have been intensively investigated because of their potential biomedical applications due to their high saturation magnetization. In this study, core–shell Fe3O4@C NPs (core = Fe3O4 NPs and shell = amorphous carbons, davg = 35.1 nm) were synthesized in an aqueous solution. Carbon coating terminated with hydrophilic –OH and –COOH groups imparted excellent biocompatibility and hydrophilicity to the NPs, making them suitable for biomedical applications. The Fe3O4@C NPs exhibited ideal relaxometric properties for T2 magnetic resonance imaging (MRI) contrast agents (i.e., high transverse and negligible longitudinal water proton spin relaxivities), making them exclusively induce only T2 relaxation. Their T2 MRI performance as contrast agents was confirmed in vivo by measuring T2 MR images in mice before and after intravenous injection.

1. Introduction

Magnetite nanoparticles (Fe3O4 NPs) have attracted considerable attention in many application areas, including environmental treatment [1,2,3], food analysis [4,5,6], biosensors [7,8], protein immobilization [9], targeted drug delivery [10,11,12,13,14], separation [15,16,17], magnetic resonance imaging (MRI) [18,19,20,21,22,23,24,25,26,27], magnetofection [28,29], tissue engineering [30], and hyperthermia [31,32]. In particular, their good biocompatibility, as verified by the U.S. Food and Drug Administration [33], facilitates their commercialization.
The high attraction of Fe3O4 NPs originates from their excellent magnetic properties and good biocompatibility [34]. However, their high surface energy and dipole–dipole interaction make them unstable and prone to aggregation [35]. Consequently, the modification of their surfaces is essential for biomedical applications. They can achieve this goal using protective and non-magnetic shell coating [36,37]. Carbon coating terminated with hydrophilic functional groups is a promising surface-coating option because carbon is nontoxic and chemically inert.
The saturation magnetization (Ms) of Fe3O4 NPs increases with an increasing particle size toward the bulk value (93–98 emu/g) [38,39,40]. Consequently, their relaxometric properties become more favorable to transverse (T2) water proton spin relaxation induction than to longitudinal (T1) water proton spin relaxation induction with increasing particle size. Under such conditions, they can exclusively induce only the T2 water proton spin relaxation, making them function as highly effective T2 MRI contrast agents.
Herein, we synthesized large Fe3O4 NPs for use as T2 MRI contrast agents. We followed our former strategy of coating carbon on the Fe3O4 NPs via the carbonization of dextrose in aqueous media in the presence of Fe3O4 NPs [36,37]. This process leaves a large amount of –OH and some –COOH groups on the terminal carbon shells, allowing for good colloidal stability of the resulting carbon-coated Fe3O4 NPs (i.e., core–shell Fe3O4@C NPs) in aqueous media. However, there exist only a few studies on water proton spin relaxivities [41] and in vivo MRI [42] of Fe3O4@C NPs. Herein, the magnetic properties, water proton spin relaxivities, in vitro cellular cytotoxicity, and in vivo T2 MR images were obtained to demonstrate the potential of the Fe3O4@C NPs as contrast agents in T2 MRI. We found that the synthesized Fe3O4@C NPs are highly effective T2 MRI contrast agents based on their ideal relaxometric properties for T2 MRI contrast agents (i.e., high transverse (r2) and negligible longitudinal (r1) water proton spin relaxivities). We found that the Fe3O4@C NPs were very effective in liver imaging as T2 MRI contrast agents.

2. Materials and Methods

2.1. Chemicals

FeSO4·7H2O (≥99%), NaOH (>99.99%), and dextrose (C6H12O6) (>99.5%) were purchased from Sigma-Aldrich (St. Louis, MO, USA), and used as received. Triple-distilled water was used for washing the NPs and preparing the NP colloidal solution.

2.2. Synthesis

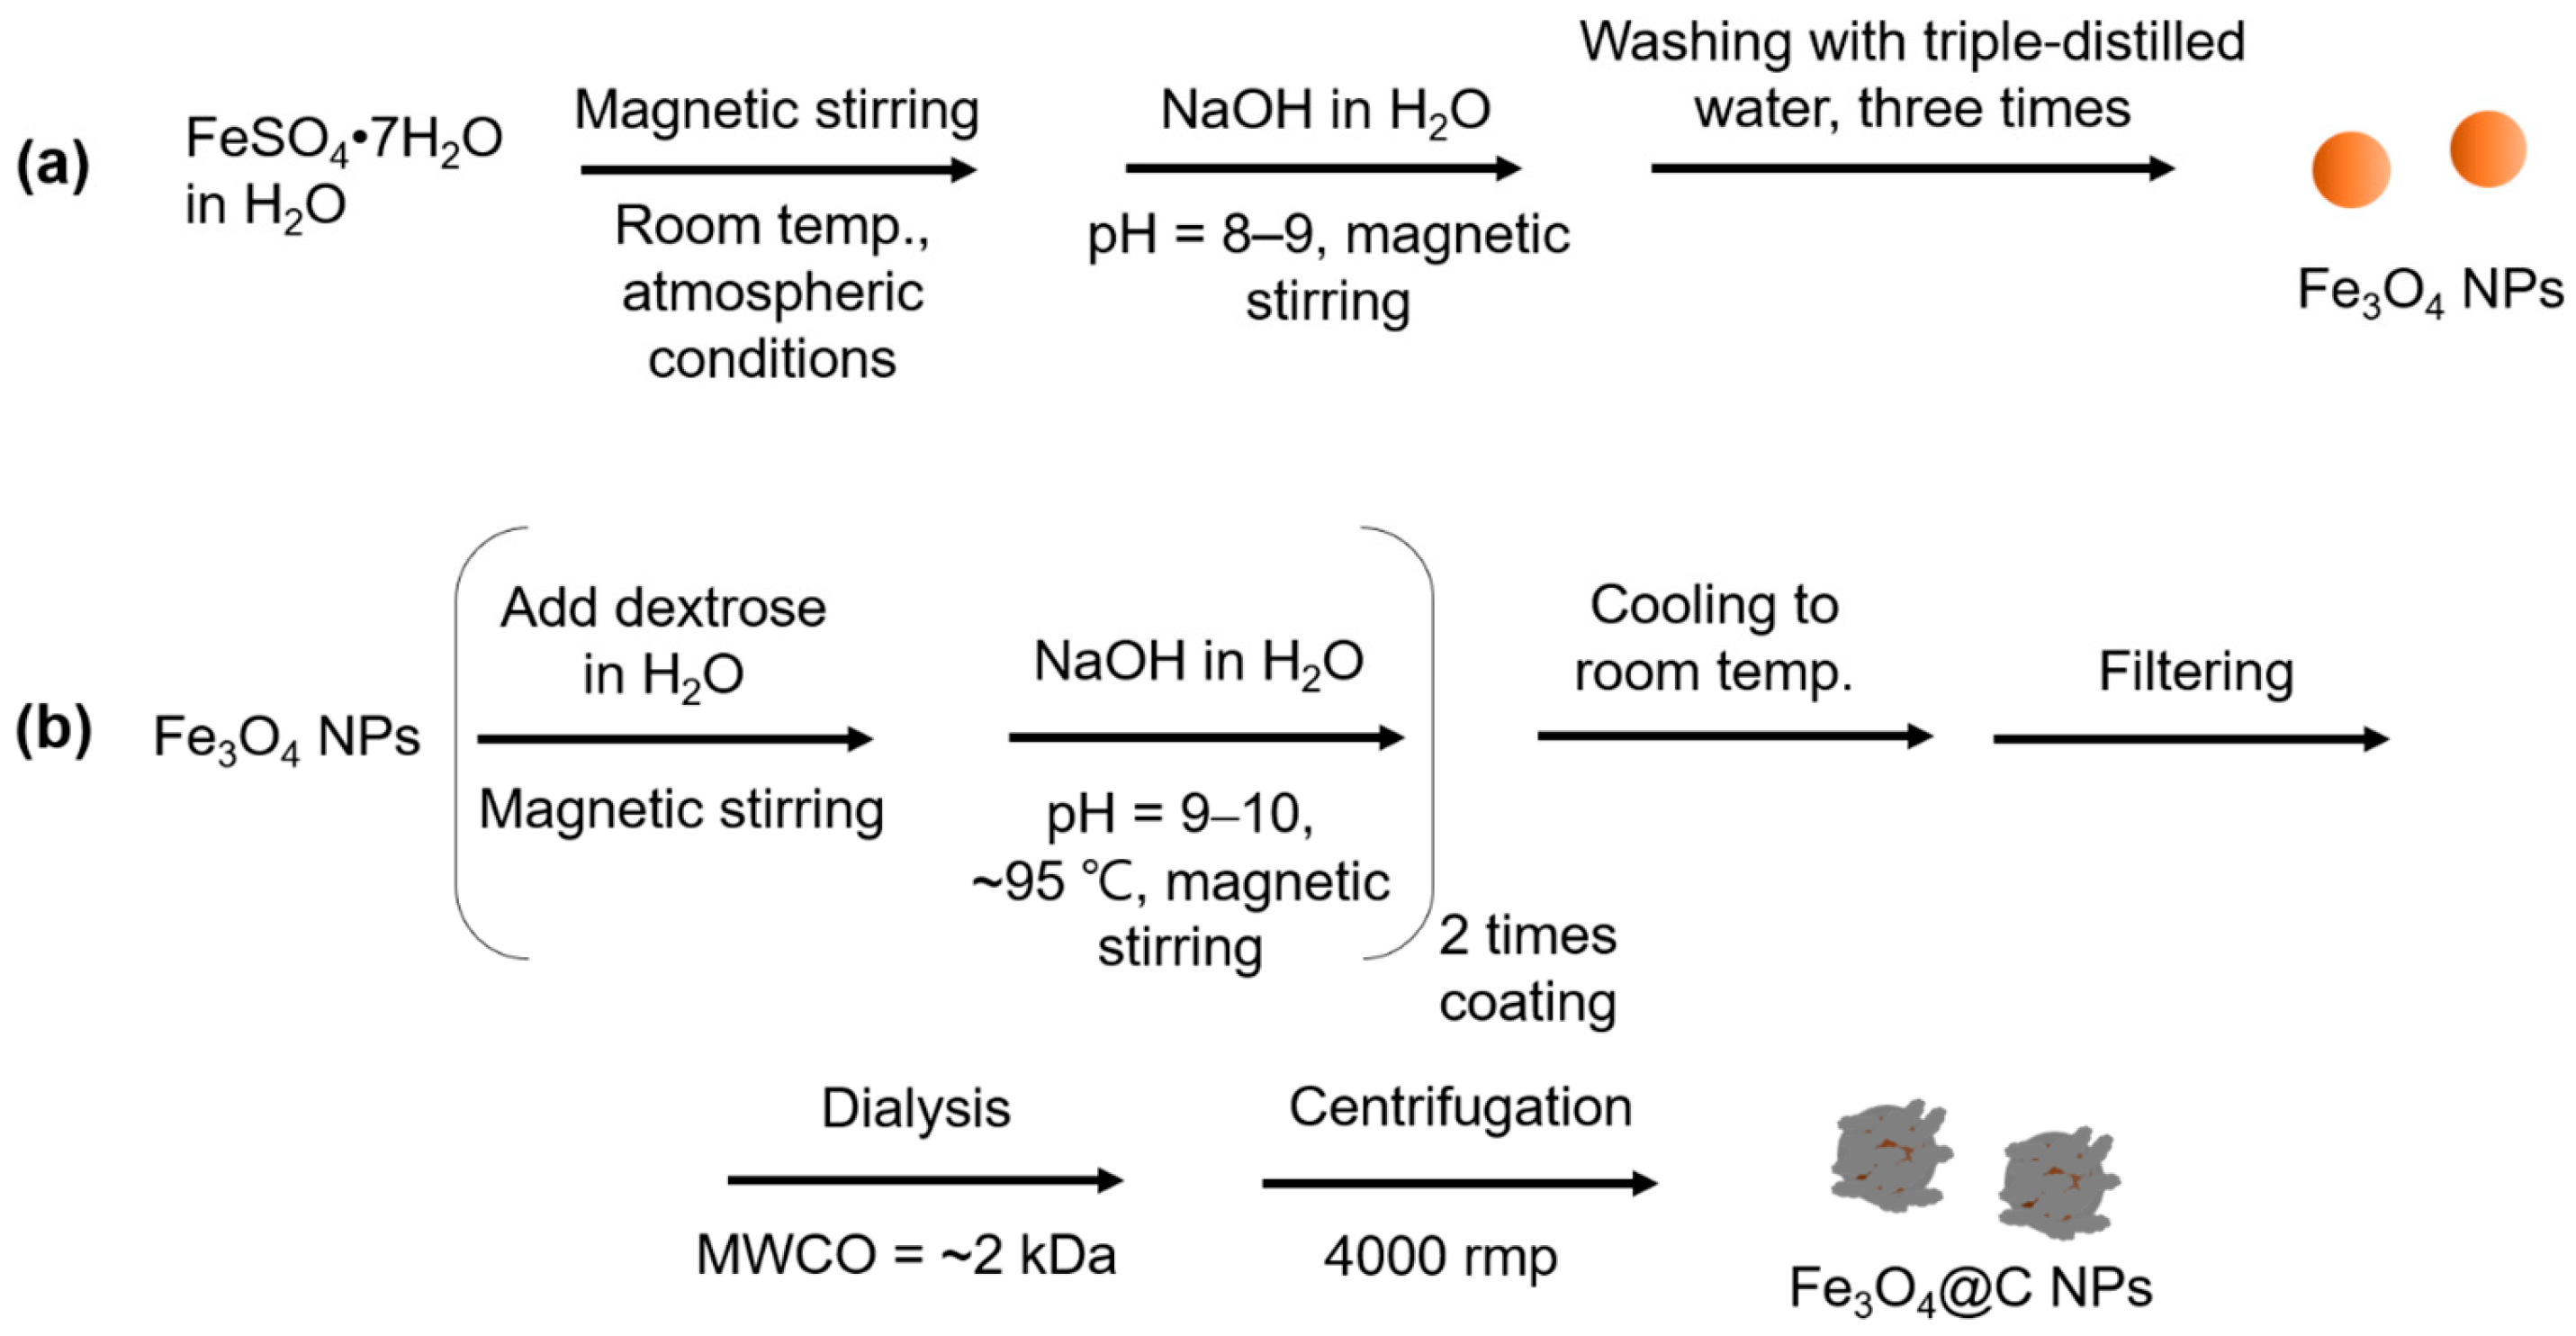
2.2.1. Synthesis of the Fe3O4 NPs

First, 0.5 mmol of FeSO4·7H2O was added into a 50 mL beaker containing 20 mL of triple-distilled water at room temperature (22 °C) with magnetic stirring under atmospheric conditions (Figure 1a). Then, 10 mmol of NaOH dissolved in 20 mL of triple-distilled water was gradually added to the aforementioned solution to obtain a pH of 8–9 with continuous magnetic stirring for 30 min. The solution was transferred to a 500 mL beaker containing 400 mL of triple-distilled water and then magnetically stirred for 0.5 h. The product solution was placed in a refrigerator (~5 °C) to obtain the Fe3O4 NP precipitation. The top solution containing Na+, OH, and unreacted precursors was removed, and the remaining Fe3O4 NPs were washed thrice using the same process.

2.2.2. Synthesis of the Core-Shell Fe3O4@C NPs

The previously obtained Fe3O4 NPs were added into a 100 mL three-necked round-bottom flask containing 1 mmol of dextrose in 10 mL of triple-distilled water at room temperature with magnetic stirring under atmospheric conditions (Figure 1b). After 30 min of magnetic stirring, 4 mmol of NaOH dissolved in 5 mL of triple-distilled water was gradually added to the aforementioned solution to make the solution pH 9–10, followed by 2 h of magnetic stirring at ~95 °C to coat the Fe3O4 NPs with amorphous carbon via carbonization of dextrose. This coating process was repeated twice to increase the coating thickness. The reaction solution temperature decreased to room temperature and the solution underwent filtering using Whatman filter paper. Na+, OH, and free dextrose were removed via dialysis (MWCO = ~2 kDa) using 1 L of deionized water with magnetic stirring for 3 days, and the outside water solution was replaced thrice with deionized water. After dialysis, free carbon NPs were removed through decantation of the supernatant solution following centrifugation at 4000 rpm for 0.7 h (VS-4000 N, Vision Scientific Co., Ltd, Bucheon, Republic of Korea). This process was repeated thrice following the redispersion of the settled NPs in the centrifuge tube with triple-distilled water. The final Fe3O4@C NP solution was split into two portions. One portion was used for the NP solution sample preparation in triple-distilled water, and the other portion was lyophilized in vacuum to obtain powder sample.

2.3. Characterization

The average particle diameter (davg) and morphology of the Fe3O4@C NPs were measured using high-resolution transmission electron microscopy (HRTEM) (Titan G2 ChemiSTEM CS Probe, FEI, Hillsboro, OR, USA). Two drops of the aqueous solution sample were placed on a 200-mesh copper grid covered with a carbon film (PELCO no.160, Ted Pella, Inc., Redding, CA, USA), followed by drying in air. High-angle annular dark-field scanning transmission electron microscopy (HAADF-STEM) images with elemental mapping were obtained to confirm the carbon coating. The Fe-concentration in the aqueous solution sample was estimated using inductively coupled plasma-atomic emission spectroscopy (Optima 7300DV and Avio500, Perkin Elmer, Waltham, MA, USA). Zeta potential (ζ) was measured (Malvern Panalytical, Zetasizer Nano ZS, Westborough, MA, USA) using a diluted solution sample. The crystal structure of the powder samples was measured using a multi-purpose X-ray diffraction (XRD) spectrometer (X’PERT PRO MRD, Philips, Almelo, The Netherlands) equipped with unfiltered CuKα radiation (λ = 0.154184 Å) using a scan range of 2θ = 15–100° and a scan step of 2θ = 0.03°. The carbon coating on the Fe3O4 NP surfaces was investigated by recording the Fourier transform infrared (FT-IR) absorption spectra (Galaxy 7020A, Mattson Instruments, Inc., Madison, WI, USA) using the power sample in KBr as pellets. The relative amounts of carbon coating and Fe3O4 NPs were assessed through thermogravimetric analysis (TGA) (SDT-Q6000, TA Instruments, New Castle, DE, USA). In addition, the carbon-coating composition (C/H/O) and amount were estimated via elemental analysis (EA; Flash 2000, ThermoFisher, Waltham, MA, USA). The magnetic properties of the powder sample (20–30 mg) were characterized by recording a magnetization (M)-applied field (H) curve (−2.0 T ≤ H ≤ 2.0 T) at 300 K using a vibrating sample magnetometer (7407-S, Lake Shore Cryotronics Inc., Westerville, OH, USA). The mass-corrected magnetization (i.e., net M) of the core Fe3O4 NPs without surface-coating carbon shell was obtained based on the net mass of the Fe3O4 NPs obtained from the TGA curve.

2.4. Water Proton Spin Relaxivities and Map Images

The T1 and T2 water proton spin relaxation times and longitudinal (R1) and transverse (R2) map images were measured at 22 °C using a 3-T MRI scanner (MAGNETOM Trio Tim, Siemens, Munchen, Bayern, Germany). The original sample solution was diluted with triple-distilled water to obtain diluted NP colloidal solutions with 0.1, 0.05, 0.025, 0.0125, and 0.00625 mM [Fe]. T1 relaxation times were measured using an inversion recovery method, while T2 relaxation times were obtained using multiple spin-echo appraisal with the Carr–Purcell–Meiboom–Gill pulse sequence. The r1 and r2 values were obtained from the linear fitting plot slopes of 1/T1 and 1/T2 inverse relaxation times versus Fe concentration, respectively.

2.5. In Vitro Cellular Cytotoxicity

A Luminescent Cell Viability Assay kit (CellTiter-Glo, Promega, Madison, WI, USA) was used for in vitro cellular cytotoxicity estimation of the NPs. Adenosine triphosphate was detected using a luminometer (Victor 3, Perkin Elmer, Waltham, MA, USA). Human prostate cancer (DU145) and normal mouse hepatocyte (NCTC1469) cell lines were used for the tests. The cells were seeded onto a 24-well cell culture plate and incubated for 24 h (5 × 10⁴ cell density, 500-μL cells per well, 5% CO2, and 37 °C). Five test NP colloidal solutions (with 10, 50, 100, 200, and 500 μM [Fe]) were prepared via dilution of the NP colloidal solution with a sterile phosphate buffer saline solution, from which 2 μL was taken out to drop onto the cells, followed by incubation for 48 h. The cell viability was determined, followed by normalization with respect to those of the control cells with 0 mM [Fe]. The average cell viability was obtained via three measurements.

2.6. In Vivo MRI Experiments

All in vivo mouse experiments were authorized by the Animal Research Committee of Kyungpook National University and conducted in accordance with its rules and guidelines. A 3-T MRI scanner was used to obtain T2 MR images. The 1.5% isoflurane in oxygen was used for anesthetization of ICR (Institute of Cancer Research, London, UK) mice (~30 g) for imaging. Two mice (N = 2) were used. MR image acquisition was conducted prior to and following intravenous injection (IV) of the sample solution into the mice tails at an injection dose of 0.05 mmol Fe per kg mice. A warm water blanket was used to maintain the mice’s body temperature at ~37 °C during imaging. The T2 MR images were obtained using the following parameters: MR field = 3 T, number of slices = 11, number of acquisitions = 2, field of view (FOV) = 10 cm, phase FOV = 1, spacing gap = 0.1 mm, frequency = 300 Hz, phase = 300, temperature = 37 °C, slice thickness = 1.5 mm, repetition time (TR) = 4300 ms, and echo time (TE) = 45 ms.

3. Results

3.1. Particle Diameter and Crystallinity of the Fe3O4@C NPs

The particle diameter of the Fe3O4@C NPs was estimated from the HRTEM images (Figure 2a,b), and a core-shell structure with a carbon shell at the border of the Fe3O4 NPs was observed in the magnified HRTEM image (Figure 2b). Clear lattice fringes of the core Fe3O4 NP with an interplanar distance of d = 0.297 nm, corresponding to the (022) planes of cubic Fe3O4, were observed (Figure 2c), confirming the successful synthesis of the Fe3O4 NPs. The davg of the Fe3O4@C NPs of 35.1 ± 1.4 nm (Table 1) was estimated from the log-normal function that fit to the observed particle diameter distribution (Figure 2d). To further confirm the existence of the surface carbon shell, elemental mapping of C, Fe, and O in the Fe3O4@C NPs was performed. Figure 2e–i show the HAADF-STEM images of the Fe3O4@C NPs and the elemental mapping of Fe (red), O (blue), and C (green). A higher intensity of carbon on the core Fe3O4 NPs compared with that of background carbon film was observed (Figure 2i), confirming the successful carbon-shell coating on the Fe3O4 NP surfaces. The observed high zeta potential (ζ = −32.2 mV) of the Fe3O4@C NPs in aqueous solution confirmed their good colloidal stability (Figure 2j and Table 1).
The XRD patterns of the Fe3O4 and Fe3O4@C NPs (Figure 2k) exhibited clear sharp peaks matching the cubic Fe3O4 reference pattern [43], demonstrating the successful synthesis of the face-centered cubic (FCC) Fe3O4 NPs. The cell constant was estimated to be 8.396 Å, consistent with the reported value of 8.3963 ± 0.0005 Å [43]. A broad peak at 2θ = ~21° (labeled as *) for the Fe3O4@C NPs, which did not appear for the Fe3O4 NPs, is due to amorphous carbon [44], confirming the successful carbon coating on Fe3O4 NP surfaces.

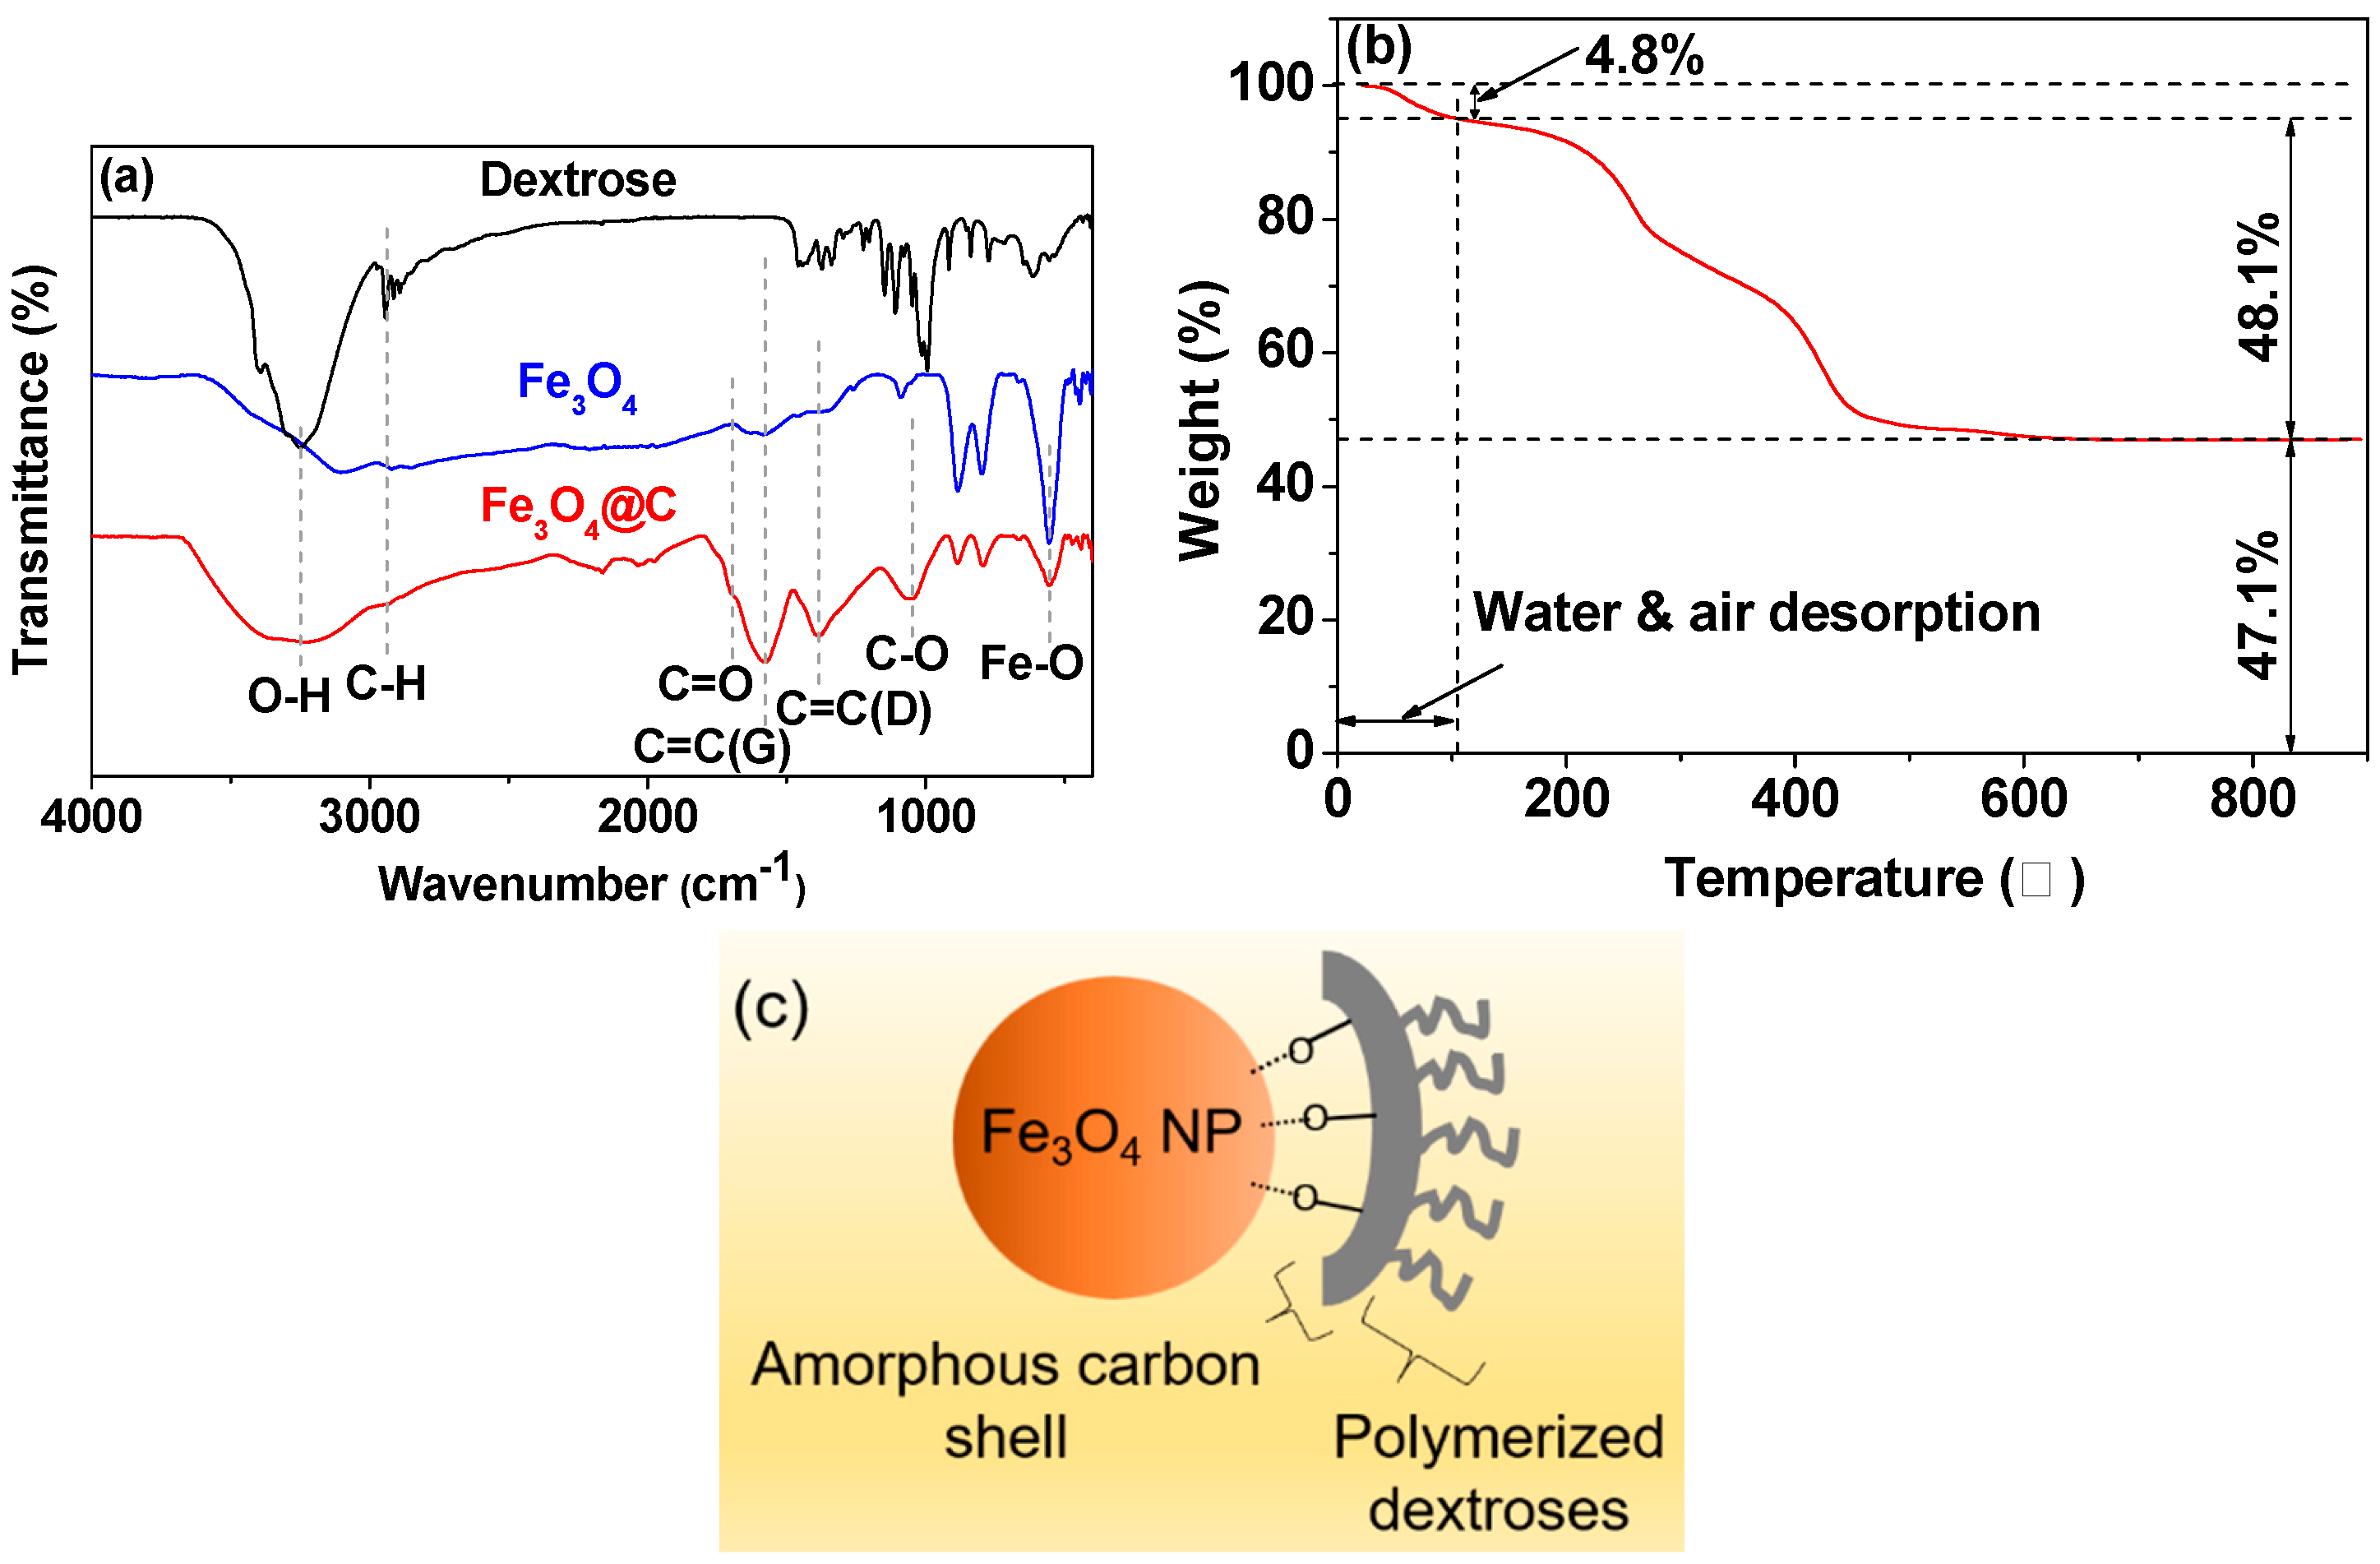
3.2. Surface-Coating Analysis

To investigate the carbon coating, the FT-IR absorption spectra (Figure 3a) of the Fe3O4 NPs, the Fe3O4@C NPs, and dextrose pelletized in KBr were recorded. Two specific peaks at 1384 and 1578 cm−1 in the FT-IR absorption spectrum of the Fe3O4@C NPs, corresponding to C=C (D) and C=C (G) vibrations [45] (Table 2), respectively, were observed, supporting the successful amorphous carbon coating on the Fe3O4 NP surfaces. These two peaks do not exist in the spectrum of free dextrose because there is no C=C bonding in dextrose. The C=O stretching peak at 1699 cm−1 confirmed the existence of –COOH groups on the carbon-coating surfaces. The strong stretching peaks of O–H at 3248 cm−1 and C–O at 1048 cm−1 confirmed the presence of a large amount of –OH in the carbon-coating shell. The existence of these two hydrophilic groups supports the observed high zeta potential and good colloidal stability in aqueous media. Note that the observed O–H peak is different from the H–O–H stretching peak of water at 3398 cm−1. The Fe3O4 NPs in the sample were supported by the strong Fe–O stretching vibration at 556 cm−1.
The carbon coating amount in weight percent (wt.%) was estimated to be 48.1% from the TGA curve (Figure 3b and Table 1). The initial mass drop (4.8%) was due to water and air desorption from the sample. The remaining 47.1% after TGA was due to iron oxide NPs. In addition, the carbon coating wt.% including water and air was estimated to be 58.04% (Table 1) using EA by summing the wt.% of C/H/O = 28.90/3.11/26.03, and the remaining mass of 41.96% was due to the Fe3O4 NPs. Owing to the high melting point of Fe3O4, i.e., 1577 °C, the Fe3O4 NPs will not decompose during EA. Therefore, the oxygen from EA exists mainly due to the surface-coating carbon layer with the minor contribution from air and water, which are contained in the surface-coating carbon layer. The C/H/O molar ratio of 1.48/1.91/1.00 estimated from the aforementioned results supports the existence of a large amount of aliphatic carbon and hydroxyl groups, as observed in the FT-IR absorption spectrum, because fully carbonized carbon does not contain H and O. When considering the C/H/O (1/2/1) molar ratio of dextrose, the 1.48 molar ratio of C/O in the sample was only raised by 0.4 from 1.0 of dextrose, supporting the incomplete carbonization of dextrose (i.e., not infinite C/O ratio). Therefore, the fully carbonized amorphous carbon amount was roughly estimated to be 32.43% (= 0.48/1.48), and the remaining 67.57% was the incompletely carbonized dextrose (or polymerized dextrose, because carbonization proceeds through dextrose polymerization [46,47]). The core-shell structure of the Fe3O4@C NPs, showing the outer polymerized dextroses with a large number of –OH groups and the inner amorphous carbon shell covering the core Fe3O4 NP surfaces, is presented based on this in Figure 3c.

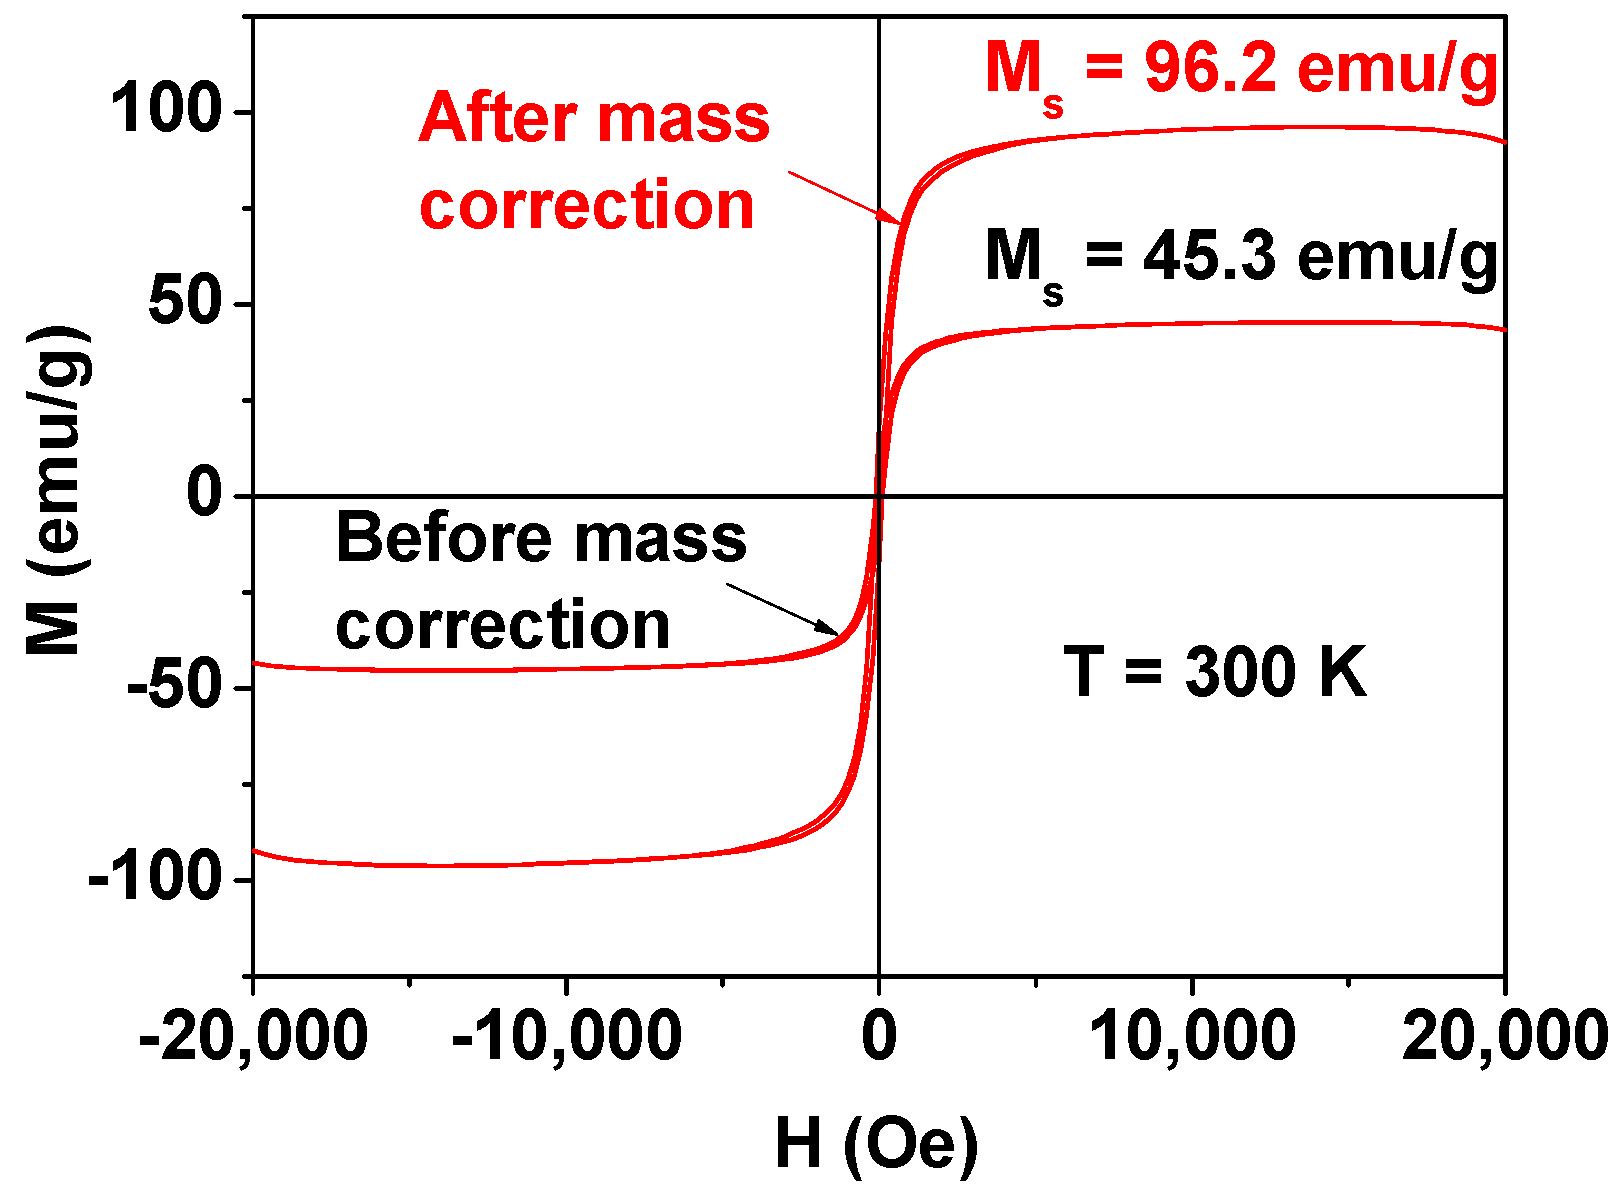
3.3. Magnetic Property

Figure 4 exhibits the M–H curves of the Fe3O4@C NPs before and after mass correction. By using the estimated net Fe3O4 amount from the TGA data, the mass-corrected (i.e., net) magnetization (M) of the Fe3O4 NPs was 96.2 emu/g, which was similar to the bulk value of 93–98 emu/g [38,39,40].

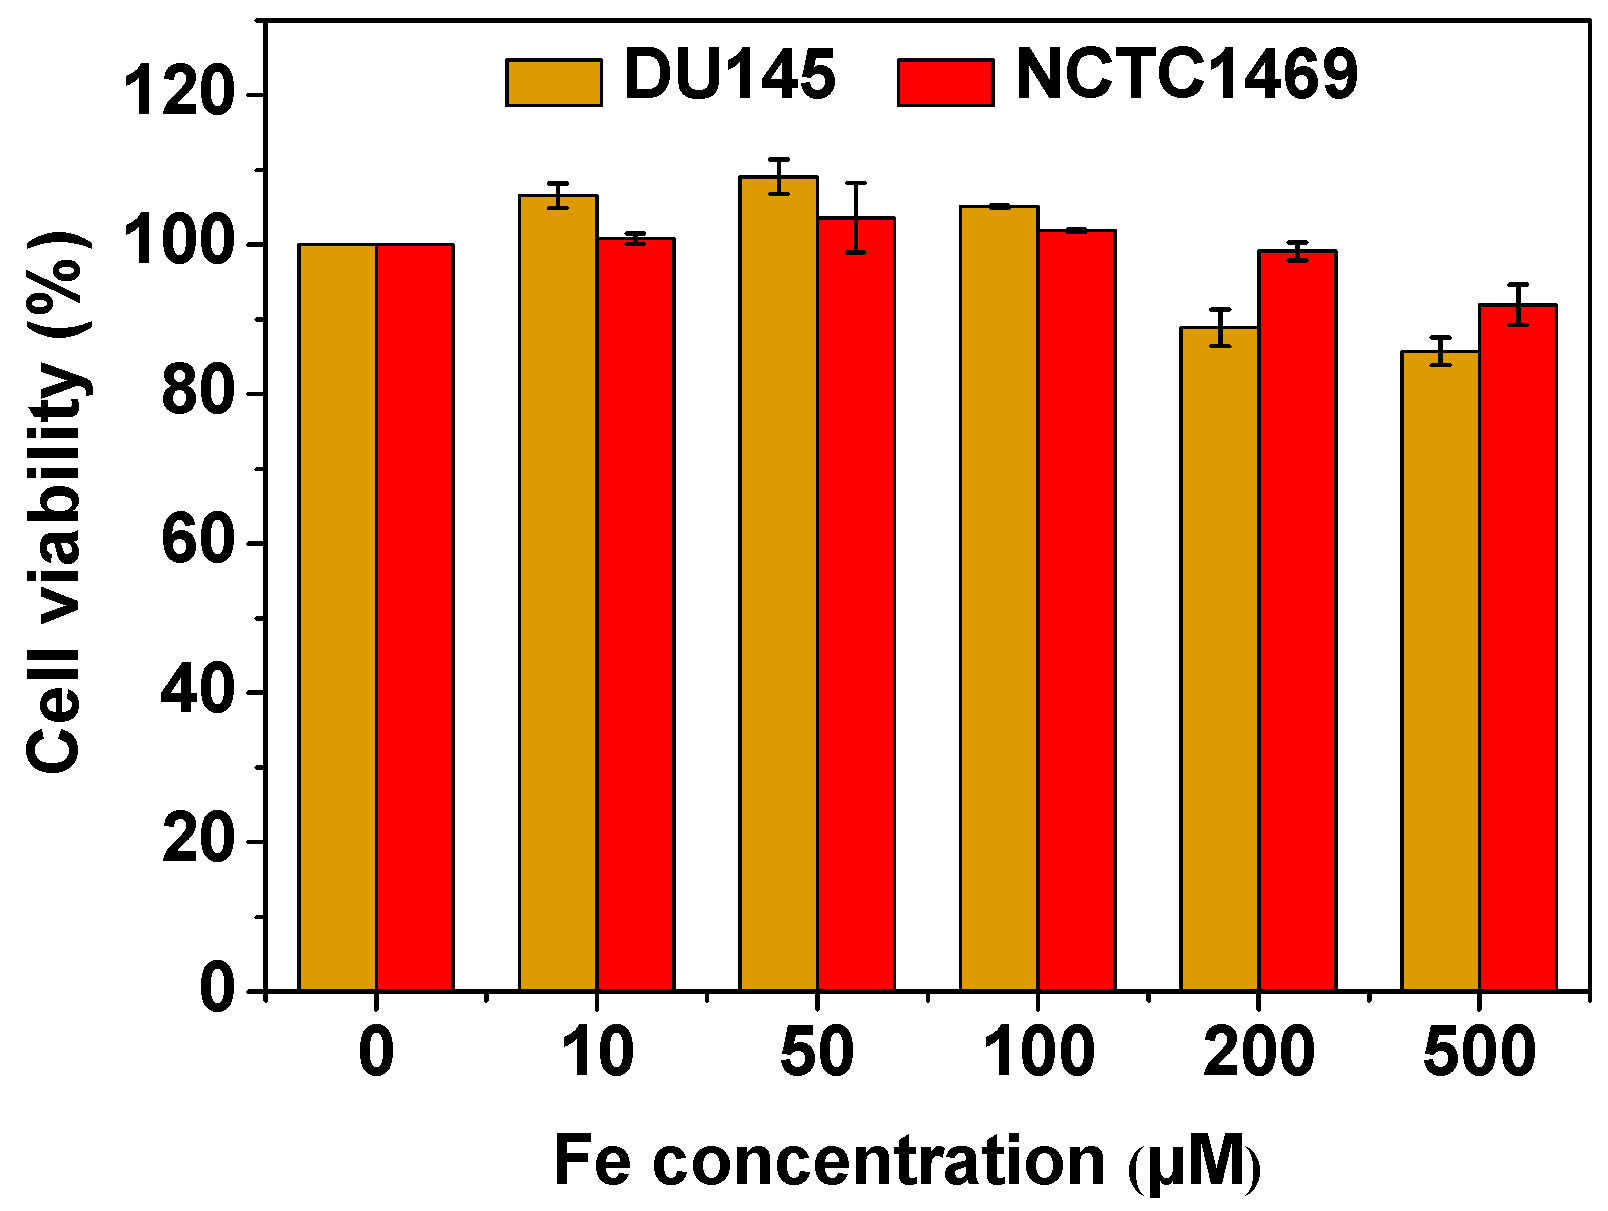
3.4. In Vitro Cellular Cytotoxicity

Because of the good biocompatibility of Fe3O4 and amorphous carbon, good cell viability (>85%) was observed in the cell viability assay of the DU145 and NCTC1469 cells up to 500 μM [Fe] (Figure 5). In addition, the good biocompatibility of the Fe3O4@C NPs was confirmed from mice survival following the in vivo MRI experiments.

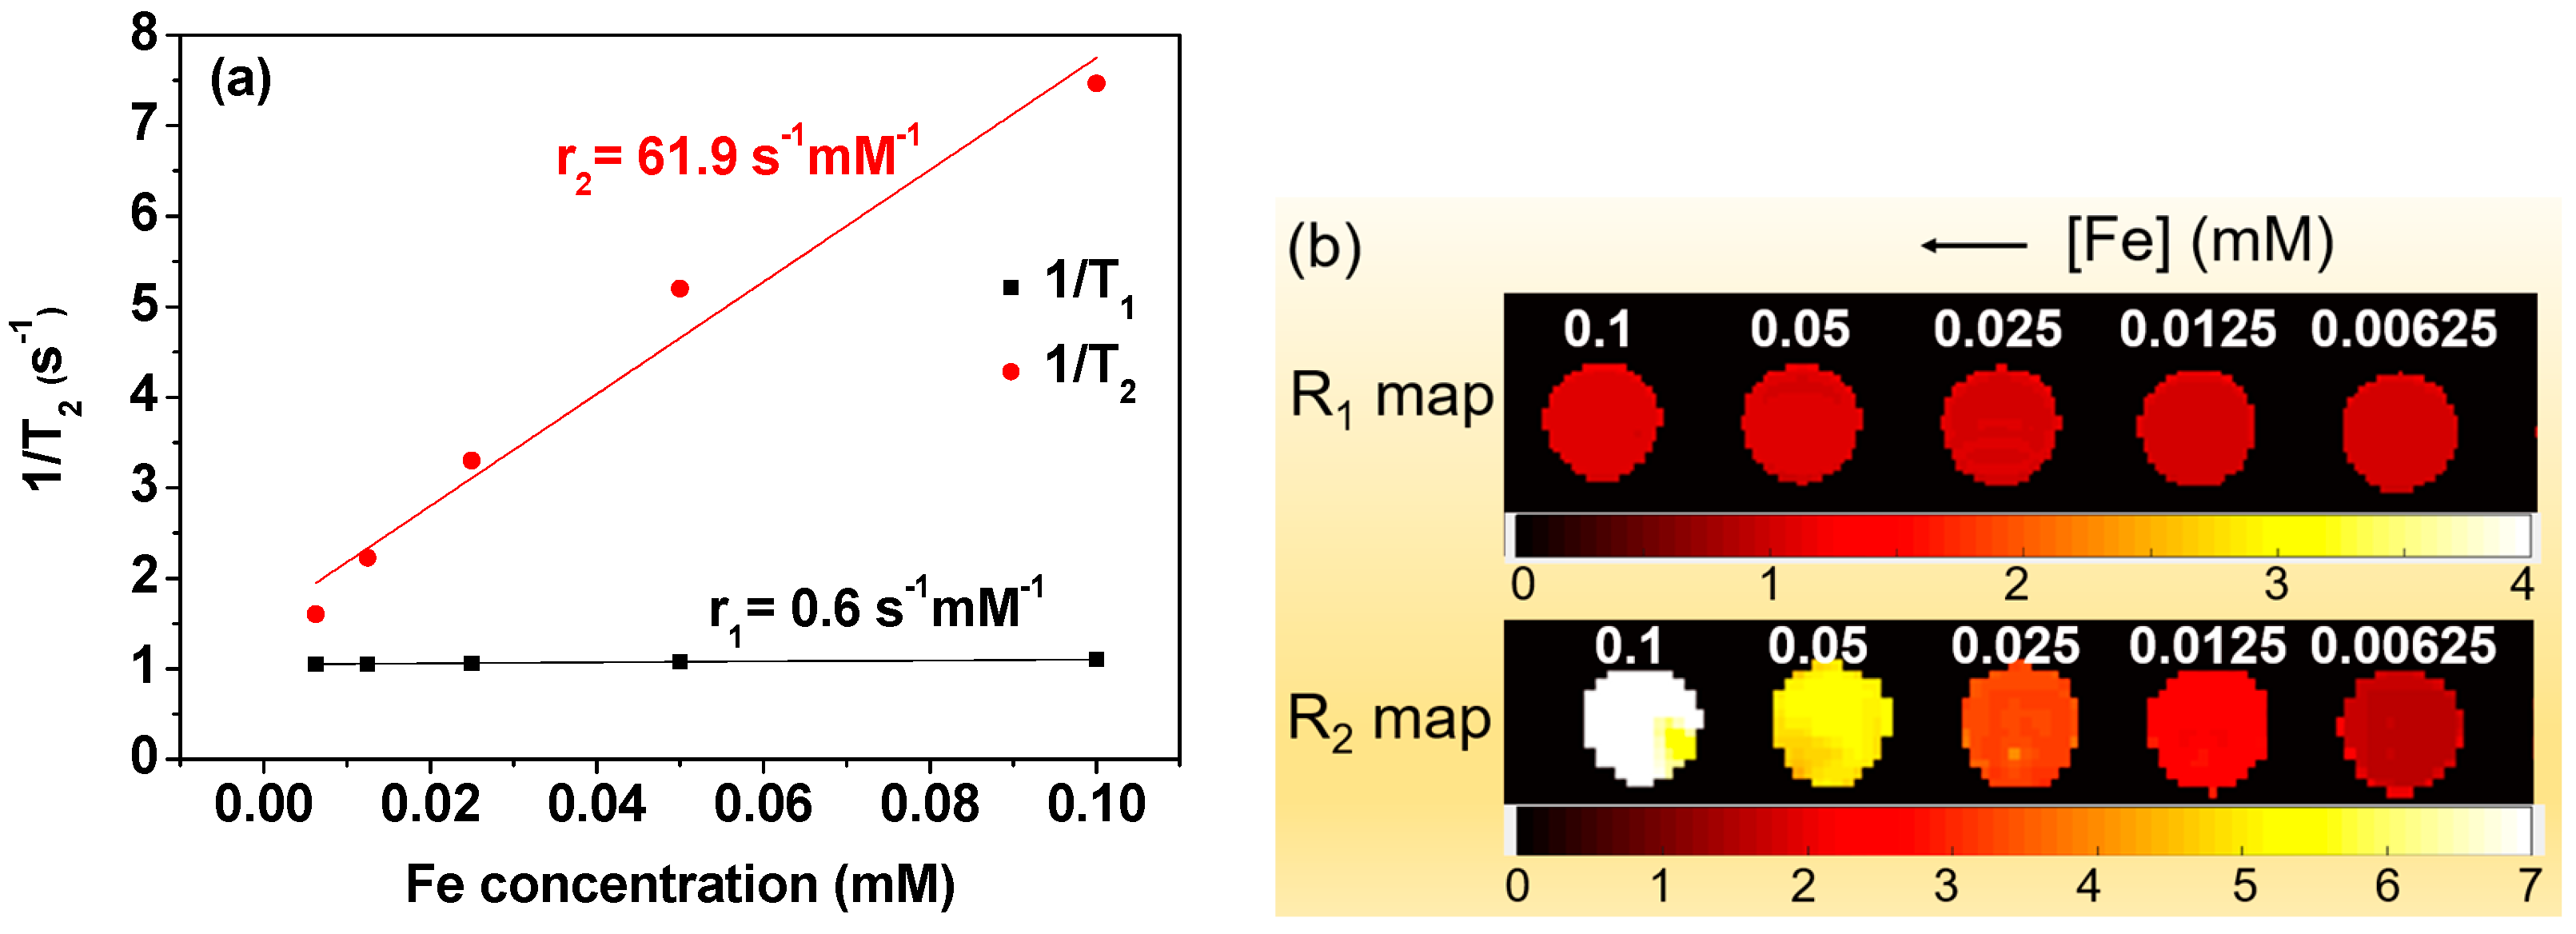
3.5. r1 and r2 Values and R1 and R2 Map Images

To characterize the potential of the Fe3O4@C NPs as T2 MRI contrast agents, their r1 and r2 values were estimated from the linear fitting plots of 1/T1 and 1/T2 inverse relaxation times versus Fe concentration (Figure 6a). The high r2 (=61.9 s−1 mM−1) and very low r1 (=0.6 s−1 mM−1) values (Table 1) indicate that the Fe3O4@C NPs can exclusively induce only T2 water proton spin relaxation with minimal induction of T1 water proton spin relaxation. This was clearly visualized in the R1 and R2 map images, in which the evidently clear dose-dependent contrast enhancement was observed only in the R2 map images whereas no such contrast enhancement was observed in the R1 map images (Figure 6b). Note that as the Fe concentration increased, the color in map images was made to become whiter in both R1 and R2 map images.

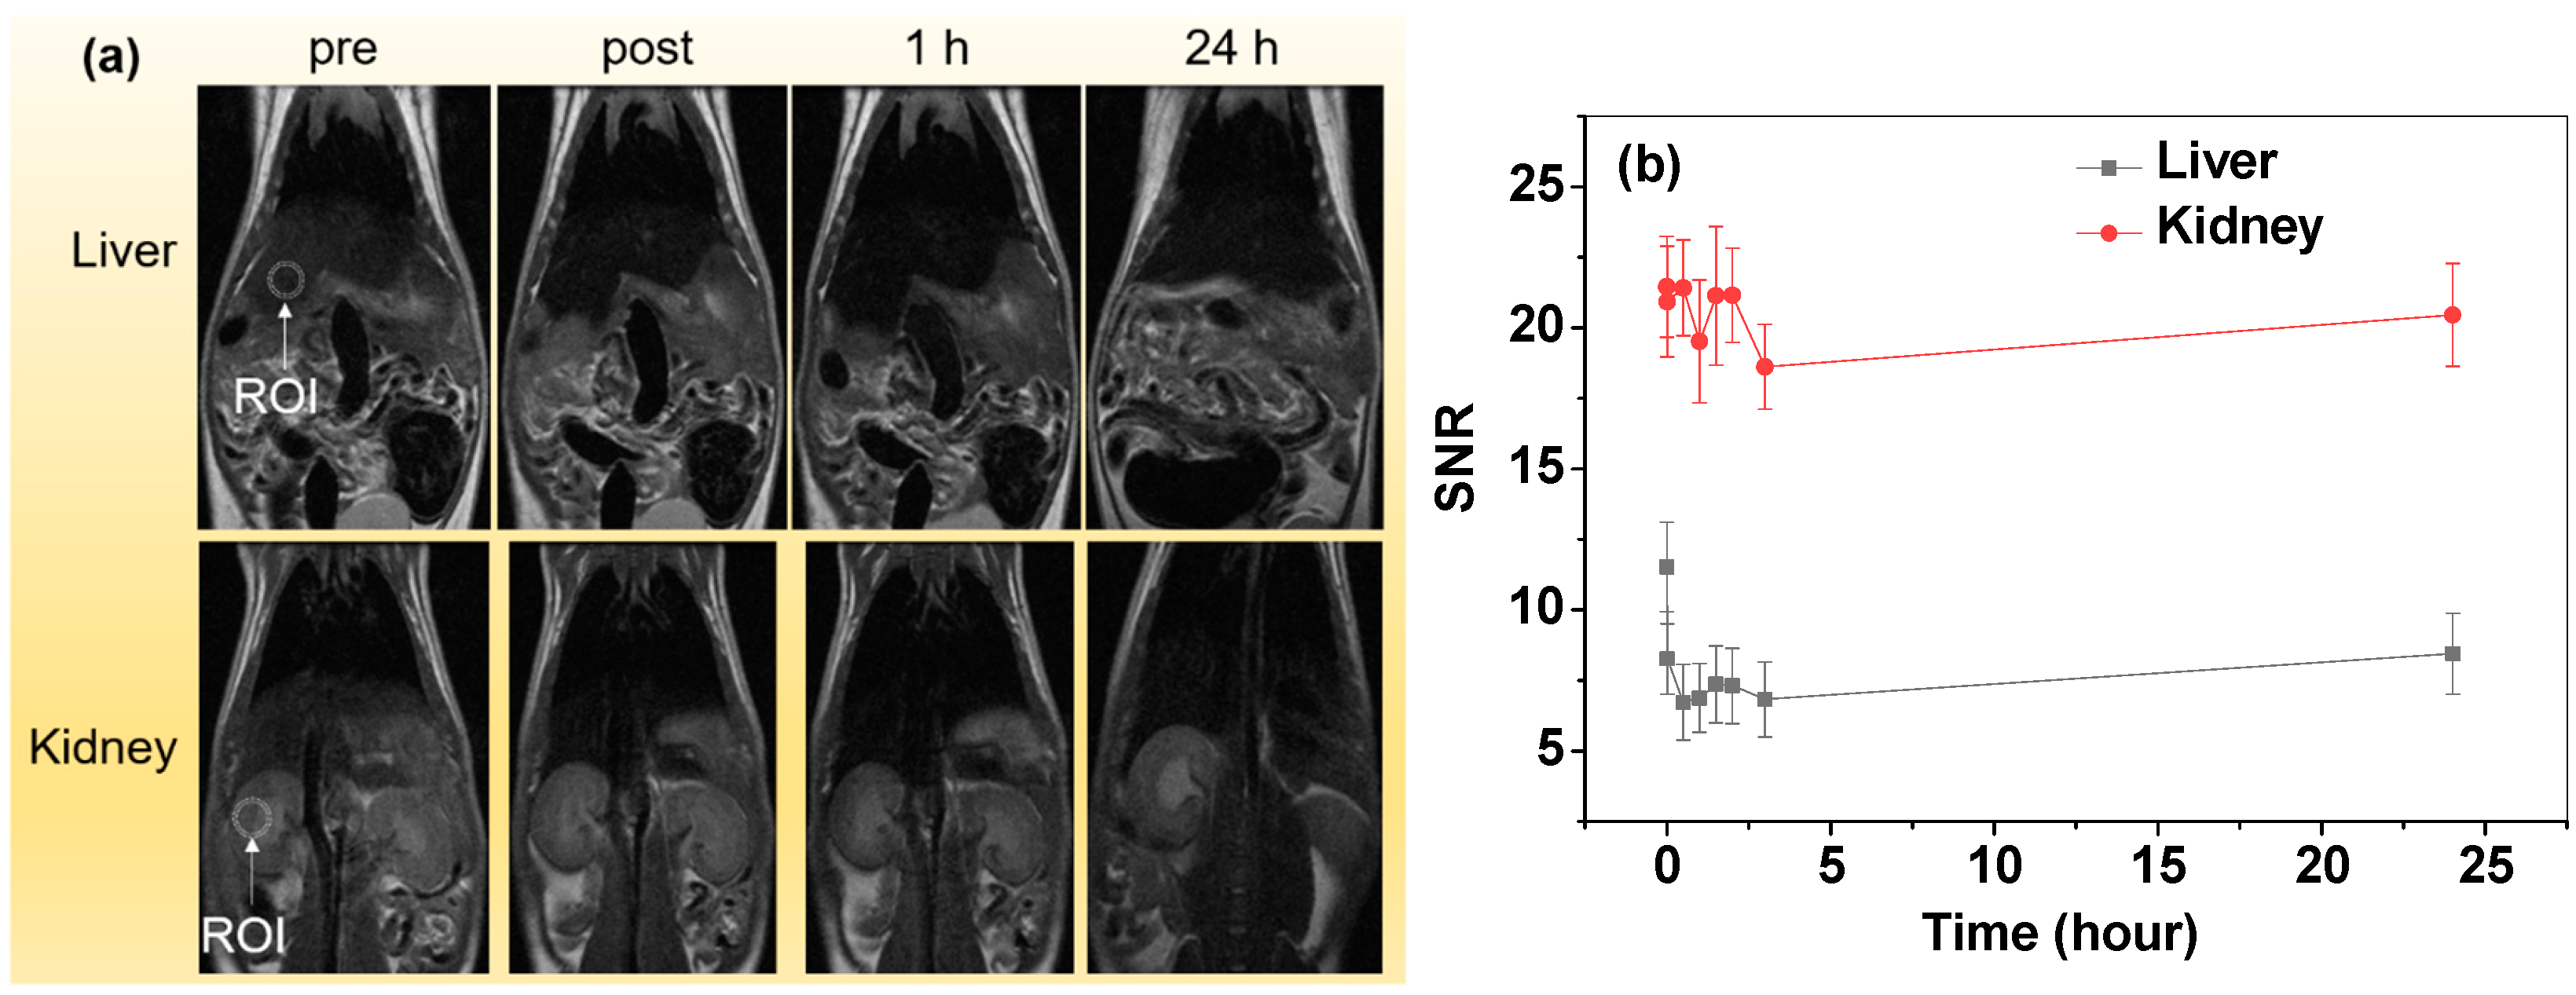
3.6. In Vivo T2 MR Images

The in vivo T2 MR images were obtained at different capture times up to 24 h (Figure 7a). To show, quantitatively, the contrast change with time, the signal-to-noise ratio (SNR) of the region-of-interest (ROI) in the liver was measured and plotted as a function of time (Figure 7b). The plot clearly showed the negative enhancements of the liver with time. On the contrary, the negative contrast enhancements of the kidneys were small (Figure 7a,b). Therefore, the Fe3O4@C NPs are more appropriate for liver imaging.

4. Discussion

The amorphous carbon coating in aqueous media via the carbonization of hydrophilic organic molecules in the presence of NPs is a promising surface coating method for biomedical applications of NPs, as demonstrated in this study. The carbon-coating shell is hydrophilic because of hydrophilic –OH and –COOH groups on its shell terminal. It is nontoxic because carbon is nontoxic and chemically inert. In this study, dextrose was carbonized in the presence of Fe3O4 NPs in aqueous media to obtain core-shell Fe3O4@C NPs. The obtained Fe3O4@C NPs displayed good colloidal stability in solution and very low cytotoxicity in the DU145 and NCTC1469 cells.
The Fe3O4@C NPs showed a high saturation magnetization (Ms) (=96.2 emu/g) and low coercivity (Hc) (~100 Oe), confirming that the Fe3O4@C NPs are ferrimagnetic rather than superparamagnetic at room temperature at the observed particle size (davg = 35.1 nm). This is because their davg is greater than the superparamagnetic diameter (Dsp: ~25 nm) [48]. In addition, their Ms value was similar to the bulk value of 93–98 emu/g [38,39,40], implying that the core Fe3O4 NPs reached the bulk saturation magnetization.
For ideal T2 MRI contrast agents, the r2 value should be very high and the r1 value should be negligible (<1.0 s−1 mM−1). This was observed in the Fe3O4@C NPs, with high r2 (=61.9 s−1 mM−1) and very low r1 (=0.6 s−1 mM−1) values (Table 1) resulting from their high Ms value. Under such conditions, only the T2 (i.e., negligible T1) water proton spin relaxation can be exclusively induced by the NPs, rendering high negative contrasts in MR images. They can exclusively provide negative contrast enhancements in MR images and thus function as highly effective T2 MRI contrast agents. Highly negative contrasts were observed in in vivo T2 MR images using the Fe3O4@C NPs, supporting this.
The in vivo T2 MRI performance of the Fe3O4@C NPs was evaluated by measuring the T2 MR images based on the IV injection of the sample solution into mouse tails. After injection, the liver clearly exhibited negative contrast enhancements. The clear contrast enhancements just after injection (labeled as “post” in Figure 7a) indicate that the NPs easily circulate through the blood vessels, indicating that the nanoparticle size (davg = 35.1 nm) is suitable for in vivo imaging via IV injection. The clear negative contrast enhancements in the liver are a consequence of the accumulation of the Fe3O4@C NPs in the liver. This accumulation indicates that the Fe3O4@C NPs were mostly sequestered by phagocytic Kupffer cells in the normal reticuloendothelial system in the liver [49]. However, the negative contrast enhancements at the kidneys were small, indicating a small amount of NP accumulation at the kidneys. Therefore, the Fe3O4@C NPs are more appropriate for liver imaging. Noting the observed very high r2 and negligible r1 values, the Fe3O4@C NPs should be highly effective T2 MRI contrast agents for liver imaging. For the present experiment, we tested the Fe3O4@C NPs potential T2 MRI contrast agents. We will further apply the Fe3O4@C NPs to the detection of diseases such as in tumor detection using tumor-model mice in the future.

5. Conclusions

Amorphous carbon terminated with hydrophilic –OH and –COOH groups was coated on Fe3O4 NP surfaces, providing chemical stability, good colloidal stability, and excellent biocompatibility to the Fe3O4@C NPs. The obtained core-shell Fe3O4@C NPs (davg = 35.1 ± 1.4 nm) exhibited highly negative contrast enhancements of the mice liver in the T2 MR images after IV injection. This was due to their ideal relaxometric properties for their applications as T2 MRI contrast agents (r2 = 61.9 s−1 mM−1, r1 = 0.6 s−1 mM−1, and r2/r1 = 103.2), which indicate that they can exclusively induce only T2 water proton spin relaxation, making them function as highly effective T2 MRI contrast agents for liver imaging.

Author Contributions

Methodology, H.Y. and D.Z.; validation, T.T., M.Y.A., A.K.A.A.S., Y.L. and H.C.; formal analysis, M.Y.A., A.K.A.A.S., Y.L., K.S.C., H.C. and B.W.Y.; data curation, H.Y., D.Z., T.T., B.W.Y., K.S.C. and S.-W.N.; writing—original draft preparation, H.Y. and D.Z.; writing—review and editing, Y.C. and G.H.L.; supervision, S.-W.N., Y.C. and G.H.L.; funding acquisition, S.-W.N., Y.C. and G.H.L. All authors have read and agreed to the published version of the manuscript.

Funding

This work was supported by the Basic Science Research Program of the National Research Foundation (NRF) funded by the Korean government (Ministry of Science and Information and Communications Technology: MSIT) (Basic Research Laboratory, No. 2021R1A4A1029433).

Data Availability Statement

The data presented in this study are available on request from the corresponding authors.

Acknowledgments

We thank the Korea Basic Science Institute for allowing us to use their XRD machine.

Conflicts of Interest

Byeong Woo Yang was employed by the company Theranocure. The remaining authors declare that the research was conducted in the absence of any commercial or financial relationships that could be construed as a potential conflict of interest.

References

  1. Nezhadheydari, H.; Tavabe, K.R.; Mirvaghefi, A.; Heydari, A.; Frinsko, M. Effects of different concentrations of Fe3O4@ZnO and Fe3O4@CNT magnetic nanoparticles separately and in combination on aquaculture waste water treatment. Environ. Technol. Innov. 2019, 15, 100414. [Google Scholar] [CrossRef]
  2. Luo, T.; Xu, Q.; Wei, W.; Sun, J.; Dai, X.; Ni, B.J. Performance and mechanism of Fe3O4 improving biotransformation of waste activated sludge into liquid high-value products. Environ. Sci. Technol. 2022, 56, 3658–3668. [Google Scholar] [CrossRef]
  3. Shi, X.; Zhang, X.; Gao, W.; Zhang, Y.; He, D. Removal of microplastics from water by magnetic nano-Fe3O4. Sci. Total Environ. 2022, 802, 149838. [Google Scholar] [CrossRef] [PubMed]
  4. Naidoo, L.; Uwaya, G.E.; Meier, F.; Bisetty, K. A novel MB-tagged aptasensor for Aflatoxin B1 detection in food using Fe3O4 nanoparticles substantiated with in silico modelling. Biosens. Bioelectron. X 2023, 15, 100416. [Google Scholar] [CrossRef]
  5. Naidoo, L.; Uwaya, G.E.; Meier, F.; Bisetty, K. A novel electrochemical sensor for the detection of zearalenone in food matrices using PEGylated Fe3O4 nanoparticles supported by in-silico and multidetector AF4. J. Electroanal. Chem. 2023, 935, 117363. [Google Scholar] [CrossRef]
  6. Khetagoudar, M.C.; Jinendra, U.; Kumar, A.P.; Bilehal, D.; Kollur, S.P. Multiresidue pesticide analysis in green chilli using GC–MS/MS using modified QuEChERS method with highly efficient Fe3O4@CFR@GO nanocomposite. Inorg. Chem. Commun. 2022, 137, 109195. [Google Scholar] [CrossRef]
  7. Antarnusa, G.; Jayanti, P.D.; Denny, Y.R.; Suherman, A. Utilization of co-precipitation method on synthesis of Fe3O4/PEG with different concentrations of PEG for biosensor applications. Materialia 2022, 25, 101525. [Google Scholar] [CrossRef]
  8. Liu, Q.; Xin, S.; Tan, X.; Yang, Q.; Hou, X. Ionic liquids functionalized Fe3O4-based colorimetric biosensor for rapid determination of ochratoxin A. Mikrochim. Acta 2023, 190, 364. [Google Scholar] [CrossRef]
  9. Zhou, Y.; Yang, Z.; Zhou, R.; Zeng, B.; Liu, X.; Li, X.; Zhang, G. Peptide-inspired one-step synthesis of surface-functionalized Fe3O4 magnetic nanoparticles for oriented enzyme immobilization and biocatalytic applications. ACS Appl. Nano Mater. 2022, 5, 8260–8270. [Google Scholar] [CrossRef]
  10. Fattahi Nafchi, R.; Ahmadi, R.; Heydari, M.; Rahimipour, M.R.; Molaei, M.J.; Unsworth, L. In vitro study: Synthesis and evaluation of Fe3O4/CQD magnetic/fluorescent nanocomposites for targeted drug delivery, MRI, and cancer cell labeling applications. Langmuir 2022, 38, 3804–3816. [Google Scholar] [CrossRef]
  11. Nordin, A.H.; Ahmad, Z.; Husna, S.M.N.; Ilyas, R.A.; Azemi, A.K.; Ismail, N.; Nordin, M.L.; Ngadi, N.; Siti, N.H.; Nabgan, W. The state of the art of natural polymer functionalized Fe3O4 magnetic nanoparticle composites for drug delivery applications: A review. Gels 2023, 9, 121. [Google Scholar] [CrossRef] [PubMed]
  12. Bekaroğlu, M.G.; Kiriş, A.; Başer, H.N.; İşçi, S. Stabilizer effect of tumor-targeting ligands on the drug delivering Fe3O4 nanoparticles. Appl. Phys. A 2023, 129, 182. [Google Scholar] [CrossRef]
  13. Vahabi, L.; Ranjbar, P.R.; Davar, F. Cladosporium protease/doxorubicin decorated Fe3O4@SiO2 nanocomposite: An efficient nanoparticle for drug delivery and combating breast cancer. J. Drug Deliv. Sci. Technol. 2023, 80, 104144. [Google Scholar] [CrossRef]
  14. Moradi, S.; Najjar, R.; Hamishehkar, H.; Lotfi, A. Triple-responsive drug nanocarrier: Magnetic core-shell nanoparticles of Fe3O4@poly(N-isopropylacrylamide)-grafted-chitosan, synthesis and in vitro cytotoxicity evaluation against human lung and breast cancer cells. J. Drug Deliv. Sci. Technol. 2022, 72, 103426. [Google Scholar] [CrossRef]
  15. Yue, H.; Shin, J.M.; Tegafaw, T.; Han, H.S.; Chae, K.S.; Chang, Y.; Lee, G.H. Magnetic separation of nucleic acids from various biological samples using silica-coated iron oxide nanobeads. J. Nanopart. Res. 2020, 22, 366. [Google Scholar] [CrossRef]
  16. He, H.; Yuan, D.H.; Gao, Z.Q.; Xiao, D.L.; He, H.; Dai, H.; Peng, J.; Li, N. Mixed hemimicelles solid-phase extraction based on ionic liquid-coated Fe3O4/SiO2 nanoparticles for the determination of flavonoids in bio-matrix samples coupled with high performance liquid chromatography. J. Chromatogr. A 2014, 1324, 78–85. [Google Scholar] [CrossRef]
  17. Ma, W.F.; Zhang, Y.; Li, L.L.; You, L.J.; Zhang, P.; Zhang, Y.T.; Li, J.M.; Yu, M.; Guo, J.; Lu, H.J.; et al. Tailor-made magnetic Fe3O4@mTiO2 microspheres with a tunable mesoporous anatase shell for highly selective and effective enrichment of phosphopeptides. ACS Nano 2012, 6, 3179–3188. [Google Scholar] [CrossRef]
  18. Do, X.H.; Nguyen, T.D.; Le, T.T.H.; To, T.T.; Bui, T.V.K.; Pham, N.H.; Ha, P.T. High biocompatibility, MRI enhancement, and dual chemo-and thermal-therapy of curcumin-encapsulated alginate/Fe3O4 nanoparticles. Pharmaceutics 2023, 15, 1523. [Google Scholar] [CrossRef]
  19. Lipengolts, A.A.; Finogenova, Y.A.; Skribitsky, V.A.; Shpakova, K.E.; Anaki, A.; Motiei, M.; Semkina, A.S.; Abakumov, M.A.; Smirnova, A.V.; Grigorieva, E.Y. CT and MRI Imaging of theranostic bimodal Fe3O4@Au nanoparticles in tumor bearing mice. Int. J. Mol. Sci. 2023, 24, 70. [Google Scholar] [CrossRef]
  20. Malekzadeh, R.; Babaye Abdollahi, B.; Ghorbani, M.; Pirayesh Islamian, J.; Mortezazadeh, T. Trastuzumab conjugated PEG–Fe3O4@Au nanoparticle as an MRI biocompatible nano-contrast agent. Int. J. Polym. Mater. Polym. Biomater. 2023, 72, 759–770. [Google Scholar] [CrossRef]
  21. Zhang, X.; Wei, P.; Wang, Z.; Zhao, Y.; Xiao, W.; Bian, Y.; Liang, D.; Lin, Q.; Song, W.; Jiang, W.; et al. Herceptin-conjugated DOX-Fe3O4/P(NIPAM-AA-MAPEG) nanogel system for HER2-targeted breast cancer treatment and magnetic resonance imaging. ACS Appl. Mater. Interfaces 2022, 14, 15956–15969. [Google Scholar] [CrossRef] [PubMed]
  22. Rezayan, A.H.; Kheirjou, S.; Edrisi, M.; Shafiee Ardestani, M.; Alvandi, H. A modified PEG-Fe3O4 magnetic nanoparticles conjugated with D(+)glucosamine (DG): MRI contrast agent. J. Inorg. Organomet. Polym. Mater. 2022, 32, 1988–1998. [Google Scholar] [CrossRef]
  23. Mushtaq, A.; Tang, Z.; Hou, Y.; Zhu, Z.; Tian, C.; Wu, Y.; Lu, Y.; Iqbal, M.Z.; Kong, X. Biocompatible magnetic hydroxyapatite Fe3O4-HAp nanocomposites for T1-magnetic resonance imaging guided photothermal therapy of breast cancer. Mater. Today Commun. 2022, 31, 103734. [Google Scholar] [CrossRef]
  24. Divband, B.; Gharehaghaji, N.; Hassani, S. Fe3O4/graphene-based nanotheranostics for bimodal magnetic resonance/fluorescence imaging and cancer therapy. J. Inorg. Organomet. Polym. Mater. 2022, 32, 4443–4460. [Google Scholar] [CrossRef]
  25. Wang, K.; Wang, J.; Xu, X.; Rong, M.; Lu, L.; Zhao, X.; Wang, Y.; Jiang, Y. Fe3O4-rhodamine 6G nanoparticles: An iron enhanced pH sensitive multimodal probe for fluorescence and magnetic resonance imaging of tumor cell. J. Mater. Sci. Technol. 2023, 160, 128–138. [Google Scholar] [CrossRef]
  26. Kushwaha, P.; Chauhan, P. Facile synthesis of water-soluble Fe3O4 and Fe3O4@PVA nanoparticles for dual-contrast T1- and T2-weighted magnetic resonance imaging. Magn. Reson. Imaging 2023, 95, 50–58. [Google Scholar] [CrossRef] [PubMed]
  27. Li, C.; Zhao, J.; Gao, X.; Hao, C.; Hu, S.; Qu, A.; Xu, L. Chiral Iron Oxide supraparticles enable enantiomer-dependent tumor-targeted magnetic resonance imaging. Adv. Mater. 2023, 35, 2308198. [Google Scholar] [CrossRef]
  28. González-Gómez, M.A.; Seco-Gudiña, R.; García-Acevedo, P.; Arnosa-Prieto, Á.; de Castro-Alves, L.; Piñeiro, Y.; Rivas, J. Fluorescent magnetic mesoporous nanoprobes for biotechnological enhancement procedures in gene therapy. Magnetochemistry 2023, 9, 67. [Google Scholar] [CrossRef]
  29. Morishita, N.; Nakagami, H.; Morishita, R.; Takeda, S.; Mishima, F.; Terazono, B.; Nishijima, S.; Kaneda, Y.; Tanaka, N. Magnetic nanoparticles with surface modification enhanced gene delivery of HVJ-E vector. Biochem. Biophys. Res. Commun. 2005, 334, 1121–1126. [Google Scholar] [CrossRef]
  30. Khan, M.U.A.; Rizwan, M.; Razak, S.I.A.; Hassan, A.; Rasheed, T.; Bilal, M. Electroactive polymeric nanocomposite BC-g-(Fe3O4/GO) materials for bone tissue engineering: In vitro evaluations. J. Biomater. Sci. Polym. Ed. 2022, 33, 1349–1368. [Google Scholar] [CrossRef]
  31. Sun, R.; Chen, H.; Zheng, J.; Yoshitomi, T.; Kawazoe, N.; Yang, Y.; Chen, G. Composite scaffolds of gelatin and Fe3O4 nanoparticles for magnetic hyperthermia-based breast cancer treatment and adipose tissue regeneration. Adv. Healthc. Mater. 2023, 12, 2202604. [Google Scholar] [CrossRef] [PubMed]
  32. Wang, Q.; Cheng, Y.; Wang, W.; Tang, X.; Yang, Y. Polyetherimide- and folic acid-modified Fe3O4 nanospheres for enhanced magnetic hyperthermia performance. J. Biomed. Mater. Res. 2023, 111, 795–804. [Google Scholar] [CrossRef] [PubMed]
  33. Bobo, D.; Robinson, K.J.; Islam, J.; Thurecht, K.J.; Corrie, S.R. Nanoparticle-based medicines: A review of FDA-approved materials and clinical trials to date. Pharm. Res. 2016, 33, 2373–2387. [Google Scholar] [CrossRef] [PubMed]
  34. Seehra, M. Magnetic Spinels: Synthesis, Properties and Applications; IntechOpen: London, UK, 2017. [Google Scholar] [CrossRef]
  35. Shen, L.; Li, B.; Qiao, Y. Fe3O4 nanoparticles in targeted drug/gene delivery systems. Materials 2018, 11, 324. [Google Scholar] [CrossRef]
  36. Yue, H.; Park, J.; Ho, S.; Ahmad, M.; Cha, H.; Liu, S.; Tegafaw, T.; Marasini, S.; Ghazanfari, A.; Kim, S.; et al. New class of efficient T2 magnetic resonance imaging contrast agent: Carbon-coated paramagnetic dysprosium oxide nanoparticles. Pharmaceuticals 2020, 13, 312. [Google Scholar] [CrossRef] [PubMed]
  37. Yue, H.; Marasini, S.; Ahmad, M.Y.; Ho, S.L.; Cha, H.; Liu, S.; Jang, Y.J.; Tegafaw, T.; Ghazanfari, A.; Miao, X.; et al. Carbon-coated ultrasmall gadolinium oxide (Gd2O3@C) nanoparticles: Application to magnetic resonance imaging and fluorescence properties. Colloids Surfaces A Physicochem. Eng. Asp. 2020, 586, 124261. [Google Scholar] [CrossRef]
  38. Bianchetti, E.; Di Valentin, C. Effect of surface functionalization on the magnetization of Fe3O4 nanoparticles by hybrid density functional theory calculations. J. Phys. Chem. Lett. 2022, 13, 9348–9354. [Google Scholar] [CrossRef]
  39. Nguyen, M.D.; Tran, H.V.; Xu, S.; Lee, T.R. Fe3O4 nanoparticles: Structures, synthesis, magnetic properties, surface functionalization, and emerging applications. Appl. Sci. 2021, 11, 11301. [Google Scholar] [CrossRef]
  40. Matsuzaki, K.; Lazarov, V.K.; Lari, L.; Hosono, H.; Susaki, T. Fe3O4(1 1 1) thin films with bulk-like properties: Growth and atomic characterization. J. Phys. D Appl. Phys. 2013, 46, 022001. [Google Scholar] [CrossRef]
  41. Bae, H.; Ahmad, T.; Rhee, I.; Chang, Y.; Jin, S.U.; Hong, S. Carbon-coated iron oxide nanoparticles as contrast agents in magnetic resonance imaging. Nanoscale Res. Lett. 2012, 7, 44. [Google Scholar] [CrossRef]
  42. Wang, Y.X.; Wang, D.W.; Zhu, X.M.; Zhao, F.; Leung, K.C. Carbon coated superparamagnetic iron oxide nanoparticles for sentinel lymph nodes mapping. Quant. Imaging Med. Surg. 2012, 2, 53–56. [Google Scholar] [CrossRef] [PubMed]
  43. Basta, E.Z. Accurate determination of the cell dimensions of magnetite. Mineral. Mag. J. Mineral. Soc. 1957, 31, 431–442. [Google Scholar] [CrossRef]
  44. Tegafaw, T.; Oh, I.T.; Cha, H.; Yue, H.; Miao, X.; Ho, S.L.; Ahmad, M.Y.; Marasini, S.; Ghazanfari, A.; Kim, H.-K.; et al. Facile synthesis of stable colloidal suspension of amorphous carbon nanoparticles in aqueous medium and their characterization. J. Phys. Chem. Solids 2018, 120, 96–103. [Google Scholar] [CrossRef]
  45. Kaufman, J.H.; Metin, S.; Saperstein, D.D. Symmetry breaking in nitrogen-doped amorphous carbon: Infrared observation of the Raman-active G and D bands. Phys. Rev. B: Condens. Matter Mater. Phys. 1989, 39, 13053. [Google Scholar] [CrossRef] [PubMed]
  46. Sun, X.M.; Li, Y.D. Colloidal carbon spheres and their core/shell structures with noble-metal nanoparticles. Angew. Chem. Int. Ed. 2004, 43, 597–601. [Google Scholar] [CrossRef]
  47. Hara, M.; Yoshida, T.; Takagaki, A.; Takata, T.; Kondo, J.N.; Hayashi, S.; Domen, K. A carbon material as a strong protonic acid. Angew. Chem. Int. Ed. 2004, 43, 2955–2958. [Google Scholar] [CrossRef]
  48. Kolhatkar, A.; Jamison, A.; Litvinov, D.; Willson, R.; Lee, T. Tuning the magnetic properties of nanoparticles. Int. J. Mol. Sci. 2013, 14, 15977–16009. [Google Scholar] [CrossRef]
  49. Wang, Y.-X.J. Superparamagnetic iron oxide based MRI contrast agents: Current status of clinical application. Quant. Imaging Med. Surg. 2011, 1, 35–40. [Google Scholar] [CrossRef]
Figure 1. Facile synthesis of (a) the Fe3O4 NPs and (b) the Fe3O4@C NPs in an aqueous solution.
Nanomaterials 14 00177 g001
Figure 2. (a) HRTEM image. (b) Magnified HRTEM image: the dotted square is further magnified on the top right to show carbon-coating shell thickness, labeled with two arrows. Dotted circle is further magnified in (c) to show (022) plane lattice fringes. (d) Particle diameter distribution of the Fe3O4@C NPs obtained from the HRTEM images and the log-normal function fitting curve. (e) HAADF-STEM image of the Fe3O4@C NPs and elemental mapping of (f) Fe (red), (g) C (green), (h) O (blue), and (i) merged elements. (j) Zeta potential curve in the aqueous solution. (k) XRD patterns of the Fe3O4 and Fe3O4@C NPs: all XRD peaks (indicated with vertical dotted lines) were assigned based on (hkl) Miller indices matching FCC Fe3O4. The broad peak at 2θ = ~21° (labeled as *) for the Fe3O4@C NPs is due to amorphous carbon.
Nanomaterials 14 00177 g002
Figure 3. (a) FT-IR absorption spectra: Fe3O4@C NPs (bottom), Fe3O4 NPs (middle), and dextrose (top). (b) TGA curve of the Fe3O4@C NPs under air flow. (c) Proposed core-shell structure of the Fe3O4@C NPs.
Nanomaterials 14 00177 g003
Figure 4. M–H curves of the Fe3O4@C NPs at 300 K before and after mass correction.
Nanomaterials 14 00177 g004
Figure 5. In vitro cell viability of the DU145 and NCTC1469 cells after incubation with the Fe3O4@C NPs up to 500 μM [Fe].
Nanomaterials 14 00177 g005
Figure 6. (a) Plots of 1/T1 and 1/T2 inverse relaxation times versus Fe concentration. The slopes correspond to the r1 and r2 values, respectively. (b) R1 and R2 map images as a function of Fe concentration, showing clear dose-dependent contrast enhancement in the R2 map images but negligible dose-dependent contrast enhancement in the R1 map images; the scale unit is s−1.
Nanomaterials 14 00177 g006
Figure 7. (a) In vivo coronal T2 MR images of the liver and kidneys of the mice (dotted circles indicate ROIs used for estimating SNRs) as a function of time (“pre” and “post” indicate “just before” and “just after” IV injection, respectively). (b) SNR-ROI plots as functions of time.
Nanomaterials 14 00177 g007
Table 1. Summarized properties of Fe3O4@C NPs.
davg
(nm)
ζ
(mV)
Carbon Coating
(wt.%)
Saturation Magnetization
(emu/g)
Relaxivity
(s−1 mM−1)
TGA 1EA 2r1r2r2/r1
35.1 ± 1.4−32.248.158.0496.20.661.9103.2
1 Water and air excluded. 2 Water and air included.
Table 2. Observed FT-IR absorption frequencies (cm−1).
SampleO–HC–HC=O C=O (D)C=O (G)C–OFe–O
Dextrose32482943---1010-
Fe3O4@C NP324829431699138415781048556
Disclaimer/Publisher’s Note: The statements, opinions and data contained in all publications are solely those of the individual author(s) and contributor(s) and not of MDPI and/or the editor(s). MDPI and/or the editor(s) disclaim responsibility for any injury to people or property resulting from any ideas, methods, instructions or products referred to in the content.

