
The Effect of Adding CeO2 Nanoparticles to Cu–Ni–Al Alloy for High Temperatures Applications

 , ,
, ,  ,
, 
Abstract
1. Introduction
2. Materials and Methods
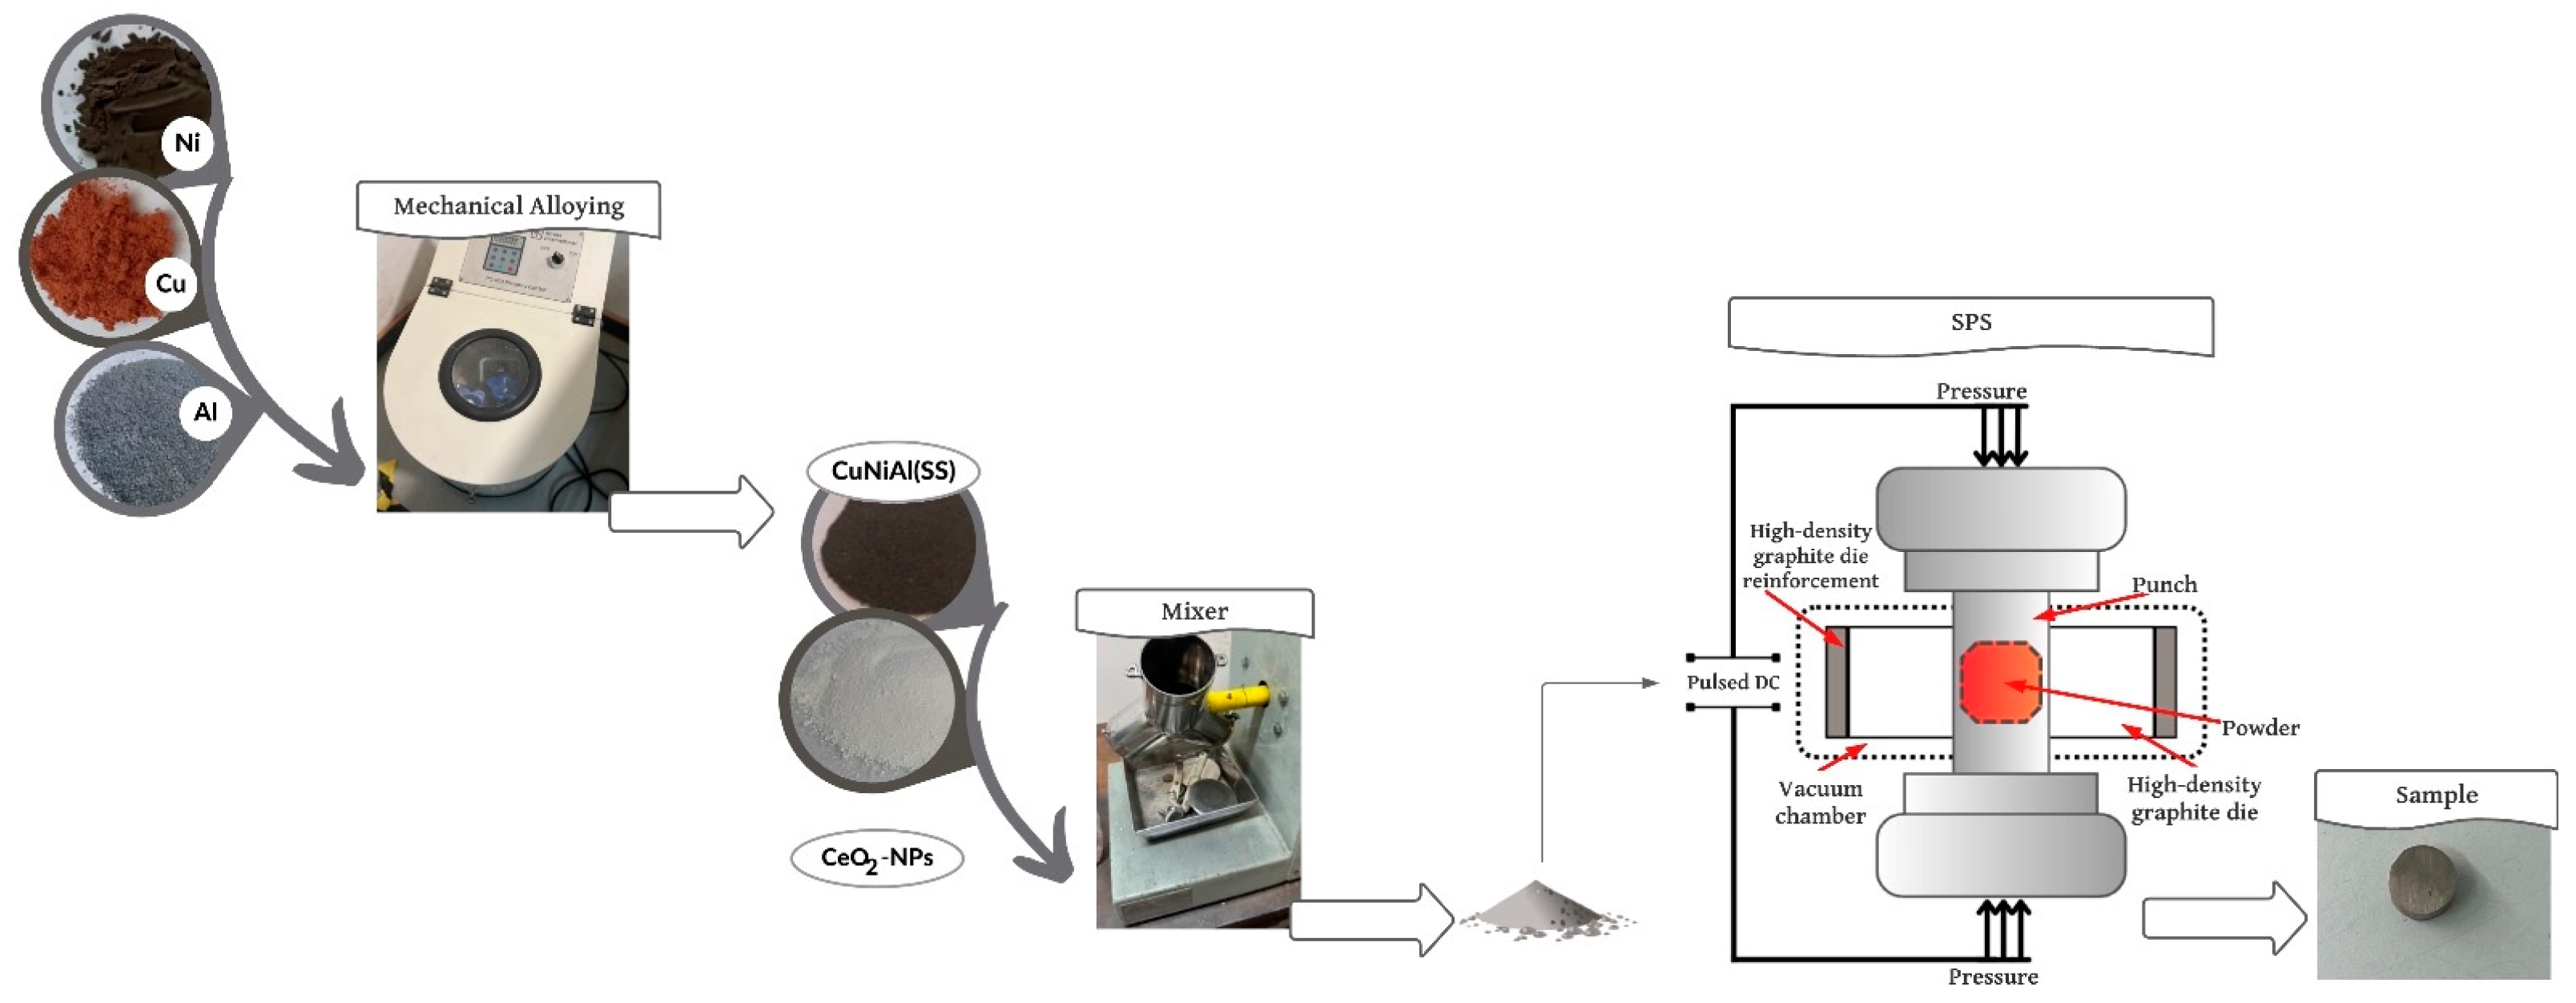
2.1. Sample Obtention
2.2. Gravimetric Measurements
2.3. Morphological and Chemical Characterization
2.4. Mechanical Characterization
2.5. Electrochemical Measurements
3. Results and Discussion
3.1. Gravimetric Measurements
3.2. Microstructural and Chemical Characterization
3.3. Mechanical Properties
3.4. Electrochemical Measurements
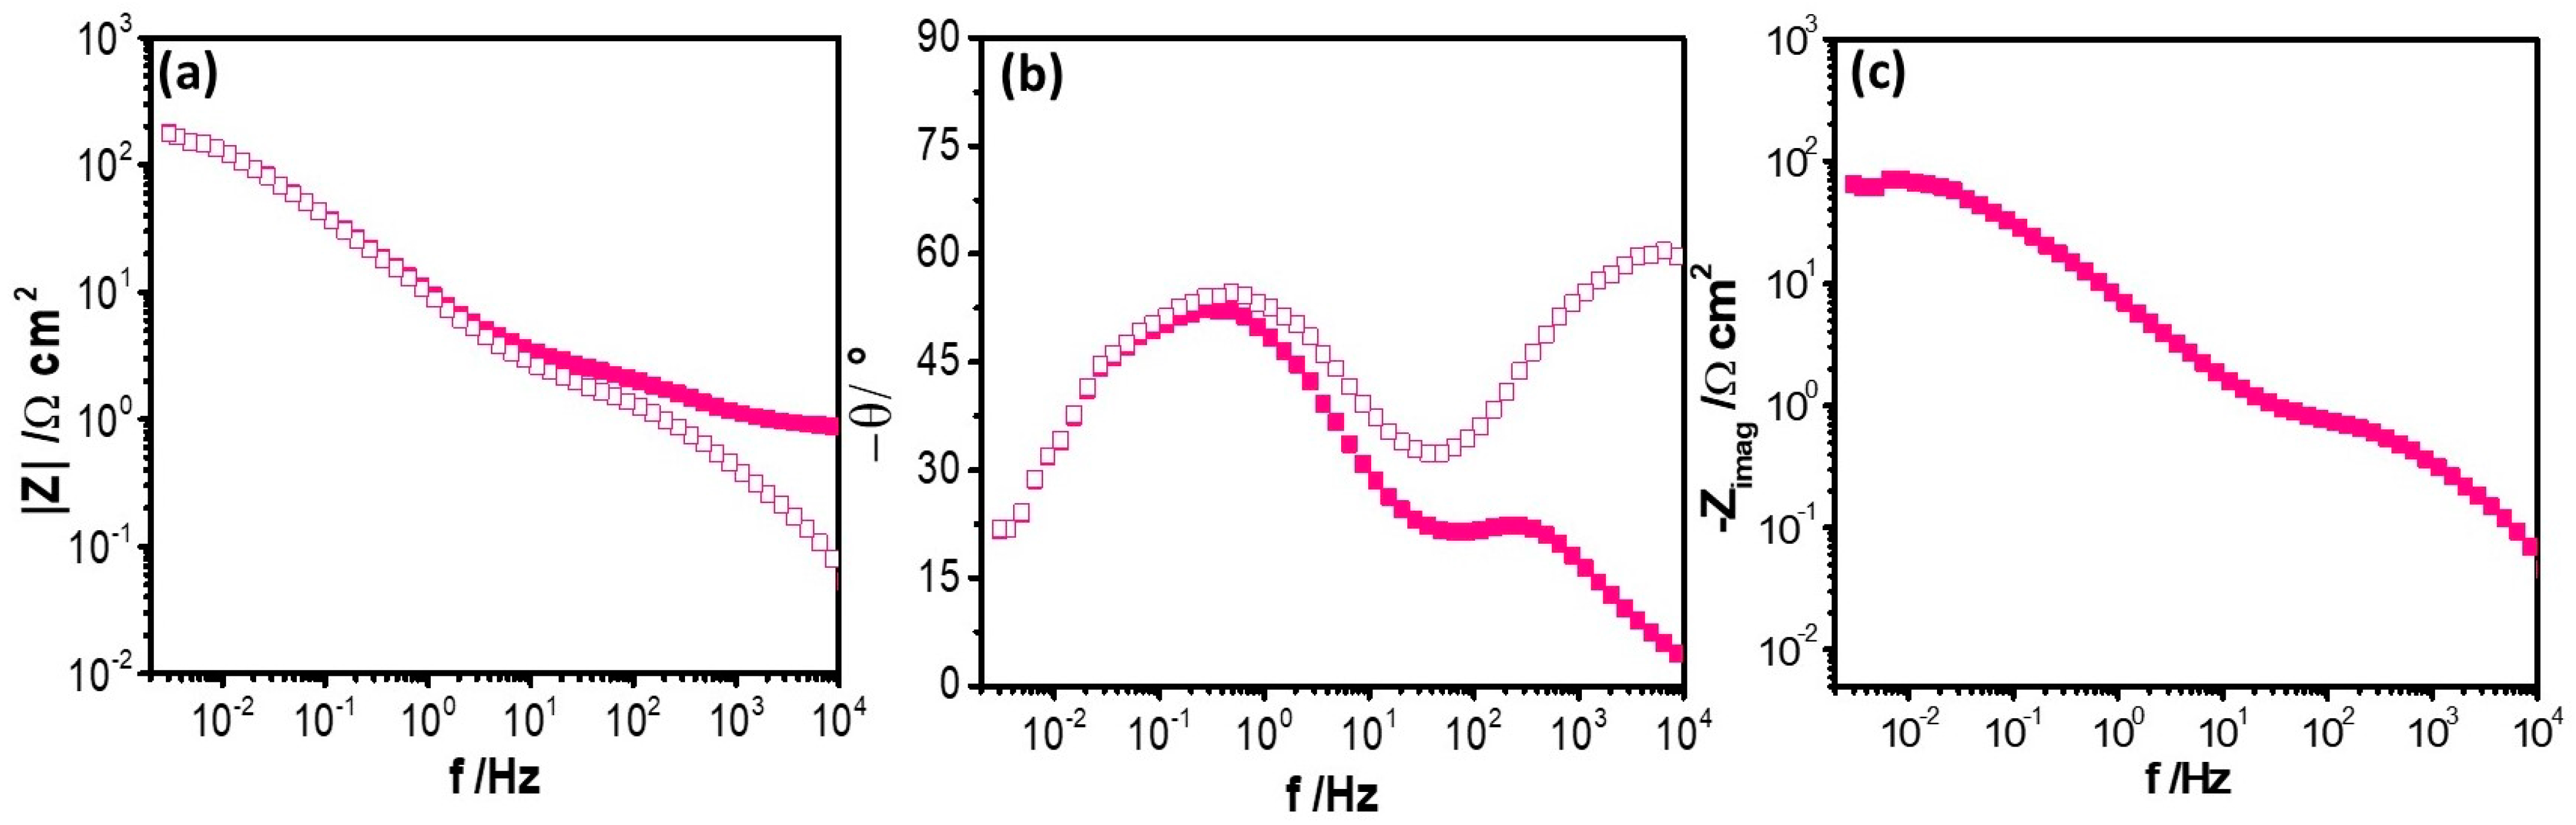
 ) and corrected Bode plots by electrolyte resistance (
 ), revealing that this effect is mainly in the high frequency range.
4. Conclusions
Author Contributions
Funding
Data Availability Statement
Acknowledgments
Conflicts of Interest
References
- Nanadegani, F.S.; Sunden, B. Review of Exergy and Energy Analysis of Fuel Cells. Int. J. Hydrog. Energy 2023, in press. [Google Scholar] [CrossRef]
- Sharaf, O.Z.; Orhan, M.F. An Overview of Fuel Cell Technology: Fundamentals and Applications. Renew. Sustain. Energy Rev. 2014, 32, 810–853. [Google Scholar] [CrossRef]
- Ming, W.; Sun, P.; Zhang, Z.; Qiu, W.; Du, J.; Li, X.; Zhang, Y.; Zhang, G.; Liu, K.; Wang, Y.; et al. A Systematic Review of Machine Learning Methods Applied to Fuel Cells in Performance Evaluation, Durability Prediction, and Application Monitoring. Int. J. Hydrog. Energy 2023, 48, 5197–5228. [Google Scholar] [CrossRef]
- Olabi, A.G.; Wilberforce, T.; Sayed, E.T.; Elsaid, K.; Abdelkareem, M.A. Prospects of Fuel Cell Combined Heat and Power Systems. Energies 2020, 13, 4104. [Google Scholar] [CrossRef]
- Abdelkareem, M.A.; Lootah, M.A.; Sayed, E.T.; Wilberforce, T.; Alawadhi, H.; Yousef, B.A.A.; Olabi, A.G. Fuel Cells for Carbon Capture Applications. Sci. Total Environ. 2021, 769, 144243. [Google Scholar] [CrossRef]
- Shuhayeu, P.; Martsinchyk, A.; Martsinchyk, K.; Szczęśniak, A.; Szabłowski, Ł.; Dybiński, O.; Milewski, J. Model-Based Quantitative Characterization of Anode Microstructure and Its Effect on the Performance of Molten Carbonate Fuel Cell. Int. J. Hydrog. Energy 2023, in press. [CrossRef]
- Lee, C.G.; Hwang, J.Y.; Oh, M.; Kim, D.H.; Lim, H.C. Overpotential Analysis with Various Anode Gas Compositions in a Molten Carbonate Fuel Cell. J. Power Sources 2008, 179, 467–473. [Google Scholar] [CrossRef]
- Hacker, V.; Mitsushima, S. Fuel Cells and Hydrogen: From Fundamentals to Applied Research; Elsevier: Amsterdam, The Netherlands, 2018; ISBN 9780128114599. [Google Scholar]
- Accardo, G.; Frattini, D.; Yoon, S.P.; Ham, H.C.; Nam, S.W. Performance and Properties of Anodes Reinforced with Metal Oxide Nanoparticles for Molten Carbonate Fuel Cells. J. Power Sources 2017, 370, 52–60. [Google Scholar] [CrossRef]
- Hwang, E.R.; Park, J.W.; Kim, Y.D.; Kim, S.J.; Kang, S.G. Effect of Alloying Elements on the Copper-Base Anode for Molten Carbonate Fuel Cells. J. Power Sources 1997, 69, 55–60. [Google Scholar] [CrossRef]
- Li, C.; Chen, J.; Li, W.; Hu, Y.; Ren, Y.; Qiu, W.; He, J.; Chen, J. Investigation on Compressive Behavior of Cu-35Ni-15Al Alloy at High Temperatures. Mater. Sci. Pol. 2014, 32, 341–349. [Google Scholar] [CrossRef]
- Li, G.; Thomas, B.G.; Stubbins, J.F. Modeling Creep and Fatigue of Copper Alloys. Metall. Mater. Trans. A Phys. Metall. Mater. Sci. 2000, 31, 2491–2502. [Google Scholar] [CrossRef]
- Liu, M.; Wang, S.; Chen, T.; Yuan, C.; Zhou, Y.; Wang, S.; Huang, J. Performance of the Nano-Structured Cu-Ni (Alloy)-CeO2 Anode for Solid Oxide Fuel Cells. J. Power Sources 2015, 274, 730–735. [Google Scholar] [CrossRef]
- Lair, V.; Albin, V.; Ringuedé, A.; Cassir, M. Theoretical Predictions vs. Experimental Measurements of the Electrical Conductivity of Molten Li2CO3-K2CO3 Modified by Additives. Int. J. Hydrog. Energy 2012, 37, 19357–19364. [Google Scholar] [CrossRef]
- Ricca, C.; Ringuedé, A.; Cassir, M.; Adamo, C.; Labat, F. Mixed Lithium-Sodium (LiNaCO3) and Lithium-Potassium (LiKCO3) Carbonates for Low Temperature Electrochemical Applications: Structure, Electronic Properties and Surface Reconstruction from Ab-Initio Calculations. Surf. Sci. 2016, 647, 66–77. [Google Scholar] [CrossRef]
- Arcos, C.; Guerra, C.; Ramos-Grez, J.A.; Sancy, M. Ni-Al Bronze in Molten Carbonate Manufactured by LPBF: Effect of Porosity Design on Mechanical Properties and Oxidation. Materials 2023, 16, 3893. [Google Scholar] [CrossRef] [PubMed]
- ASTM G1-03; Standard Practice for Preparing, Cleaning, and Evaluating Corrosion Test Specimens. ASTM: West Conshohocken, PA, USA, 2017.
- ASTM C373-88; Standard Test Method for Water Absorption, Bulk Density, Apparent Porosity, and Apparent Specific Gravity of Fired Whiteware Products. ASTM: West Conshohocken, PA, USA, 2006.
- Saber, D.; El-Aziz, K.A.; Felemban, B.F.; Alghtani, A.H.; Ali, H.T.; Ahmed, E.M.; Megahed, M. Characterization and Performance Evaluation of Cu-Based/TiO2 Nano Composites. Sci. Rep. 2022, 12, 6669. [Google Scholar] [CrossRef]
- Ren, Y.; Peng, Y.; Chen, J.; Qiu, W.; Li, W.; Li, C.; Niu, Y. Electrochemical Impedance Studies on the Corrosion of Cu-35Ni-10Al Alloy in a Molten (0.62Li, 0.38K)2CO3 Environment. Int. J. Electrochem. Sci. 2019, 14, 6147–6153. [Google Scholar] [CrossRef]
- Frattini, D.; Accardo, G.; Moreno, A.; Yoon, S.P.; Han, J.H.; Nam, S.W. Strengthening Mechanism and Electrochemical Characterization of ZrO2 Nanoparticles in Nickel–Aluminum Alloy for Molten Carbonate Fuel Cells. J. Ind. Eng. Chem. 2017, 56, 285–291. [Google Scholar] [CrossRef]
- Gonzalez-Rodriguez, J.G.; Mejia, E.; Rosales, I.; Salinas-Bravo, V.M.; Rosas, G.; MArtinez-Villafañe, A. Effect of Heat Treatment and Chemical Composition on the Corrosion Behavior of Ni-Al Intermetallics in Molten (Li + K) Carbonate. J. Power Sources 2008, 176, 215–221. [Google Scholar] [CrossRef]
- Briones, F.; Seriacopi, V.; Martínez, C.; Valin, J.L.; Centeno, D.; Machado, I.F. The Effects of Pressure and Pressure Routes on the Microstructural Evolution and Mechanical Properties of Sintered Copper via SPS. J. Mater. Res. Technol. 2023, 25, 2455–2470. [Google Scholar] [CrossRef]
- Zawrah, M.F.; Zayed, H.A.; Essawy, R.A.; Nassar, A.H.; Taha, M.A. Preparation by Mechanical Alloying, Characterization and Sintering of Cu-20wt.% Al2O3 Nanocomposites. Mater. Des. 2013, 46, 485–490. [Google Scholar] [CrossRef]
- Zhang, Z.; Chen, D.L. Contribution of Orowan Strengthening Effect in Particulate-Reinforced Metal Matrix Nanocomposites. Mater. Sci. Eng. A 2008, 483–484, 148–152. [Google Scholar] [CrossRef]
- Meléndez-Ceballos, A.; Albin, V.; Fernández-Valverde, S.M.; Ringuedé, A.; Cassir, M. Electrochemical Properties of Atomic Layer Deposition Processed CeO2 as a Protective Layer for the Molten Carbonate Fuel Cell Cathode. Electrochim. Acta 2014, 140, 174–181. [Google Scholar] [CrossRef]
- Pineda, F.; Walczak, M.; Vilchez, F.; Guerra, C.; Escobar, R.; Sancy, M. Evolution of Corrosion Products on ASTM A36 and AISI 304L Steels Formed in Exposure to Molten NaNO3–KNO3 Eutectic Salt: Electrochemical Study. Corros. Sci. 2022, 196, 110047. [Google Scholar] [CrossRef]
- Martínez, C.; Guerra, C.; Silva, D.; Cubillos, M.; Briones, F.; Muñoz, L.; Páez, M.A.; Aguilar, C.; Sancy, M. Effect of Porosity on Mechanical and Electrochemical Properties of Ti–6Al–4V Alloy. Electrochim. Acta 2020, 338, 135858. [Google Scholar] [CrossRef]
- Valverde, B.; Sancy, M.; Martínez, C.; Botello, E.; Pío, E.; Aguilar, C. Effect of Sn Content on the Passivity of Ti-Ta-Sn Alloys. Corros. Sci. 2023, 211, 110887. [Google Scholar] [CrossRef]
- Orazem, M.E.; Tribollet, B. Constant-Phase Elements. In Electrochemical Impedance Spectroscopy; Wiley: Hoboken, NJ, USA, 2017; pp. 395–419. ISBN 9781118527399. [Google Scholar]
- Tribollet, B.; Vivier, V.; Orazem, M.E. EIS Technique in Passivity Studies: Determination of the Dielectric Properties of Passive Films; Wandelt, K., Ed.; Elsevier: Amsterdam, The Netherlands, 2018; ISBN 9780128098943. [Google Scholar]
- Hirschorn, B.; Orazem, M.E.; Tribollet, B.; Vivier, V.; Frateur, I.; Musiani, M. Constant-Phase-Element Behavior Caused by Resistivity Distributions in Films: II. Applications. J. Electrochem. Soc. 2010, 157, C458. [Google Scholar] [CrossRef]
 ) 0 wt.% CeO2–NPs, () 1 wt.% CeO2–NPs, (
 ) 3 wt.% CeO2–NPs, (
 ) 5 wt.% CeO2–NPs.
) 0 wt.% CeO2–NPs, () 1 wt.% CeO2–NPs, () 3 wt.% CeO2–NPs, () 5 wt.% CeO2–NPs.
) 5 wt.% CeO2–NPs.
) 0 wt.% CeO2–NPs, () 1 wt.% CeO2–NPs, () 3 wt.% CeO2–NPs, () 5 wt.% CeO2–NPs.

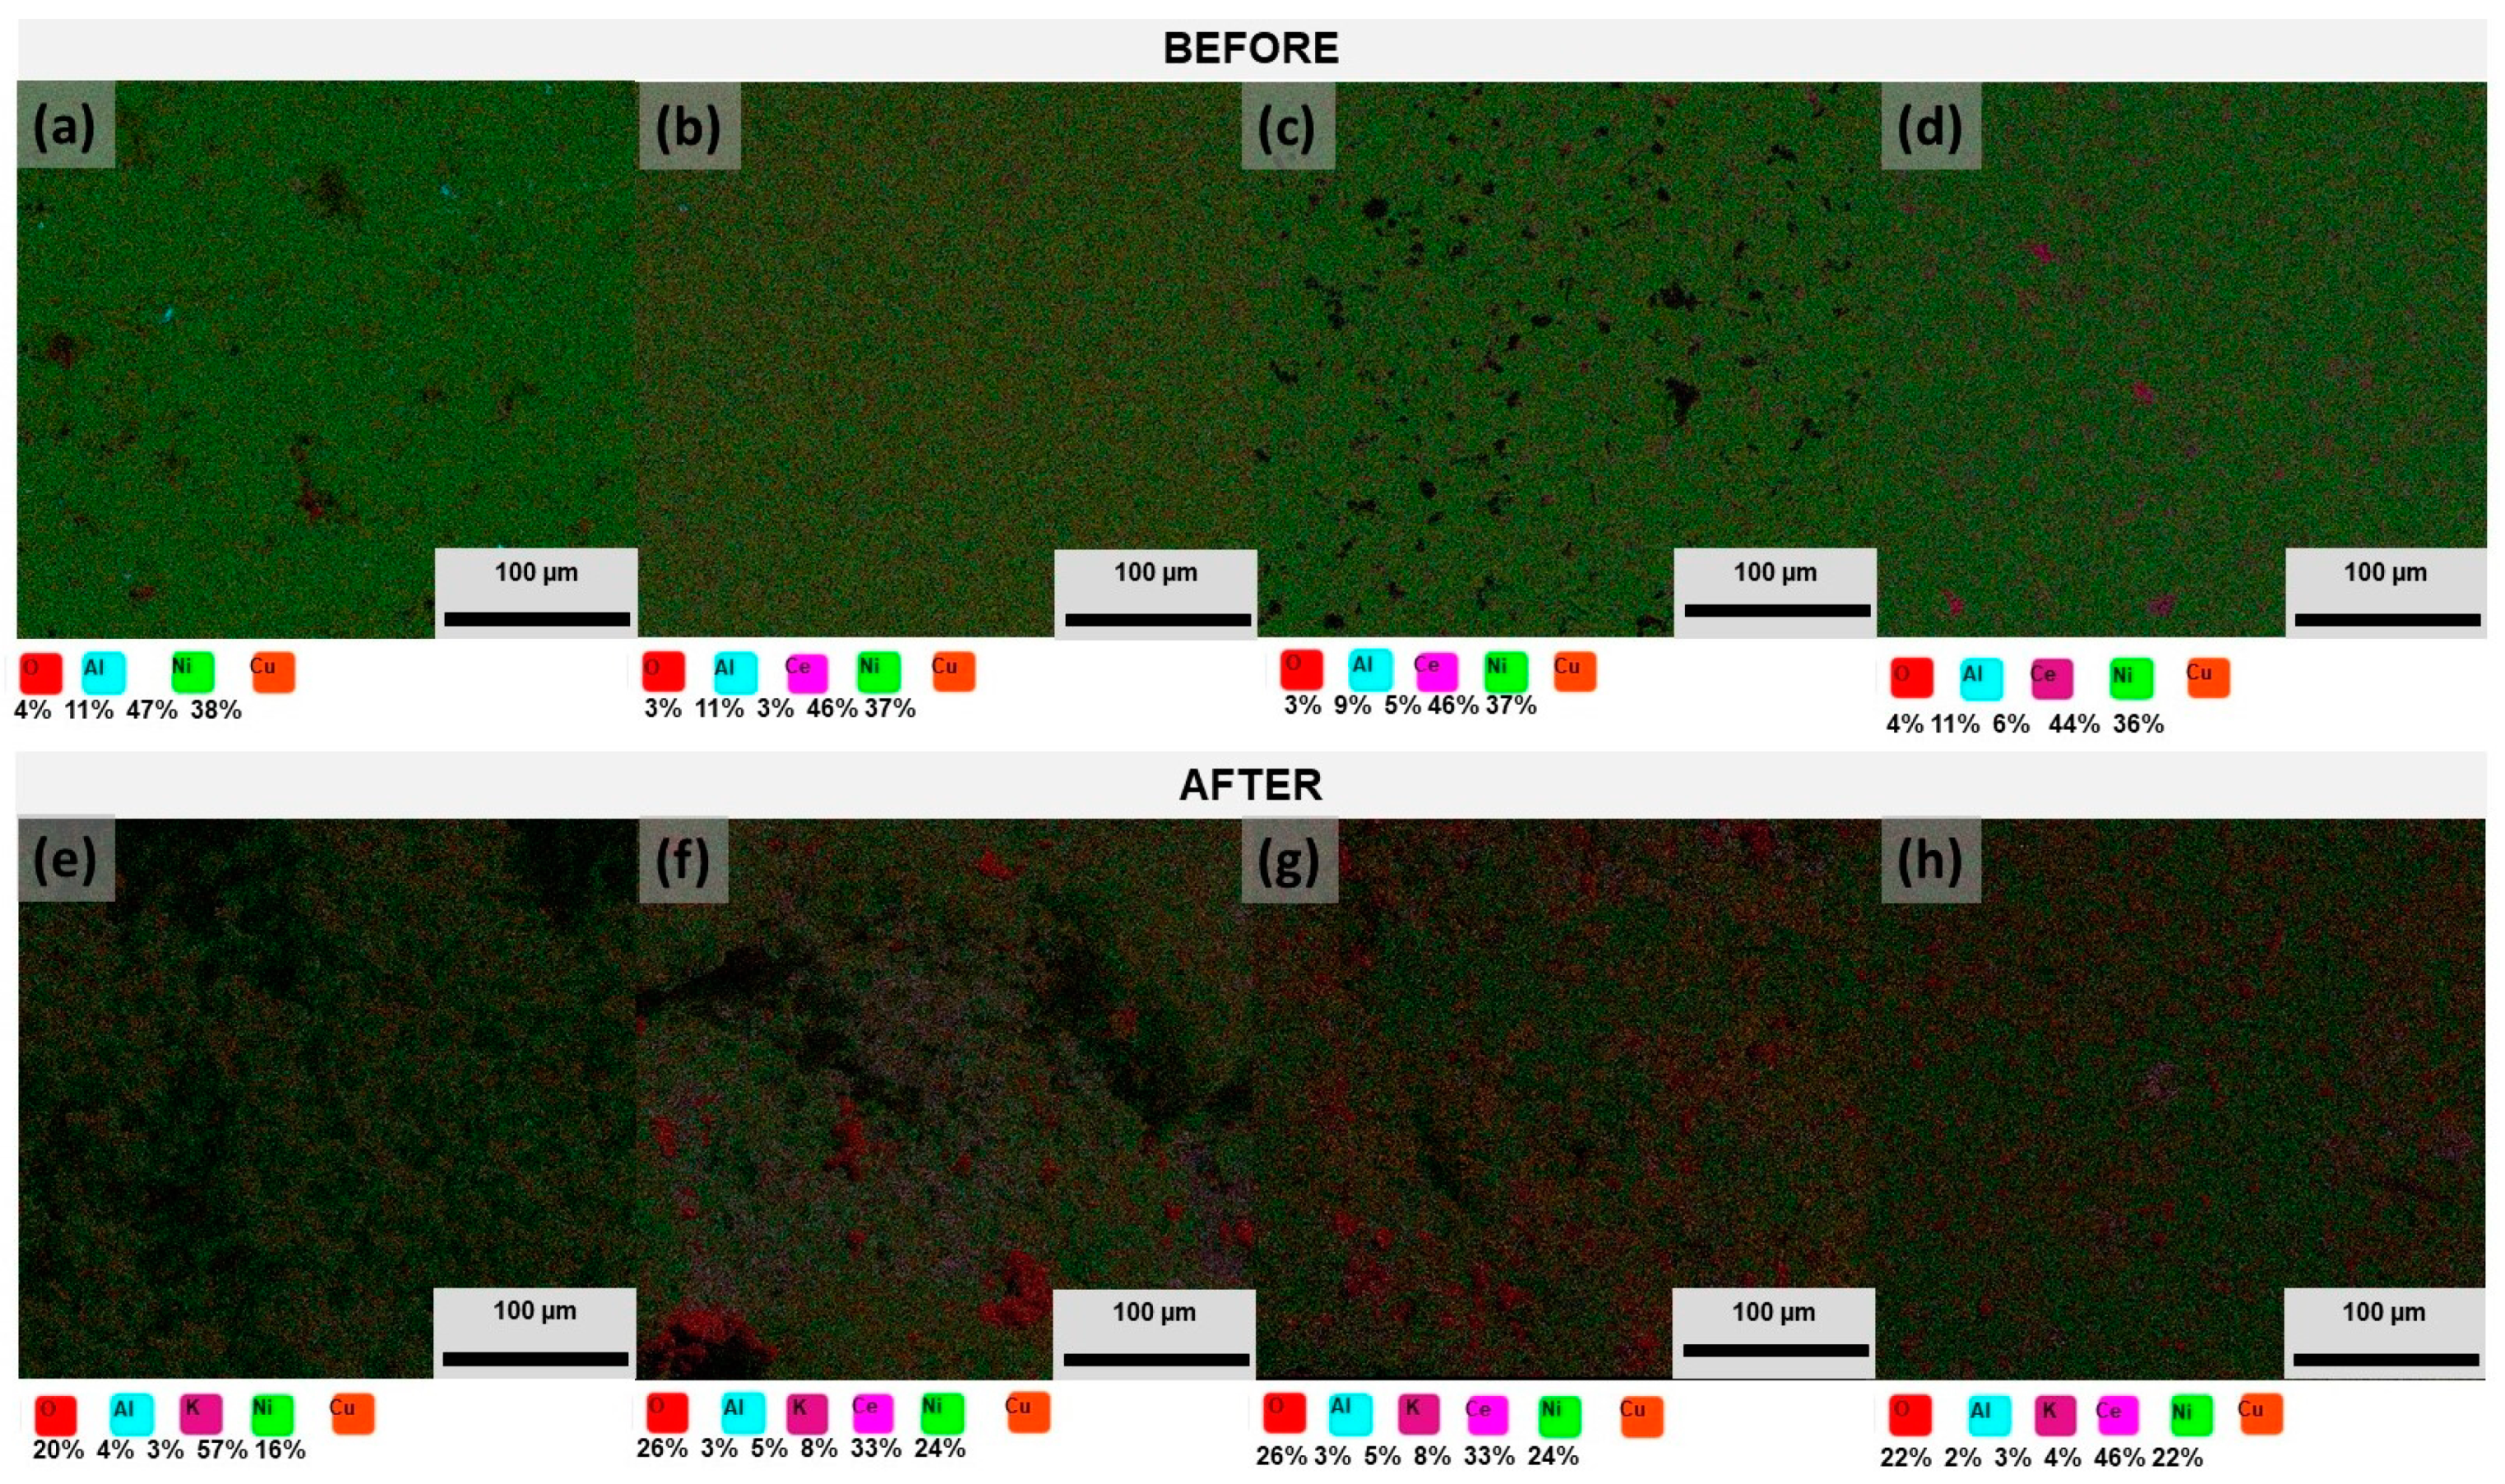
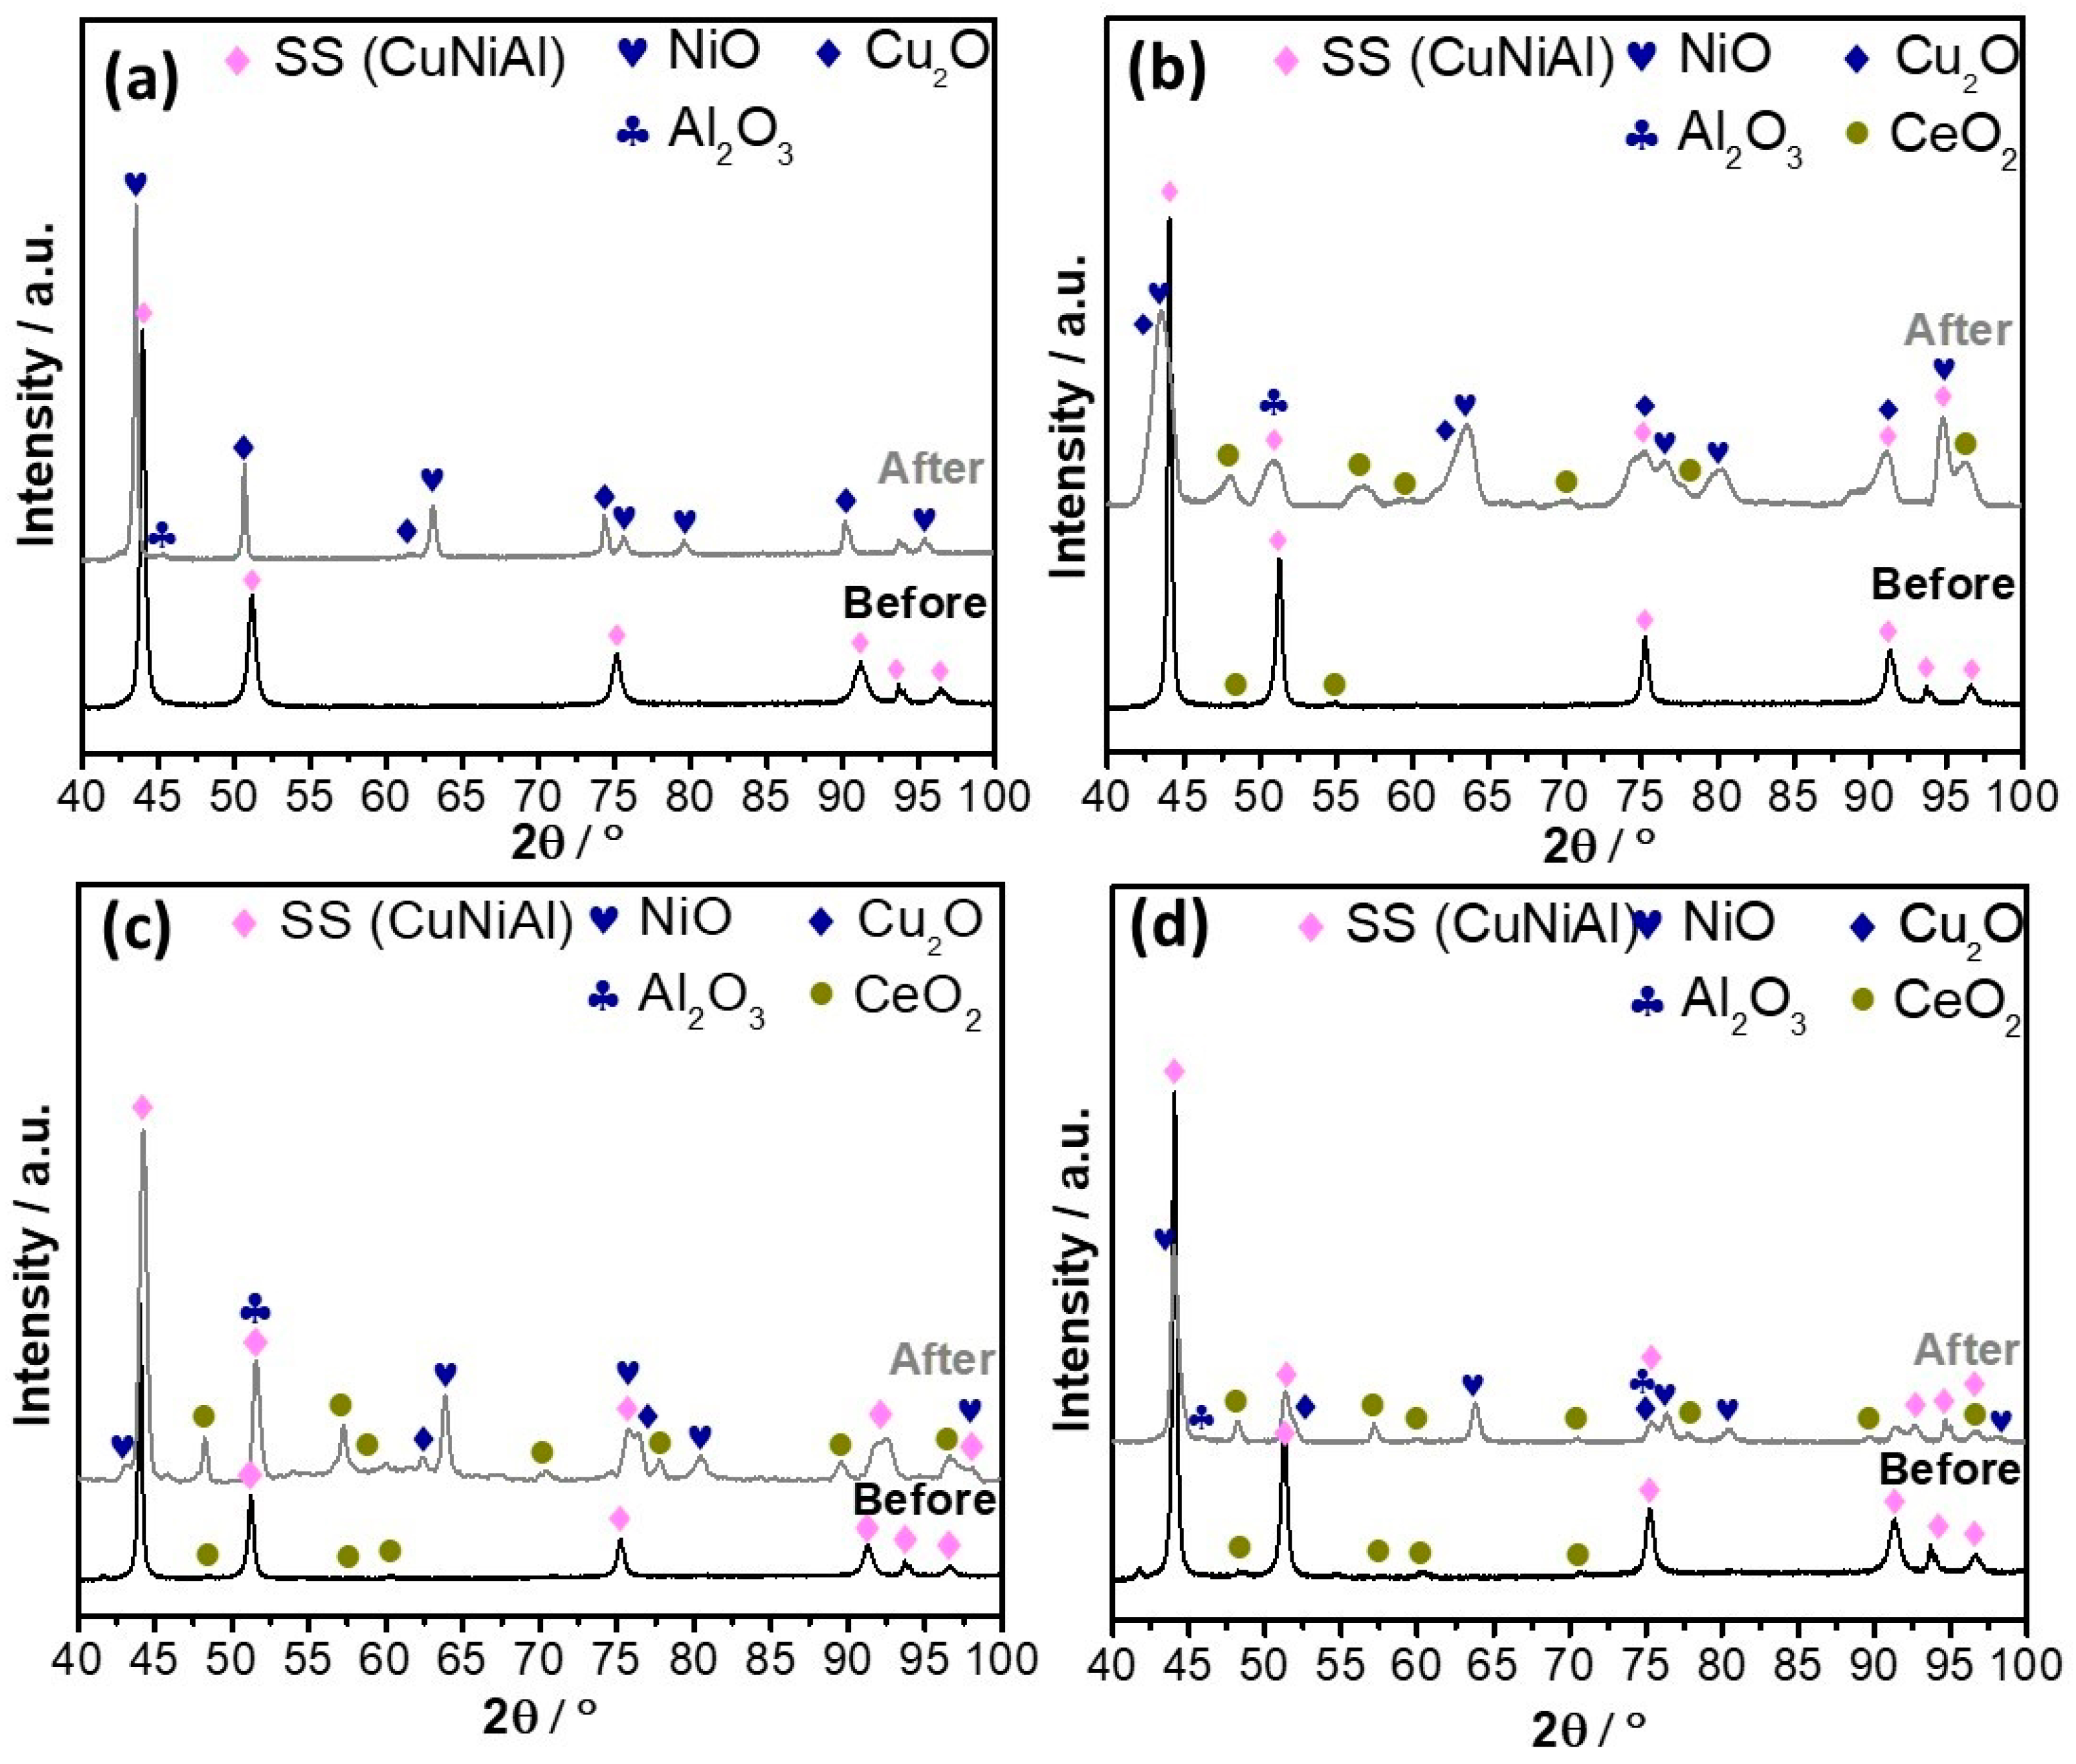 ) 0% wt.% CeO2–NPs, () 1% wt.% CeO2–NPs, () 3% wt.% CeO2–NPs, and () 5% wt.% CeO2–NPs before exposure.
) 0% wt.% CeO2–NPs, () 1% wt.% CeO2–NPs, () 3% wt.% CeO2–NPs, and () 5% wt.% CeO2–NPs before exposure.
) 0% wt.% CeO2–NPs, () 1% wt.% CeO2–NPs, () 3% wt.% CeO2–NPs, and () 5% wt.% CeO2–NPs before exposure.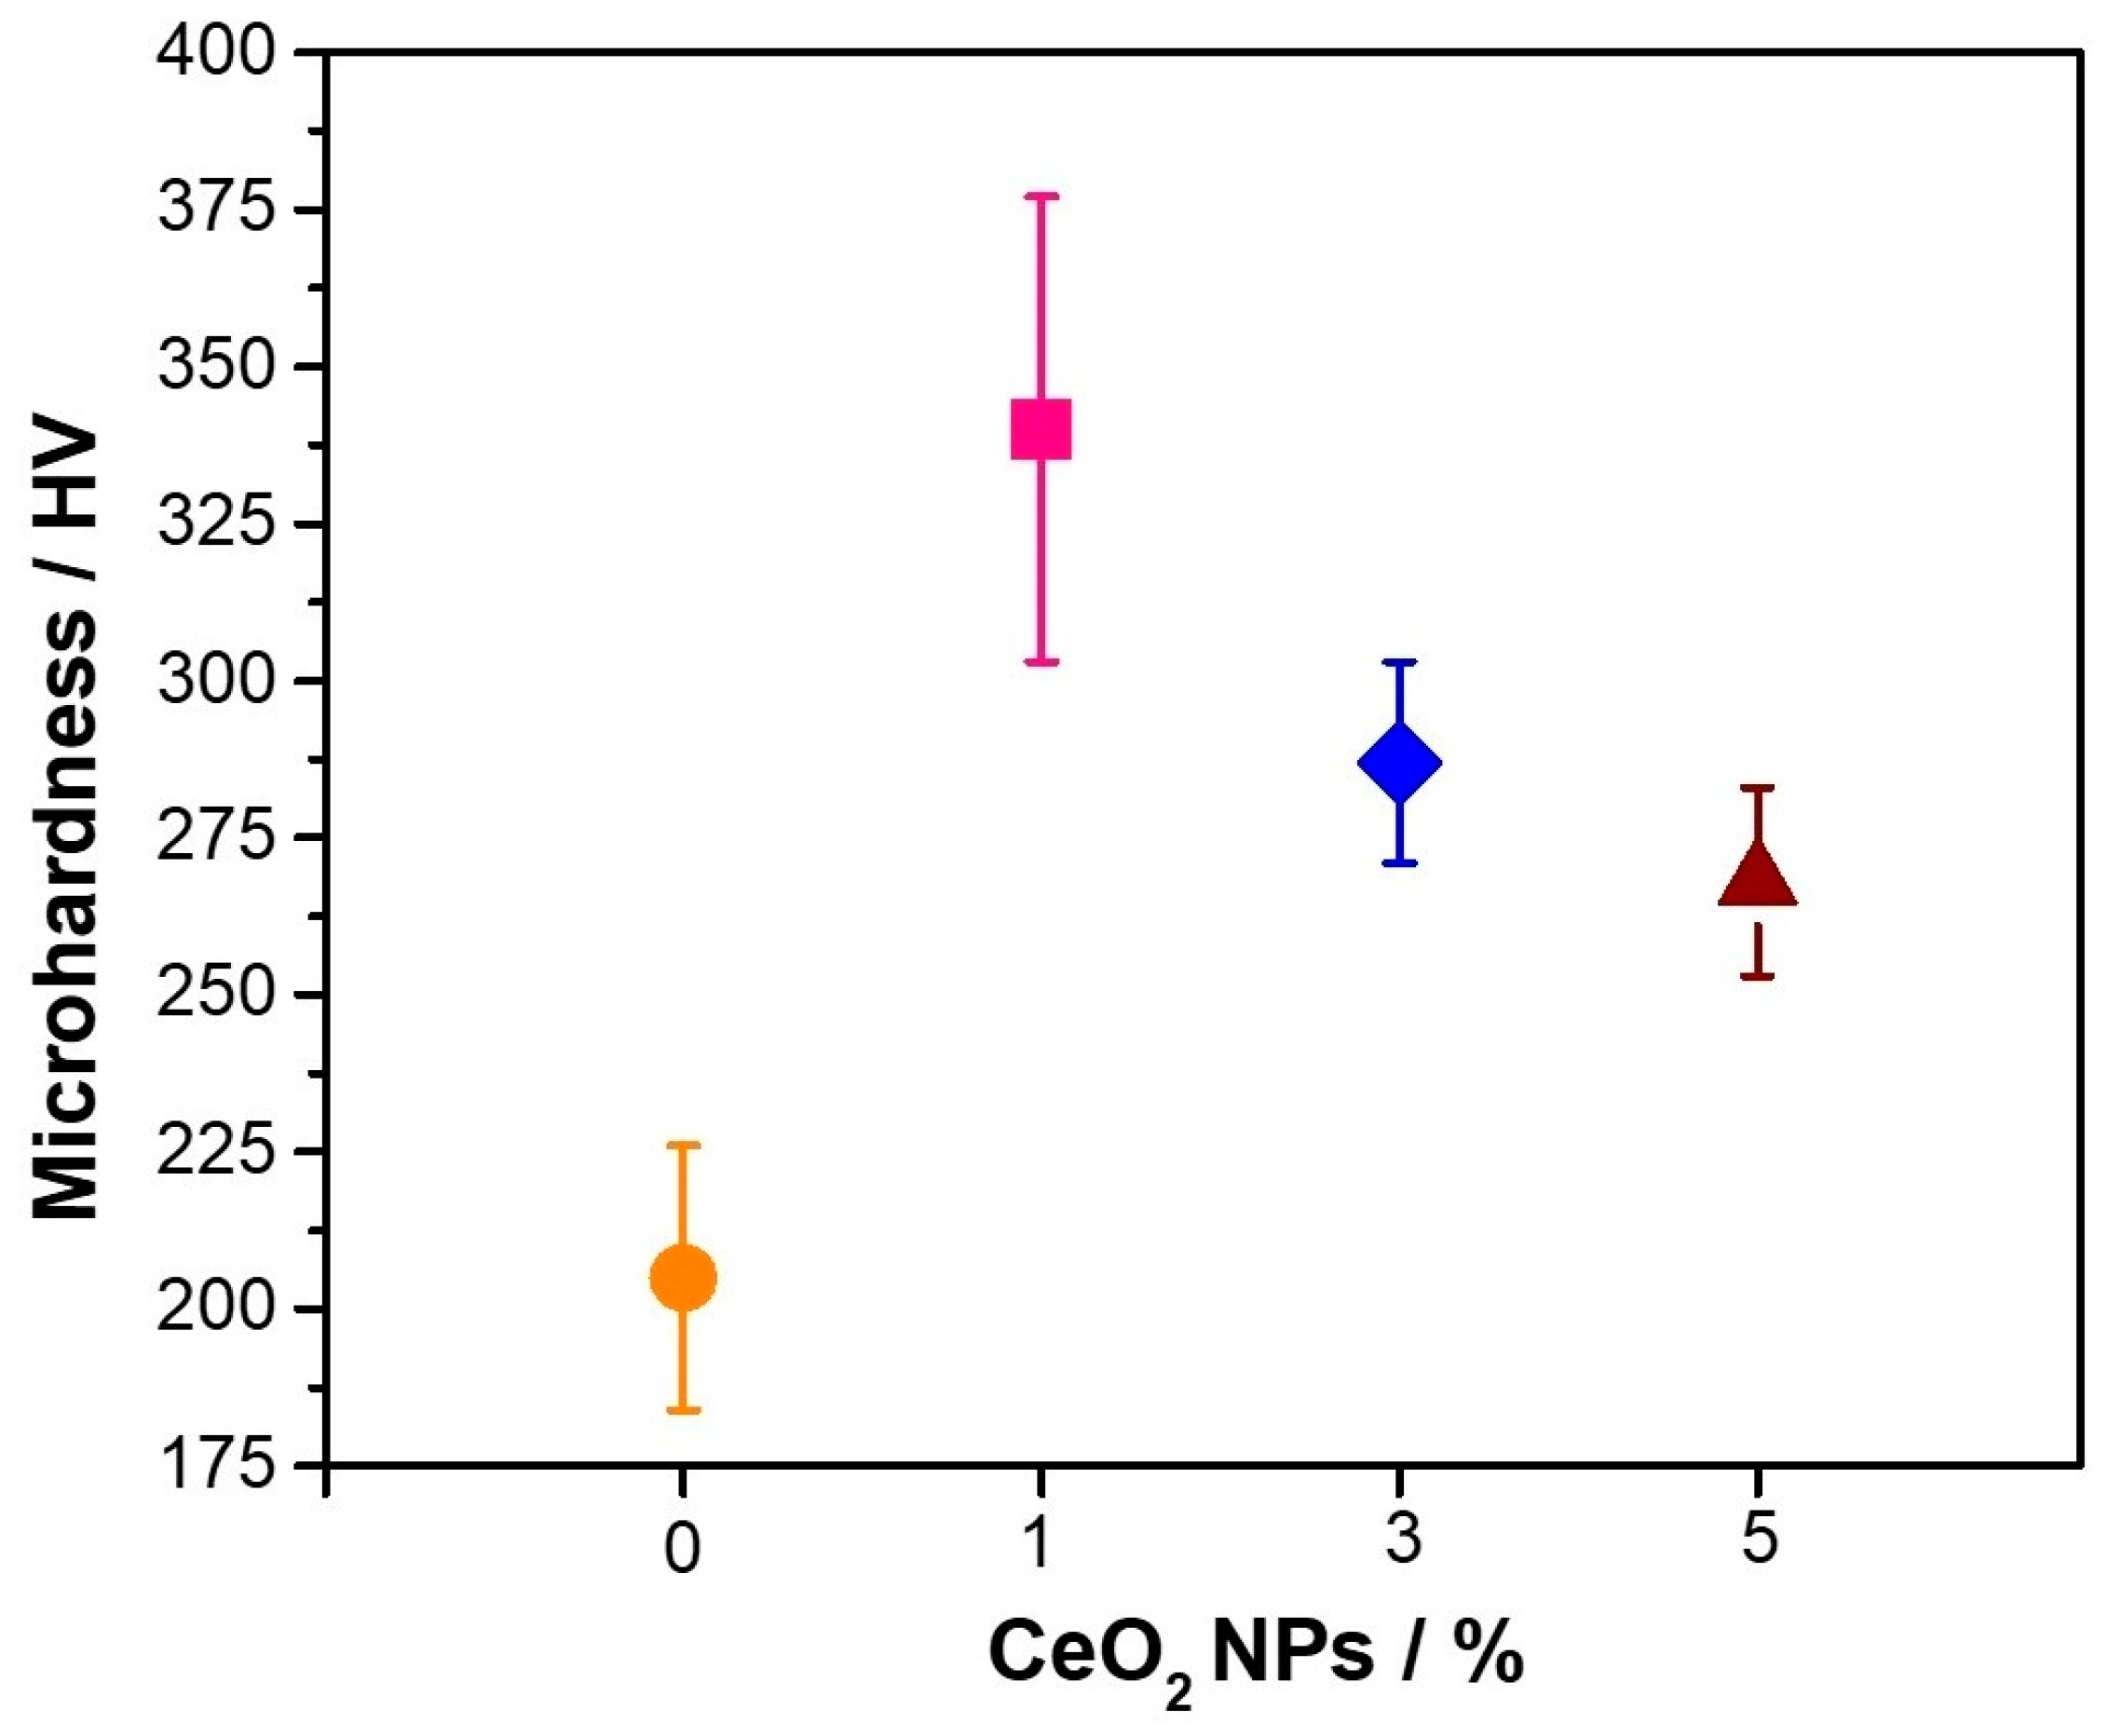 ) Cu–50Ni–5Al and () Cu–50Ni–5Al + 1 wt.% CeO2–NPs exposure to Li2CO3–K2CO3 at 550 °C and aerated atmosphere over time.
) Cu–50Ni–5Al and () Cu–50Ni–5Al + 1 wt.% CeO2–NPs exposure to Li2CO3–K2CO3 at 550 °C and aerated atmosphere over time.
) Cu–50Ni–5Al and () Cu–50Ni–5Al + 1 wt.% CeO2–NPs exposure to Li2CO3–K2CO3 at 550 °C and aerated atmosphere over time.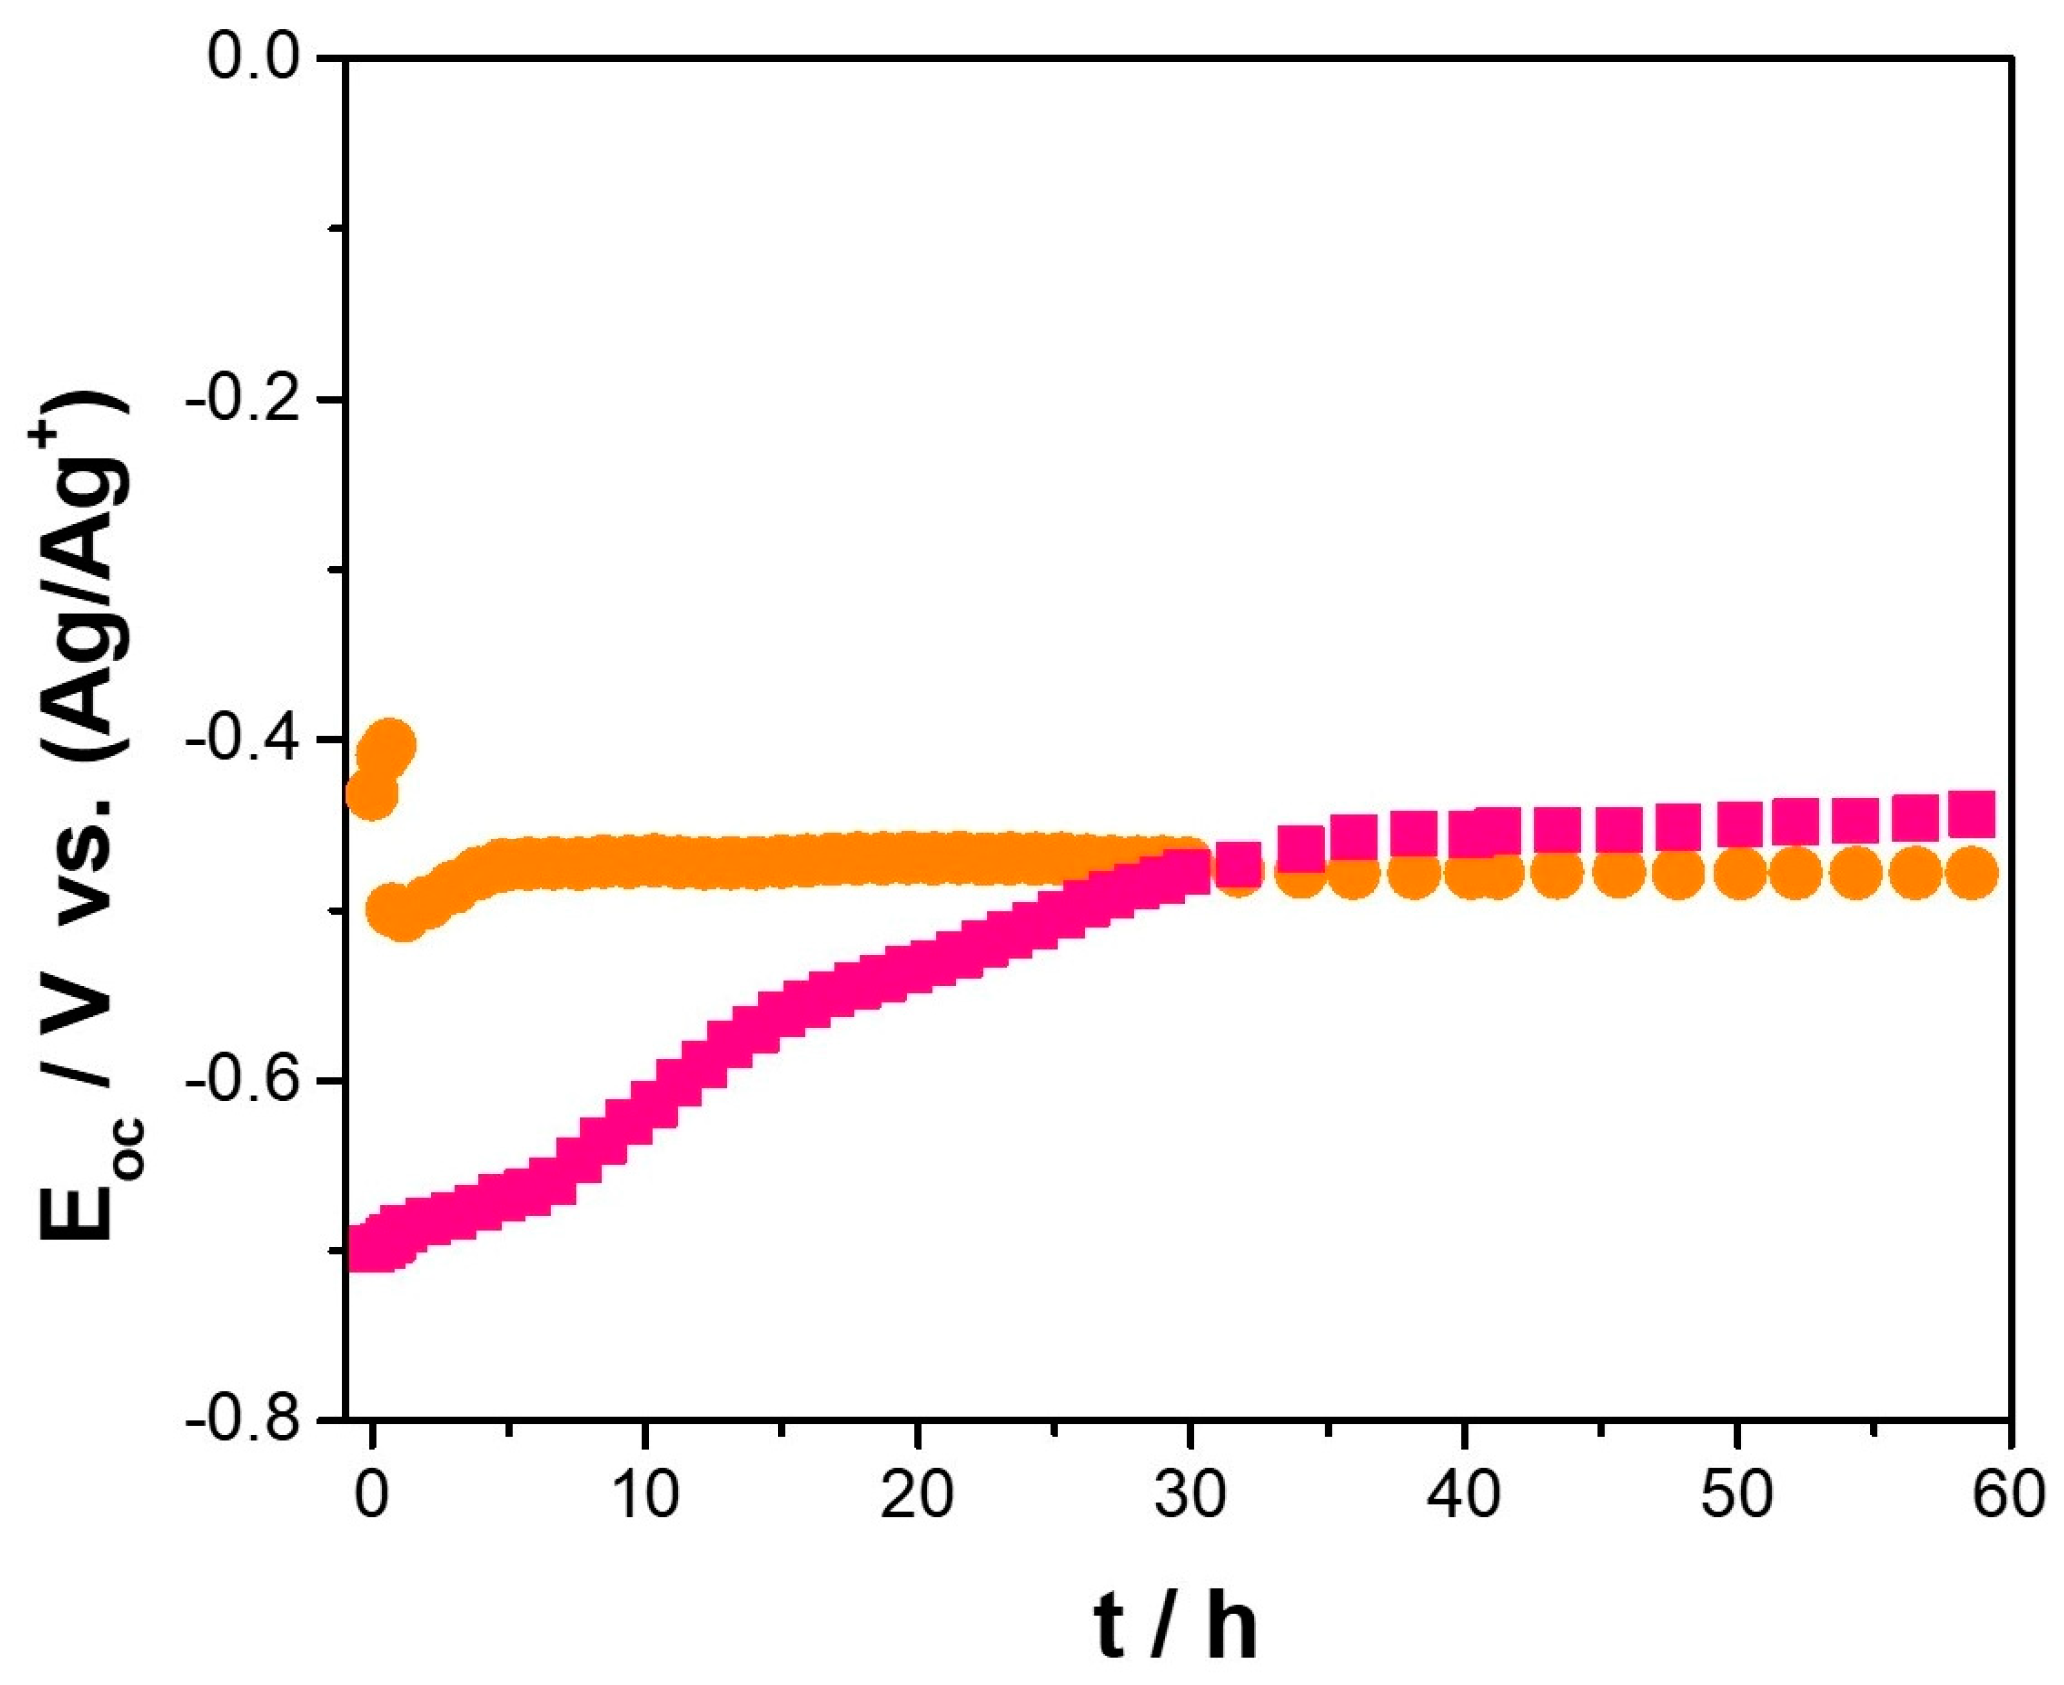


| Sample | Cu | Ni | Al | CeO2 |
|---|---|---|---|---|
| 0 wt.% CeO2–NPs | Bal. | 50 | 5 | 0 |
| 1 wt.% CeO2–NPs | Bal. | 50 | 5 | 1 |
| 3 wt.% CeO2–NPs | Bal. | 50 | 5 | 3 |
| 5 wt.% CeO2–NPs | Bal. | 50 | 5 | 5 |
Disclaimer/Publisher’s Note: The statements, opinions and data contained in all publications are solely those of the individual author(s) and contributor(s) and not of MDPI and/or the editor(s). MDPI and/or the editor(s) disclaim responsibility for any injury to people or property resulting from any ideas, methods, instructions or products referred to in the content. |
© 2024 by the authors. Licensee MDPI, Basel, Switzerland. This article is an open access article distributed under the terms and conditions of the Creative Commons Attribution (CC BY) license (https://creativecommons.org/licenses/by/4.0/).
Share and Cite
Martínez, C.; Arcos, C.; Briones, F.; Machado, I.; Sancy, M.; Bustamante, M. The Effect of Adding CeO2 Nanoparticles to Cu–Ni–Al Alloy for High Temperatures Applications. Nanomaterials 2024, 14, 143. https://doi.org/10.3390/nano14020143
Martínez C, Arcos C, Briones F, Machado I, Sancy M, Bustamante M. The Effect of Adding CeO2 Nanoparticles to Cu–Ni–Al Alloy for High Temperatures Applications. Nanomaterials. 2024; 14(2):143. https://doi.org/10.3390/nano14020143
Chicago/Turabian StyleMartínez, Carola, Camila Arcos, Francisco Briones, Izabel Machado, Mamié Sancy, and Marion Bustamante. 2024. "The Effect of Adding CeO2 Nanoparticles to Cu–Ni–Al Alloy for High Temperatures Applications" Nanomaterials 14, no. 2: 143. https://doi.org/10.3390/nano14020143
APA StyleMartínez, C., Arcos, C., Briones, F., Machado, I., Sancy, M., & Bustamante, M. (2024). The Effect of Adding CeO2 Nanoparticles to Cu–Ni–Al Alloy for High Temperatures Applications. Nanomaterials, 14(2), 143. https://doi.org/10.3390/nano14020143