Article

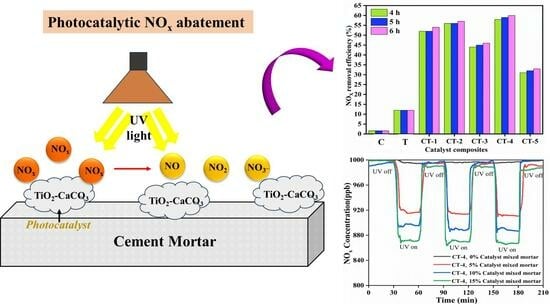
Development of TiO2–CaCO3 Based Composites as an Affordable Building Material for the Photocatalytic Abatement of Hazardous NOx from the Environment

1
GOONWORLD Corporate Research Institute, Dong-gu, Daegu 41065, Republic of Korea
2
Department of Chemistry Education, Chosun University, Gwangju 61452, Republic of Korea
3
Korea Conformity Laboratories, Daegu 42994, Republic of Korea
*
Author to whom correspondence should be addressed.
Nanomaterials 2024, 14(2), 136; https://doi.org/10.3390/nano14020136
Submission received: 8 December 2023 / Revised: 2 January 2024 / Accepted: 5 January 2024 / Published: 6 January 2024

Abstract

:
This study explores the depollution activity of a photocatalytic cementitious composite comprising various compositions of n-TiO2 and CaCO3. The photocatalytic activity of the CaCO3–TiO2 composite material is assessed for the aqueous photodegradation efficiency of MB dye solution and NOx under UV light exposure. The catalyst CaCO3–TiO2 exhibits the importance of an optimal balance between CaCO3 and n-TiO2 for the highest NOx removal of 60% and MB dye removal of 74.6%. The observed trends in the photodegradation of NOx removal efficiencies suggest a complex interplay between CaCO3 and TiO2 content in the CaCO3–n-TiO2 composite catalysts. This pollutant removal efficiency is attributed to the synergistic effect between CaCO3 and n-TiO2, where a higher percentage of n-TiO2 appeared to enhance the photocatalytic activity. It is recommended that CaCO3–TiO2 photocatalysts are effectiveness in water and air purification, as well as for being cost-effective construction materials.

Graphical Abstract

1. Introduction

A flurry of research activities is directed at the removal of nitrogen oxides (NOx), one of the main pollutants in the atmosphere, due to their toxic effects on health and a series of other ecological and environmental problems [1]. Various methodologies have been developed, such as selective non-catalytic reduction, selective catalytic reduction, scrubbing, and adsorption, to control NOx emissions [2]. However, the above-mentioned technologies for NOx degradation are costly and cause secondary pollution [3]. One of the promising techniques for enhancing the photocatalytic performance of heterojunction semiconductor catalysis has been attempted to resolve these issues [4,5,6]. In the process of development to real applications, titanium dioxide (TiO2) photocatalysts have also been included in concrete engineering toward degradation of NOx in the atmosphere [7]. Despite a few advancements in the production of commercial photocatalytic types of cement with the inclusion of nano titanium dioxide (n-TiO2) particles, the utility of photocatalytic cement/concrete is limited, especially in terms of its efficiency in dealing with air pollution and cost-effectiveness [8,9]. Many reports revealed the efficacy of TiO2 photocatalysts in cementitious materials (with TiO2 loadings from 1 to 10 wt.% as a fraction of the cement content) [10]. These TiO2 preparations of photocatalytic cement/concrete materials have been proven to be efficient in depolluting the environment by degrading NOx (de-NOx effect). The successful application of n-TiO2 cement-based materials in engineering has been well demonstrated. The pavement prepared with n-TiO2 cement-based materials in China exhibited a good ability to remove NOx exhaust from vehicles [11]. The road exhaust index of nano-TiO2 concrete pavement materials in Milan, Italy, was determined, and it was found that a reduction of 60–70% in the pollution index has been witnessed [12]. A cricket stadium in Dubai sports city is coated with nano-TiO2 white cement in buildings to provide improved air quality [13]. However, there are a few key questions regarding maximizing the photocatalytic efficiencies and cost-effectiveness of n-TiO2-incorporated photocatalytic cement/concrete in real environmental conditions.
The n-TiO2 has several advantages and features, like stable physical and chemical properties, non-toxic nature, low cost, and adequate photocatalytic activities under ultraviolet light [14,15,16,17,18]. n-TiO2 can be easily agglomerated when it is mixed with cementitious materials [19]. The highly alkaline and calcium-rich cement environment promotes TiO2 agglomeration, decreases the catalyst surface area, and causes the surface precipitation of calcium hydroxide/calcium carbonate [20]. As a consequence of poor dispersibility and/or occlusion of TiO2 by cement hydrates, high loadings of n-TiO2 are required to achieve high photocatalytic efficiency, which leads to higher costs. These aspects make the effective dispersion of TiO2 in cement/concrete a challenging task [21]. It should also be kept in mind that n-TiO2 has a poor response under visible light, which limits the development of photocatalytic cement-based materials in natural light scenarios [22]. We envisage that there needs to be a good strategy for balancing high photocatalytic efficiency and cost-effectiveness in real-world conditions.
The aim of this study is to develop an efficient and cost-effective photocatalytic cement material along with TiO2 as a promotor and immobilize the resultant composite onto the surface of a pre-formed mortar (which can absorb the composite particles on its surface). Calcium carbonate (CaCO3) is a kind of inorganic, nonmetallic mineral (mostly as calcite) material with abundant reserves and also derived from biowaste chicken eggshells; calcite materials have advantageous characteristics, such as high whiteness and low cost, and are considered superior to most non-metallic minerals in cost-effective performance [23,24]. The development of CaCO3–nano-TiO2 composite photocatalysts using CaCO3 as the additive to TiO2 has been demonstrated to reduce the agglomeration of TiO2 particles, improve the recyclability and reusability performance of nano-TiO2, and enhance the photocatalytic efficiency of nano-TiO2 particles. In the literature, a few techniques, such as hydrolytic deposition, sol-gel, and chemical precipitation methods, have been reported for the preparation of TiO2–n-CaCO3. The hydrolysis of TiCl4 on the surface of CaCO3 and the resultant composite exhibited the maximum photocatalytic degradation efficiency (95%) of Rhodamine B (10 ppm) upon UV irradiation [21,25,26]. The preparation of CaCO3–TiO2 composite particles has been demonstrated through carbonation in a TiO2 system [27]. The preparation of CaCO3–TiO2 composite particles with hydrophobic agglomeration has been detailed [28,29]. The CaCO3–TiO2 composite was prepared using the chemical precipitation method by coating the surface of CaCO3 with TiO2 using titanium sulfate as the titanium source [30]. The resulting product, CaCO3–TiO2, has been proven to have high ultraviolet absorption capacity. However, the above methods for the preparation of CaCO3–TiO2 are complex, time-consuming, and costly. It should be mentioned that the utility of CaCO3–TiO2 composites for construction material development is scarce.
The photocatalytic CaCO3–TiO2 composites were optimized to achieve high catalytic efficiency for NOx degradation, and aqueous methylene blue (MB) photodegradation efficiencies were hardly reported. In this work, we develop a CaCO3–TiO2 composite with various weight percentages (wt.%) of catalyst-based cement mortar and surface coating on the mortar to enhance the efficiency and also the production of large-scale, cost-effective construction materials.

2. Materials and Methods

2.1. Materials

Anatase TiO2 (COTIOX KA-100, Cosmo Chemical, Ulsan, Republic of Korea), CaCO3 (Taekyung BK, Seoul, Republic of Korea), and Methylene Blue (Samchun, Pyeongtaek, Republic of Korea) were used without further process.

2.2. Preparation of CaCO3–n-TiO2 (CT) Catalysts

To prepare the CaCO3–n-TiO2 composite, various weight percentages (wt.%) of CaCO3 (C) and TiO2 (T), such as CT-1(C 70-T 30), CT-2 (C 60-T 40), CT-3 (C50-T 50), CT-4 (C 40-T 60), and CT-5 (C 30-T 70), were mixed using a mortar and pestle for 30 min at room temperature.

2.3. Preparation of Photocatalyst Included Mortar

Mortar specimens were prepared following the compressive strength test method (KS L 5105) of hydraulic cement mortar. In a typical preparation, cement and standard sand were used in a weight ratio of 1:2.45, and the amount of water was 60% based on the weight percentage of the cement. The mortar specimen size was 100 mm long, 50 mm wide, and 5 mm high. The photocatalyst was applied on the surface of the early-aged mortar (cured in water for 7 days and dried in the air for 2 days) thin plate samples; toward that, approximately 0.5 g of the CT composite photocatalyst was dispersed in 1 g of water and directly applied uniformly on the mortar surface as a coating and dried at 80 °C. For testing the mortars mixed with photocatalysts, in addition, the calculated amount of photocatalyst was mixed with 5, 10, and 15% based on the weight percentage of cement. For the NOx reduction test (KS L ISO 22197-1), water curing at 25 °C was performed for 7 days. The fabricated cement mortar specimen is shown in Figure S1.

3. Characterization

The phase purity of the composite samples was confirmed using room temperature XRD (Panalytical, United Kingdom) measured with Cu–Kα (λ = 1.5418 Å) radiation and a 0.02° scan step size from (2θ) 10 to 80°. Field emission scanning electron microscopy (FE-SEM) was analyzed with Hitachi and X-ray photoelectron spectroscopy (XPS), Thermo Fisher, Waltham, MA, USA (NEXSA). The optical properties were analyzed with a UV–Vis spectrophotometer S-3100 (Scinco Co., Ltd., Seoul, Republic of Korea). The photo-catalytic performance of the photocatalysts was investigated by irradiating the MB solution under a UV lamp (20 W, λ = 352 nm) purchased from SANKYO DENKI CO., Ltd., Tokyo, Japan. The concentration of MB was assessed with a UV–Vis spectrophotometer S-3100 (Scinco Co., Ltd.) at 665 nm. The concentrations of NOx were recorded with the chemiluminescence technology of the NOx analyzer—Serinus 40.

3.1. Photodegradation of MB

The experiments were performed following the specifications of KS L ISO 10678. Before irradiation, 0.5 g of photocatalyst powder was added to the MB solution prepared with a concentration of 10 mg/L. The bulk MB (200 mL) was prepared in water, and the TiO2 sample was dispersed with continuous stirring for 10 min. The dispersion was kept in a dark chamber for 1 h to ensure adsorption–desorption equilibrium. Subsequently, the mixed solution was irradiated under UV light and stirred constantly, while the temperature inside the stainless chamber was maintained at 25 °C. At periodic time intervals, a catalyst solution was taken successively from the mixture using an appropriate filter mounted on a syringe to separate photocatalyst particles. The concentration of MB was assessed by recording the absorbance of the solution at 665 nm.

3.2. Photodegradation of NOx

NOx removal experiments were carried out according to the KS L ISO 22197-1 standard. The photoactivity of the prepared samples was measured through a photoreactor placed in a stainless box whose dimensions were 620 mm × 430 mm × 285 mm. The photoreactor was 430 mm long, 100 mm wide, and 40 mm high. On the top cover of the stainless box, light sources were installed to induce photoactivity. The size of the sample in the photoreactor was 100 mm long, 50 mm wide, and 5 mm high. The distance from the top surface of the mortar thin plate sample to the optical window of the photoreactor was approximately 10 mm. The prepared mortar sample was introduced into the photoreactor, and then the mass flow controller was used to adjust the flow rate of NO gas, water vapor, and air. The concentrations of NOx were recorded with the chemiluminescence technology of the NOx analyzer—Serinus 40. The photocatalytic experiment was carried out when NOx was stabilized at 1000 ppb for 30 min after reaching the adsorption–desorption equilibrium in dark conditions. A UV lamp emitting UV rays between 310 nm and 400 nm was used to illuminate the photocatalytic mortar sample surface at an intensity of 1000 µW/cm2 for 6 h. Afterward, the UV light was turned off, and the NOx concentration went back to the stabilized concentration level monitored for 30 min.

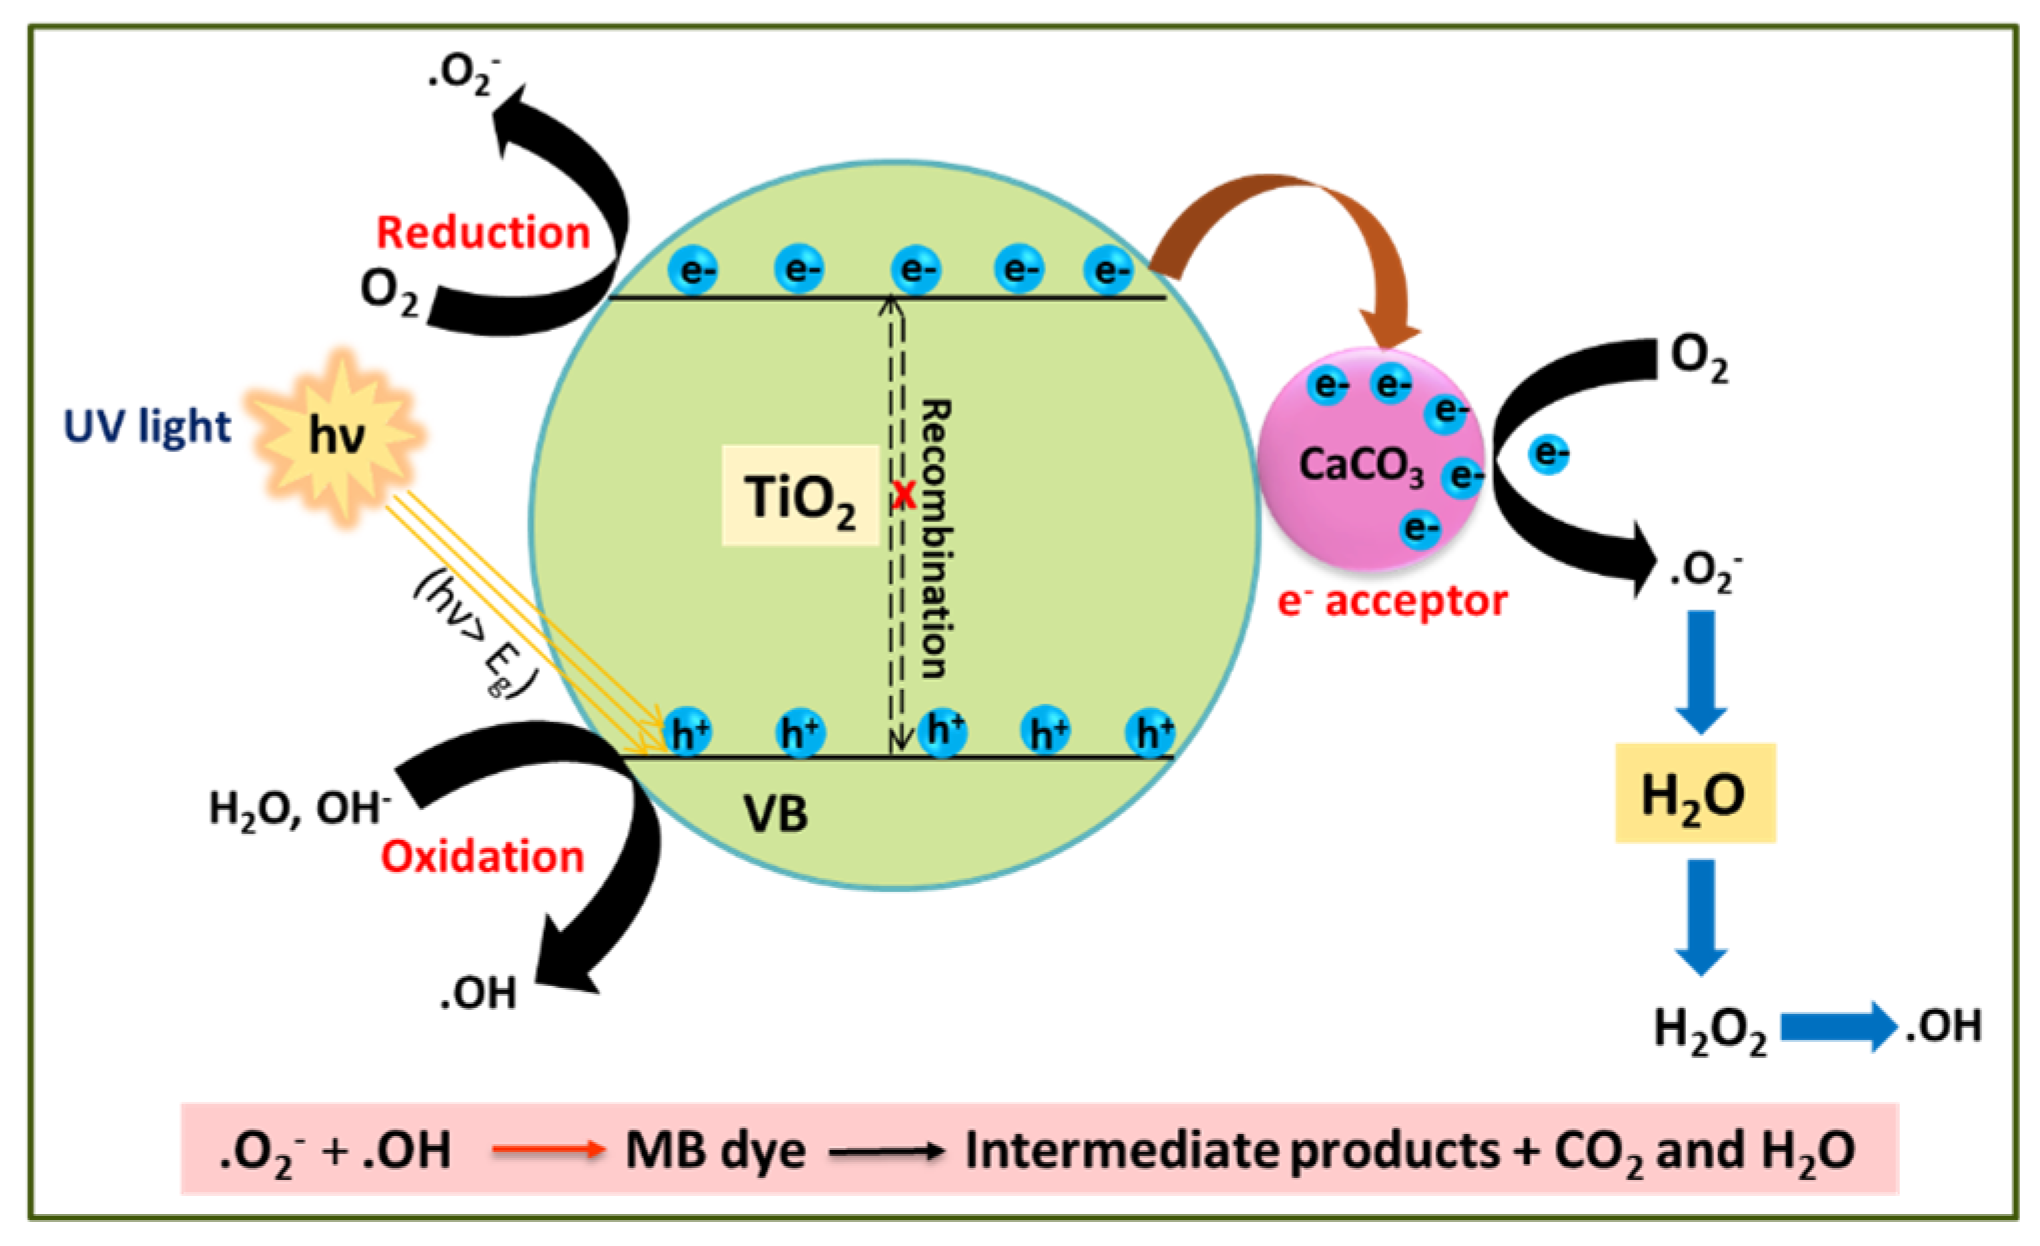
3.3. Possible Photocatalytic Mechanism of MB

The photocatalytic mechanism of MB dye degradation by the TiO2–CaCO3 composite is depicted in Figure 1.
The TiO2 component of TiO2–CaCO3 acts as a photocatalyst to mainly perform the photocatalytic function. Under the influence of UV light irradiation, the high-energy photons activate to create photoinduced electrons (e) and holes (h+) in TiO2. The negatively charged electrons are energized to cross the band gap (Eg) and jump into the CB, leaving behind positively charged holes in the VB. In the presence of CaCO3, the CB electrons migrate towards the surface of CaCO3 (CaCO3 acts as an e-sink). This electron transfer process can prevent the e-h+ pair recombination. Then, the electrons trapped in CaCO3 can react with adsorbed O2 to generate free superoxide radicals (●O2). Simultaneously, photogenerated holes combine with H2O or the adsorbed hydroxyl ion (OH) molecules to form hydroxyl radicals (●OH). Finally, the generated free radicals (●OH, ●O2, h+) with high oxidizing ability would destroy the MB molecules into low-weight intermediates. These smaller compounds are further degraded to similar molecules, such as CO2 and H2O.
The entire photocatalytic process for MB degradation is summarized in the following equations:
TiO2+ hν (UV) → TiO2 (eCB + h+ VB)
TiO2 (eCB + h+VB) + CaCO3 → TiO2 (h+VB) + CaCO3 (e)
CaCO3 (e) + O2 → CaCO3 + ·O2
TiO2 (h+VB) + OH→ TiO2 + ·OH
O2· + H+ → ·OOH
2·OOH → O2 + H2O2
H2O2 + O2 → ·OH + OH + O2
H2O2 + hν → 2OH
MB + Reactive species (h+, e, ·OH, ·OOH or O2·) → Intermediates
Intermediates → Degradation products + CO2 + H2O

3.4. The Possible Photocatalytic Mechanism of NOx

The mechanism of NOx reduction using pristine and TiO2–CaCO3 composite catalysts reduces the NOx under UV light irradiation. With the exposure to UV light, the catalyst composite becomes activated, resulting in the generation of electron–hole pairs, which is a crucial step in the photocatalytic process. The composite material remains intact and can continually serve as a photocatalyst, facilitating the reduction of NOx and the oxidation of organic contaminants under UV light exposure. Once the NOx molecules are reduced and organic contaminants are oxidized, they may desorb from the composite surface as harmless gases or byproducts [31]. This process continues as long as there is an energy source, such as UV light, to activate the TiO2–CaCO3 component of the composite. It offers an eco-friendly approach to reduce NOx emissions and potentially eliminate organic pollutants from the surrounding environment, making it a valuable method for enhancing air quality and reducing the environmental impact of construction materials.
The chemical reactions involved are as follows:
Adsorption of NOx:
NO + TiO2-CaCO3 → NO/TiO2-CaCO3
Generation of electron–hole pairs under UV light:
TiO2-CaCO3 + UV Light (hν) → e + h+
Reduction of NOx under UV light:
NO/TiO2-CaCO3 + e → N2 + O2 + TiO2-CaCO3
These equations illustrate the essential steps in the photocatalytic NOx reduction process using a TiO2–CaCO3 composite with UV light as the energy source [32,33].

4. Results and Discussion

The photocatalytic efficiency of the prepared CaCO3–n-TiO2 composites, catalysts with various weight percentages (wt.%) of C and T (CT-1, CT-2, CT-3, CT-4, and CT-5), was analyzed. The photocatalytic experiments were carried out in both aqueous as well as in gaseous conditions. Typically, the photodegradation experiments of MB were carried out in aqueous solution under UV irradiation. Gaseous NOx photodegradations were performed with the prepared composite photocatalysts under UV irradiation.

4.1. Photodegradation of MB

The photocatalytic activity of the composite catalysts C, T, CT-1, CT-2, CT-3, CT-4, and CT-5 under UV light irradiation was analyzed. The absorbance changes at 665 nm were monitored over the reaction interval of 15 min up to 3 h during the photocatalytic degradation process and are shown in Figure 2. The percentage of MB dye degradation efficiency was calculated with the following equation:
Degradation   efficiency   ( % ) =   C 0 C C 0 × 100
where C0 is the initial concentration of the MB dye solution, and C is the final concentration of the MB dye absorption after irradiation [34].
The photocatalytic degradation of MB by pure T was found to be the slowest as evidenced by the lowest MB-PDE of 44.39% after 3 h (shown in Table 1).
The MB-PDE of C after 3 h is deplorably low (9.40%). The MB-PDE values of the CaCO3–n-TiO2 composite photocatalysts take the order CT-4 > CT-2 > CT-3 > CT-5 > CT-1 > T > C; the degradation efficiency is shown in Figure 2. The trend indicates that there is variation in the MB-PDE values amongst the composite photocatalysts. The CT-4, at 74.5%, exhibits the highest MB-PDE value. It gives a clue that not only the simple synergistic effect of the two components in the composites but also the composition play an important role in deciding the photocatalytic efficiency of the prepared photocatalysts [35,36,37,38]. The photodegradation of MB under UV irradiation follows the pseudo-first-order kinetics, and the rate constants derived from the slopes of the linear plots are presented in Figure S1. In a comparison of the pristine samples of C and T, the composite samples of CT-1, CT-2, CT-3, CT-4, and CT-5 had increased rate constants in comparison to their pristine counterparts. Consequently, this indicates that there can be a hybrid effect that may influence the rate of MB photodegradation [39,40]. The rate constant comparison informs that the CT-4 samples showed the highest photodegradation rate constants for MB photodegradation amongst the photocatalysts tested. The rate constant for the CT-4 samples is typically reported to be 0.45 s−1, which is considerably higher than the rate constant for pure T samples (0.2 s−1) as well as the rate constant for C samples (0.03 s−1), which indicates that there has been a hybrid effect between the C and T photocatalysts on the composite CT-4 photocatalytic properties [41].

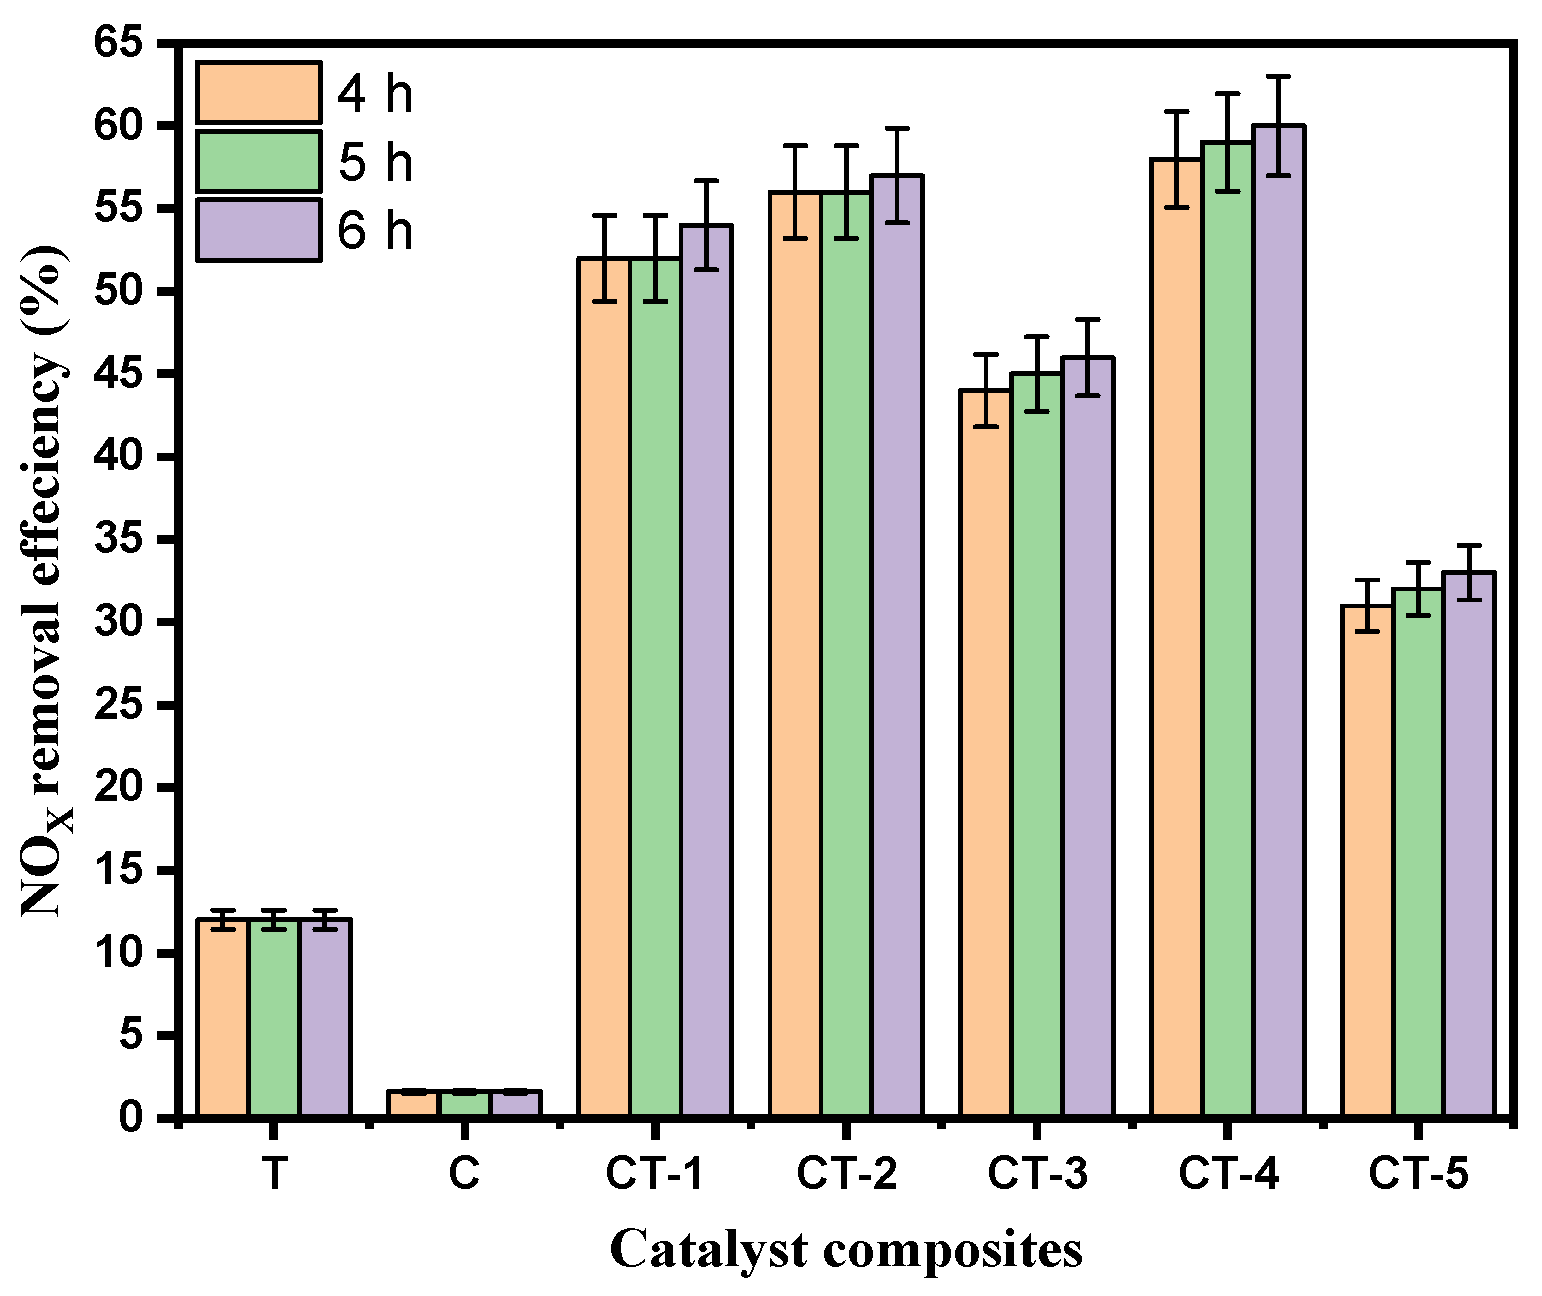
4.2. Photodegradation of NOx

The photocatalytic performance of pristine and CaCO3–n-TiO2 composite catalysts with varying weight percentages of CaCO3 and n-TiO2 (C and T) was evaluated for NOx removal under UV light at room temperature and is shown in Figure 3. The catalyst exhibited effective photocatalytic activity, leading to a notable decrease in the concentrations of NOx. The NOx removal performance was computed using the following equation:
N O x   r e m o v e l   e f f i c i e n c y % = N O x i n N O x o u t N O x i n × 100
where NOx represents the initial concentration of NOx, and NOx out is the recorded concentration at the end of the photodegradation process [32].
Figure 4 presents the bar chart indicating the comparison of the NOx removal efficiency (%) of the various composites and pure components (C and T). The results in Figure 3 and Figure 4 show that CT-4 exhibited excellent NOx photodegradation compared with the other composites and pure components.
Figure 4 shows the pristine and different concentrations of the composite samples of NOx degradation efficiency between the mortar, pristine, and composite photocatalysts. The mortar sample that showed the lowest NOx photodegradation efficiency of 1.6% was the sample mixed with the C sample. In contrast, the CT-4 composite samples exhibited the highest NOx photodegradation efficiency of 60% during 6 h. The observed trends in photocatalytic NOx removal efficiencies suggest a complex interplay between CaCO3 and TiO2 content in the CaCO3–n-TiO2 composite catalysts. The catalyst CT-4 highlights the importance of an optimal balance between CaCO3 and n-TiO2 for the highest NOx removal. This removal efficiency can be attributed to the synergistic effect between CaCO3 and n-TiO2, where the higher percentage of n-TiO2 appeared to enhance the catalytic activity for NOx degradation. The increase in n-TiO2 content seemed to have a marginal effect on the catalyst performance, suggesting a potential threshold or optimal balance between carbon and titanium dioxide content for enhanced photocatalytic activity.

4.3. NOx Photodegradation of Catalyst CT-4 Mixed Cement Mortar

The highest efficiency NOx removal catalyst CT-4 mixed cement mortar possesses excellent photocatalytic activity amongst the composites; studies were performed to know the influence of coating of CT-4 over the mortar surface on the photocatalytic NOx removal efficiency. This study aimed to develop environment-friendly construction materials for photocatalytic NOx degradation in cement mortar, and the results are shown in Figures S2 and S3. The photocatalyst CT-4 was mixed with cement mortar at various ratios (0%, 5%, 10%, and 15%) as shown in Table 2.
To evaluate the effectiveness of NOx photodegradation, plain mortar (0%) was used as a reference sample, and the average NOx concentrations were analyzed during three segments of NOx degradation as 30 min off state, followed by 30 min on state, and this cycle was performed three times during the 210 min as shown in Figure 5.
The NOx degradation was measured for the mortar samples mixed with the CT-4 photocatalyst at different inclusion levels. The results indicated that the NOx removal increased with an increase in the weight percentage of the photocatalyst on the surface. The average NOx concentrations for the mortar mixed with the CT-4 catalyst at 5%, 10%, and 15% inclusions were 895 ppb, 866 ppb, and 825 ppb, respectively. Moreover, the mortar mixed with the CT-4 photocatalyst at 15% exhibited higher NOx photodegradation efficiency than the mortar mixed with 5% and 10%. This could be attributed to the larger component amount of CT-4 catalyst encompassed on the mortar surface during the manufacturing process. It can be observed that the mortar coated with 15% photocatalyst had the highest NOx degradation efficiency, indicating the potential effectiveness of a reduced content of coating of CT-4 catalyst and suggesting that CT-4 can be affected and used as the economical additive with mortar for NOx removal in cement mortar.

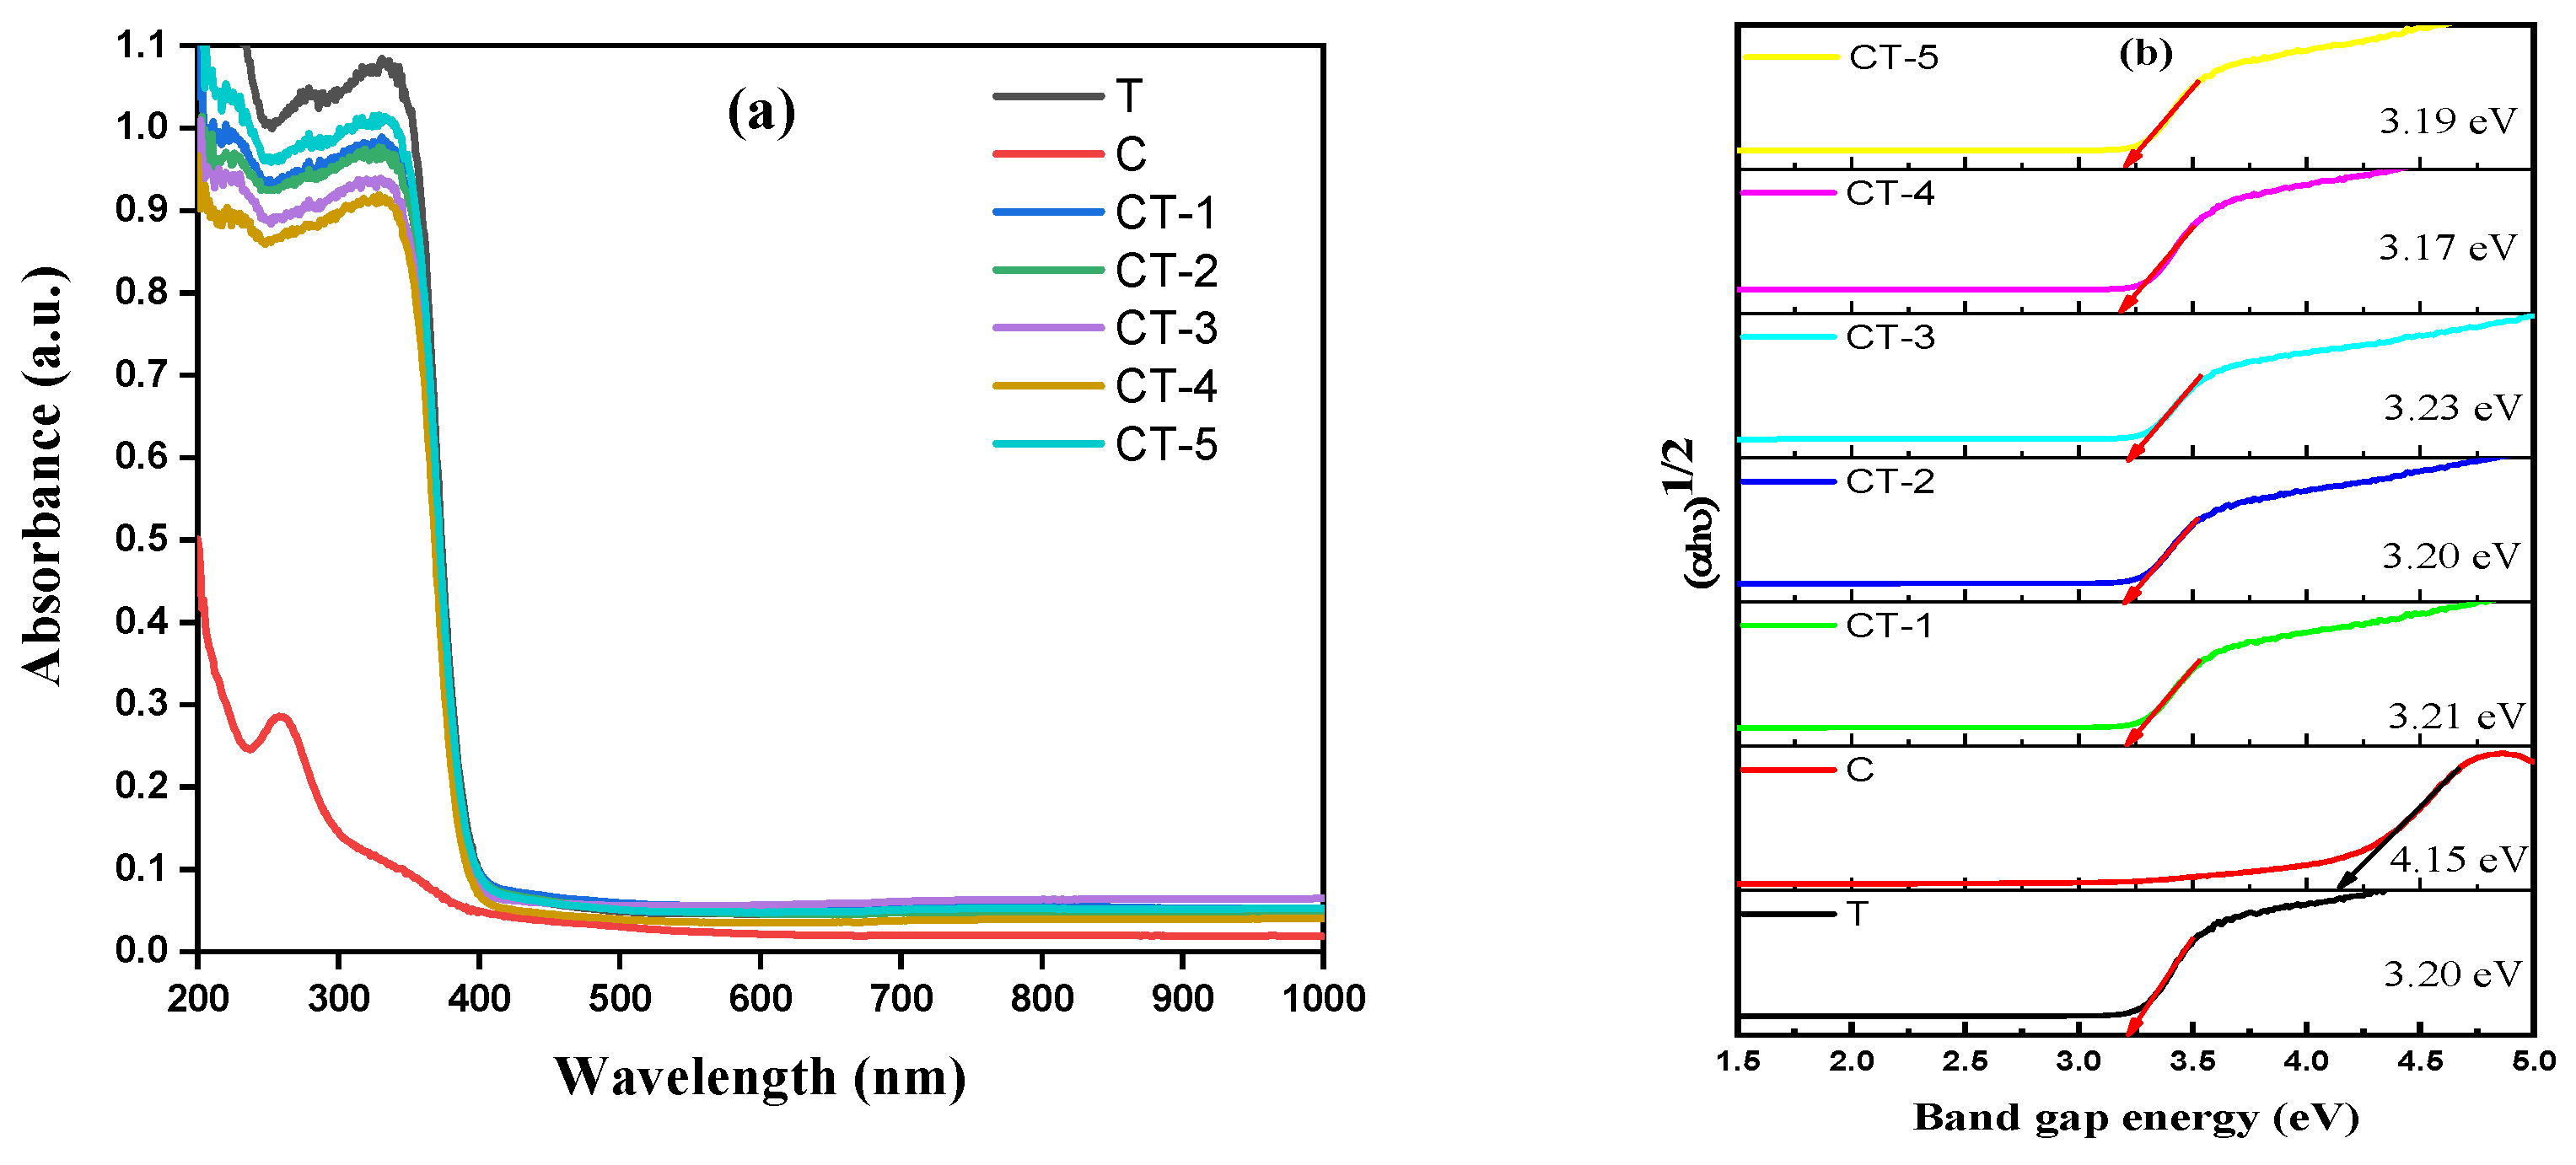
4.4. UV–Visible Analysis

The UV–DRS spectra of the pristine and CaCO3–n-TiO2 composite exhibited characteristic absorption features in the ultraviolet to visible range and are shown in Figure 6a.
A wide absorption band in the range between 250 nm and 400 nm was observed. The spectra demonstrated distinctive absorption peaks and shoulder regions, indicative of the electronic transitions within the materials. The band gap energy (Eg) of the catalyst composite was determined from the following relation:
αhν = A(hν − Eg)n/2
where α is the optical absorption coefficient, hν is the photon energy, Eg is the energy band gap, A is the constant, and n = 1 and n = 2 are the direct and indirect band gap semiconductors [34]. The optical energy transition of the CaCO3–n-TiO2 composite is directly transition allowed, so n = 1. the spectra analysis revealed distinct absorption features for each composition, while the band gap analysis provided valuable insights into the optical properties of the CaCO3–n-TiO2 composite catalysts with varying C and T weight percentages. The plot of (αhν)2 vs. hν catalyst composite is shown in Figure 6b, which depicts the variation energy band gap concerning composite compositions. The energy band gap of the n-TiO2 indirect transition was calculated as 3.20 eV, and that of CaCO3 was calculated as 4.15 eV. The composites of CaCO3–n-TiO2 with various compositions of CT-1, CT-2, CT-3, CT-4, and CT-5 band gap values are 3.21, 3.20, 3.23, 3.17, and 3.19 Ev for the composite catalysts. It shows that the CaCO3-n-TiO2 composite exhibits similar light absorption of n-TiO2. This result shows that the similar properties of n-TiO2 consist of strong photolytic degradation properties [42,43]. These findings lay a foundation for further understanding the photocatalytic activities and potential applications of these composite catalyst materials.

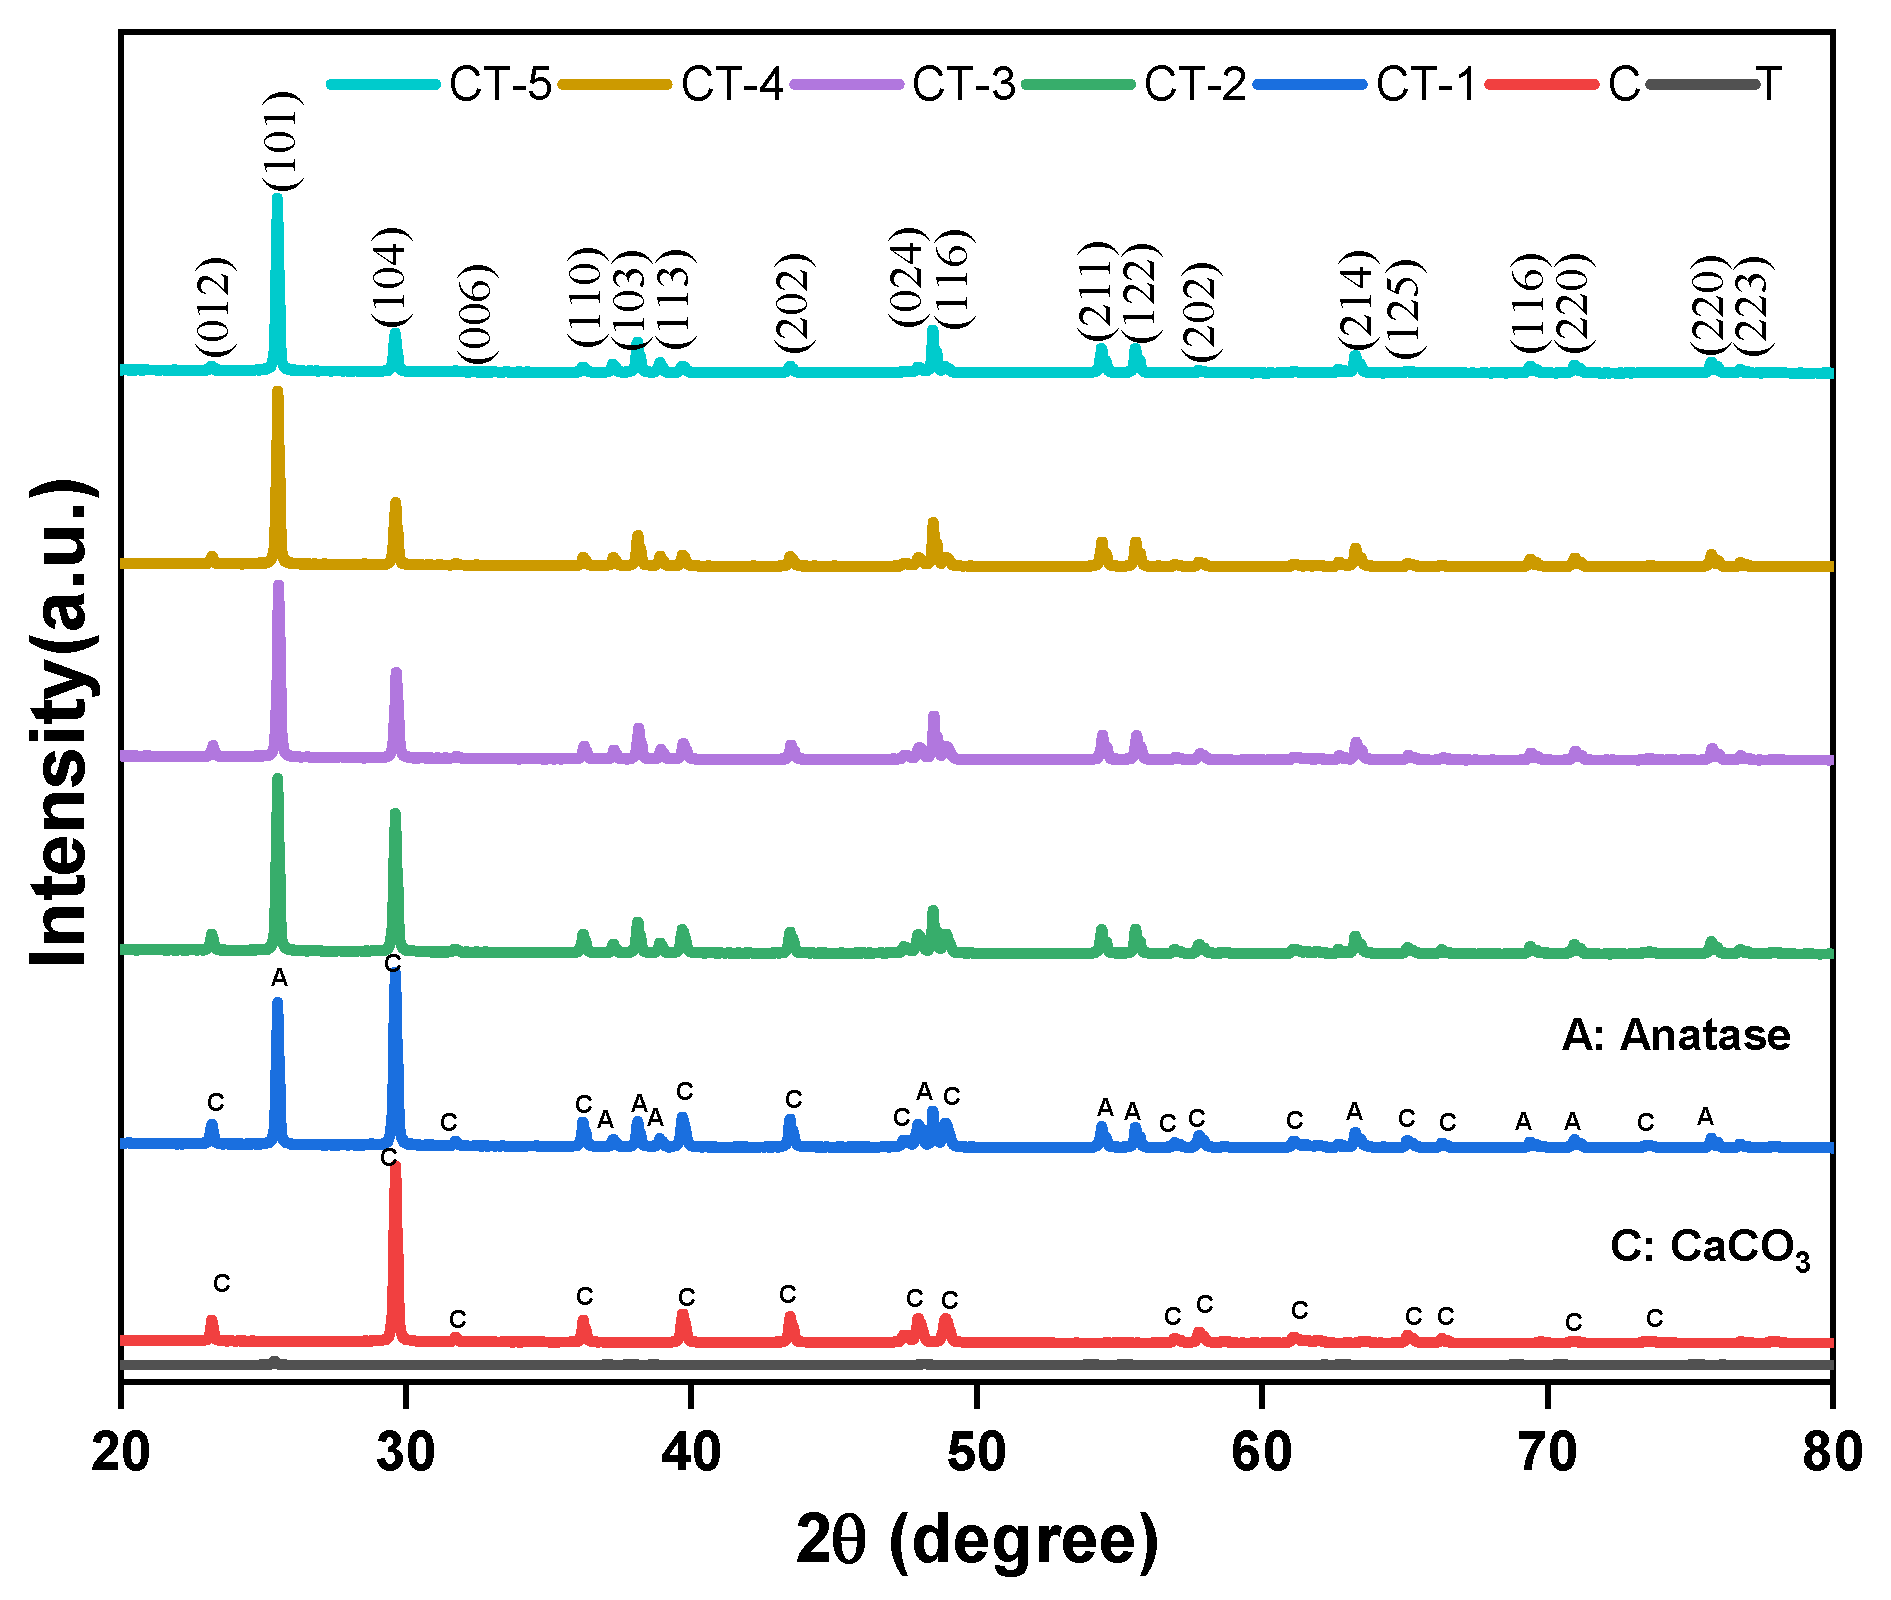
4.5. Micro-Structure Analysis

The powder X-ray diffraction patterns of the CaCO3–n-TiO2 composites of various compositions (CT-1, CT-2, CT-3, CT-4, and CT-5) are presented in Figure 7. For comparison purposes, the XRD patterns of pure T and C are also displayed. The diffraction peaks are observed at 25.4°, 37.8°, 48.1°, and 54.0° for T and CaCO3–n-TiO2 composites that are assigned to the (101), (004), (200), and (211) crystal planes of the anatase phase (JCPDS No. 00-071-1166 and JCPDS No. 00-083-0578). The peak shape and position of the CaCO3–n-TiO2 composites are approximately the same as those of pure anatase TiO2 (T). However, the intensities of the anatase peaks are suppressed. Keeping this information, it is envisaged that TiO2 exits on the surface of CaCO3. The sharp and narrow peaks of CaCO3 are assigned to the diffraction planes (hkl) planes (012), (104), (110), (113), (202), (018), (116), and (122) crystalizing planes of calcite phase of CaCO3 [44]. There is an increased intensity of characteristic diffraction peaks belonging to C in conjunction with the decreased intensity of TiO2 diffraction in TiO2–CaCO3 composite samples following the influence of TiO2 on the surface of CaCO3 [43].
The coexistence of diffraction peaks of the calcite and anatase phases in the CaCO3–n-TiO2 composites suggests that the crystalline nature of the pure components is retained in the composites. (Table 3). The crystalline unit cell parameters of T (tetragonal) and C (trigonal) are derived from the major diffraction (101) and (104) peaks of T and C, respectively (Table 3). On perusal of Table 3, it can be inferred that the lattice constants a and c of the anatase phase are increased from 3.752 Å and 9.405 Å to a higher value.
On the contrary, the lattice constant a of C remains unaltered upon composite formation, and the value of c decreased from pure C (c = 17.050 Å) to a lesser value. This information suggests that, during composite formation, the c-axis of T (anatase phase) is elongated, possibly by the insertion of Ca ions. The average crystallite size was obtained using the Scherrer formula:
D = K λ β cos θ
where D is the crystalline size, λ is the wavelength of Cu–kα radiation (1.54056 Å), β is the full-width half maximum of peak intensity, and θ is the peak position. The crystallite sizes of T and C were calculated from the (101) and (104) diffraction peaks of T and C, respectively. The crystallite size of the composites calculated based on (101) diffraction peak of T (T-50.31 nm, CT1-53.83, CT2-54.02, CT3-54.83, CT4-54.4 and CT5-58.12) was found to be slightly larger than the size of pristine T. Based on that, it can be inferred that there can be a surface layer of C on the surface of the T. And the size of the composites calculated based on (104) diffraction peak of C showed a decrease as compared to pristine C (Table 3) and an increase as compared to pristine T. The coating of C over T or T over C could be the reason for the changes in the sizes of the composite particles.
The morphology of the T, C, CT-1, CT-2, CT-3, CT-4, and CT-5 composites are shown in Figure 8a–g.
The existence of irregularly shaped granular TiO2 particles of different sizes (with particle sizes of 0.05–0.60 µm) can be observed with good dispersity. We consider that smaller particles are agglomerated to be present as larger-sized particles [45]. Figure 8g presents the morphology of pure C. It can be observed that C existed rhombohedral phased calcite with a cubical morphology as a major component and hexagonal phased vaterite with spherical morphology. Figure 8a–e present the morphologies of the various composites (CT-1, CT-2, CT-3, CT-4, and CT-5), which suggest that particles with mixed morphologies of both C and T and the sizes of the particles are dependent on the composition of C and T in the composites. On close analysis of Figure 8a–e, the average particle size is higher for CT-1, CT-2, and CT-3, the composites having larger proportions of C in the composite. The average particle sizes of CT-4 and CT-5 (the composites having higher proportions of T) are comparatively smaller. Keeping the morphological and size variations amongst the composites, we envisage coating of C over T for CT-1, CT-2, and CT-3 and coating of T over the surface of C for CT-4 and CT-5. The observed higher photocatalytic efficiency for CT-4, as noticed in Figure 8a–c, can be due to the existence of more T phases on the surface of C and the hybrid effect of C and T on the photocatalytic activity.

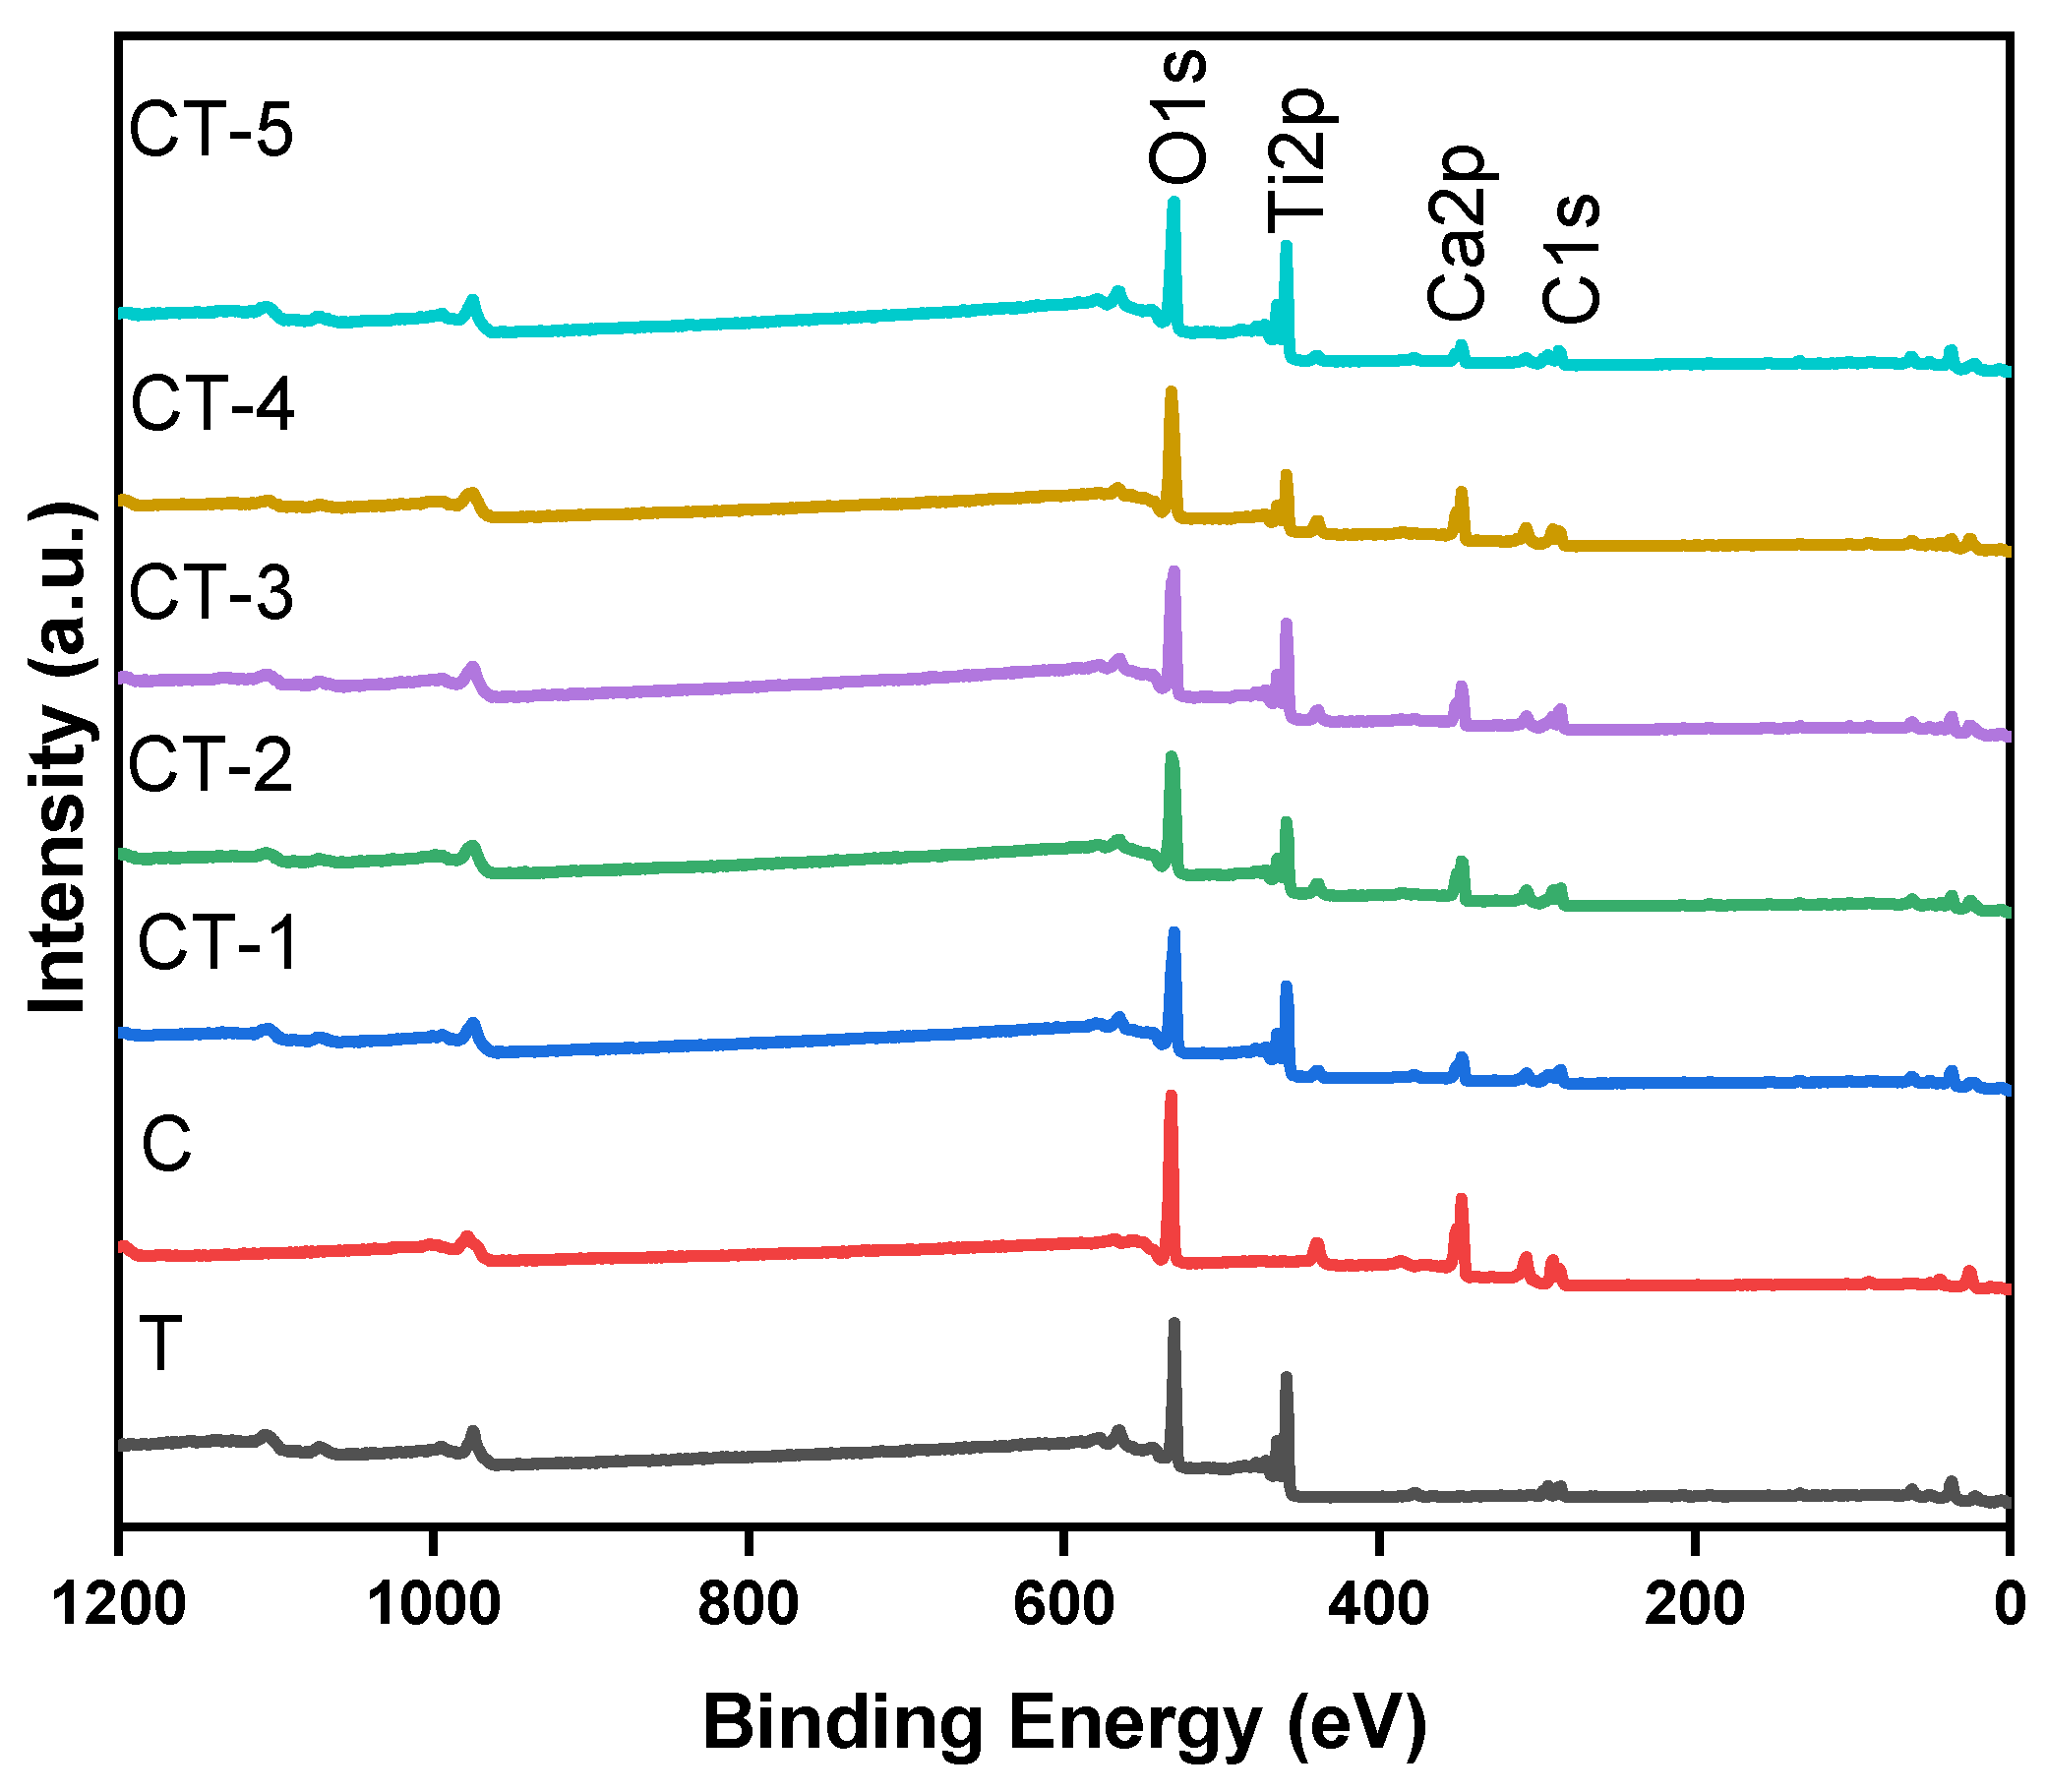
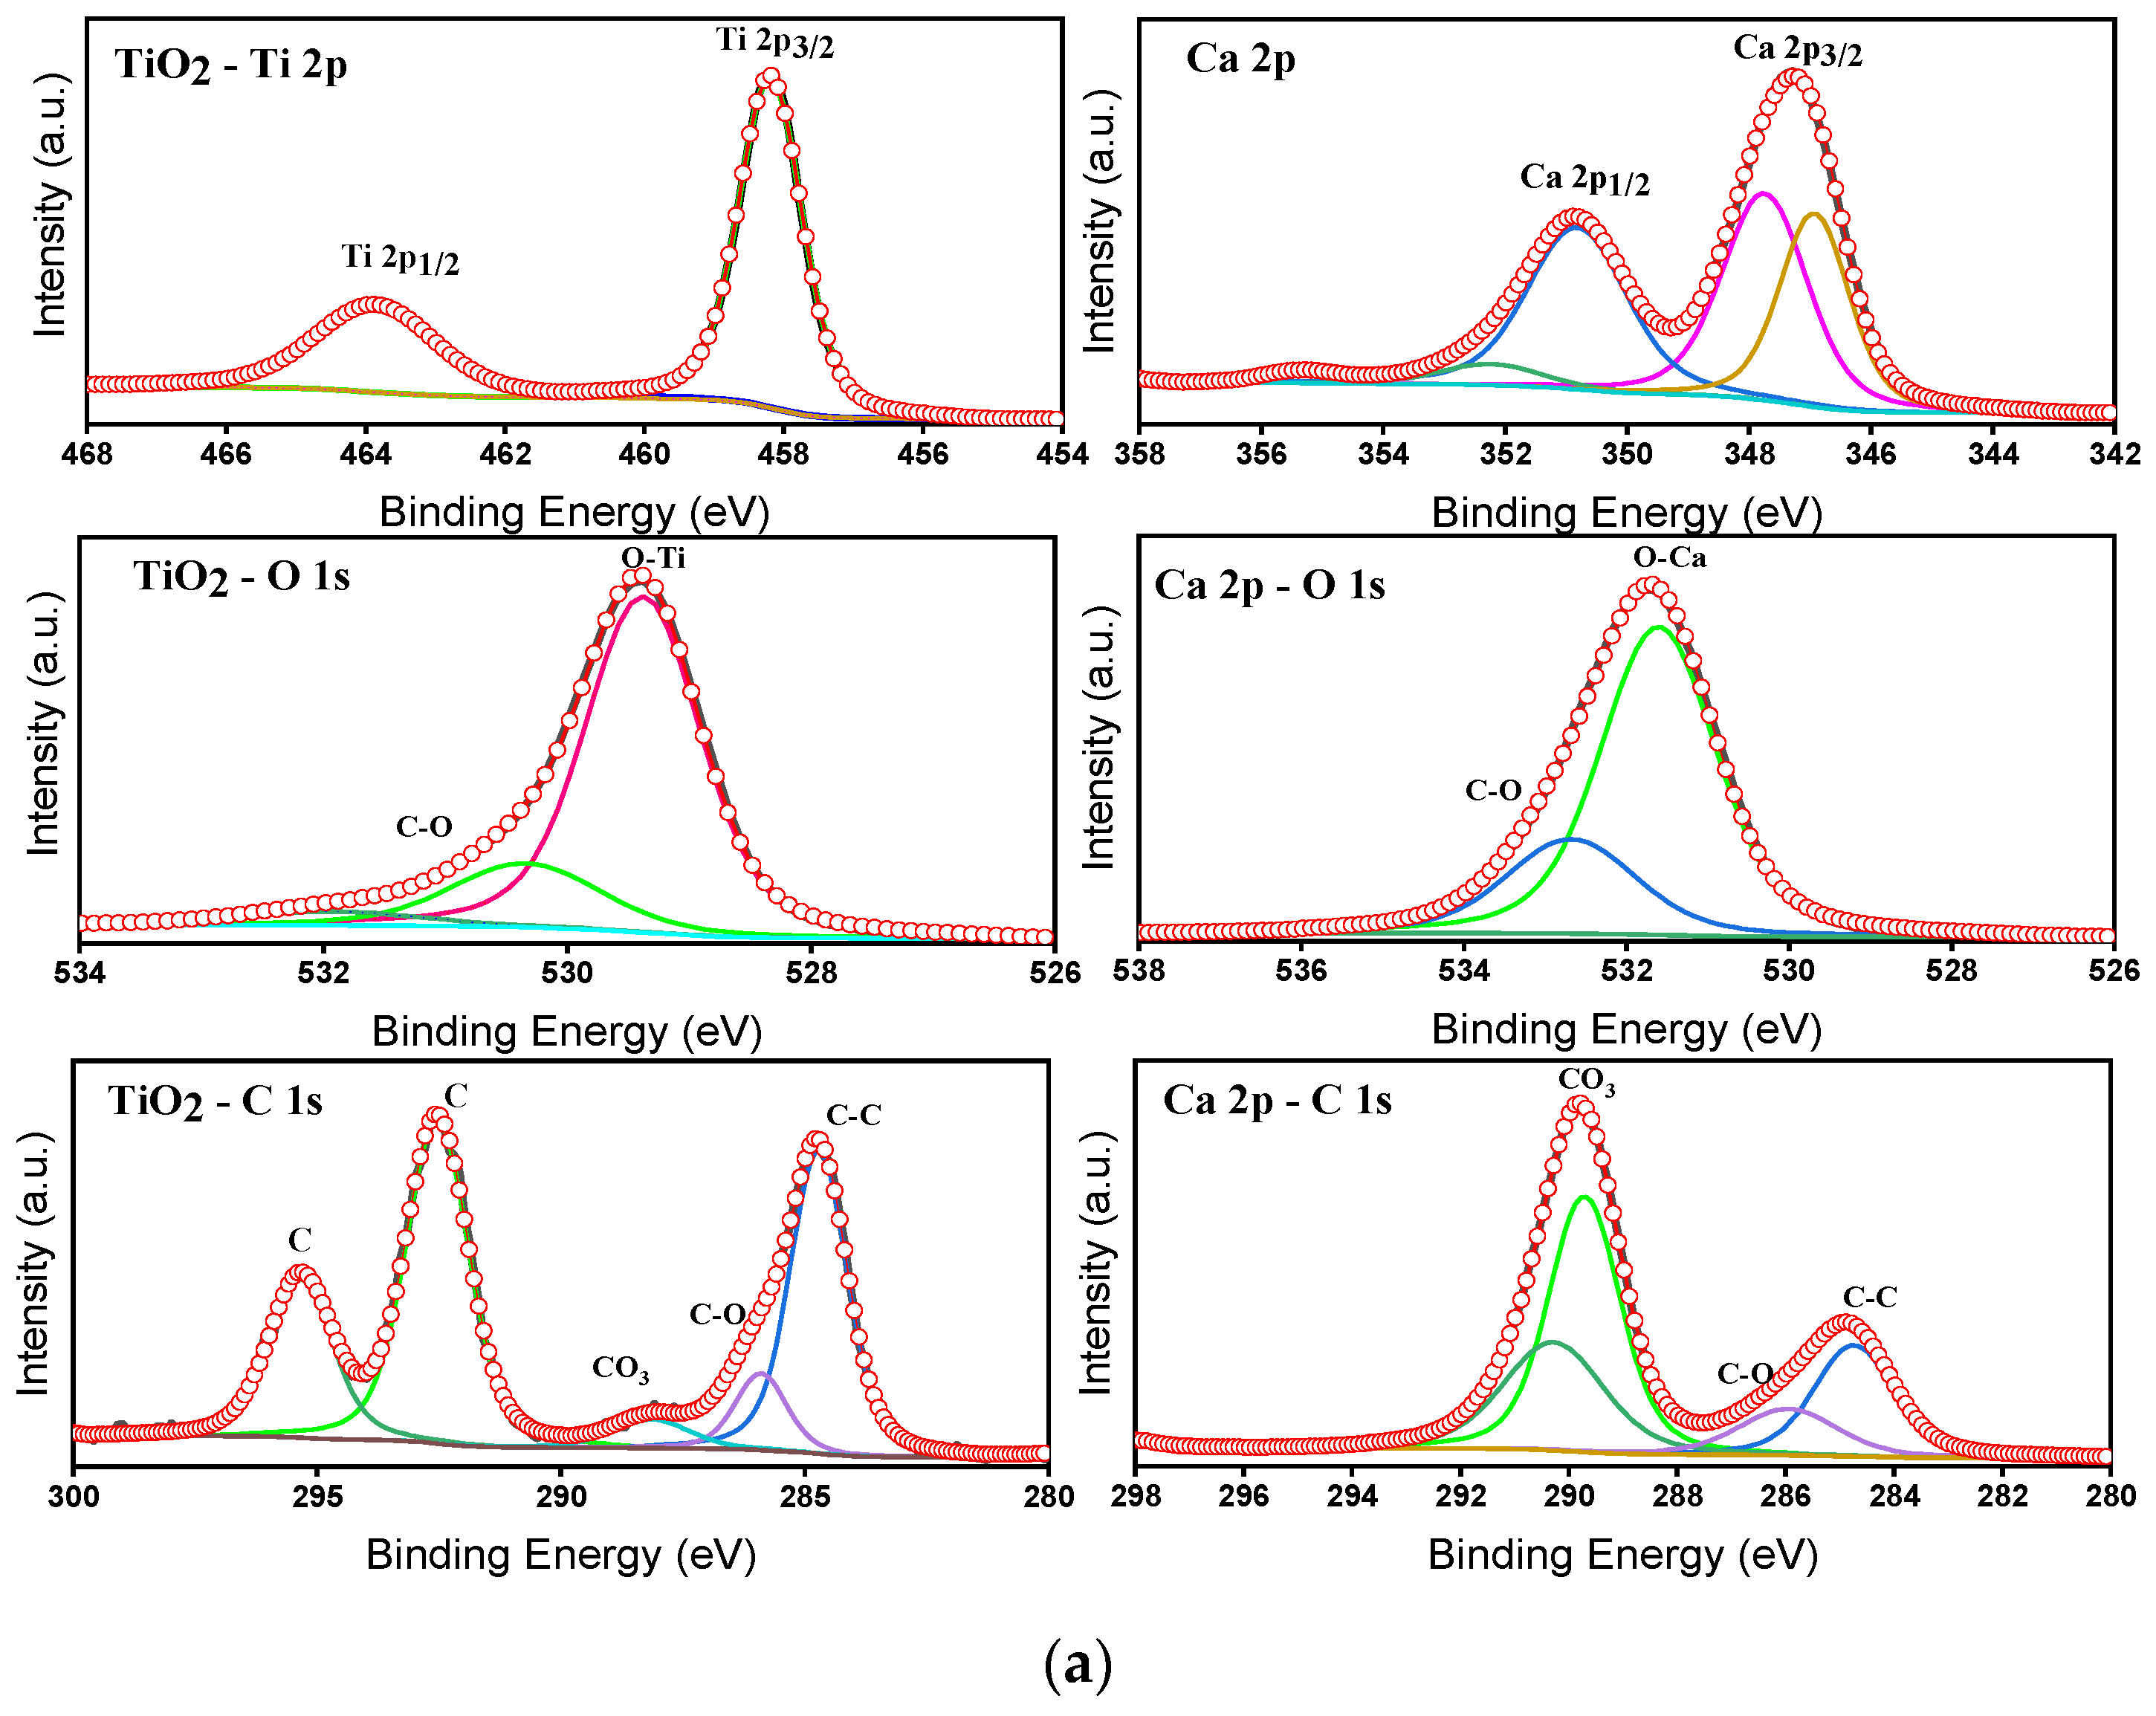
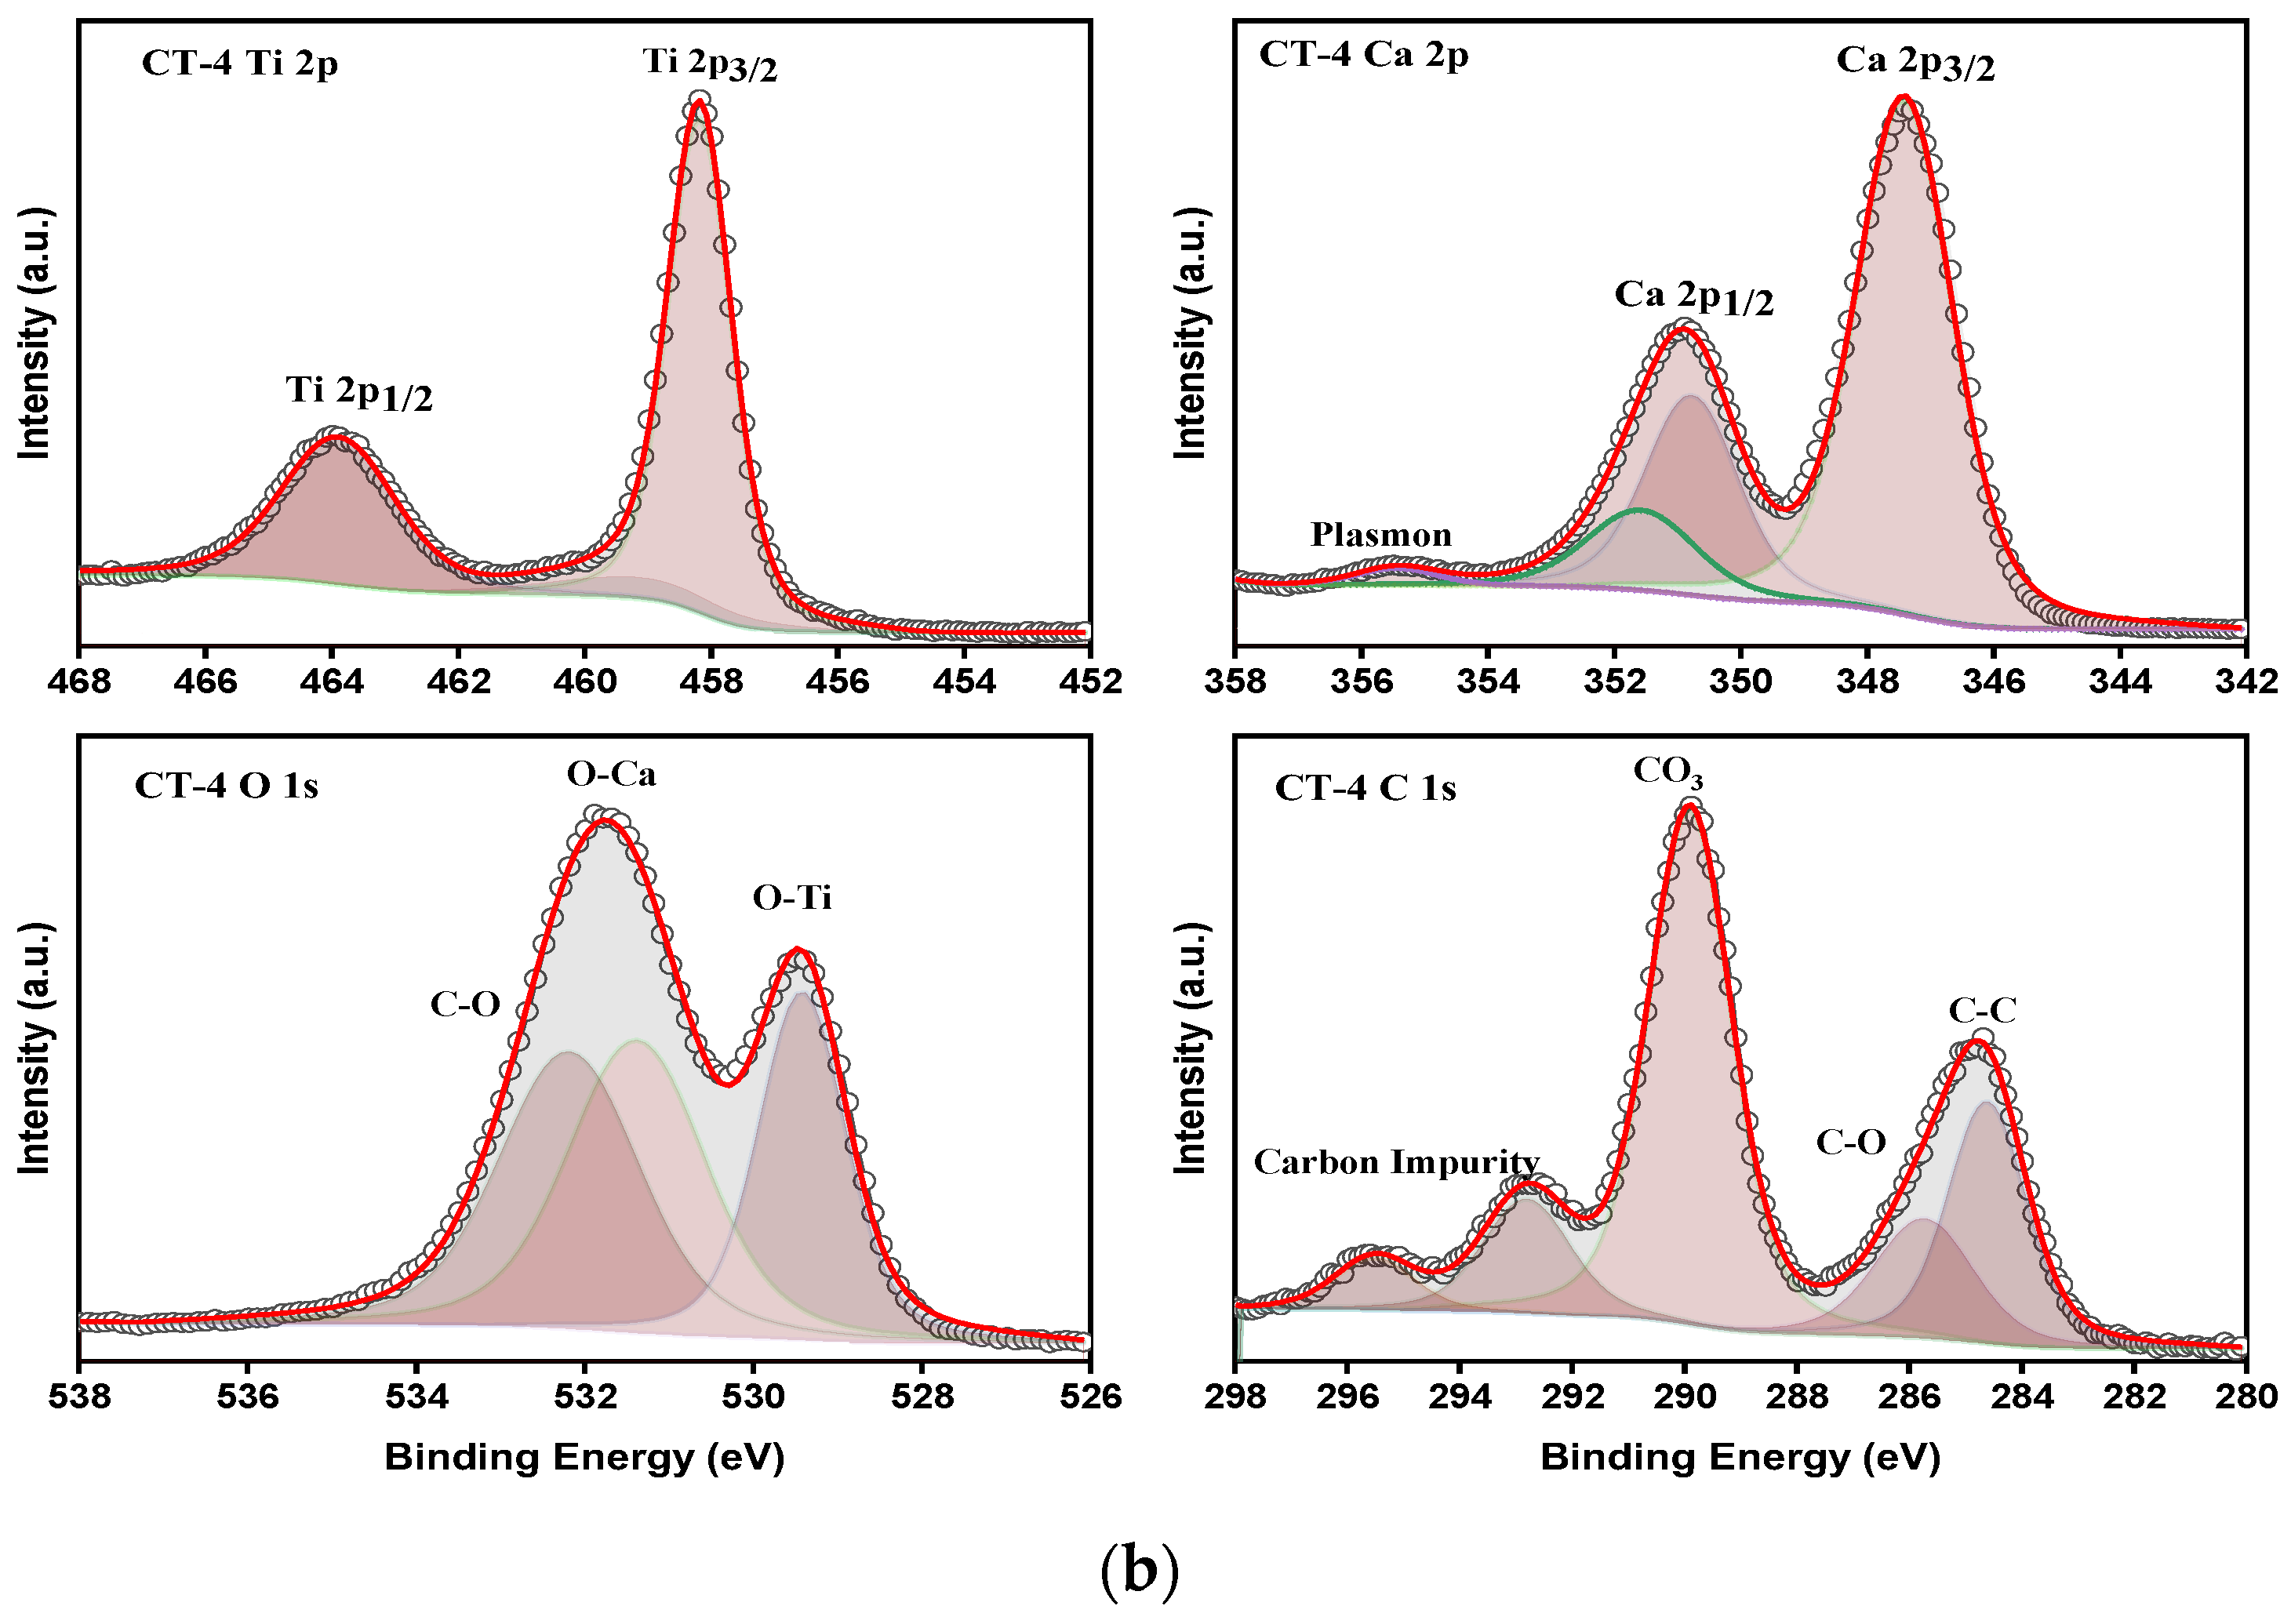
4.6. Elemental and Electronic States

XPS was used for the qualitative surface elemental composition and quantitative states of the various elements. Figure 9 shows the XPS survey spectra for the TiO2–CaCO3 composites (CT-1, CT-2, CT-3, CT-4, and CT-5) and their precursors.
The survey spectra inform the existence of Ca, Ti, and O as major elements through the respective binding energy peaks. The absence of other elements indicates the purity of the prepared composite samples. The individual core level spectra for the elements T, C, CT-1, CT-2, CT-3, CT-4, and CT-5 are shown in Figure S4. The deconvoluted individual core level spectra for the elements T and the CT-4 composite mixture were depicted in Figure 10a,b.
The charge correction for the core level peak positions was carried out by C1s (284.8 eV) as a reference. The core level spectrum of Ti2p of T exhibits binding energy (BE) peaks at 458.2 and 464.9 eV, corresponding to the spin–orbit splitting of 458.2 and 464.9 eV relevant to Ti2p3/2 and Ti2p1/2 electronic states with a BE difference of 6.70 eV.
This indicates the presence of Ti4+ valance states [28]. Further, the BE peak position of Ti2p is shifted towards higher energy for CT-4, informing the probable changes in the electronic state of Ti4+ (Figure 10b). The result is consistent with the XRD results (Table 3), informing the changes in the lattice constants tetragonal phase of TiO2. Considering the ionic radius of Ti4+ and Ca2+ is 0.064 nm and that of Ti4+ is 0.106 nm, doping of TiO2 by Ca ions is expected [46]. Figure 10a,b compare the BE peaks of Ca 2p. The BE peaks are noticed for pure C at 347.2 eV and 350.9 eV, corresponding to Ca 2p1/2 and Ca 2p3/2, which are in good agreement with the Ca2+ oxidation state, respectively [47]. Furthermore, there was a small shift observed in the binding energy peaks of Ca 2p for CT-4 (Figure 10b). The absence of satellite peaks and individual core level peak splitting in the composite samples details the elemental and phase purity of the samples. The core level spectra of O1s are approximately 530 eV in all pure and composite samples. Moreover, the case of pure samples (TiO2 and CaCO3) shows a maximum of 529.5 eV and approximately 531.6 eV. These binding energy maximums correspond to the metal–oxygen and carbon–oxygen bonding in the TiO2 and CaCO3 structures. In the case of the composite samples, these two O1s core energy peak maximums are retained without appreciable changes. The deconvoluted peaks at 529.5 eV and 531.6 eV in the composite samples describe the success of composite formation on the catalytic products [48]. The C1s core level spectrum of CT-4 shows BE peaks at 284.8 eV and 290 eV, informing the bonding in the CaCO3 structure. From the above observations, we could conclude that CT-4, having changed in the electronic states of Ti4+ and Ca2+ due to possible interaction during preparation, could cause enhanced photocatalytic effects as compared to pure T.

5. Conclusions

In this study, we developed a facile and cost-effective method for the large-scale production of photocatalysts using CaCO3-loaded n-TiO2 cementitious composites. The optimal balance between CaCO3 and n-TiO2 influences the catalyst efficiency for degrading MB dye solution and NOx under UV light exposure. Under the influence of UV light irradiation, the high-energy photons activate to create photoinduced electrons (e) and holes (h+) in TiO2. As the TiO2–CaCO3 catalyst composite is activated with UV light, electron–hole pairs are generated, making a crucial phase in the photocatalytic process. Especially, the higher ratio of n-TiO2 exhibits heightened catalytic activity, suggesting a synergistic relationship between the two constituents characterized with physiochemical analyses. The observed trends in the photodegradation of NOx underscore a nuanced interplay between the CaCO3 and TiO2 content within the CaCO3–n-TiO2 composite catalysts. This efficient pollutant removal is attributed to a synergistic effect between CaCO3 and n-TiO2, where a higher percentage of n-TiO2 notably enhances the photocatalytic activity. The CT-4 photocatalyst exhibits exceptional degradation performance, making it a promising application for environmentally friendly and cost-effective construction materials.

Supplementary Materials

The following supporting information can be downloaded at: https://www.mdpi.com/article/10.3390/nano14020136/s1. Figure S1. Cement mortars mixed with 5%,10%, 15% catalyst composite. Figure S2. Pseudo-first order kinetic profile for photocatalytic degradation of M.B relation between loga-rithm concentration of M.B (C) and time of T, C, CT-1, CT-2, CT-3, CT-4, CT-5 composites. Figure S3. CT-4 composite catalyst painted on the surface of cement mortar. Figure S4. XPS spectrum of (a) Ti2P, (b) C1s, (c) Ca2p, (d) O1s of T, C, CT-1, CT-2, CT-3, CT-4, CT-5 catalyst composites.

Author Contributions

All authors contributed to the study conception and design. Material preparation, data collection, and analysis were performed by M.K., S.-W.K., K.-P.L., Y.J.J. and W.-J.K. Overall supervision and fund management was conducted by K.-P.L. and W.-J.K. The first draft of the manuscript was written by M.K., and all authors commented on previous versions of the manuscript. All authors have read and agreed to the published version of the manuscript.

Funding

This research was funded by the Ministry of Public Administration and Security for their support through R&D Fund Support (20018525) as a part of the Regionally Customized Disaster Safety R&D Project and The Ministry of Land Infrastructure and Transport for their provision of the R&D Fund (RS-2022-00143352) as a part of the National Land Transport Technology Commercialization Support Project.

Data Availability Statement

Data and/or samples of the compounds are available from the authors.

Conflicts of Interest

Madhan Kuppusamy, Kwang-Pill Lee, Wha-Jung Kim were employed by the company GOONWORLD Corporate Research Institute. Young Jin Jo was employed by the company Korea Conformity Laboratories. The remaining author declare that the research was conducted in the absence of any commercial or financial relationships that could be construed as a potential conflict of interest.

References

  1. Zambotti, A.; Bruni, A.; Biesuz, M.; Sorarù, G.D.; Rivoira, L.; Castiglioni, M.; Onida, B.; Bruzzoniti, M.C. Glyphosate Adsorption Performances of Polymer-Derived SiC/C Aerogels. J. Environ. Chem. Eng. 2023, 11, 109771. [Google Scholar] [CrossRef]
  2. Zhu, Z.; Xu, B. Purification Technologies for NOx Removal from Flue Gas: A Review. Separations 2022, 9, 307. [Google Scholar] [CrossRef]
  3. Chu, B.; Ma, Q.; Liu, J.; Ma, J.; Zhang, P.; Chen, T.; Feng, Q.; Wang, C.; Yang, N.; Ma, H.; et al. Air Pollutant Correlations in China: Secondary Air Pollutant Responses to NOx and SO2 Control. Environ. Sci. Technol. Lett. 2020, 7, 695–700. [Google Scholar] [CrossRef]
  4. Poon, C.S.; Cheung, E. NO Removal Efficiency of Photocatalytic Paving Blocks Prepared with Recycled Materials. Constr. Build. Mater. 2007, 21, 1746–1753. [Google Scholar] [CrossRef]
  5. Qin, Y.; Li, H.; Lu, J.; Feng, Y.; Meng, F.; Ma, C.; Yan, Y.; Meng, M. Synergy between van Der Waals Heterojunction and Vacancy in ZnIn2S4/g-C3N4 2D/2D Photocatalysts for Enhanced Photocatalytic Hydrogen Evolution. Appl. Catal. B 2020, 277, 119254. [Google Scholar] [CrossRef]
  6. Yuan, Y.J.; Li, Z.; Wu, S.; Chen, D.; Yang, L.X.; Cao, D.; Tu, W.G.; Yu, Z.T.; Zou, Z.G. Role of Two-Dimensional Nanointerfaces in Enhancing the Photocatalytic Performance of 2D-2D MoS2/CdS Photocatalysts for H2 Production. Chem. Eng. J. 2018, 350, 335–343. [Google Scholar] [CrossRef]
  7. Ballari, M.M.; Yu, Q.L.; Brouwers, H.J.H. Experimental Study of the NO and NO2 Degradation by Photocatalytically Active Concrete. Catal. Today 2011, 161, 175–180. [Google Scholar] [CrossRef]
  8. Valenti, G.L.; Marroccoli, M.; Pace, M.L.; Telesca, A. Discussion of the Paper Understanding Expansion in Calcium Sulfoaluminate-Belite Cements by I.A. Chen et al., Cem. Concr. Res. 42 (2012) 51-60. Cem. Concr. Res. 2012, 42, 1555–1559. [Google Scholar] [CrossRef]
  9. Cai, J.; Pan, J.; Tan, J.; Li, X. Bond Behaviours of Deformed Steel Rebars in Engineered Cementitious Composites (ECC) and Concrete. Constr. Build. Mater. 2020, 252, 119082. [Google Scholar] [CrossRef]
  10. Lee, B.Y.; Jayapalan, A.R.; Bergin, M.H.; Kurtis, K.E. Photocatalytic Cement Exposed to Nitrogen Oxides: Effect of Oxidation and Binding. Cem. Concr. Res. 2014, 60, 30–36. [Google Scholar] [CrossRef]
  11. da Rocha Segundo, I.G.; Margalho, É.M.; Lima, O.d.S.; Pinheiro, C.G.d.S.; de Freitas, E.F.; Carneiro, J.A.S.A.O. Smart Asphalt Mixtures: A Bibliometric Analysis of the Research Trends. Coatings 2023, 13, 1396. [Google Scholar] [CrossRef]
  12. Banerjee, S.; Dionysiou, D.D.; Pillai, S.C. Self-Cleaning Applications of TiO2 by Photo-Induced Hydrophilicity and Photocatalysis. Appl. Catal. B 2015, 176–177, 396–428. [Google Scholar] [CrossRef]
  13. Smits, M.; kit Chan, C.; Tytgat, T.; Craeye, B.; Costarramone, N.; Lacombe, S.; Lenaerts, S. Photocatalytic Degradation of Soot Deposition: Self-Cleaning Effect on Titanium Dioxide Coated Cementitious Materials. Chem. Eng. J. 2013, 222, 411–418. [Google Scholar] [CrossRef]
  14. Adachi, T.; Latthe, S.S.; Gosavi, S.W.; Roy, N.; Suzuki, N.; Ikari, H.; Kato, K.; Katsumata, K.-i.; Nakata, K.; Furudate, M.; et al. Photocatalytic, Superhydrophilic, Self-Cleaning TiO2 Coating on Cheap, Light-Weight, Flexible Polycarbonate Substrates. Appl. Surf. Sci. 2018, 458, 917–923. [Google Scholar] [CrossRef]
  15. Ma, J.; Zhang, L.; Fan, Z.; Sun, S.; Feng, Z.; Li, W.; Ding, H. Construction of R-TiO2/n-TiO2 Heterophase Photocatalysts for Efficient Degradation of Organic Pollutants. J. Alloys Compd. 2023, 968, 172127. [Google Scholar] [CrossRef]
  16. Qin, Y.; Li, H.; Lu, J.; Meng, F.; Ma, C.; Yan, Y.; Meng, M. Nitrogen-Doped Hydrogenated TiO2 Modified with CdS Nanorods with Enhanced Optical Absorption, Charge Separation and Photocatalytic Hydrogen Evolution. Chem. Eng. J. 2020, 384, 123275. [Google Scholar] [CrossRef]
  17. Hu, X.; Li, Y.; Tian, J.; Yang, H.; Cui, H. Highly Efficient Full Solar Spectrum (UV-Vis-NIR) Photocatalytic Performance of Ag2S Quantum Dot/TiO2 Nanobelt Heterostructures. J. Ind. Eng. Chem. 2017, 45, 189–196. [Google Scholar] [CrossRef]
  18. Enesca, A.; Isac, L.; Duta, A. Charge Carriers Injection in Tandem Semiconductors for Dyes Mineralization. Appl. Catal. B 2015, 162, 352–363. [Google Scholar] [CrossRef]
  19. Nomura, Y.; Fukahori, S.; Fujiwara, T. Thermodynamics of Removing Crotamiton and Its Transformation Byproducts from Water by a Rotating Advanced Oxidation Contactor with Zeolite/TiO2 Composite Sheets. Chem. Eng. J. 2020, 380, 122479. [Google Scholar] [CrossRef]
  20. Folli, A.; Pade, C.; Hansen, T.B.; De Marco, T.; MacPhee, D.E. TiO2 Photocatalysis in Cementitious Systems: Insights into Self-Cleaning and Depollution Chemistry. Cem. Concr. Res. 2012, 42, 539–548. [Google Scholar] [CrossRef]
  21. Wang, B.; Zhang, G.; Sun, Z.; Zheng, S. Synthesis of Natural Porous Minerals Supported TiO2 Nanoparticles and Their Photocatalytic Performance towards Rhodamine B Degradation. Powder Technol. 2014, 262, 1–8. [Google Scholar] [CrossRef]
  22. Feng, S.; Li, F. Photocatalytic Dyes Degradation on Suspended and Cement Paste Immobilized TiO2/g-C3N4under Simulated Solar Light. J. Environ. Chem. Eng. 2021, 9, 105488. [Google Scholar] [CrossRef]
  23. Matschei, T.; Lothenbach, B.; Glasser, F.P. The Role of Calcium Carbonate in Cement Hydration. Cem. Concr. Res. 2007, 37, 551–558. [Google Scholar] [CrossRef]
  24. Minakshi, M.; Visbal, H.; Mitchell, D.R.G.; Fichtner, M. Bio-Waste Chicken Eggshells to Store Energy. Dalton Trans. 2018, 47, 16828–16834. [Google Scholar] [CrossRef] [PubMed]
  25. Sun, Z.; Hu, Z.; Yan, Y.; Zheng, S. Effect of Preparation Conditions on the Characteristics and Photocatalytic Activity of TiO2 /Purified Diatomite Composite Photocatalysts. Appl. Surf. Sci. 2014, 314, 251–259. [Google Scholar] [CrossRef]
  26. Baral, A.; Das, D.P.; Minakshi, M.; Ghosh, M.K.; Padhi, D.K. Probing Environmental Remediation of RhB Organic Dye Using α-MnO2 under Visible- Light Irradiation: Structural, Photocatalytic and Mineralization Studies. Chem. Sel. 2016, 1, 4277–4285. [Google Scholar] [CrossRef]
  27. Kun, R.; Mogyorósi, K.; Dékány, I. Synthesis and Structural and Photocatalytic Properties of TiO2/Montmorillonite Nanocomposites. Appl. Clay Sci. 2006, 32, 99–110. [Google Scholar] [CrossRef]
  28. Sun, S.; Ding, H.; Hou, X. Preparation of CaCO3-TiO2 Composite Particles and Their Pigment Properties. Materials 2018, 11, 1131. [Google Scholar] [CrossRef]
  29. Sun, S.; Ding, H.; Hou, X.; Chen, D.; Yu, S.; Zhou, H.; Chen, Y. Effects of Organic Modifiers on the Properties of TiO2 -Coated CaCO3 Composite Pigments Prepared by the Hydrophobic Aggregation of Particles. Appl. Surf. Sci. 2018, 456, 923–931. [Google Scholar] [CrossRef]
  30. Tao, H.; He, Y.; Zhao, X. Preparation and Characterization of Calcium Carbonate-Titanium Dioxide Core-Shell (CaCO3@TiO2) Nanoparticles and Application in the Papermaking Industry. Powder Technol. 2015, 283, 308–314. [Google Scholar] [CrossRef]
  31. Lara, R.C.; de Castro Xavier, G.; Canela, M.C.; Carvalho, J.A.; Alexandre, J.; de Azevedo, A.R.G. Characterization and Photocatalytic Performance of Cement Mortars with Incorporation of TiO2 and Mineral Admixtures. Environ. Sci. Pollut. Res. 2023, 30, 95537–95549. [Google Scholar] [CrossRef] [PubMed]
  32. Wong, Y.; Li, Y.; Lin, Z.; Kafizas, A. Studying the Effects of Processing Parameters in the Aerosol-Assisted Chemical Vapour Deposition of TiO2 Coatings on Glass for Applications in Photocatalytic NOx Remediation. Appl. Catal. A Gen. 2022, 648, 118924. [Google Scholar] [CrossRef]
  33. Nguyen, V.H.; Nguyen, B.S.; Huang, C.W.; Le, T.T.; Nguyen, C.C.; Nhi Le, T.T.; Heo, D.; Ly, Q.V.; Trinh, Q.T.; Shokouhimehr, M.; et al. Photocatalytic NOx Abatement: Recent Advances and Emerging Trends in the Development of Photocatalysts. J. Clean. Prod. 2020, 270, 121912. [Google Scholar] [CrossRef]
  34. Geetha, G.V.; Sivakumar, R.; Sanjeeviraja, C.; Ganesh, V. Photocatalytic Degradation of Methylene Blue Dye Using ZnWO4 Catalyst Prepared by a Simple Co-Precipitation Technique. J. Solgel Sci. Technol. 2021, 97, 572–580. [Google Scholar] [CrossRef]
  35. Wang, W.; Lin, F.; Yan, B.; Cheng, Z.; Chen, G.; Kuang, M.; Yang, C.; Hou, L. The Role of Seashell Wastes in TiO2/Seashell Composites: Photocatalytic Degradation of Methylene Blue Dye under Sunlight. Environ. Res. 2020, 188, 109831. [Google Scholar] [CrossRef] [PubMed]
  36. Wang, X.; Ma, C.; Zou, F.; Hu, H.; Li, J.; Luo, H. CaCO3/TiO2 Hybrid Microcapsules with Self-Cleaning and Self-Repairing Functions for Decorative Coatings. Inorg. Chem. Commun. 2024, 159, 111665. [Google Scholar] [CrossRef]
  37. Hou, C.; Hu, B.; Zhu, J. Photocatalytic Degradation of Methylene Blue over TiO2 Pretreated with Varying Concentrations of NaOH. Catalysts 2018, 8, 575. [Google Scholar] [CrossRef]
  38. Urbonavicius, M.; Varnagiris, S.; Sakalauskaite, S.; Demikyte, E.; Tuckute, S.; Lelis, M. Application of Floating TiO2 Photocatalyst for Methylene Blue Decomposition and Salmonella Typhimurium Inactivation. Catalysts 2021, 11, 794. [Google Scholar] [CrossRef]
  39. Spigariol, N.; Liccardo, L.; Lushaj, E.; Rodríguez-Castellón, E.; Barroso Martin, I.; Polo, F.; Vomiero, A.; Cattaruzza, E.; Moretti, E. Titania Nanorods Array Homojunction with Sub-Stoichiometric TiO2 for Enhanced Methylene Blue Photodegradation. Catal. Today 2023, 419, 114134. [Google Scholar] [CrossRef]
  40. Inamdar, A.K.; Hulsure, N.R.; Kadam, A.S.; Rajenimbalkar, R.S.; Karpoormath, R.; Shelke, S.B.; Inamdar, S.N. Flame Synthesized Tetragonal TiO2 Nanoparticles for Methylene Blue and Congo Red Dye Removal Applications. Results Chem. 2023, 5, 100854. [Google Scholar] [CrossRef]
  41. El-Toni, A.M.; Habila, M.A.; Sheikh, M.; El-Mahrouky, M.; Al-Awadi, A.S.; Labis, J.P.; ALOthman, Z.A. Fabrication of Fe3O4 Core-TiO2/MesoSiO2 and Fe3O4 Core-MesoSiO2/TiO2 Double Shell Nanoparticles for Methylene Blue Adsorption: Kinetic, Isotherms and Thermodynamic Characterization. Nanomaterials 2023, 13, 2548. [Google Scholar] [CrossRef]
  42. Wang, J.; Sun, S.; Pan, L.; Xu, Z.; Ding, H.; Li, W. Preparation and Properties of CaCO3-Supported Nano-TiO2 Composite with Improved Photocatalytic Performance. Materials 2019, 12, 3369. [Google Scholar] [CrossRef] [PubMed]
  43. AL-Maqate, F.G.; Qasem, A.; Alomayri, T.; Madani, A.; Timoumi, A.; Hussain, D.; Ikram, M.; Al-Malki, K.M.; Bruno, T.A. Profundity Study on Structural and Optical Properties of Heavy Oil Fly Ash (HOFA) Doped Calcium Carbonate (CaCO3) Nanostructures and Thin Films for Optoelectronic Applications. Opt. Mater. 2022, 131, 112719. [Google Scholar] [CrossRef]
  44. Sarkar, A.; Mahapatra, S. Synthesis of All Crystalline Phases of Anhydrous Calcium Carbonate. Cryst. Growth Des. 2010, 10, 2129–2135. [Google Scholar] [CrossRef]
  45. Zouzelka, R.; Rathousky, J. Photocatalytic Abatement of NOx Pollutants in the Air Using Commercial Functional Coating with Porous Morphology. Appl. Catal. B 2017, 217, 466–476. [Google Scholar] [CrossRef]
  46. Sriubas, M.; Bočkute, K.; Virbukas, D.; Laukaitis, G. Investigation of the Properties of Ca-Doped TiO2 Thin Films Formed by e-Beam Evaporation. In Procedia Engineering; Elsevier Ltd.: Amsterdam, The Netherlands, 2014; Volume 98, pp. 133–138. [Google Scholar]
  47. Chu, D.H.; Vinoba, M.; Bhagiyalakshmi, M.; Hyun Baek, I.; Nam, S.C.; Yoon, Y.; Kim, S.H.; Jeong, S.K. CO2 Mineralization into Different Polymorphs of CaCO3 Using an Aqueous-CO2 System. RSC Adv. 2013, 3, 21722–21729. [Google Scholar] [CrossRef]
  48. Bharti, B.; Kumar, S.; Lee, H.N.; Kumar, R. Formation of Oxygen Vacancies and Ti3+ State in TiO2 Thin Film and Enhanced Optical Properties by Air Plasma Treatment. Sci. Rep. 2016, 6, 32355. [Google Scholar] [CrossRef] [PubMed]
Figure 1. MB degradation possible mechanism of TiO2–CaCO3 composite.
Nanomaterials 14 00136 g001
Figure 2. Methylene blue dye degradation and dye degradation efficiency with error bars of C, T, CT-1, CT-2, CT-3, CT-4, and CT-5 composite catalysts.
Nanomaterials 14 00136 g002
Figure 3. NOx removal of T, C, CT-1, CT-2, CT-3, CT-4, and CT-5 composite catalysts.
Nanomaterials 14 00136 g003
Figure 4. Photocatalytic NOx degradation efficiency with error bars of T, C, CT-1, CT-2, CT-3, CT-4, and CT-5 composites.
Nanomaterials 14 00136 g004
Figure 5. The CT-4 catalyst composite surface coated on mortar NOx removal performance of UV on–off cycles and photocatalytic CT-4 composite 0%, 5%, 10%, 15% mixed cement mortar for UV on–off cycles.
Nanomaterials 14 00136 g005
Figure 6. (a) UV–DRS and (b) Tauc plots of T, C, CT-1, CT-2, CT-3, CT-4 and CT-5 composites.
Nanomaterials 14 00136 g006
Figure 7. Powder XRD pattern of T, C, CT-1, CT-2, CT-3, CT-4, and CT-5 composites.
Nanomaterials 14 00136 g007
Figure 8. Microstructural images of (a) CT-1, (b) CT-2, (c) CT-3, (d) CT-4, (e) CT-5, (f) C, and (g) T composites.
Nanomaterials 14 00136 g008
Figure 9. XPS survey spectrum of CT-1, CT-2, CT-3, CT-4, and CT-5 composites and pristine components (C and T).
Nanomaterials 14 00136 g009
Figure 10. (a) Deconvoluted XPS core level spectra of Ti2p, Ca2p, O1s, and C1s peaks for the T and C composites. (b) Deconvoluted XPS core level spectra of Ti2p, Ca2p, O1s, and C1s peaks for the CT-4 composites.
Nanomaterials 14 00136 g010aNanomaterials 14 00136 g010b
Table 1. Methylene blue photodegradation of T, C, CT-1, CT-2, CT-3, CT-4, and CT-5 composites.
Irradiation Time (h)Photocatalysts
CTCT-1CT-2CT-3CT-4CT-5
The Concentration of the Photodegraded Methylene Blue (mg/L)
1 h9.988.417.476.917.086.027.11
2 h9.406.55.773.945.113.835.75
3 h9.065.614.452.953.392.553.73
Table 2. Preparation of mortar and mortar mix with photocatalyst proportion.
CompositionsCement (g)Sand (g)Photocatalysis (wt.%)Water (%)
Mortar12.5060
Mix catalyst12.5560
Mix catalyst12.51060
Mix catalyst12.51560
Table 3. The powder XRD parameters of T, C, CT-1, CT-2, CT-3, CT-4, and CT-5 composite catalysts.
SamplesComposition
(Degree)
The Crystallite Size (nm)D-Spacing(Å)Lattice Constants
(a, b, c)
A
(%)
C
(%)
ACACACAC
(101)(104)a = bca = bc
T100-25.385-50.31-3.510-3.7529.405--
C-100-29.379-52.65-3.037--4.99917.050
CT-125.174.925.31629.40055.9751.703.5153.0353.7839.5084.99717.034
CT-234.066.025.31329.39956.3451.703.5153.0353.7839.5084.99717.038
CT-343.956.125.30129.38858.2751.393.5173.0363.7859.5144.99917.042
CT-453.546.525.31729.40157.1051.703.5153.0353.7839.5094.99617.036
CT-566.233.825.32529.42057.8758.383.5133.0333.7819.5104.99317.025
Disclaimer/Publisher’s Note: The statements, opinions and data contained in all publications are solely those of the individual author(s) and contributor(s) and not of MDPI and/or the editor(s). MDPI and/or the editor(s) disclaim responsibility for any injury to people or property resulting from any ideas, methods, instructions or products referred to in the content.

