Article

Exploring the Thermal-Oxidative Stability of Azithromycin Using a Thermoactivated Sensor Based on Cerium Molybdate and Multi-Walled Carbon Nanotubes

by
Heryka R. A. Costa
1,
André O. Santos
1,
Yago N. Teixeira
1,
Maria A. S. Silva
1,
Valker A. Feitosa
2,
Simone Morais
3 and
Thiago M. B. F. Oliveira
1,*
1
Centro de Ciência e Tecnologia, Universidade Federal do Cariri, Av. Tenente Raimundo Rocha, 1639, Cidade Universitária, Juazeiro do Norte 63048-080, CE, Brazil
2
Departamento de Tecnologia Bioquímico-Farmacêutica, Universidade de São Paulo, Av. Prof. Lineu Prestes, 580, Butantã, São Paulo 05508-000, SP, Brazil
3
REQUIMTE–LAQV, Instituto Superior de Engenharia do Porto, Instituto Politécnico do Porto, Rua Dr. Bernardino de Almeida 431, Porto 4249-015, Portugal
*
Author to whom correspondence should be addressed.
Nanomaterials 2024, 14(11), 899; https://doi.org/10.3390/nano14110899
Submission received: 10 April 2024 / Revised: 7 May 2024 / Accepted: 17 May 2024 / Published: 21 May 2024
(This article belongs to the Special Issue Carbon-Based Nanomaterials for Emerging Technologies)

Abstract

:
The chemical stability of azithromycin (AZM) may be compromised depending on the imposed thermo-oxidative conditions. This report addresses evidence of this process under varying conditions of temperature (20–80 °C), exposure time to UV radiation (1–3 h irradiation at 257 nm), and air saturation (1–3 h saturation with atmospheric air at 1.2 L min−1 and 15 kPa) through electrochemical measurements performed with a thermoactivated cerium molybdate (Ce2(MoO4)3)/multi-walled carbon nanotubes (MWCNT)-based composite electrode. Thermal treatment at 120 °C led to coordinated water elimination in Ce2(MoO4)3, improving its electrocatalytic effect on antibiotic oxidation, while MWCNT were essential to reduce the charge-transfer resistance and promote signal amplification. Theoretical–experimental data revealed remarkable reactivity for the irreversible oxidation of AZM on the working sensor using phosphate buffer (pH = 8) prepared in CH3OH/H2O (10:90%, v/v). Highly sensitive (230 nM detection limit) and precise (RSD < 4.0%) measurements were recorded under these conditions. The results also showed that AZM reduces its half-life as the temperature, exposure time to UV radiation, and air saturation increase. This fact reinforces the need for continuous quality control of AZM-based pharmaceuticals, using conditions closer to those observed during their transport and storage, reducing impacts on consumers’ health.

1. Introduction

Macrolide antibiotics are characterized by a macrocyclic lactone ring structure—12 to 16 atoms—with one or more sugar chains attached [1,2,3]. They are bacteriostatic agents against Gram-positive (Streptococcus pneumoniae, Streptococcus pyogenes, Streptococcus agalactiae, Staphylococcus aureus, and Corynebacterium diphtheriae) and Gram-negative microorganisms (Haemophilus influenzae and Moraxella catarrhalis), hindering their growth and reproduction by interfering with ribosome function and inhibiting protein synthesis [1]. Macrolides are often prescribed to treat respiratory tract and skin infections, sexually transmitted diseases, and various other bacterial infections [2]. Azithromycin (AZM; 9-deoxy-9α-aza-9α-methyl-9α-homoerythromycin A) is among the most prescribed second-generation macrolides, standing out for its broader spectrum of activity and improved pharmacokinetic properties in relation to erythromycin, i.e., its first-generation precursor [3]. To guarantee effectiveness, AZM-based pharmaceutical compositions require special care to guarantee the stability of the active ingredient under ideal thermal-oxidative conditions [4,5]. Unfortunately, these recommendations are not always followed during the transport and/or storage of pharmaceutical products [6], demanding more rigorous quality control to determine the antibiotic’s half-life in atypical circumstances and ensure its effectiveness.
Liquid chromatography achieves proper resolution to analyze AZM alongside excipients, justifying its broad acceptance in studies with bulk samples and formulations [6]. The main limitations are expensive columns, unstable detectors, and high pH and/or temperature conditions to use traditional silica-based columns [6,7]. There are also reports based on microbiology [8], spectroscopy [9], capillary electrophoresis [10], and electroanalysis [11]. All have analytical credibility, but the advantages found with electroanalytical methods in terms of operation, specificity, precision, robustness, possibility of miniaturization, and portability, along with the reduction of waste generated in the laboratory routine, make them highly attractive.
The success of electroanalytical methods depends on the design of the sensors and, consequently, the electrode materials used as the reaction interface. Focusing on robust devices, carbon nanotubes stand out among the most used materials, given the rigidity of C–C bonds even at high pressures and impressive surface-to-volume ratio, in addition to having charge-transport-inducing structural defects distributed throughout their crystalline nanostructures [12]. The integration of carbon nanotubes with advanced ceramics has also attracted great scientific interest, as it results in composites with electrochemical properties superior to their counterparts [13,14,15]. Cerium (III) molybdate, Ce2(MoO4)3, for example, is a rare-earth-based electroceramic material with extraordinary chemical stability, even under critical pH [16], temperature [17,18], and pressure conditions [19,20]. Furthermore, the cerium present in the unit cell can assume different oxidation states, positively influencing the energy density, charge–discharge time, and (photo)electrochemical reactivity [21]. These features also justify the increasing use of this material in the construction of sensors [21,22], catalysts [23,24,25], energy conversion devices [26,27], batteries [26,28], and capacitors [29], among other emerging technologies.
For electrochemical sensors, there are still few reports proving the viability of composite materials based on carbon allotropes and rare-earth molybdates, and there is no evidence of application for antibiotic electroanalysis. This article fills part of this gap, presenting an electrochemical sensor built with a Ce2(MoO4)3/multi-walled carbon nanotubes (MWCNT) composite, which demonstrated high performance for monitoring AZM under different thermal-oxidative conditions caused by temperature, exposure to UV radiation, and saturation with atmospheric air. The data found raise awareness about the importance of appropriate storage of pharmaceutical formulations.

2. Materials and Methods

2.1. Chemicals

The AZM standard was kindly provided by Indústria Farmacêutica Cristália (Itapita—SP, Brazil). The AZM stock solution was prepared in methanol/water (CH3OH/H2O; 50:50%; v/v) (Sigma-Aldrich, São Paulo, Brazil). The potassium ferrocyanide (K4Fe(CN)6) redox probe, as well as the synthesis reagents, including cerium nitrate (Ce(NO3)3·6H2O), ammonium molybdate ((NH4)6Mo7O24·4H2O), ethylenediamine tetraacetic acid (EDTA), and ammonium hydroxide (NH4OH), were also obtained from Sigma-Aldrich and used without further purification. Sodium mono-(Na2HPO4) and di-hydrogen phosphate (NaH2PO4) (both from Vetec, Rio de Janeiro, Brazil) were used to prepare the buffered electrolyte in CH3OH/H2O (10:90%; v/v). Phosphoric acid (H3PO4) and sodium hydroxide (NaOH) solutions at 0.01 M were used for pH adjustments, with reagents purchased from Dinâmica, São Paulo, Brazil. Ultra-purified water (ρ = 18 MΩ cm−1) was used to prepare all aqueous solutions. The MWCNT (10 nm diameter and 1.5 μm average length) used for electrode modification were obtained from DropSens, Oviedo, Spain.

2.2. Cerium Molybdate Synthesis

The production of Ce2(MoO4)3 was based on the report by Gomes et al. [21]. Summarizing the synthesis route followed, EDTA was dissolved in NH4OH (1 g:10 mL) and the resulting mixture was used as a dilution medium for solutions of Ce(NO3)3·6H2O and (NH4)6Mo7O24·4H2O, both prepared at 1.0 μM. Then, 25 mL of each solution was transferred into a Teflon autoclave, which was sealed and kept at 423 K for 6 h (5 K min−1 heating rate). After cooling, the yellow crystalline precipitate of Ce2(MoO4)3 was decanted, washed several times with deionized water, and finally dried at 333 K for 24 h.

2.3. Electrochemical Sensor Development

A graphite and paraffin-based carbon paste (70:30%, w/w) was used as a dispersion matrix, after complete homogenization of the precursors in an agate mortar. Then, Ce2(MoO4)3 (5%; w/w) and MWCNT (10%; w/w) were added, followed by homogenization and, when necessary, thermoactivation of the resulting composite at 373 K for 1 h. This material was inserted into a Teflon® tube (1.0 mm internal diameter) containing a 1020 stainless steel piston for electrical contact. The resulting sensor was defined as Ce2(MoO4)3/MWCNT-CPE and, before using it, its surface was smoothed against low-roughness bond paper. To compare results, working electrodes were also constructed with unmodified carbon paste (CPE) and modified with carbon nanotubes (MWCNT-CPE) or molybdate (Ce2(MoO4)3-CPE).

2.4. Physicochemical Characterization

Different techniques were explored to understand the physicochemical properties of electrode materials in terms of morphology, composition, and crystallinity, including scanning electron microscopy (SEM; Tescan Vega 3, Tokyo, Japan), performed with a 30 keV electron beam; Raman spectroscopy (Micro-Raman Senterra, Bruker, Ettlingen, Germany), using a solid-state laser that operated at 532 nm with 5 mW power; X-ray diffraction (XRD; Bruker D8 Advance XRD diffractometer, Ettlingen, Germany), using CuKα radiation (λ = 1.5418 Å) in the 2θ range from 10° to 90°; Fourier-transform infrared spectroscopy (FTIR; Cary 630, Agilent, Santa Clara, CA, USA); and thermogravimetric analysis (TGA—50, Shimadzu, Kyoto, Japan). Electrochemical data were obtained by voltammetric and impedimetric experiments, using a modular potentiostat/galvanostat (PGSTAT 128 N/FRA32, Metrohm-Autolab, Utrecht, The Netherlands).

2.5. Computer Simulations

The factors influencing AZM solubility in H2O, CH3OH, and CH3OH/H2O combinations were evaluated by theoretical experiments involving semi-empirical and quantum calculations. The GROMACS software (https://www.gromacs.org/) was used for molecular dynamics studies, while the solvent approximation parameters were evaluated by the MDAnalysis package (https://www.mdanalysis.org/). The tests were performed based on cubic boxes designed by the Packmol software (https://m3g.github.io/packmol/), with an initial edge size of 4.7 nm, and filled with AZM and solvent molecules in proportions sufficient to approximate the mixture density (ρ; g cm−3) closer to that observed at 293 K: ρ(H2O) = 0.99705; ρ(CH3OH) = 0.79140; ρ(10% CH3OH) = 0.97159; ρ(20% CH3OH) = 0.94980; ρ(30% CH3OH) = 0.92845; ρ(40% CH3OH) = 0.90658; and ρ(20% CH3OH) = 0.88557. The data obtained were considered in order to understand the distribution of solvent molecules around the AZM molecule (i.e., radial distribution), as well as the preferred conformation of the atoms, evaluated in terms of root mean square fluctuation (RMSF).

2.6. Electroanalytical Measurements and Performance

Electrochemical data acquisition was performed at 25 °C using a conventional three-electrode cell: (i) CPE, MWCNT-CPE, Ce2(MoO4)3-CPE, or Ce2(MoO4)3/MWCNT-CPE as a working electrode; (ii) platinum rod as a counter electrode; and (iii) Ag/AgCl as a reference electrode. Qualitative information on redox reaction mechanism, mass- and charge-transport processes, electrode modification, and analyte stability under thermal-oxidative conditions were analyzed by Cyclic Voltammetry (CV; 25–250 mV s−1) and Electrochemical Impedance Spectroscopy (EIS; 100 MHz to 100 kHz frequency range; and 5 mV modulation amplitude).
To quantify AZM (1.19–22.0 µmol L−1), Square Wave Voltammetry (SWV) was used after finding the best electroanalytical conditions in terms of pulse frequency (f; 10–300 Hz), amplitude (5–50 mV), and potential increment (1–7 mV). The choice of the optimum values for each variable was based on the signal-to-noise ratio, voltammetric profile, peak current (Ip), peak potential (Ep), and half-peak width (Ep/2). Limits of detection (LOD) and quantification (LOQ) were determined using linear regression coefficients obtained from the analytical curve [30]. To assess the precision of the proposed procedure, typical intraday (n = 10) and interday (n = 5) measurements of 10 µM AZM were performed with a single sensor, considering the relative standard deviation of the results (RSD; %). Reproducibility with different devices (n = 3) was also tested under the same experimental conditions. Excipients conventionally used in AZM-based pharmaceutical formulations (lactose, polycaprolactone, poloxamer, and soy phospholipid) were tested as potential interferers. Results obtained from the electroanalytical procedure were also validated by UV-Visible spectrophotometry performed at 547 nm [31], with the data expressed as the arithmetic mean between triplicates.

2.7. Studies on AZM’s Thermal-Oxidative Stability

Given the suspicion of accelerated degradation of AZM under more critical thermal-oxidative conditions, the electroanalytical method developed with Ce2(MoO4)3/MWCNT-CPE was tested to evaluate the stability of the aforementioned antibiotic under varying conditions of temperature (20–80 °C), exposure to ultraviolet light (1–3 h irradiation at 257 nm), and saturation with atmospheric air (1–3 h bubbling atmospheric air at 1.2 L min−1 and 15 kPa). The influence of these parameters was evaluated separately and combined. In the latter case, the effect on the accelerated degradation of AZM was studied using a 23 full factorial experimental design and response surface methodology (RSM) [32,33]. In total, 15 experiments were performed (12 trials and 3 central points) and the degradation percentages, estimated by the decrease in compound concentration, were obtained by the following polynomial equation model:
Y = β 0 + i = 1 n β i x i + i = 1 n β i i x i 2 + i = 1 n 1 j = i + 1 n β i j x i x j
where Y is the percentage of AZM degradation; β 0 represents the intercept coefficient; β i , β i i , and β i j are regression coefficients; and x i and x j are the independently studied variables. The predicted and observed values in each condition are shown in Table S1Supplementary Materials.

3. Results and Discussion

3.1. Relationship between AZM Solubility and Electroactivity

The AZM molecule is formed by three interconnected cyclic structures composed mainly of carbon atoms (Figure 1A), with low solubility expected in purely aqueous matrices, although there are nitrogen and oxygen sites available for hydrogen bonds. Therefore, different combinations of CH3OH:H2O were evaluated to identify the most suitable solvent to solubilize the analyte and allow the correct assessment of its electroactivity. With this goal in mind, theoretical experiments were performed based on semi-empirical and quantum calculations that explain the radial distribution of solvents around the solute. The results indicated that H2O forms solvation layers more than 20 Å away from the solute (radial distribution ≈ 1.0; Figure 1B), although the most effective interactions for solubilization do not exceed 5 Å [34], since hydrogen bonds have a directional character, requiring that the donor and acceptor groups are properly aligned and in close contact. As the AZM–H2O interaction occurs through a limited number of reactive sites, the solubility of the antibiotic is impaired and makes its electrochemical characterization difficult due to the low concentration available in the redox equilibrium.
The relationship between radial distribution and solute distance improves with CH3OH, possibly due to the greater abundance of C–C interactions in this system. However, concentrated CH3OH has a high evaporation rate and compromises the electrode materials by erosion, jeopardizing its choice as an ideal solvent. CH3OH:H2O combinations are easier to manipulate, enabling polarity control as the alcohol concentration increases from 10% to 50% (v/v). This process also reduces solute solvation by solvent molecules more than 5 Å apart, possibly displaced by hydrophobic repulsion between the components of the CH3OH:H2O mixture. Another interesting point is that the addition of CH3OH almost does not influence the distribution of solvation layers closer to the solute, as well as contributes to solubilizing it through dipole-induced dipole attraction and London dispersion forces.
Solute–solvent interactions are also directly related to the exposure/conformation of atoms that participate in intramolecular and intermolecular interactions. In this work, this information was evaluated in terms of RMSF; higher values of this variable indicate greater susceptibility of the solute to solubilize [35]. In Figure 1C,D, the RMSF values increase from the center towards the limit of the circumferences. In Figure 1C, when there is only H2O in the system, the O and N atoms of the AZM molecule are less available for interactions, making their solubilization by hydrogen bonds difficult. This aspect changes in the presence of CH3OH, especially using 50% (v/v) of this solvent, which increases the amount and intensity in which the N and O atoms of the rings become more accessible to the solvent. This behavior occurs even in the largest ring of the structure, which is mainly responsible for its hydrophobicity.
The benefits of the CH3OH/H2O combination also extend to carbon atoms (Figure 1D), as the presence of alcohol favors the emergence of new interactions. This mixture also triggers changes in dielectric constant (εr ≈ 50 for 50% CH3OH, v/v) compared to the isolated solvents (εr = 78.36 for H2O and εr = 32.61 for CH3OH), changing the conformational stability of the carbon atoms that bind to the sugar rings (C7 and C18) and influence the solubility of the AZM molecule. Given these results, the AZM stock solution was prepared with a mixture of CH3OH:H2O (50:50% v/v), corroborating data published by Cao et al. [36], who found greater solubility for AZM in solvents of intermediate polarity.
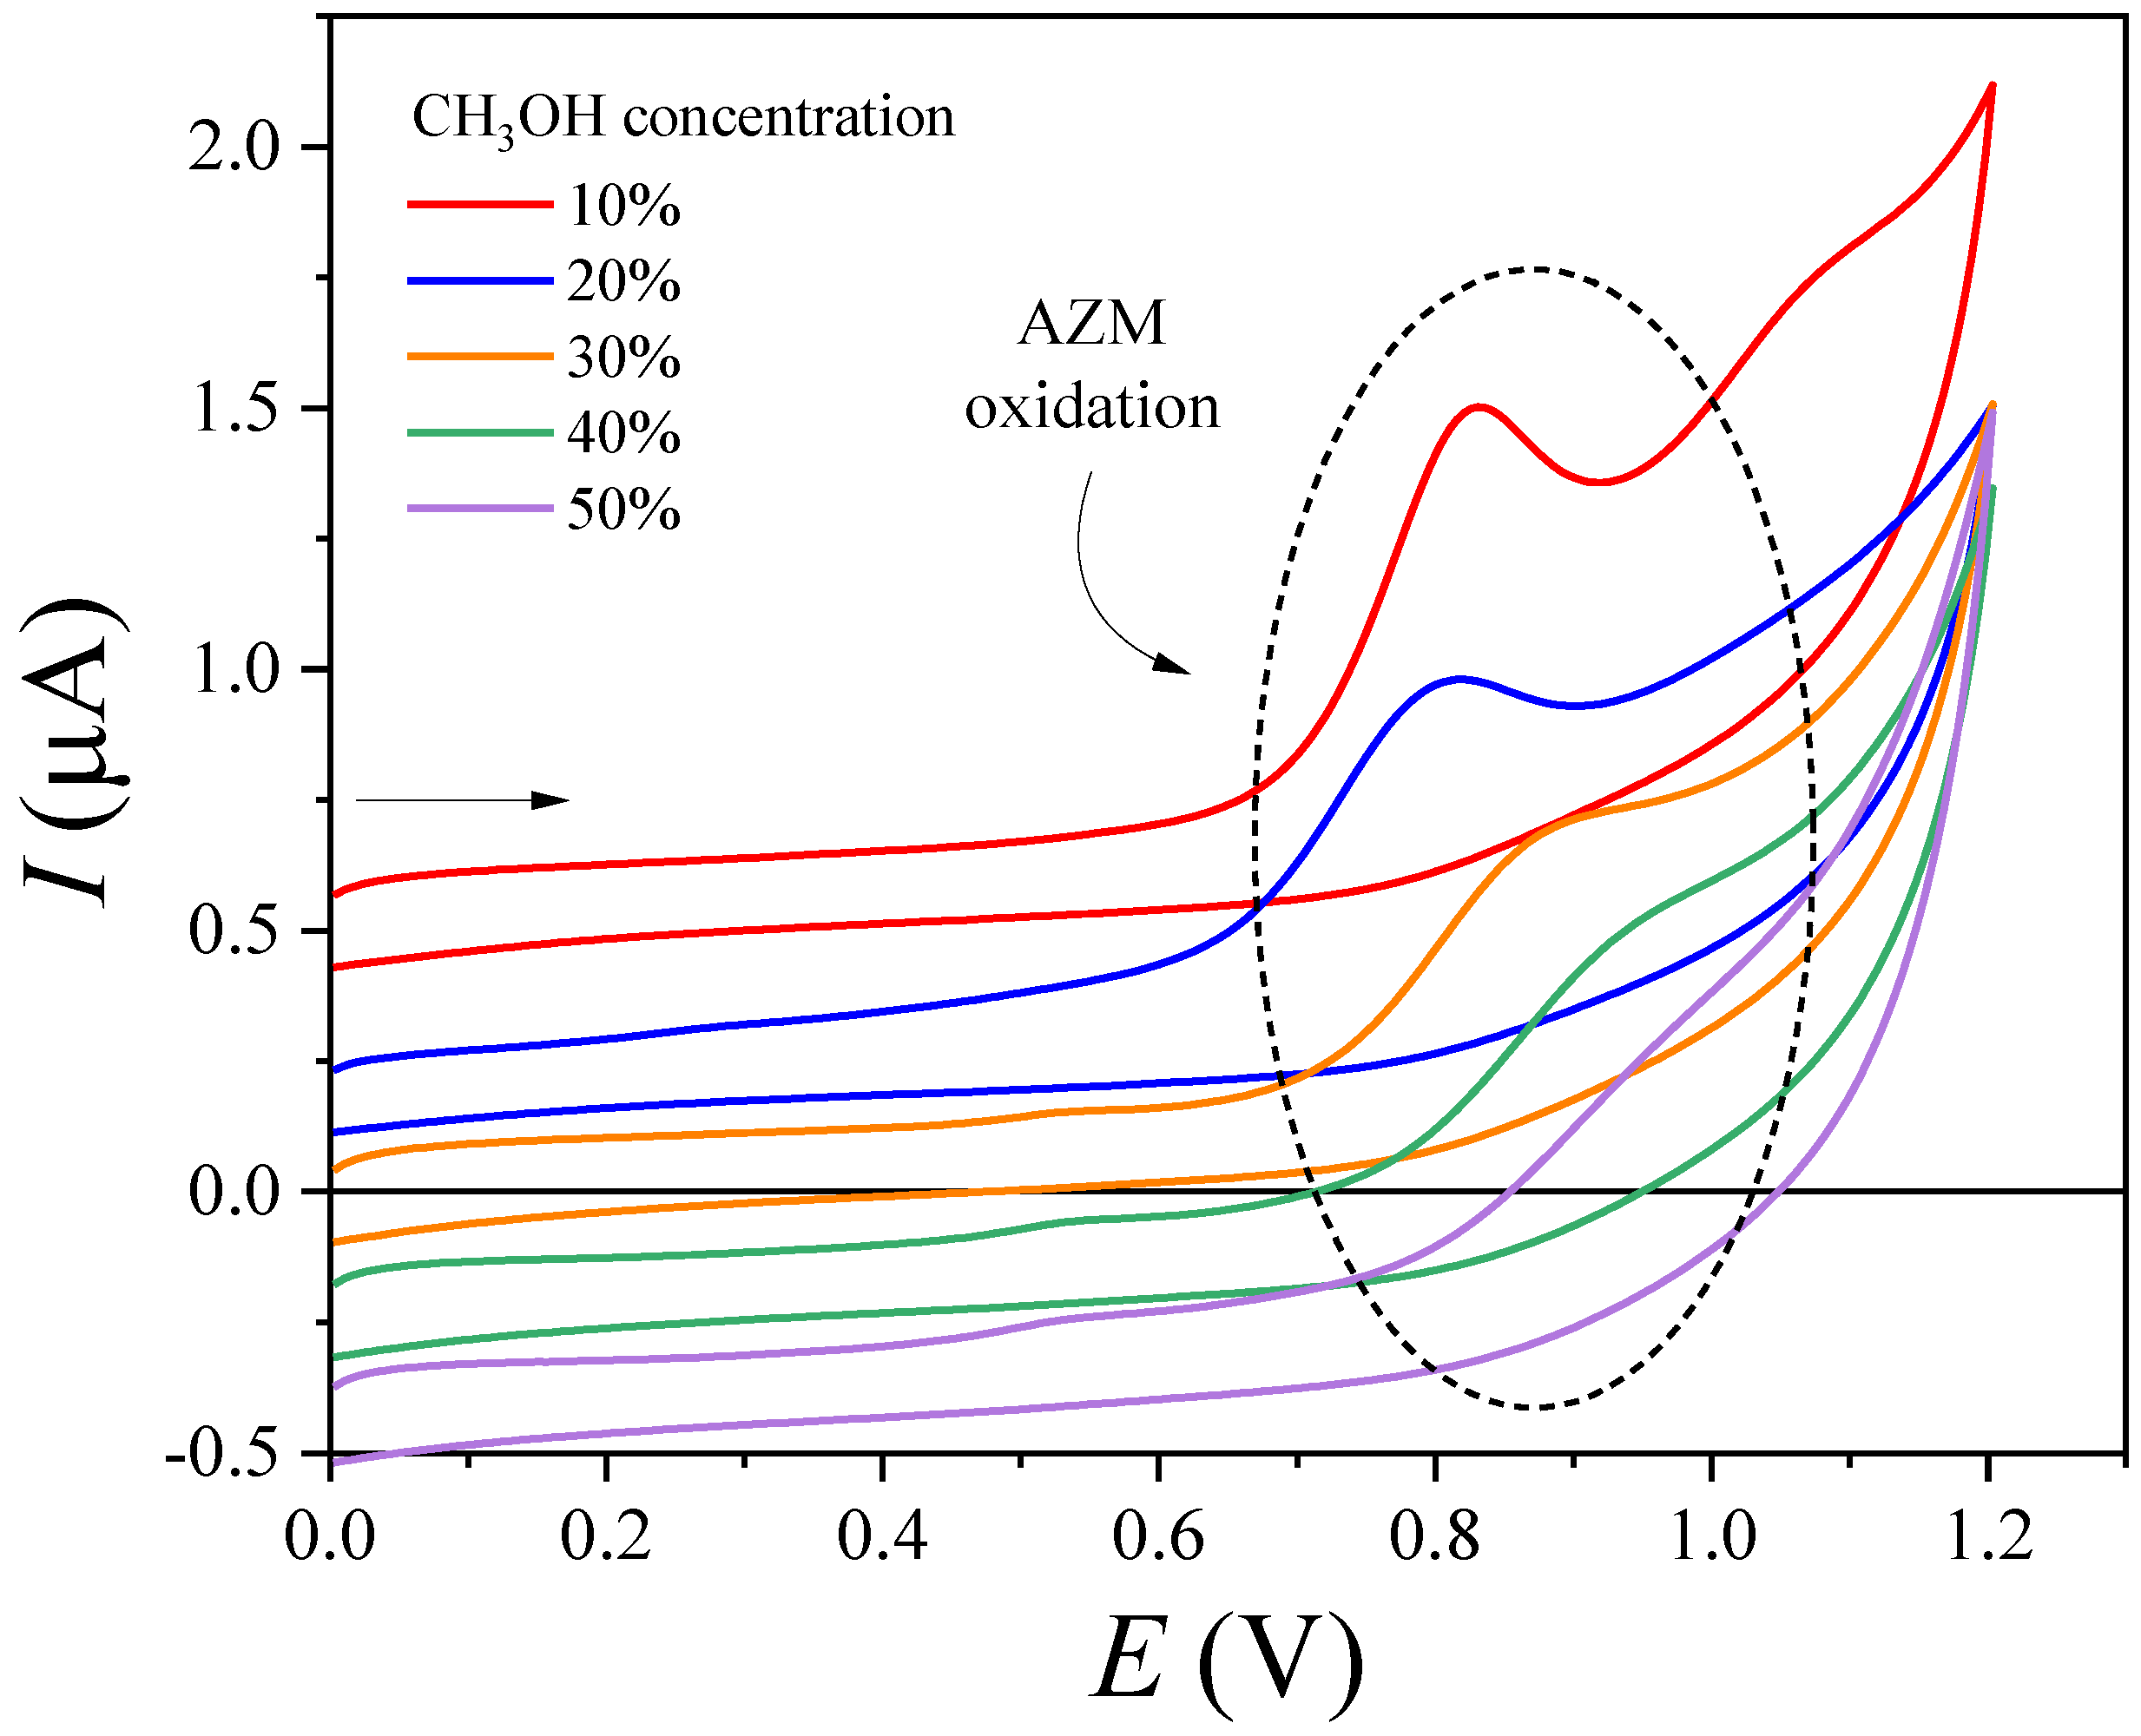
CH3OH was also used in the supporting electrolyte. From Figure 2, it is observed that the presence of this alcohol also affects the intensity, potential, and voltammetric profile recorded for AZM oxidation. Keeping the analyte concentration at 10 µM in electrolytes with [CH3OH] > 10% (v/v), there was a loss of resolution, reduction in Ip values, and increase in Ep values, caused by increased viscosity and mass transport limitation at the electrode/solution interface. The electroanalytical signal also decreased with [CH3OH] < 10% (v/v) due to low solubility and availability of the analyte in the electrochemical cell. Given these results, phosphate buffer prepared in a binary mixture of CH3OH/H2O (10:90%, v/v) was used as an electrolyte in the following experiments.

3.2. Characterization of Electrode Materials

The physicochemical features of the electrode materials were evaluated regarding morphology, crystallinity, and composition. Starting with the morphological aspects, the micrograph in Figure 3A proves that the as-prepared Ce2(MoO4)3 has characteristics of polydisperse microparticles, prone to agglomeration by an Ostwald Ripening-type mechanism (total energy reduction by increasing system scale size), which is common for materials with high surface charge. Observing molybdate at a higher magnification level (Figure 3B), microstructures shaped like truncated octahedra can be seen. Figure 3C shows a theoretical projection of the Ce2(MoO4)3 produced, with ~2.0 µm in the cross section and ~1.2 µm in the prismatic plane base. MWCNT tangles are also visible before combining them into the carbon composite (Figure 3D) but become imperceptible after homogenization in the conductive mixture (Figure 3E). Ce2(MoO4)3 microparticles are more noticeable in proportions > 20% (w/w), appearing as non-agglutinated and randomly distributed microcrystals, highlighted in the white circle in Figure 3F. This feature is interesting for electrochemical sensors because it allows better use of the material’s semiconductor properties when compared to its agglomerated form.
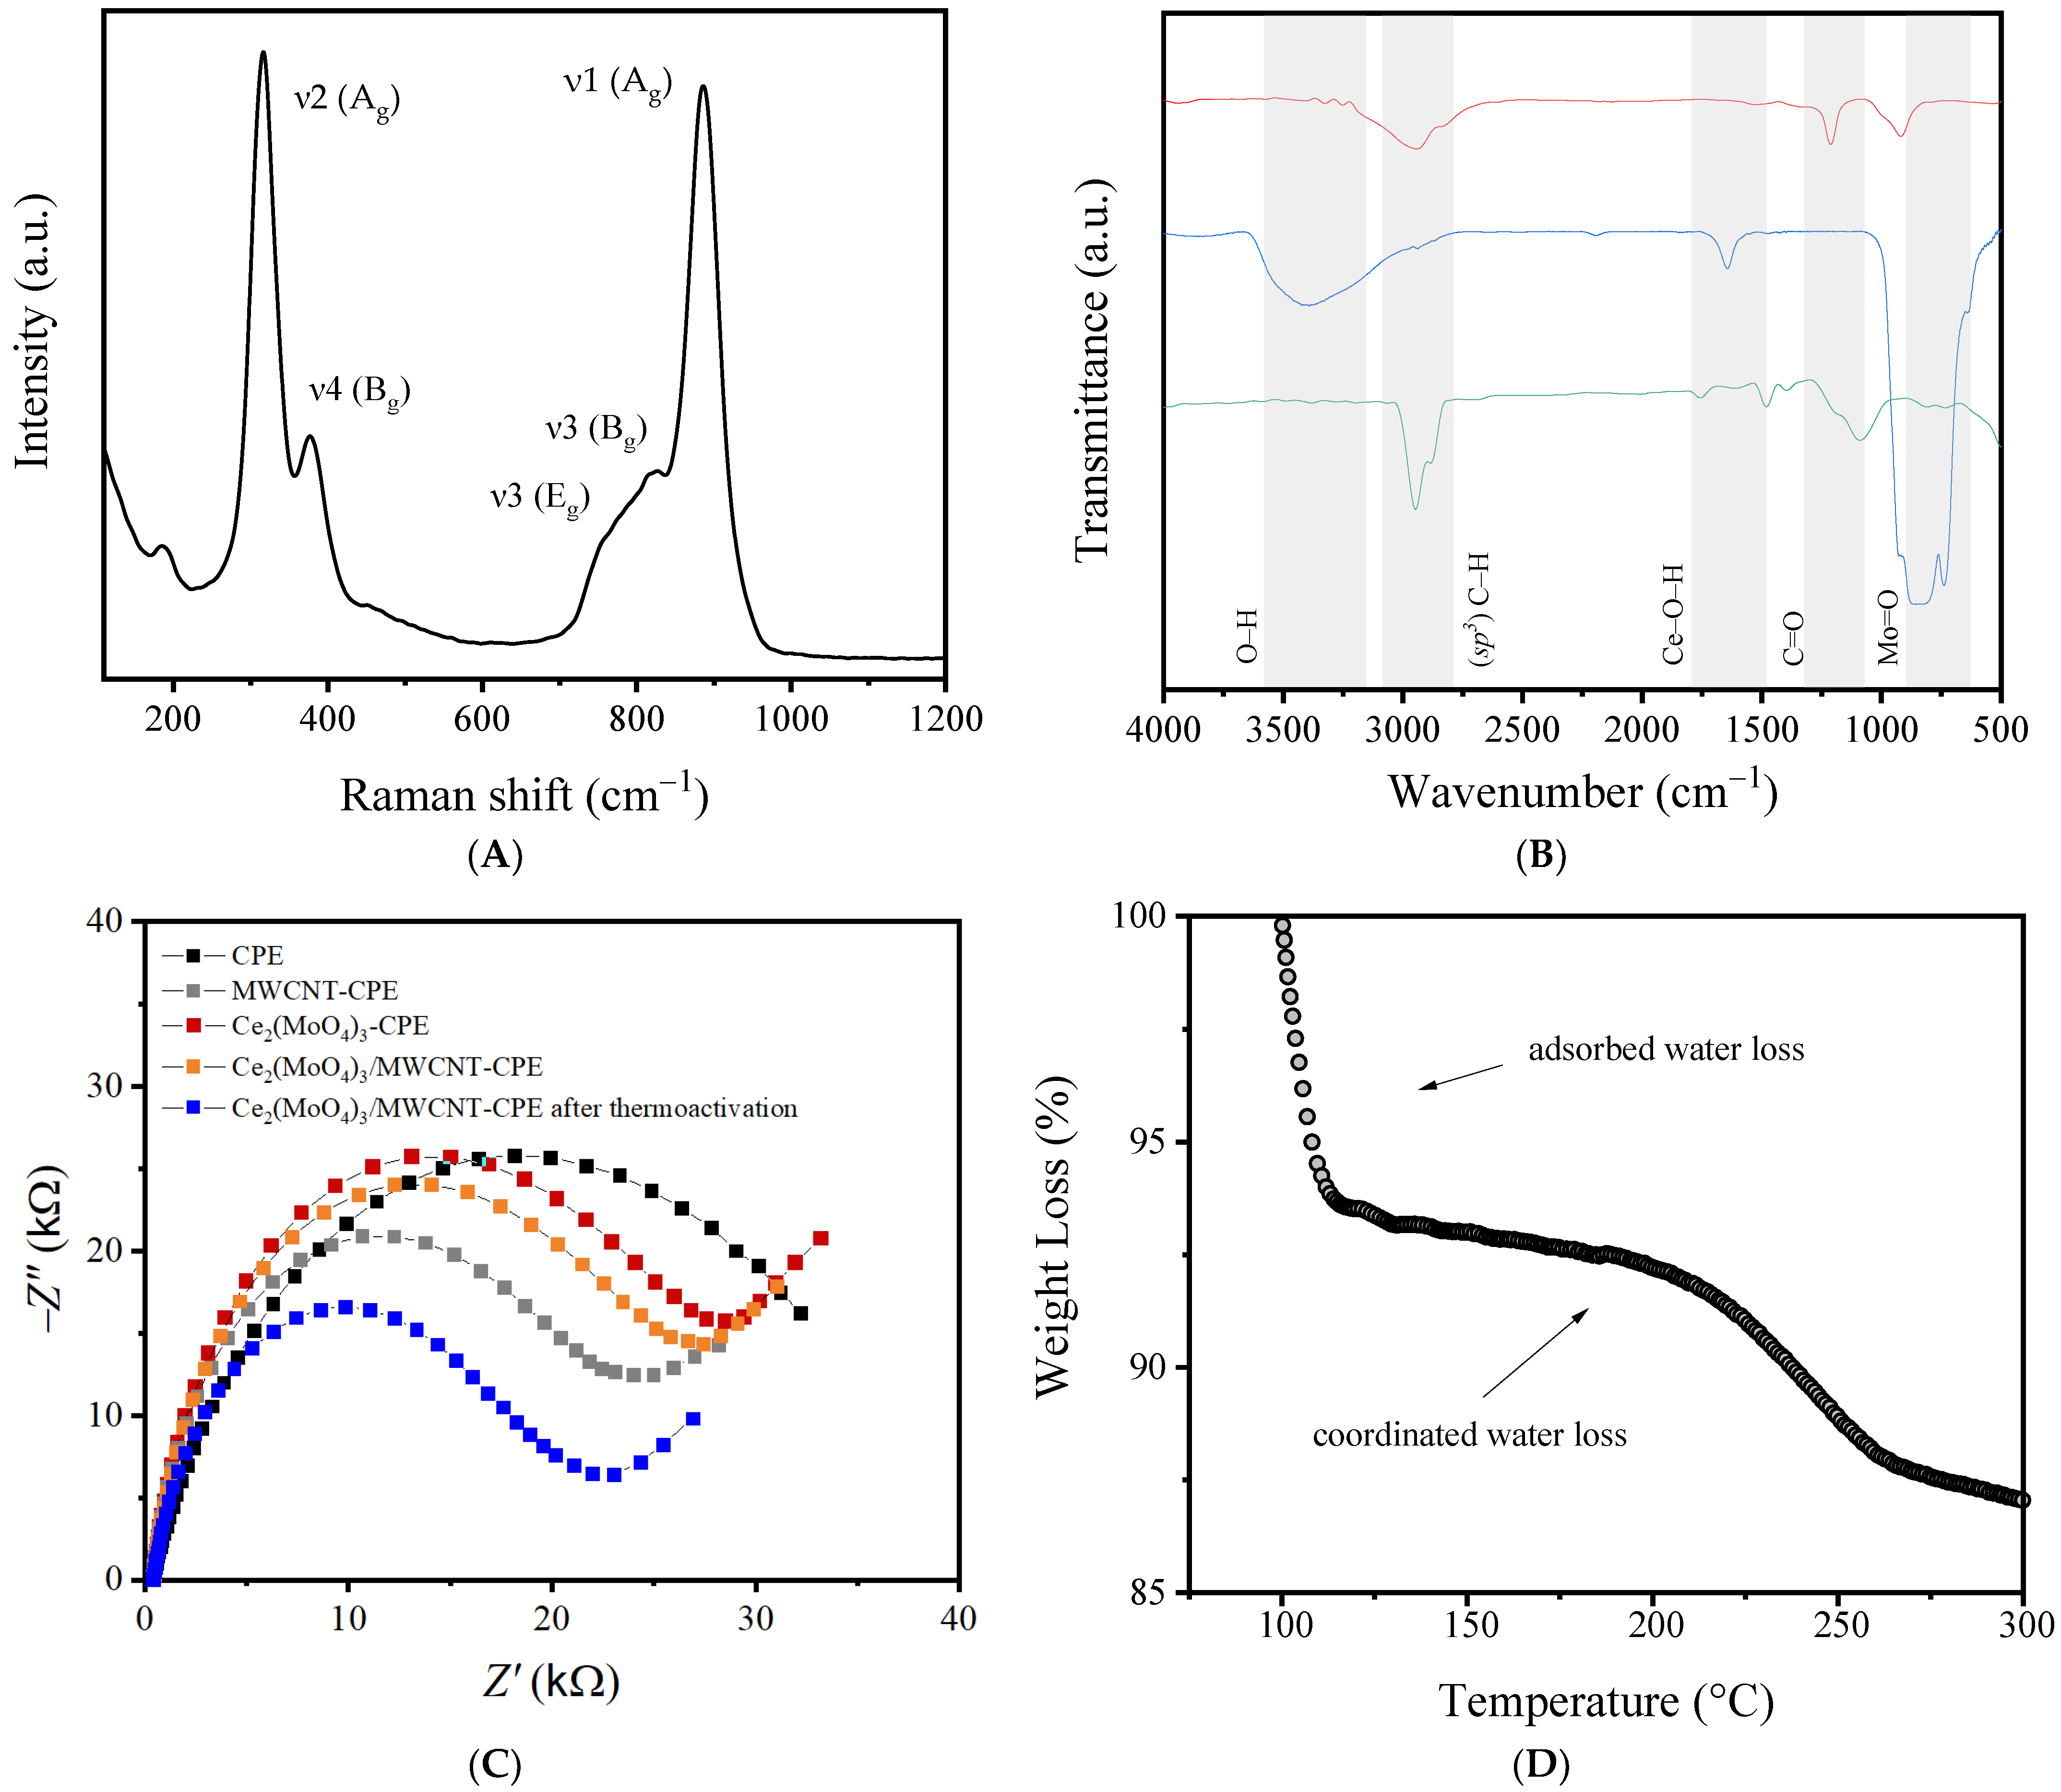
The success of molybdate synthesis was also verified by Raman spectroscopy. The spectrum illustrated in Figure 4A reveals peaks between 670 and 1000 cm−1, attributed to symmetric and asymmetric Mo-O stretching vibrations; ν3 (Eg), ν3 (Bg), and ν1 (Ag). Those between 250 and 500 cm−1 represent symmetric and asymmetric O–Mo–O deformations; ν2 (Ag) and ν4 (Bg) [20]. The signals below 220 cm−1 correspond to the transduction and libration processes of MoO42− and Ce3+ ions. The internal vibrational mode, with a sharp and intense profile at approximately 890 cm−1, indicates that the molybdate crystals are morphologically organized in a short range [21]. Additional XRD analysis of molybdate (Figure S1) indicated a remarkable structural organization and crystalline arrangement, characteristic of a tetragonal scheelite-like structure with space group C64h (I41/a) (ICSD card No. 423509). The lattice parameters and quality indicators obtained by Rietveld refinement are available in Table S2. The FTIR spectrum for Ce2(MoO4)3 shows vibrational modes characteristic of the molybdate group (Figure 4B), highlighting a set of peaks between 950 cm−1 and 720 cm−1, resulting from terminal Mo=O stretching vibrations [23]. Vibrational modes ≥ 850 cm−1 are seen in tetragonal crystalline scheelite-type structures [37]. The sharp and lower intensity peak at 1450 cm−1 comes from Ce–O–H bending modes [38]. The broad band between 3600 cm−1 and 3100 cm−1 is associated with the O–H stretching and bending modes, possibly arising from reticular/interstitial water present in the structures. After dispersing the molybdate in the composite, the peaks related to carbon allotropes appear with greater intensity, as they are in superior proportion. The peaks between 3000 cm−1 and 2840 cm−1 refer to the C–H vibrational modes of sp3-hybridized carbon atoms. The existence of oxygenated functional groups in the MWCNT structure was also proven by C=O stretching vibrations around 1500 cm−1 [39].
Regarding the variations in charge-transfer resistance (Rct) caused by the combined materials, the information was assessed by EIS using 1.0 mM K4[Fe(CN)6] as a redox probe to monitor interfacial processes at 0.25 V. Based on Nyquist diagrams (Figure 4C), the system assembled with CPE has the highest capacitance, reaching Rct = 37.17 kΩ. For amperometric sensors, high Rct values impair the sensitivity at which the electroanalytical signal is recorded. In this sense, the addition of MWCNT is decisive for better electroanalysis performance, enabling the system to operate with Rct = 24.48 kΩ and, in this circumstance, facilitating the participation of diffusion processes in the electrical circuit. After adding Ce2(MoO4)3 to the composite, there is a further increase in the semicircle diameter, both in the presence (Rct = 29.67 kΩ) and absence of nanotubes (Rct = 31.91 kΩ), suggesting a new increase in electrical resistance. Although the molybdate produced is a semiconductor, the presence of water adsorbed and/or coordinated to the microcrystals can increase the charge-transfer resistance [40]. This hypothesis is confirmed by the thermogravimetric analysis in Figure 4D, where mass losses in the compound are recorded for both conditions. For this reason, Ce2(MoO4)3/MWCNT-CPE was thermoactivated at 120 °C for 1 h before electrochemical measurements, leading to a pronounced decrease in the system’s impedance (Rct = 18.44 kΩ) caused by water loss.

3.3. AZM Electroactivity

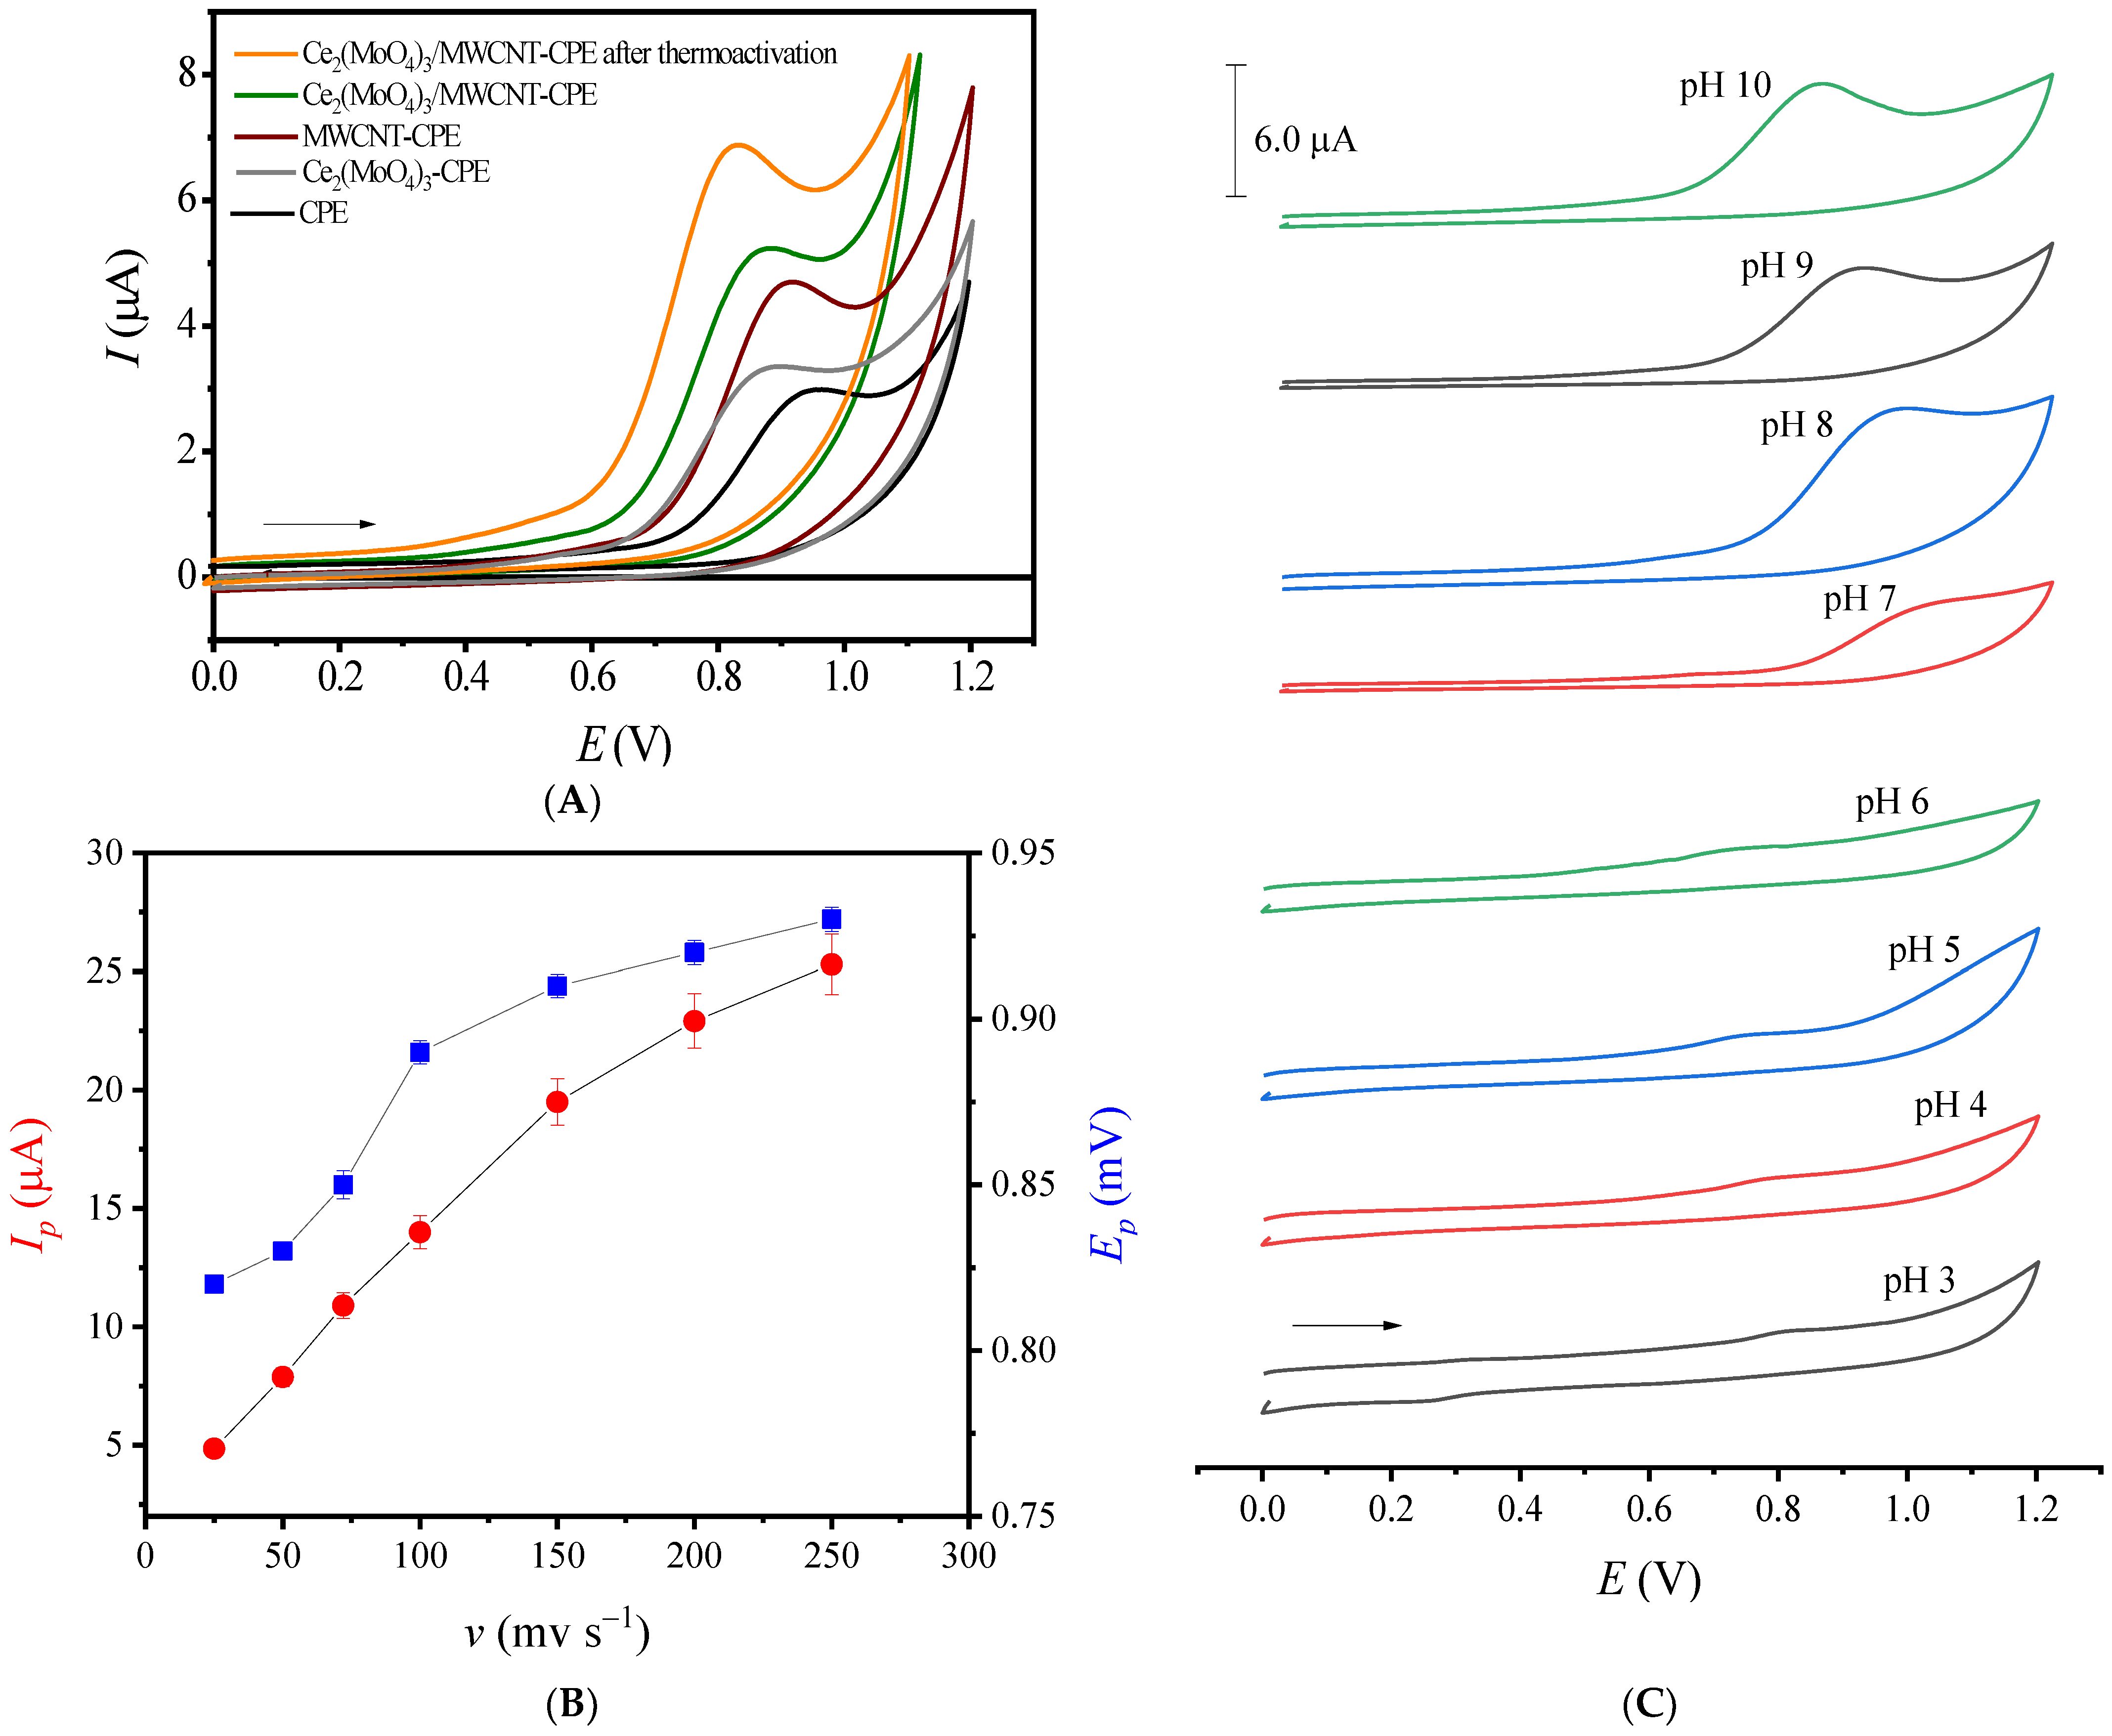
The reactivity of the different electrode materials for AZM oxidation was evaluated by CV at 50 mV s−1, using 1.0 mM phosphate buffer (pH = 8.0) prepared in CH3OH/H2O (10:90%, v/v) as an electrolyte. Figure 5A reveals a relatively low anodic process at 0.9 V when the redox reaction is studied on CPE, but this same electrochemical event is significantly amplified using MWCNT-CPE (1.81 µA increment in faradaic current), proving the importance of carbon nanotubes to improve device sensitivity. Among other advantages, MWCNT collectively provide greater active area, conductivity, and electronic transport kinetics for the redox reaction under study. Molybdate demonstrates a greater effect on the electrocatalysis of the redox reaction (oxidation peak 100 mV less positive), but also contributes to signal intensity after Ce2(MoO4)3/MWCNT-CPE thermoactivation, since the electrical resistivity is lower. A comparison of voltammetric signals recorded in the absence and presence of AZM can be seen in Figure S2Supplementary Materials. The voltammograms recorded in the absence of the analyte were similar for all sensors tested. It is worth mentioning that no significant variation in the AZM oxidation current was observed even after fifty potential scans, confirming device stability.
The Ip values generated by the drug oxidation progressively decreased after consecutive potential cycles, with Ep also shifting towards more positive values, characterizing interfacial adsorption of the reaction products on Ce2(MoO4)3/MWCNT-CPE. Furthermore, increasing the scan rate (25–250 mV s−1), there was a non-linear increase in Ip and Ep values (Figure 5B), which is typical of irreversible electrochemical reactions with product adsorption [41]. The effect of scan rate on reaction potentials is also useful for estimating the number of electrons in the reaction under study by the following equation:
E p E p / 2 = 48 α n
Knowing that α represents the electron transfer coefficient and that irreversible oxidation of organic compounds usually results in α = 0.5, it is estimated that AZM loses 2e during the anodic process. The peak potential recorded in an alkaline medium corresponds to that expected for the oxidation of the amine group in the desosamine ring [42]. In this case, AZM oxidation begins with the deprotonation of the nitrogen atom (Scheme 1), followed by the loss of 1e and formation of a radical cation:
The radical cation is very reactive and quickly transfers one more e, converting it to an enamine derivative. Apparently, its dimerization on the electrodic surface is moderately weak since the simple mechanical stirring of the electrolyte before measurements was enough to remove it and recover the initial current value. This is advantageous in electroanalytical systems because it minimizes the need for electrode polishing, which modifies the active area and impairs reproducibility.
The reaction mechanism and, consequently, the reactivity of the molecule can change depending on pH. In this work, the proton-dependent character of AZM was studied in a wide pH range (3–10), considering values lower and higher than its theoretical ionization constant (pKa ≈ 8.5). Cyclic voltammograms in each condition can be seen in Figure 5C. For pH < 7, only low-intensity oxidation and reduction peaks are detected, indicating lower reactivity of the protonated molecule [41]. AT pH ≥ 7, a larger and well-defined oxidation peak is observed between 0.7 V and 1.0 V, being more suitable for electroanalytical purposes. Following intensity and reproducibility criteria, pH = 8 was used as the ideal condition in the remaining experiments.

3.4. Electroanalytical Parameters

Before AZM electroanalysis, the SWV current components were preliminarily evaluated using f = 100 Hz, a = 40 mV, and ΔEs = 5 mV. Figure S3 shows that the net component has greater intensity, since it is obtained from the sum of the forward and backward components, thus being more appropriate for developing the electroanalytical method. Regarding optimization of pulse frequency (f; 25–300 Hz), there was a linear increase in Ip up to f = 100 Hz, as well as a displacement of Ep and Ep/2 towards more positive values. Since the SWV scan rate is directly affected by f, it is believed that the observed effects are also related to moderately slow AZM oxidation kinetics. The variation in pulse amplitude (a; 5–50 mV) provided a linear increase in Ip values up to a = 40 mV, besides a succinct reduction in Ep values. The potential increment (ΔEs; 2–7 mV) had a similar effect on the currents, but the opposite behavior for the Ep values. The square wave voltammograms recorded under the different conditions mentioned above are compiled in Figure S4. Aiming to add greater sensitivity to the electroanalytical method, the following conditions were selected to construct the analytical curve: f = 100 Hz, a = 40 mV, and ΔEs = 5 mV.
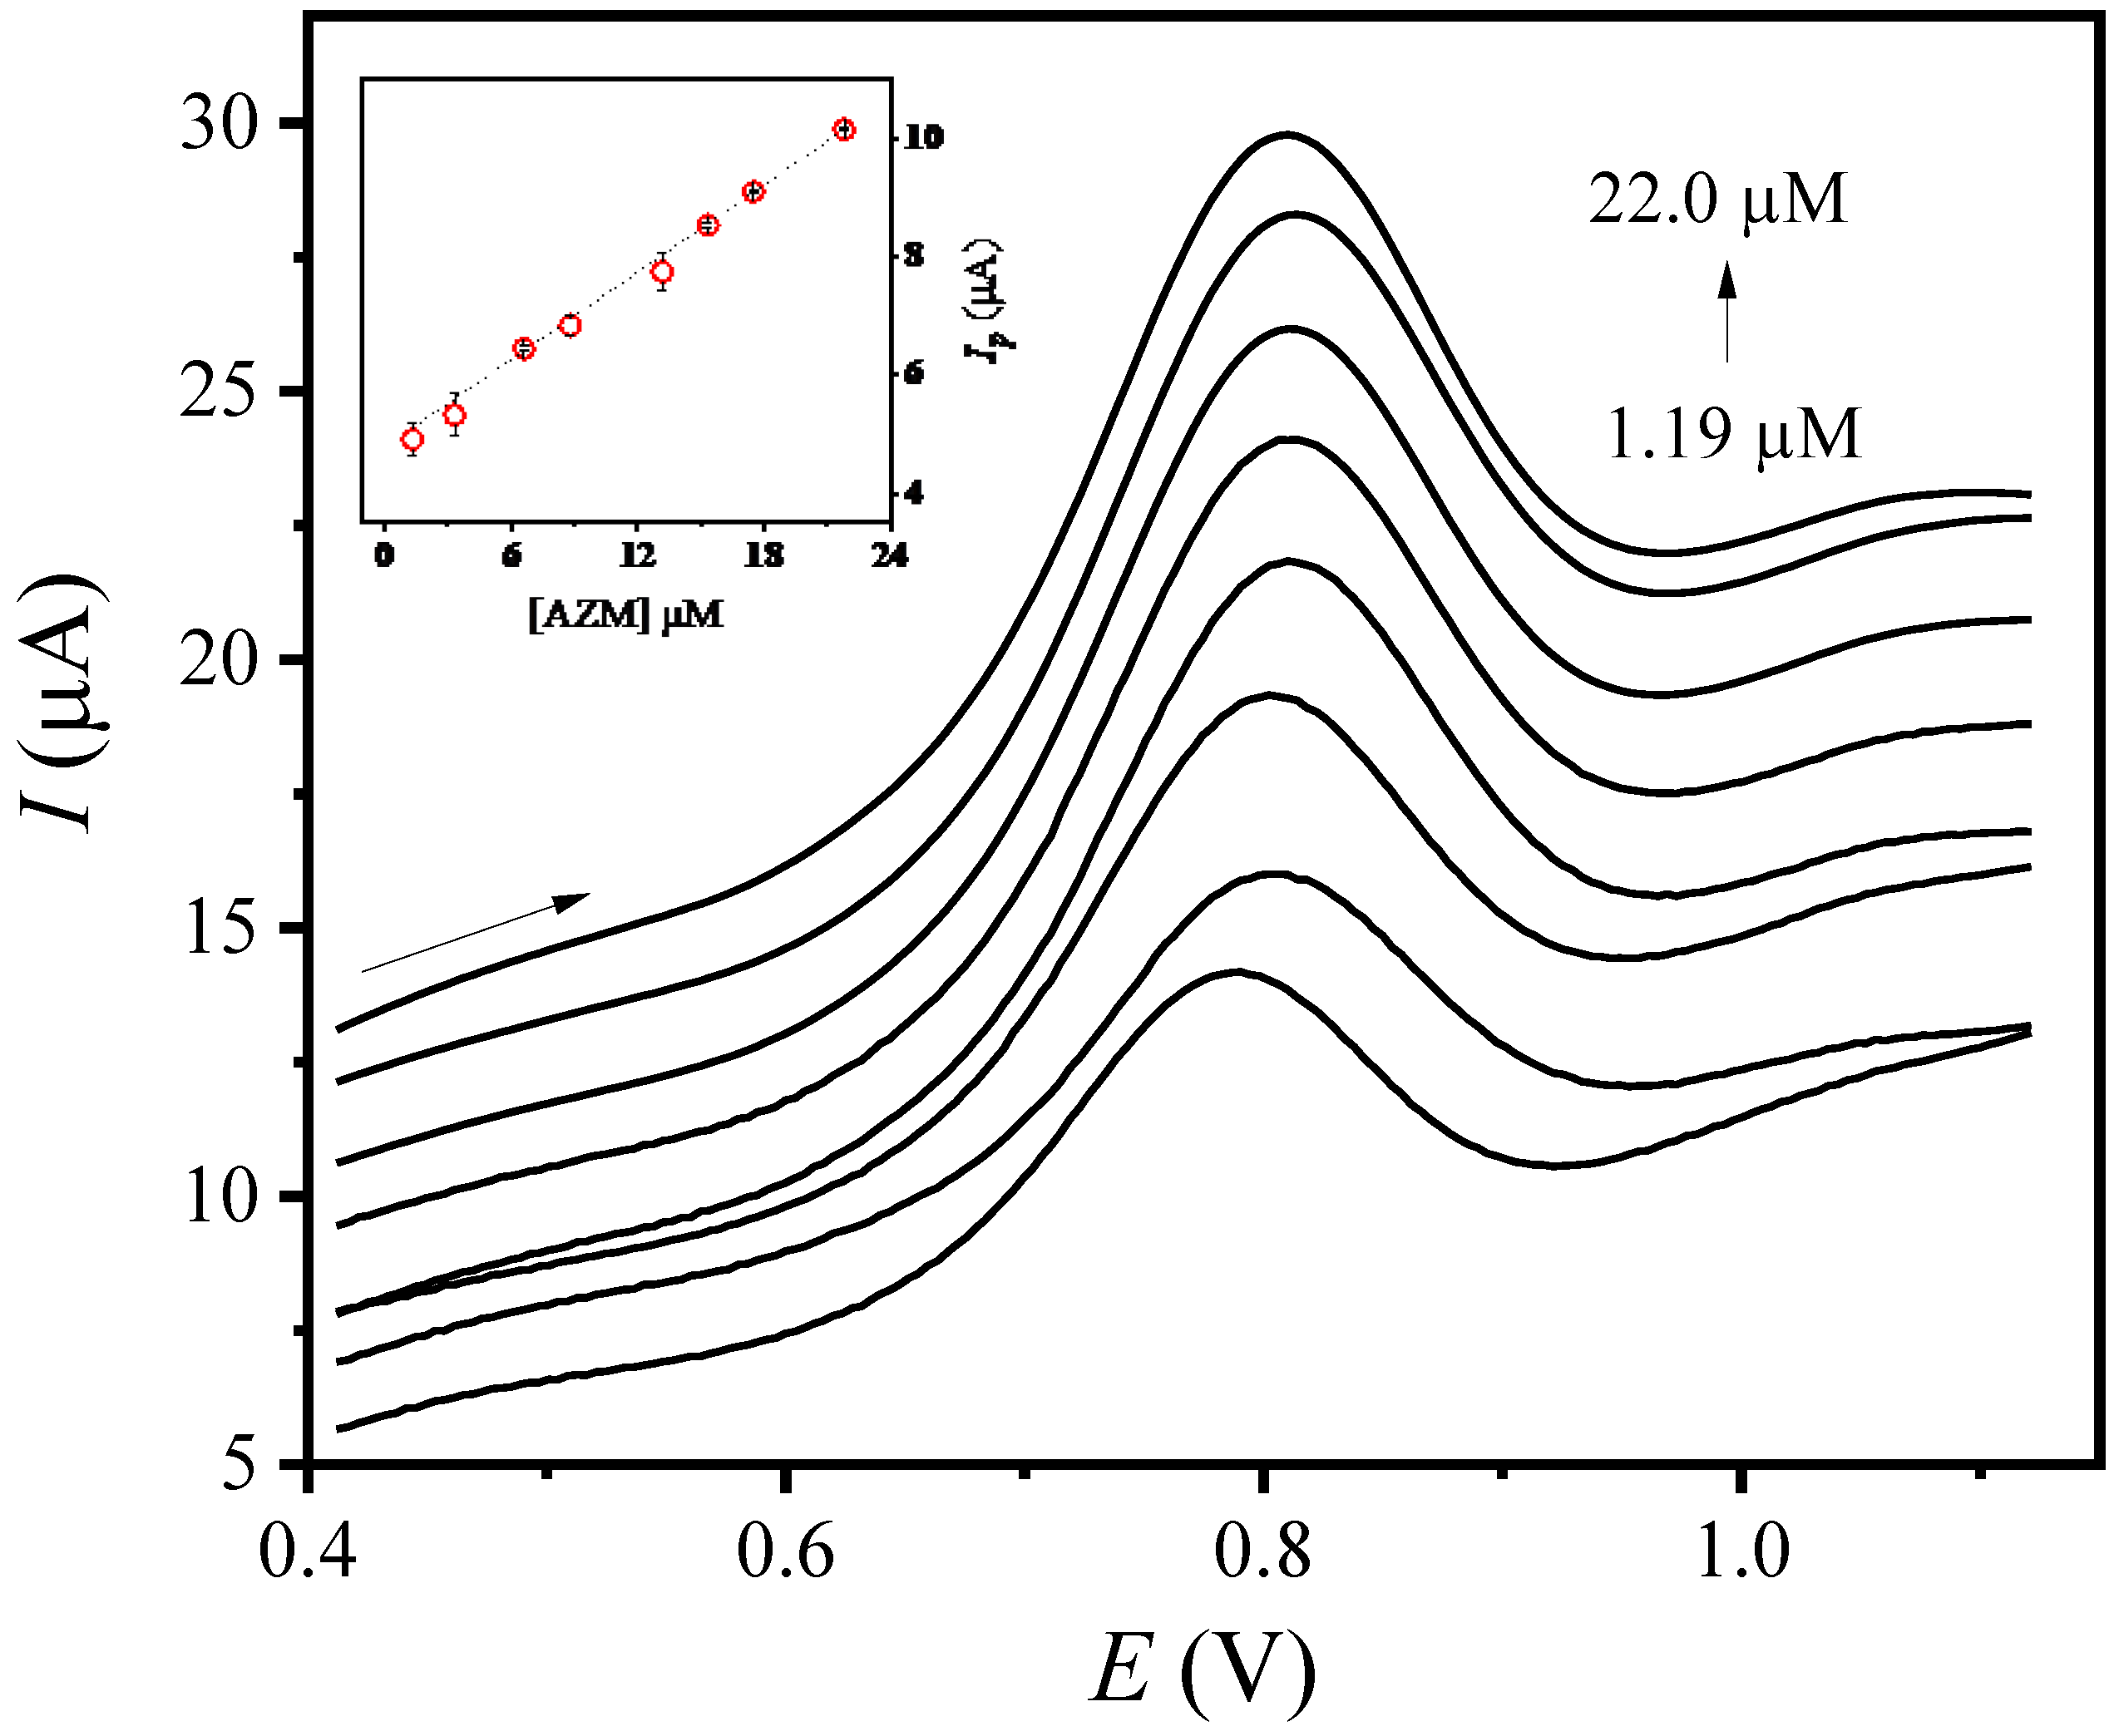
The electroanalytical performance of the thermoactivated Ce2(MoO4)3-MWCNT/CPE sensor to detect and quantify AZM in drug samples was evaluated by the linear regression coefficients resulting from the variation in analyte concentration (1.19–22.0 µM) and the corresponding Ip values, as indicated in Figure 6. The working dynamic range showed high linearity and low dispersion of measurements (R2 = 0.9954; insertion in Figure 6), indicating that the following mathematical expression is statistically adequate to describe the data variance:
I p μ A = 5 . 03 × 10 6   ( μ A ) + 0 . 279   ( μ A / μ M )   AZT   ( μ M )
The LOD and LOQ values were 230 nM and 750 nM, respectively, reaching levels as low as those sought for matrices of environmental concern (LOD ≈ 500 µM; [43]), body fluids (LOD ≥ 0.10 µM; [44]), cells, and pharmaceutical formulations (LOD ≥ 0.76 µM; [45,46]). This sensitivity was also better or similar to those found with other electrode materials, i.e., cobalt oxide (LOD = 925 nM; [47]), graphene (LOD = 303 nM; [42]) and cobalt ferrite–nickel oxide composites (LOD = 660 nM; [48]).
The intraday (n = 10) and interday (n = 5) repeatability tests performed with the same electrode also indicated low variance in the results (RDS ≤ 3.0%), as indicated in Table 1. Even using different devices (n = 3), only a subtle increase in data dispersion was noted, reiterating the credibility of the method. Additionally, these values were compared to those obtained by a reference spectrophotometric method [31], and the equivalence between them confirms the accuracy and reliability of the results. Excipients conventionally used in AZM-based formulations (lactose, polycaprolactone, poloxamer, and soy phospholipid) were also tested as possible interferers, but there was no influence on the electroanalytical signal, even at equimolar concentrations of the studied antibiotic.

3.5. AZM Thermal-Oxidative Stability

Given the performance of the thermoactivated Ce2(MoO4)3/MWCNT-CPE sensor for AZM electroanalysis, it was used to monitor the thermal-oxidative stability of the antibiotic at different temperatures (20–80 °C), times of exposure to UV radiation (1–3 h of irradiation at 257 nm), and air saturations (1–3 h of saturation with atmospheric air at 1.2 L min−1 and 15 kPa). The experiments conducted with each isolated parameter proved that, in fact, they all contribute to degrading the active ingredient (Figure S5), providing favorable conditions for chemical oxidation, although with different reaction kinetics. The thermal-oxidative degradation rate observed for the different variables follows a pseudo-second order model, with kinetic constants ranging from 0.006 to 0.042 M−1 s−1. When tested separately, the increase in temperature and saturation with atmospheric air had a greater impact on the process, reducing the AZM concentration to 40–78% of the initial value under the most critical conditions. The degradation of AZM when exposed to varying conditions of temperature and UV radiation or in contact with oxidizing species was also confirmed by other authors, through bioassays with Bacillus subtilis (ATCC 9372) [49] and UV spectrophotometry at 208 nm [50], strengthening the arguments presented.
Assuming that, in real conditions, these parameters (temperature—A, UV radiation—B, and air saturation—C) influence the stability of AZM collectively, and their combined effect was also verified by a 23 full factorial experimental design, described by the following polynomial equation:
A Z M   d e g r a d a t i o n % = 93.03 + 3.56   A + 29.46   B + 0.63   C 0.03   A 2 11.88   B 2 0.01 C 2 + 0.20   A B 0.01   A C + 0.39   B C
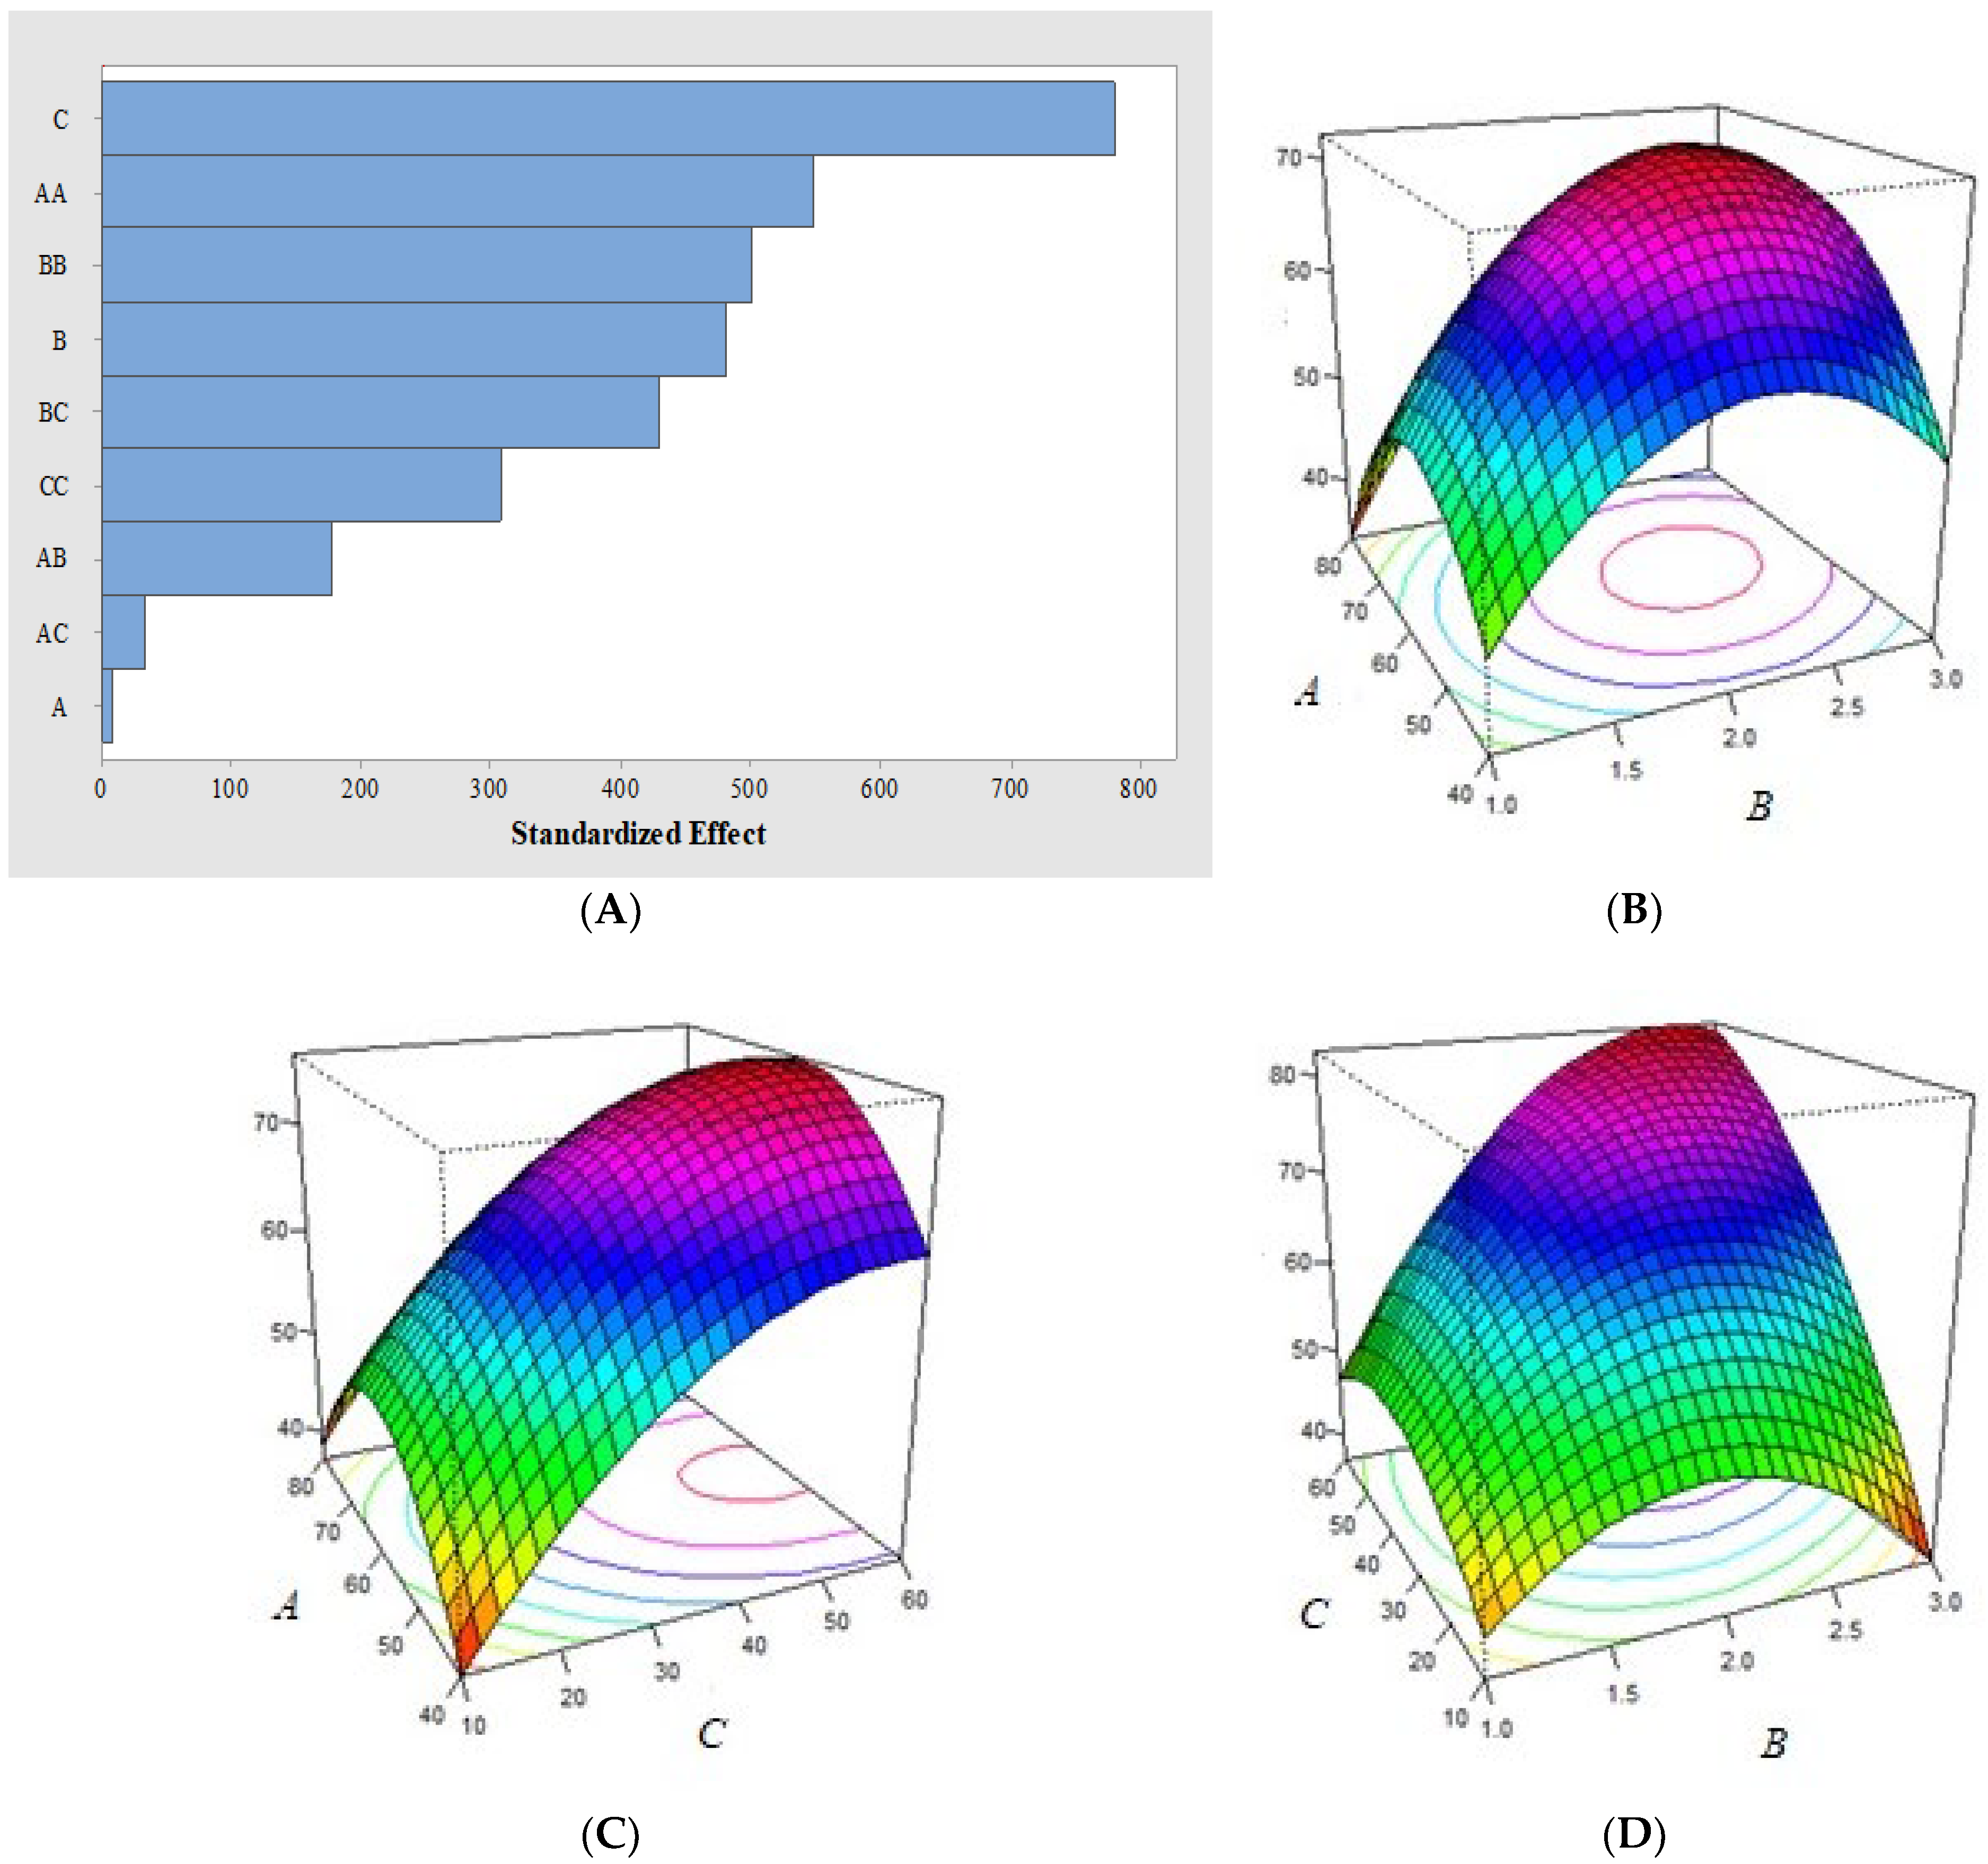
The adequacy of the analysis of variance (ANOVA; Table 2) for 95% confidence was confirmed by the Fisher’s F-test (p < 0.05) and correlation coefficient (R2 = 0.999) [32]. According to this model, parameter A has anomalous behavior if analyzed individually (p > 0.05), but it should not be disregarded since its quadratic and associated interactions reach p < 0.05, which proves synergy between the variables studied. According to the Pareto chart (Figure 7A), the following order of influence is established during the oxidation of AZM: A < AC < AB < C2 < BC < B < B2 < A2 < C. Evaluating the AB combination from the RSM plot (Figure 7B), the greatest degradation occurs around 60 °C and with 2.5 h of UV radiation. Higher temperatures reduce the oxygen concentration in the system, which may negatively interfere with the oxidation kinetics. For the AC combination (Figure 7C), the most representative effect occurs at 60 °C and after 1.0 h of saturation with atmospheric air, but it is less critical than BC with 3 h of UV radiation (induces electron transfer and photocleavage of covalent bonds [51]) and 1.0 h of sample oxygenation (Figure 7D). The most pronounced AZM degradation was recorded with A = 60 °C, B = 3 h, and C = 1 h, reducing the initial concentration by more than 81%. The RSM plots still show signs of thermal-oxidative degradation of AZM even under milder conditions, reinforcing the importance of stricter quality control to guarantee its stability and effectiveness.

4. Conclusions

The stability of the AZM molecule is affected by thermal-oxidative conditions different from those idealized in a laboratory environment; therefore, quality control of pharmaceutical formulations enriched with this active ingredient is strongly recommended. However, its analysis is not trivial, and the theoretical–experimental evidence obtained in this research revealed an unusual dependence on the solubility/electroactivity relationship in CH3OH/H2O, which controls the diversity of intermolecular interactions and solute solvation during measurements. In an alkaline electrolyte and after thermoactivation of Ce2(MoO4)3/MWCNT-CPE, this electrochemical sensor demonstrated a very attractive analytical performance to detect AZM with the necessary accuracy and reliability, even at submicromolar levels. Under thermal-oxidative conditions controlled by temperature, UV radiation, and saturation with atmospheric air, Ce2(MoO4)3-MWCNT/CPE was useful to monitor the accelerated degradation of AZM, becoming an alternative for laboratory routines focused on the effectiveness of pharmaceutical formulations and consumers’ health.

Supplementary Materials

The following supporting information can be downloaded at: https://www.mdpi.com/article/10.3390/nano14110899/s1, Table S1: Central composite design, predicted and observed AZM degradation values, starting with 10 µM of the antibiotic, obtained with the thermoactivated Ce2(MoO4)3/MWCNT-CPE sensor in 1.0 mM phosphate buffer (pH = 8.0). Square wave voltammetric conditions: f = 100 Hz, a = 40 mV, and ΔEs = 5 mV; Figure S1: X-ray diffraction pattern of Ce2(MoO4)3 used in photoelectrochemical sensor development; Table S2: Lattice parameters and quality indicators obtained by Rietveld refinement for Ce2(MoO4)3 samples; Figure S2: Cyclic voltammograms recorded in the absence and presence of 10 µM AZM with the thermoactivated Ce2(MoO4)3/MWCNT-CPE sensor at 50 mV s−1, using 1.0 mM phosphate buffer (pH = 8.0) prepared in CH3OH/H2O (10:90%, v/v) as electrolyte; Figure S3: Square wave voltammetry current components recorded for 10 µM AZM with the thermoactivated Ce2(MoO4)3/MWCNT-CPE sensor, using 1.0 mM phosphate buffer (pH = 8.0) prepared in CH3OH/H2O (10:90%, v/v) as electrolyte, and applying f = 100 Hz, a = 40 mV and ΔEs = 5 mV; Figure S4: Baseline-normalized square wave voltammograms recorded for 10 µM AZM with the thermoactivated Ce2(MoO4)3/MWCNT-CPE sensor under different conditions of (A) frequency, (B) amplitude, and (C) potential increment, using 1.0 mM phosphate buffer (pH = 8.0) prepared in CH3OH/H2O (10:90%, v/v) as electrolyte. During the optimization of each parameter, f = 100 Hz, a = 40 mV, and ΔEs = 5 mV were used; Figure S5: Percentage degradation of 10 µM AZM as a function of (A) temperature, exposure time to (B) UV radiation, and (C) saturation with atmospheric air.

Author Contributions

Conceptualization, H.R.A.C.; methodology, H.R.A.C., A.O.S. and Y.N.T.; software, H.R.A.C., A.O.S. and Y.N.T.; validation, H.R.A.C. and Y.N.T.; formal analysis, H.R.A.C. and T.M.B.F.O.; investigation, H.R.A.C., M.A.S.S., V.A.F. and T.M.B.F.O.; writing—original draft preparation, H.R.A.C.; writing—review and editing, M.A.S.S., V.A.F., S.M. and T.M.B.F.O.; supervision, M.A.S.S. and T.M.B.F.O.; project administration, T.M.B.F.O. and S.M.; funding acquisition, S.M. and T.M.B.F.O. All authors have read and agreed to the published version of the manuscript.

Funding

This research was funded by the Brazilian agencies CNPq (Proc. 308108/2020-5 and 303205/2023-7), FUNCAP (Proc. BMD-0008-02291.01.04/22, BMD-0008-02291.01.01/21, FPD-0213-00336.01.00/23), and CAPES (Finance code 001). This work was also financially supported by projects 2022.07089.PTDC-NATURIST (https://doi.org/10.54499/2022.07089.PTDC), UIDB/50006/2020 (https://doi.org/10.54499/UIDB/50006/2020), UIDP/50006/2020 (https://doi.org/10.54499/UIDP/50006/2020), and LA/P/0008/2020 (https://doi.org/10.54499/LA/P/0008/2020) by Portuguese national funds from the Fundação para a Ciência e a Tecnologia (FCT)/Ministério da Ciência, Tecnologia e Ensino Superior (MCTES).

Data Availability Statement

Data are contained within the article and Supplementary Materials.

Acknowledgments

All authors are grateful to Indústria Farmacêutica Cristália—Brazil, which kindly provided the antibiotic standard used in this study.

Conflicts of Interest

The authors declare no conflicts of interest.

References

  1. Bal, A.M. Macrolide Antibiotics. In Comprehensive Pharmacology; Elsevier: Amsterdam, The Netherlands, 2022; pp. 170–184. [Google Scholar]
  2. Dhindwal, P.; Myziuk, I.; Ruzzini, A. Macrolide Esterases: Current Threats and Opportunities. Trends Microbiol. 2023, 31, 1199–1201. [Google Scholar] [CrossRef] [PubMed]
  3. Fan, B.-Z.; Hiasa, H.; Lv, W.; Brody, S.; Yang, Z.-Y.; Aldrich, C.; Cushman, M.; Liang, J.-H. Design, Synthesis and Structure-Activity Relationships of Novel 15-Membered Macrolides: Quinolone/Quinoline-Containing Sidechains Tethered to the C-6 Position of Azithromycin Acylides. Eur. J. Med. Chem. 2020, 193, 112222. [Google Scholar] [CrossRef] [PubMed]
  4. Abou Assi, R.; Abdulbaqi, I.M.; Seok Ming, T.; Siok Yee, C.; Wahab, H.A.; Asif, S.M.; Darwis, Y. Liquid and Solid Self-Emulsifying Drug Delivery Systems (SEDDs) as Carriers for the Oral Delivery of Azithromycin: Optimization, In Vitro Characterization and Stability Assessment. Pharmaceutics 2020, 12, 1052. [Google Scholar] [CrossRef] [PubMed]
  5. Kwiecień, A.; Krzek, J.; Walczak, M. Stress Degradation Studies on Azithromycin and Development of a Validated Stability-Indicating TLC-Densitometric Method with HPLC/Electrospray Ionization-MS Analysis of Degradation Products. J. AOAC Int. 2012, 95, 1418–1424. [Google Scholar] [CrossRef] [PubMed]
  6. Okaru, A.; Abuga, K.; Kamau, F.; Ndwigah, S.; Lachenmeier, D. A Robust Liquid Chromatographic Method for Confirmation of Drug Stability of Azithromycin in Bulk Samples, Tablets and Suspensions. Pharmaceutics 2017, 9, 11. [Google Scholar] [CrossRef] [PubMed]
  7. El-Gindy, A.; Attia, K.A.; Nassar, M.W.; Al Abasawi, N.M.; Al-Shabrawi, M. Optimization and Validation of a Stability-Indicating RP-HPLC Method for Determination of Azithromycin and Its Related Compounds. J. AOAC Int. 2011, 94, 513–522. [Google Scholar] [CrossRef] [PubMed]
  8. Breier, A.; Garcia, C.; Oppe, T.; Steppe, M.; Schapoval, E.E. Microbiological Assay for Azithromycin in Pharmaceutical Formulations. J. Pharm. Biomed. Anal. 2002, 29, 957–961. [Google Scholar] [CrossRef] [PubMed]
  9. Doan, C.S.; Bui, V.T.; Tong, T.T.V.; Le, D.C. Novel Approach for Infrared Spectroscopic Quantitation of Azithromycin in Commercial Tablets Employing Paracetamol as Matrix Modifier. Heliyon 2023, 9, e14647. [Google Scholar] [CrossRef] [PubMed]
  10. Nguyen, T.A.H.; Pham, T.N.M.; Le, T.B.; Le, D.C.; Tran, T.T.P.; Nguyen, T.Q.H.; Nguyen, T.K.T.; Hauser, P.C.; Mai, T.D. Cost-Effective Capillary Electrophoresis with Contactless Conductivity Detection for Quality Control of Beta-Lactam Antibiotics. J. Chromatogr. A 2019, 1605, 360356. [Google Scholar] [CrossRef]
  11. Avramov Ivić, M.L.; Petrović, S.D.; Mijin, D.Ž.; Živković, P.M.; Kosović, I.M.; Drljević, K.M.; Jovanović, M.B. Studies on Electrochemical Oxidation of Azithromycin and Hemomycin® at Gold Electrode in Neutral Electrolyte. Electrochim. Acta 2006, 51, 2407–2416. [Google Scholar] [CrossRef]
  12. Oliveira, T.M.B.F.; Morais, S. New Generation of Electrochemical Sensors Based on Multi-Walled Carbon Nanotubes. Appl. Sci. 2018, 8, 1925. [Google Scholar] [CrossRef]
  13. Bae, S.; Jeon, I.; Mahmood, J.; Baek, J. Molybdenum-Based Carbon Hybrid Materials to Enhance the Hydrogen Evolution Reaction. Chem. A Eur. J. 2018, 24, 18158–18179. [Google Scholar] [CrossRef] [PubMed]
  14. Popovych, O.M.; Budzulyak, I.M.; Kotsyubynsky, V.O.; Yablon, L.S.; Popovych, O.V. Electrochemical and Electrical Properties of Nickel Molybdate/Carbon Material Composites. Phys. Chem. Solid State 2021, 22, 481–486. [Google Scholar] [CrossRef]
  15. Fernandes, D.M.; Freire, C. Carbon Nanomaterial–Phosphomolybdate Composites for Oxidative Electrocatalysis. ChemElectroChem. 2015, 2, 269–279. [Google Scholar] [CrossRef]
  16. Krishnan, C.V.; Garnett, M.; Hsiao, B.; Chu, B. Electrochemical Measurements of Isopolyoxomolybdates: 1. PH Dependent Behavior of Sodium Molybdate. Int. J. Electrochem. Sci. 2007, 2, 29–51. [Google Scholar] [CrossRef]
  17. Nozaki, A.; Morishita, M.; Kinoshita, Y.; Yamamoto, H. Thermodynamic Properties of Cerium Molybdate. Int. J. Mater. Res. 2019, 110, 715–725. [Google Scholar] [CrossRef]
  18. Pryston, D.B.d.A.; Martins, T.V.d.S.; Vasconcelos Júnior, J.A.d.; Avelino, D.O.d.S.; Meneghetti, M.R.; Meneghetti, S.M.P. Investigation of CeO2, MoO3, and Ce2(MoO4)3, Synthesized by the Pechini Method, as Catalysts for Fructose Conversion. Catalysts 2022, 13, 4. [Google Scholar] [CrossRef]
  19. Shugurov, S.M.; Panin, A.I.; Lopatin, S.I. Thermodynamic Properties of Gaseous Cerium Molybdates and Tungstates Studied by Knudsen Effusion Mass Spectrometry. Rapid Commun. Mass Spectrom. 2018, 32, 1608–1616. [Google Scholar] [CrossRef]
  20. Oliveira, F.K.F.; Santiago, A.A.G.; Catto, A.C.; da Silva, L.F.; Tranquilin, R.L.; Longo, E.; Motta, F.V.; Bomio, M.R.D. Cerium Molybdate Nanocrystals: Microstructural, Optical and Gas-Sensing Properties. J. Alloys Compd. 2021, 857, 157562. [Google Scholar] [CrossRef]
  21. Gomes, N.M.C.; Guedes, V.H.M.C.; Costa, H.R.A.; Santos, A.O.; Moura, J.V.B.; da Luz-Lima, C.; Oliveira, T.M.B.F. Photoelectrochemical Sensor Based on Polymeric Composite Filled with Cerium(III) Molybdate to Monitor Pyriproxyfen Releases in Natural Waters. J. Photochem. Photobiol. A Chem. 2024, 446, 115113. [Google Scholar] [CrossRef]
  22. Karthik, R.; Vinoth Kumar, J.; Chen, S.-M.; Karuppiah, C.; Cheng, Y.-H.; Muthuraj, V. A Study of Electrocatalytic and Photocatalytic Activity of Cerium Molybdate Nanocubes Decorated Graphene Oxide for the Sensing and Degradation of Antibiotic Drug Chloramphenicol. ACS Appl. Mater. Interfaces 2017, 9, 6547–6559. [Google Scholar] [CrossRef]
  23. Dargahi, M.; Masteri-Farahani, M.; Shahsavarifar, S.; Feizi, M. Microemulsion-Mediated Preparation of Ce2(MoO4)3 Nanoparticles for Photocatalytic Degradation of Crystal Violet in Aqueous Solution. Environ. Sci. Pollut. Res. 2020, 27, 12047–12054. [Google Scholar] [CrossRef] [PubMed]
  24. Moura, J.V.B.; Pinheiro, G.S.; Silveira, J.V.; Freire, P.T.C.; Viana, B.C.; Luz-Lima, C. NaCe(MoO4)2 Microcrystals: Hydrothermal Synthesis, Characterization and Photocatalytic Performance. J. Phys. Chem. Solids 2017, 111, 258–265. [Google Scholar] [CrossRef]
  25. Moura, J.V.B.; Souza, A.A.G.; Freire, P.T.C.; Luz-Lima, C.; Oliveira, T.M.B.F. Blue-light-excited NaCe(MoO4)2 Microcrystals for Photoelectrochemical Water Splitting. Int. J. Appl. Ceram. Technol. 2021, 18, 615–621. [Google Scholar] [CrossRef]
  26. Gajraj, V.; Devi, P.; Kumar, R.; Sundriyal, N.; Mariappan, C.R. Fabrication of Nanocluster-Aggregated Dense Ce2(MoO4)3 Microspherical Architectures for High-Voltage Energy Storage and High Catalytic Energy Conversion Applications. Energy Fuels 2022, 36, 7841–7853. [Google Scholar] [CrossRef]
  27. Morassaei, M.S.; Salehabadi, A.; Salavati-Niasari, M.; Akbari, A. Preparation, Structural Analysis, and Assessing the Impacts of Holmium and Ytterbium on Electrochemical Hydrogen Storage Property of Strontium Cerium Molybdate Nanostructures. Electrochim. Acta 2020, 356, 136851. [Google Scholar] [CrossRef]
  28. Santhoshkumar, P.; Vikraman, D.; Hussain, S.; Karuppasamy, K.; Kathalingam, A.; Kim, H.-S. 3D-Architectured Spherical Ce2Mo5O16 by a Time-Dependent Hydrothermal Process and Their Energy Storage Application. J. Alloys Compd. 2022, 928, 167215. [Google Scholar] [CrossRef]
  29. Yari, A.; Heidari Fathabad, S. A High-Performance Supercapacitor Based on Cerium Molybdate Nanoparticles Anchored on N, P Co-Doped Reduced Graphene Oxide Nanocomposite as the Electrode. J. Mater. Sci. Mater. Electron. 2020, 31, 13051–13062. [Google Scholar] [CrossRef]
  30. Miller, J.N.; Miller, J.C. Statistics and Chemometrics for Analytical Chemistry, 7th ed.; Pearson: Harlow, UK, 2018; ISBN 1292186712. [Google Scholar]
  31. Jayanna, B.; Nagendrappa, G.; Arunkumar; Gowda, N. Spectrophotometric Estimation of Azithromycin in Tablets. Indian J. Pharm. Sci. 2012, 74, 365. [Google Scholar] [CrossRef]
  32. Vadde, K.K.; Syrotiuk, V.R.; Montgomery, D.C. Optimizing Protocol Interaction Using Response Surface Methodology. IEEE Trans. Mob. Comput. 2006, 5, 627–639. [Google Scholar] [CrossRef]
  33. Lenth, R.V. Response-Surface Methods in R, Using Rsm. J. Stat. Softw. 2009, 32, 1–17. [Google Scholar] [CrossRef]
  34. Horowitz, S.; Trievel, R.C. Carbon-Oxygen Hydrogen Bonding in Biological Structure and Function. J. Biol. Chem. 2012, 287, 41576–41582. [Google Scholar] [CrossRef] [PubMed]
  35. Mladenović, M.; Arsić, B.; Stanković, N.; Mihović, N.; Ragno, R.; Regan, A.; Milićević, J.; Trtić-Petrović, T.; Micić, R. The Targeted Pesticides as Acetylcholinesterase Inhibitors: Comprehensive Cross-Organism Molecular Modelling Studies Performed to Anticipate the Pharmacology of Harmfulness to Humans In Vitro. Molecules 2018, 23, 2192. [Google Scholar] [CrossRef] [PubMed]
  36. Cao, X.; Ji, S.; Kuang, W.; Liao, A.; Lan, P.; Zhang, J. Solubility Determination and Correlation for Azithromycin Monohydrate and Dihydrate in Solvent Mixtures. J. Mol. Liq. 2020, 301, 112398. [Google Scholar] [CrossRef]
  37. Cavalcante, L.S.; Sczancoski, J.C.; Lima, L.F.; Espinosa, J.W.M.; Pizani, P.S.; Varela, J.A.; Longo, E. Synthesis, Characterization, Anisotropic Growth and Photoluminescence of BaWO4. Cryst. Growth Des. 2009, 9, 1002–1012. [Google Scholar] [CrossRef]
  38. Yousefi, T.; Khanchi, A.R.; Ahmadi, S.J.; Rofouei, M.K.; Yavari, R.; Davarkhah, R.; Myanji, B. Cerium(III) Molybdate Nanoparticles: Synthesis, Characterization and Radionuclides Adsorption Studies. J. Hazard. Mater. 2012, 215–216, 266–271. [Google Scholar] [CrossRef] [PubMed]
  39. Paiva, W.D.A.; Oliveira, T.M.B.F.; Sousa, C.P.; Neto, P.D.L.; Correia, A.N.; Morais, S.; Silva, D.R.; Castro, S.S.L. Electroanalysis of Imidacloprid Insecticide in Riverwaters Using Functionalized Multi-Walled Carbon Nanotubes Modified Glassy Carbon Electrode. J. Electrochem. Soc. 2018, 165, B431. [Google Scholar] [CrossRef]
  40. Wan, Y.; Liu, Q.; Fan, Y. Research on Corrosion Resistance and Formation Mechanism of Molybdate Composite Film. Crystals 2022, 12, 1559. [Google Scholar] [CrossRef]
  41. Oliveira, T.M.B.F.; Ribeiro, F.W.P.; Do Nascimento, J.M.; Soares, J.E.S.; Freire, V.N.; Becker, H.; De Lima-Netoa, P.; Correia, A.N. Direct Electrochemical Analysis of Dexamethasone Endocrine Disruptor in Raw Natural Waters. J. Braz. Chem. Soc. 2012, 23, 110–119. [Google Scholar] [CrossRef]
  42. Pogăcean, F.; Varodi, C.; Măgeruşan, L.; Stefan-van Staden, R.-I.; Pruneanu, S. Highly Sensitive Electrochemical Detection of Azithromycin with Graphene-Modified Electrode. Sensors 2022, 22, 6181. [Google Scholar] [CrossRef]
  43. Al-Hakkani, M.F.; Gouda, G.A.; Hassan, S.H.A.; Mohamed, M.M.A.; Nagiub, A.M. Environmentally Azithromycin Pharmaceutical Wastewater Management and Synergetic Biocompatible Approaches of Loaded Azithromycin@hematite Nanoparticles. Sci. Rep. 2022, 12, 10970. [Google Scholar] [CrossRef] [PubMed]
  44. Foulds, G.; Shepard, R.M.; Johnson, R.B. The Pharmacokinetics of Azithromycin in Human Serum and Tissues. J. Antimicrob. Chemother. 1990, 25, 73–82. [Google Scholar] [CrossRef] [PubMed]
  45. Guo, X.; Liu, Y.; Dong, W.; Hu, Q.; Li, Y.; Shuang, S.; Dong, C.; Cai, L.; Gong, X. Azithromycin Detection in Cells and Tablets by N,S Co-Doped Carbon Quantum Dots. Spectrochim. Acta Part A Mol. Biomol. Spectrosc. 2021, 252, 119506. [Google Scholar] [CrossRef] [PubMed]
  46. El-Yazbi, A.F.; Khamis, E.F.; Youssef, R.M.; El-Sayed, M.A.; Aboukhalil, F.M. Green Analytical Methods for Simultaneous Determination of Compounds Having Relatively Disparate Absorbance; Application to Antibiotic Formulation of Azithromycin and Levofloxacin. Heliyon 2020, 6, e04819. [Google Scholar] [CrossRef]
  47. Gaolatlhe, L.; Barik, R.; Ray, S.C.; Ozoemena, K.I. Voltammetric Responses of Porous Co3O4 Spinels Supported on MOF-Derived Carbons: Effects of Porous Volume on Dopamine Diffusion Processes. J. Electroanal. Chem. 2020, 872, 113863. [Google Scholar] [CrossRef]
  48. Mostafazadeh, R.; Karimi-Maleh, H.; Ghaffarinejad, A.; Tajabadi, F.; Hamidian, Y. Highly Sensitive Electrochemical Sensor Based on Carbon Paste Electrode Modified with Graphene Nanoribbon–CoFe2O4@NiO and Ionic Liquid for Azithromycin Antibiotic Monitoring in Biological and Pharmaceutical Samples. Appl. Nanosci. 2023, 13, 5829–5838. [Google Scholar] [CrossRef] [PubMed]
  49. De Moreno, A.H.; da Silva, M.F.C.; Salgado, H.R.N. Stability Study of Azithromycin in Ophthalmic Preparations. Braz. J. Pharm. Sci. 2009, 45, 219–226. [Google Scholar] [CrossRef]
  50. Bhimani, S.; Sanghvi, G.; Pethani, T.; Dave, G.; Airao, V.; Sharma, T.; Sheth, N.; Vaishnav, D. Development of the UV Spectrophotometric Method of Azithromycin in API and Stress Degradation Studies. Int. Lett. Chem. Phys. Astron. 2016, 68, 48–53. [Google Scholar] [CrossRef]
  51. Zannat, A.; Uddin, M.N.; Mahmud, S.T.; Mia, R.; Ahmed, T. Natural Dyes and Pigments in Functional Finishing. In Renewable Dyes and Pigments; Elsevier: Amsterdam, The Netherlands, 2024; pp. 271–287. [Google Scholar]
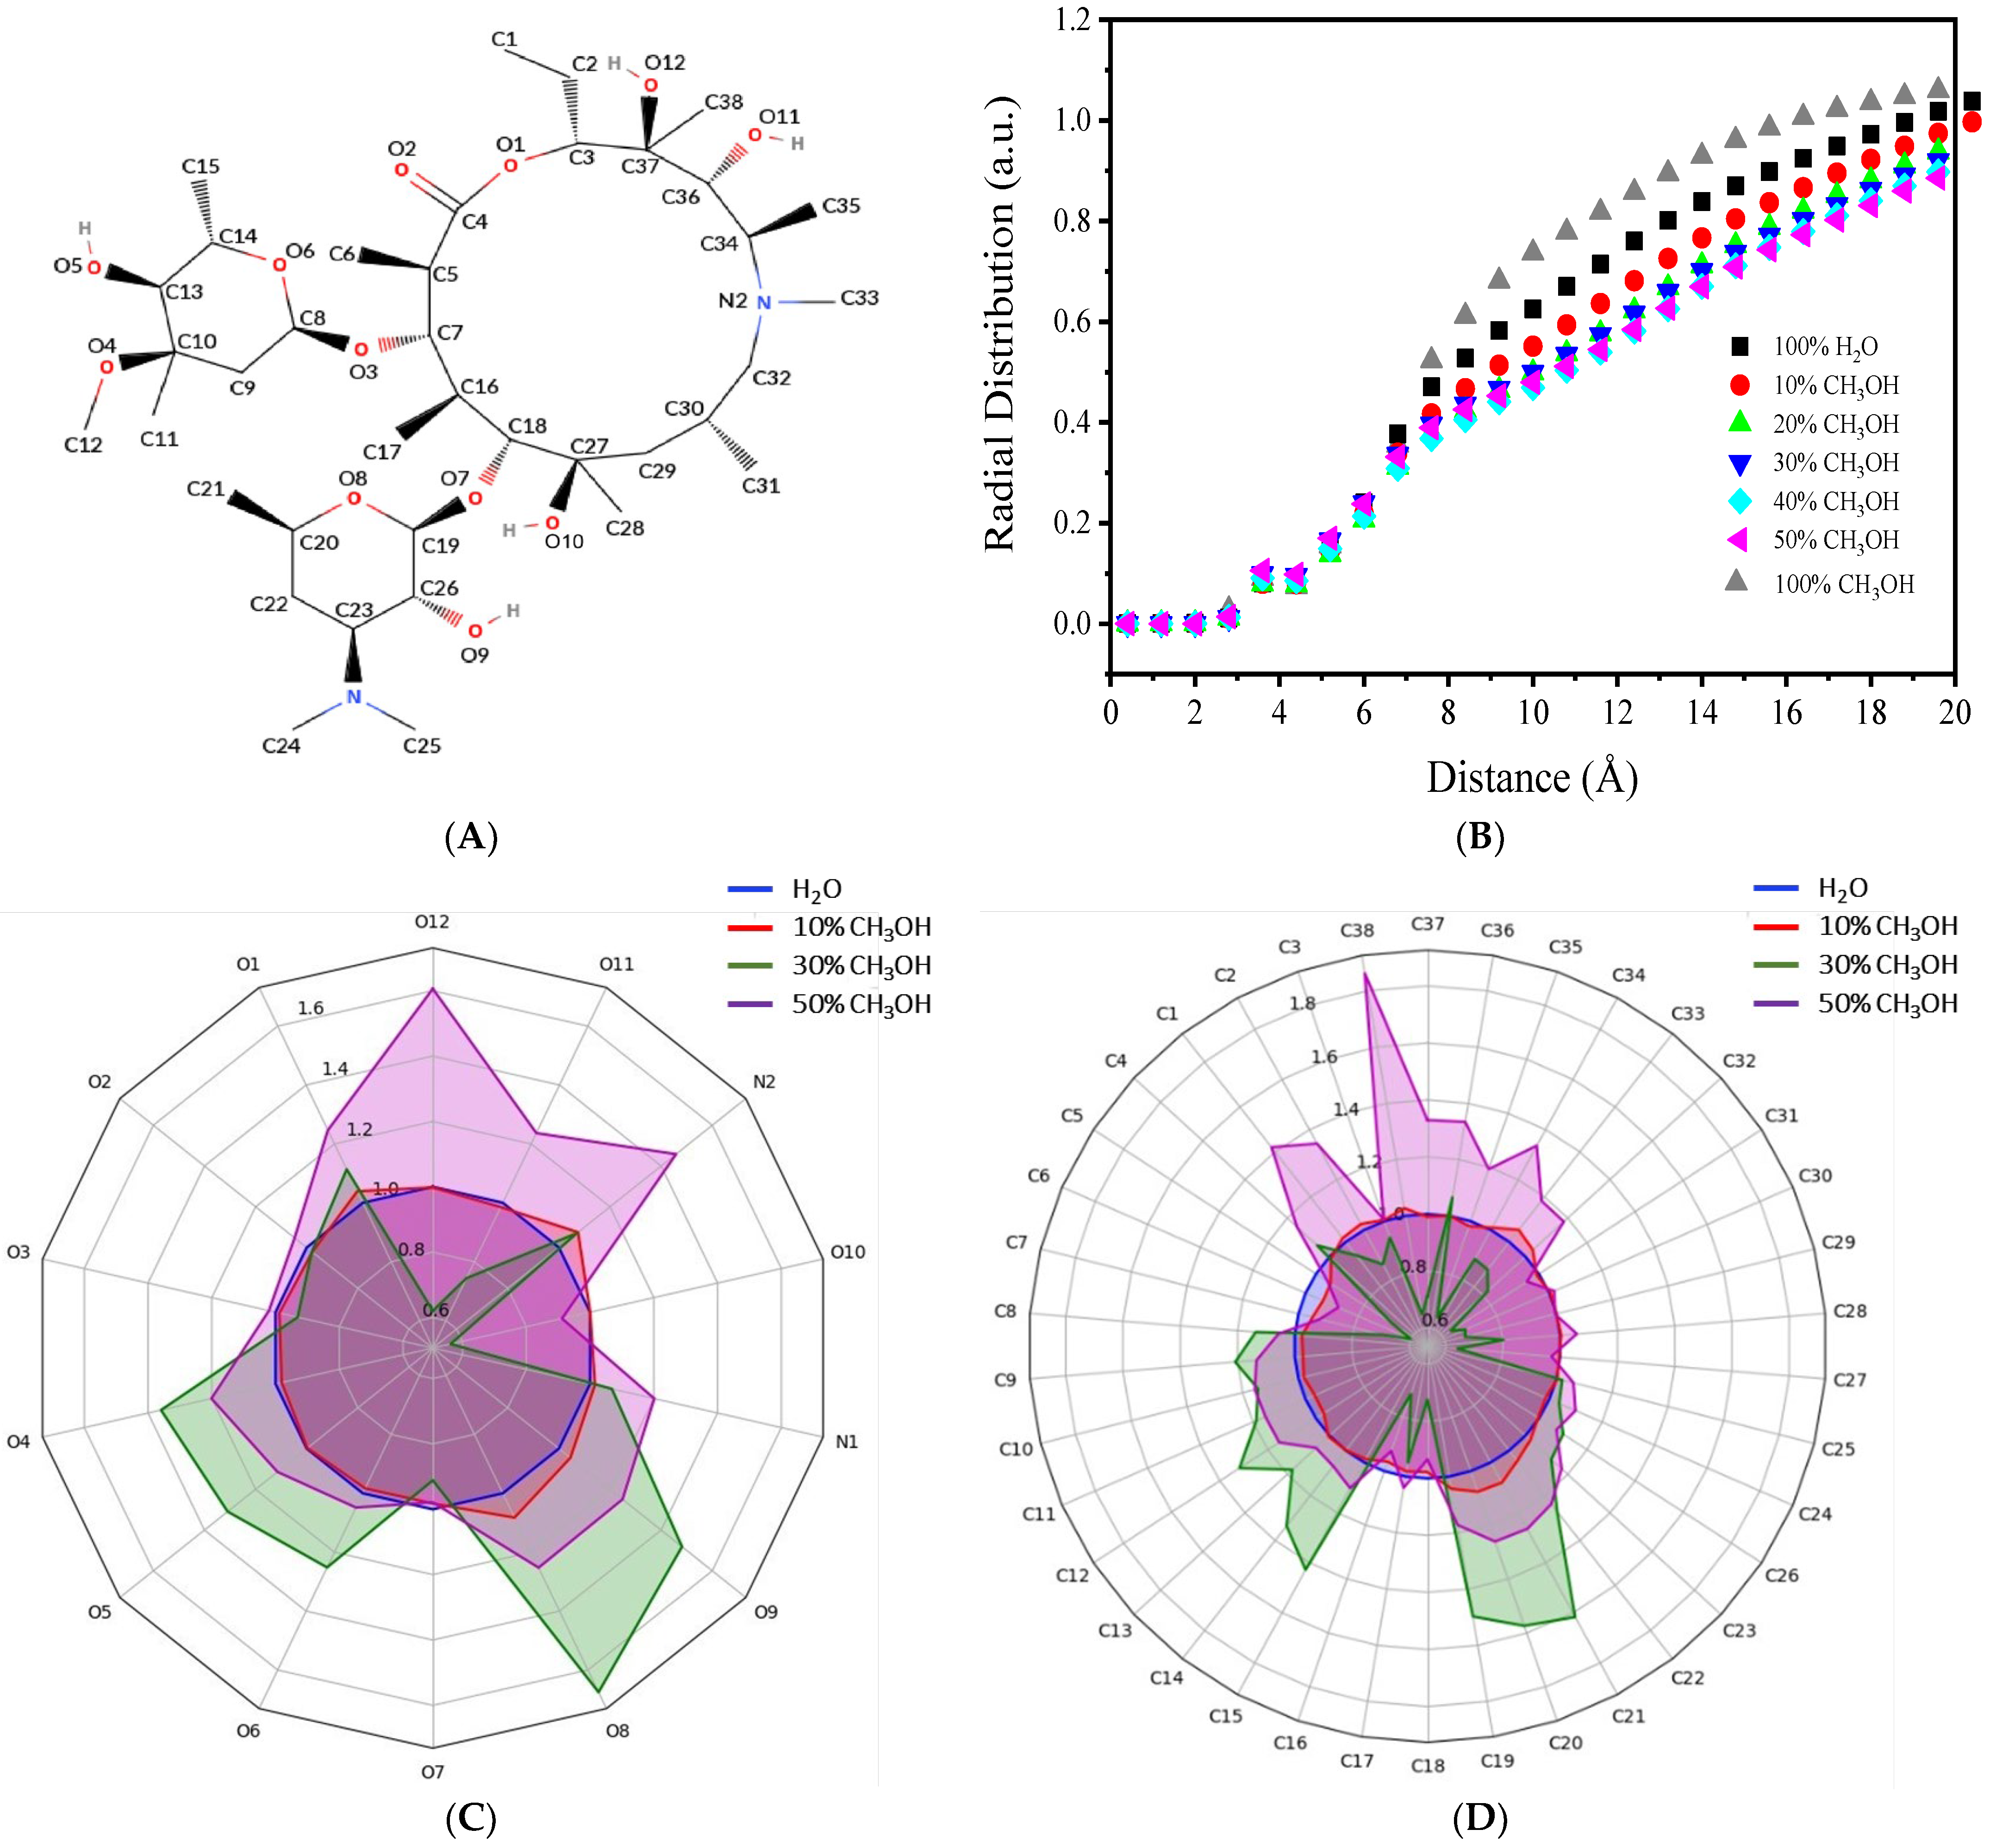
Figure 1. (A) AZM chemical structure (numbering for illustration only), followed by (B) radial distribution of H2O and CH3OH around the antibiotic molecules. Root mean square fluctuation of (C) oxygen/nitrogen and (D) carbon atoms in the AZM structure at different proportions of H2O and CH3OH.
Nanomaterials 14 00899 g001
Figure 2. Cyclic voltammograms (first cycle) recorded for 10 µM AZM at 50 mV s−1, using Ce2(MoO4)3/MWCNT-CPE as an electrochemical sensor, immersed in 1.0 mM phosphate buffer (pH = 8.0) prepared in different CH3OH/H2O combinations.
Nanomaterials 14 00899 g002
Figure 3. SEM images for Ce2(MoO4)3 after (A) 5000× and (B) 10,000× magnification, complemented by a (C) theoretical projection of the microparticles produced. The results obtained for (D) MWCNT, (E) MWCNT-CPE (10:90%, w/w), and (F) Ce2(MoO4)3-MWCNT-CPE (30:10:60%, w/w/w) were recorded after 1000× magnification.
Nanomaterials 14 00899 g003
Figure 4. (A) Raman spectrum of Ce2(MoO4)3 used to develop the electrochemical sensor. (B) FTIR spectra recorded for MWCNT-CPE (red line), Ce2(MoO4)3 (blue line), and Ce2(MoO4)3/MWCNT-CPE (green line). (C) Nyquist diagrams obtained by electrochemical impedance spectroscopy for different electrode materials, using 0.1 mM K3[Fe(CN)6] as a redox probe and a frequency range between 10 kHz and 0.1 Hz. (D) Thermogravimetric analysis performed for the as-produced Ce2(MoO4)3.
Nanomaterials 14 00899 g004
Scheme 1. Mechanistic proposal for the electrooxidation of AZM on Ce2(MoO4)3/MWCNT-CPE.
Nanomaterials 14 00899 sch001
Figure 5. (A) Cyclic voltammograms (first cycle) recorded for 10 µM AZM at 50 mV s−1, using different electrochemical sensors, immersed in 1.0 mM phosphate buffer (pH = 8.0). (B) Influence of scan rate on peak currents and peak potentials, recorded during AZM oxidation on the thermoactivated Ce2(MoO4)3/MWCNT-CPE sensor. (C) Influence of pH on electrochemical behavior of AZM on the thermoactivated Ce2(MoO4)3/MWCNT-CPE sensor.
Nanomaterials 14 00899 g005
Figure 6. Square wave voltammograms recorded for AZM (1.19–22.0 µM) with the thermoactivated Ce2(MoO4)3/MWCNT-CPE sensor immersed in 1.0 mM phosphate buffer (pH = 8.0) and applying f = 100 Hz, a = 40 mV, and ΔEs = 5 mV. The resulting analytical curve is shown as an inset.
Nanomaterials 14 00899 g006
Figure 7. (A) Pareto chart and (BD) Response surface plots obtained according to the significance level observed for the combined effect of temperature—A, UV radiation—B, and exposure to atmospheric air—C during the thermal-oxidative degradation of 10 µM AZM. The closer the color gets to the margin, the more critical the degradation is.
Nanomaterials 14 00899 g007
Table 1. Repeatability and reproducibility tests performed with 5.00 µM AZM using the electroanalytical developed method and the reference spectroanalytical methodology [31].
ProcedureIntraday Repeatability (µM)Mean
(µM)
RSD (%)Interday Repeatability (µM)Mean
(µM)
RSD (%)Reproducibility (µM)Mean
(µM)
RSD (%)
Electroanalytical5.054.971.55.054.912.85.054.983.1
4.934.835.14
4.974.794.75
4.805.12
4.794.78
4.98
5.08
5.06
5.05
4.96
Spectroanalytical4.934.992.54.934.953.04.934.971.7
5.104.765.09
5.125.154.88
4.845.12
4.834.78
5.08
5.05
5.15
4.87
4.81
Table 2. ANOVA results obtained with the thermoactivated Ce2(MoO4)3/MWCNT-CPE sensor to evaluate the thermal-oxidative stability of AZM in 1.0 mM phosphate buffer (pH = 8.0) under different conditions of temperature (A), time of exposure to (B) UV radiation, and (C) saturation with atmospheric air.
SourceDF 1SS 2MS 3F-Valuep-Value
Model93.37 × 1033.74 × 1021.81 × 1051.48 × 10−14
Linear31.74 × 1035.80 × 102281 × 1051.75 × 10−13
A10.010.011.960.22
B14.80 × 1024.80 × 1022.33 × 1057.28 × 10−13
C11.26 × 1031.26 × 1036.09 × 1056.55 × 10−14
Quadratic31.18 × 1033.92 × 1021.90 × 1055.13 × 10−12
A216.25 × 1026.25 × 1023.02 × 1053.78 × 10−13
B215.20 × 1025.20 × 1022.52 × 1055.97 × 10−13
C211.95 × 1021.95 × 1029.48 × 1046.87 × 10−12
Two-factor interaction34.50 × 1021.50 × 1027.27 × 1044.65 × 10−13
AB165.065.03.14 × 1041.08 × 10−10
AC12.372.371.15 × 1034.22 × 10−7
BC13.83 × 1023.84 × 1021.85 × 1051.28 × 10−12
Lack of fit3<0.01<0.010.150.923
Pure error20.01
Total
(model + residual)
143.37 × 10³
R20.999
1 Degree of freedom. 2 Sum of squares. 3 Mean square.
Disclaimer/Publisher’s Note: The statements, opinions and data contained in all publications are solely those of the individual author(s) and contributor(s) and not of MDPI and/or the editor(s). MDPI and/or the editor(s) disclaim responsibility for any injury to people or property resulting from any ideas, methods, instructions or products referred to in the content.