Article

The Effect of Lithium Ion Leaching from Calcined Li–Al Hydrotalcite on the Rapid Removal of Ni2+/Cu2+ from Contaminated Aqueous Solutions

1
Department of Materials Science and Engineering, National Chung Hsing University, Taichung 402, Taiwan
2
Innovation and Development Center of Sustainable Agriculture (IDCSA), National Chung Hsing University, Taichung 402, Taiwan
3
Industrial and Intelligent Technology Degree Program, Academy of Circular Economy, National Chung Hsing University, Taichung 402, Taiwan
*
Author to whom correspondence should be addressed.
Nanomaterials 2023, 13(9), 1477; https://doi.org/10.3390/nano13091477
Submission received: 15 March 2023 / Revised: 11 April 2023 / Accepted: 19 April 2023 / Published: 26 April 2023

Abstract

:
A layered double hydroxide (LDH) calcined-framework adsorbent was investigated for the rapid removal of heavy metal cations from plating wastewater. Li–Al–CO3 LDH was synthesized on an aluminum lathe waste frame surface to prepare the sorbent. The calcination treatment modified the LDH surface properties, such as the hydrophilicity and the surface pH. The change in surface functional groups and the leaching of lithium ions affected the surface properties and the adsorption capacity of the heavy metal cations. A zeta potential analysis confirmed that the 400 °C calcination changed the LDH surface from positively charged (+10 mV) to negatively charged (−17 mV). This negatively charged surface contributed to the sorbent instantly bonding with heavy metal cations in large quantities, as occurs during contact with wastewater. The adsorption isotherms could be fitted using the Freundlich model. The pseudo-second-order model and the rate-controlled liquid-film diffusion model successfully simulated the adsorption kinetics, suggesting that the critical adsorption step was a heterogeneous surface reaction. This study also confirmed that the recovered nickel and/or copper species could be converted into supported metal nanoparticles with a high-temperature hydrogen reduction treatment, which could be reused as catalysts.

Graphical Abstract

1. Introduction

Nickel and copper nanocatalysts have a wide range of catalytic applications because they are relatively low-cost and catalytically efficient [1,2,3]. Nickel plating and copper plating are frequently used industrially for the surface treatment of workpieces [4,5]. Significant quantities of nickel/copper cations are frequently present in plating wastewater. The discharged wastewater containing nickel and copper ions causes harm to the human body and the environment. The most common harm to the human body caused by nickel is contact dermatitis, which causes skin allergies and inflammation; it can also cause eczema [6,7]. Copper enters the human body mostly through drinking water [8]. Copper causes major hazards for the human body, including high blood pressure, a high respiratory rate, liver and kidney failure, and convulsions [6,7,8]. Several methods have been developed for removing heavy metal ions from wastewater, such as chemical precipitation [9], adsorption [10], ion exchange [11], membrane filtration [12], and electrodialysis [13].
Adsorption is an efficient and frequently used method for removing toxic heavy metal ions from wastewater due to its low cost and simple process compared with other technologies [14,15,16]. The general requirements for newly used adsorbents include low cost, high adsorption capacity, ease of handling, and simple design [7]. The disposal of used adsorbents containing heavy metals remains a problem, the resolution of which may impose additional costs and cause secondary pollution of the environment [17,18]. An economical and environmentally friendly approach is the recovery of nickel/copper cations from plating wastewater for use in practical applications, such as their usage as catalysts. Layered double hydroxides (LDHs) and their derivatives are materials with the potential for use in the recovery and loading of heavy metals due to their high specific surface area, the high density of their surface functional groups, and their thermal stability [19,20,21]. LDHs, which are also called hydrotalcites, are groups of clays with a layered structure comprising positively charged layers with intercalated water molecules and anions for charge balance [22,23,24]. The positively charged layers comprise monovalent, divalent, or trivalent metal cations in hydroxyl slabs. Li–Al LDHs are unique LDHs that contain the monovalent metal cation Li+, occupying some of the vacant octahedral sites of gibbsite (Al(OH)3) sheets to form positively charged layers [25,26,27]. As shown in the authors’ previous work [28], the Li–Al–CO3 LDH has a typical chemical formula of Li0.33Al0.67(CO3)0.17(OH)2·mH2O. The authors’ previous studies [29,30] prepared calcined Li–Al LDH loaded with Ni and/or Cu nanoparticles and used it in the catalytic reaction of ethanol steam, reforming to produce hydrogen. However, the process of quickly absorbing Ni2+/Cu2+ from wastewater by the calcined Li–Al LDH is still unclear. It is this process that is investigated in this study.
The calcination of LDHs is one of the methods for modifying their properties and improving their performance in adsorption [31,32,33]. The calcination of LDHs removes interlayer water molecules and anions, as well as the hydroxyl groups, resulting in the loss of the layered structure [34]. The calcination of LDHs at high temperatures typically takes several hours (2–6 h at 400–550 °C) [35,36,37,38,39,40,41]. Furthermore, the heating of LDH powder uniformly is challenging, due to its low thermal conductivity. To improve the efficiency of the removal of heavy metal ions from wastewater, a large amount of calcined LDH powder is put into the water. The adsorbents may aggregate during adsorption, reducing the efficiency of adsorption and retrieval [42]. Powdered sorbents must be separated from the treated wastewater by centrifugation or precipitation after the adsorption of heavy metal ions. These processes are usually lengthy and consume considerable energy. Therefore, to address these problems, this research focused on heating the LDHs uniformly by coating them on a metallic structured frame surface. Aluminum lathe waste, an industrial residue generated in the processing of aluminum alloys on lathes, was used as the structured frame for coating the Li–Al LDH films.
Possible mechanisms for recovering heavy metal ions by calcined LDHs include surface complexation, precipitation, isomorphous substitution, and coprecipitation [40,41,43]. Sun et al. [40] posited that the metal cations (Ni2+, Cu2+, and Zn2+) first precipitated on the surface of the adsorbent (calcined Mg–Al LDH) to form hydroxides, which then participated in the process by which the adsorbent reconstructs the LDH structure through isomorphous substitution. Yang et al. [41] proposed possible mechanisms for removing Ni2+/Cu2+ by calcined Mg–Al LDH-modified palygorskite adsorbents through surface complexation, coprecipitation, and isomorphous substitution. It is well known that calcined LDH may regenerate into an LDH structure when exposed to water and anions [34]. The regeneration process usually takes several hours [44,45] as anions and water molecules enter the interlayer, reconstructing the LDH-layered structure. Wong and Buchheit [45] found that Li–Al LDH calcined at 220 °C had to be immersed for five days to reconstruct the LDH structure completely. Rocha et al. [44] found that Mg–Al LDH calcined at 550 °C or below took 24 h of rehydration to complete reconstruction. The isomorphous substitution of metal cations into LDHs also takes several hours [46,47]. Kim et al. studied the isomorphous substitution of divalent metal ions into LDH, finding that it took six hours to substitute ~27% of the Mg2+ into Mg–Al LDH using Co2+ [46]. Richardson and Braterman [47] found that the substitution of Ni2+/Co2+/Zn2+/Cu2+/Mn2+ into Mg–Al LDH, which had M(Ⅱ):Mg atomic ratios ranging from 0.61 to 1.25, took five days. However, based on the adsorption experiments of Sun et al. [40] and Yang et al. [41], the removal of Ni2+/Cu2+ took a relatively short time (30 min) before reaching their removal equilibrium capacity, indicating that the reconstruction of the calcined LDH and the isomorphous substitution of metal cations may not be the controlled mechanisms of the quick metal cation recovery.
The present research investigated the effects of LDH calcination temperature and reaction conditions on recovery efficiency to elucidate the mechanism of the quick uptake of heavy metal cations from wastewater. Moreover, instead of conventionally leaching Li+ in strong acids with the addition of a reducing agent from spent lithium-ion batteries [48], this research investigated the novel approach of Li+ leaching in weak acid (pH 4–6) without using a reducing agent for cation recovery.

2. Materials and Methods

2.1. Synthesis of Li–Al–CO3 LDH on Aluminum Lathe Waste

An industrial 6061 aluminum lathe waste was obtained from Fullchamp Technologies Co., Ltd., Nantou County, Taiwan. Figure 1a,b show photographs of the aluminum lathe waste. The aluminum lathe waste was ultrasonically cleaned in acetone to remove oil and debris from its surface. A 1000 mL aqueous solution that contained Al3+ and Li+, with a Li/Al molar ratio of two, was prepared by adding strips of aluminum foil to a 0.06 M LiOH aqueous solution. This solution was magnetically stirred at 50 °C for 30 min and purged with highly pure Ar gas to reduce the dissolution of contaminating CO2. It was then filtered through filter paper to obtain a clear solution. A 10 g mass of aluminum lathe waste was dipped in the solution at room temperature for 2 h to form the Li–Al–CO3 LDH film coated on the aluminum lathe waste surface. The aluminum lathe waste, coated with Li–Al–CO3 LDH, was naturally air-dried. The LDH was then calcined in the air at various temperatures (150–500 °C) for 1 h to obtain the calcined LDH. Herein, the sample of 150 °C-calcined LDH was denoted as T150; and the samples of 200 °C, 300 °C, 400 °C, and 500 °C-calcined LDH were denoted as T200, T300, T400, and T500, respectively.

2.2. Ni2+ and Cu2+ Uptake from Aqueous Solutions

NiSO4·6H2O (99%, Choneye Pure Chemicals, Miaoli County, Taiwan) and CuSO4·5H2O (98%, Choneye Pure Chemicals, Miaoli County, Taiwan) were used to prepare the aqueous solutions that contained Ni2+ and Cu2+, respectively. Adsorption experiments were performed by adding the sorbent (the sorbent coated on lathe waste, as shown in Figure 1a) to the aqueous solutions that contained Ni2+/Cu2+ at 25 °C with stirring at 600 rpm. The concentrations of the cations were measured using an inductively coupled plasma optical emission spectrometer (ICP-OES; Agilent 5110 ICP-OES, Santa Clara, CA, USA). The measurements were repeated three times. The removal efficiency (R) was calculated as follows:
R = ((C0 − Ce)/C0) × 100%
where C0 (mg/L) and Ce (mg/L) are the initial and equilibrium concentrations of the metal cations, respectively. The adsorption capacity (Q(t)) was calculated as follows:
Q(t) (mg/g) = ((C0 − Ce) × V)/m
where V (L) is the solution volume and m (g/L) is the adsorbent dosage.
Moreover, aqueous solutions containing Ni2+ were used to study the effect of LDH calcination temperature on the removal efficiency of heavy metal cations. Samples of 1 and/or 2 g of LDH/aluminum lathe waste were calcined at various temperatures for 1 h for use in each adsorption experiment. Adsorption was performed in 100 mL aqueous solutions for 1 h with an initial Ni2+ concentration of 75 mg/L. To investigate the adsorption kinetics, calcined LDH was added to 400 mL of aqueous solution with an initial Ni2+/Cu2+ concentration of 75 mg/L. Sample solutions were taken at intervals to measure the Ni2+/Cu2+ concentration. Adsorption isotherm studies were performed in 100 mL aqueous solutions with initial Ni2+/Cu2+ concentrations of 75, 120, 240, 360, 480, and 600 mg/L. The effect of solution pH on the formation of the Ni/Cu products was studied. T400 was used to investigate the effect of solution pH on Ni/Cu products. The products are denoted as Ni-pH4.0, Ni-pH6.3, Ni-pH7.5 and Cu-pH3.9, Cu-pH5.5, and Cu-pH7.5, indicating the metal ions in the aqueous solution and the initial solution pH. A 500 mL volume of an aqueous solution that contained 75 mg/L of Ni2+/Cu2+ was added dropwise to aqueous NaHCO3 or H2SO4 to adjust its initial solution pH. Recovery was performed with very low sorbent/aqueous solution ratios to minimize the variation of the solution pH. Li–Al–CO3 LDH was synthesized on aluminum sheets measuring 20 × 20 × 2 mm3 by the method that was described in Section 2.1 for use in experiments. The calcined LDH/aluminum sheets were used to recover Ni2+/Cu2+ for one hour. The used calcined LDH, after recovering Ni2+/Cu2+, was recycled to be prepared as nano-catalysts. For this purpose, the used calcined LDH was reduced with highly pure H2 at a 100 mL/min flow rate in a tubular furnace at 500 °C.

2.3. Characterization

A field emission scanning electron microscope (FE-SEM; Zeiss Ultra Plus, Oberkochen, Germany) was used to observe the surface morphologies of the samples. Prior to the SEM observation, the samples were coated with platinum. The surface elemental composition was determined using an energy-dispersive X-ray spectroscope (EDS; Oxford X-Max 50 mm2, Oxford, UK) attached to the SEM with an accelerating voltage of 7 kV. A field emission transmission electron microscope (FE-TEM; FEI Tecnai G2 F20, Hillsboro, OR, USA) was used to observe the cross-sectional microstructures of the samples. The TEM also obtained the high-angle annular dark field (HAADF), high-resolution transmission electron microscopy (HRTEM) images. Specimens for TEM observation were prepared using a focused ion beam (FIB; Hitachi NX2000, Tokyo, Japan). A carbon film was deposited on each sample before FIB bombardment to protect the sample’s surface from damage. The crystallographic structures of the samples were determined by glancing angle X-ray diffraction (GAXRD; Bruker D8 Advance ECO, Darmstadt, Germany) with a glancing angle of 0.5° using Cu Kα1 (1.5406 Å) radiation. Fourier-transform infrared (FTIR; PerkinElmer Spectrum 65 FT-IR spectrometer, Norwalk, CT, USA) spectra were obtained in the wavenumber range 450–4000 cm−1 with a resolution of 4 cm−1 and eight scans, using the attenuated total reflection (ATR) method. X-ray photoelectron spectroscopy (XPS; ULVAC-PHI PHI 5000 VersaProbe, Kanagawa, Japan) was used to detect the chemical states of surface elements. Prior to the XPS examination, the surface of each sample was bombarded with Ar ions for 6 s to remove surface-adsorbed gas. To investigate the surface properties of the as-prepared and calcined LDH, the water contact angle was measured using a contact angle analyzer (First Ten Angstroms FTA-2000, Portsmouth, VA, USA). Surface pH was measured using a flat surface pH electrode (Hamilton FlaTrode, Bonaduz, Switzerland). For each pH measurement, 0.1 mL of deionized water was dropped onto the sample surface, to which a pH electrode was attached. The zeta potential of LDH was compared with that of the gibbsite to determine the role of Li+. The Li–Al LDH powder was scraped from the aluminum substrates. The extra pure reagent-grade gibbsite powder was purchased from Choneye Pure Chemicals, Miaoli County, Taiwan. The Li–Al LDH, gibbsite, and their calcination products were added to pH 5.0 weakly acidic water (titrated with sulfuric acid) to measure the zeta potential. The calcination of Li–Al LDH and gibbsite was carried out at 400 °C for 1 h. The calcined gibbsite herein was denoted as C-gibbsite. Additional T400 powder was added to aqueous solutions of NiSO4/CuSO4 (concentrations of Ni2+/Cu2+ = 75 mg/L), denoted as T400-Ni and T400-Cu, respectively. The ratio of powder to the aqueous solution was 0.01 g/20 g. The zeta potential was measured using a Litesizer 500 (Anton Paar, Graz, Austria) with the electrophoretic light scattering (ELS) method, which measures the speed of particles as an electric field is applied. The zeta potential was measured at 1, 10, and 60 min after adding the powder to the aqueous solution.

3. Results and Discussion

3.1. Observation of the Prepared Adsorbent Material

Figure 1 presents macroscopic and microscopic views of the LDH adsorbent material. Figure 1a shows a photograph of a pile of industrial aluminum lathe waste, from which the substrates for forming Li–Al–CO3 LDH were obtained. Figure 1b displays an enlarged view of a strip of aluminum lathe waste that had been coated with Li–Al–CO3 LDH. Figure 1c shows the SEM surface morphologies of the Li–Al–CO3 LDH that was coated on the aluminum lathe waste substrate. The Li–Al–CO3 LDH had vertical platelet-like structures and densely covered the surface of the aluminum substrate. The inset in Figure 1c displays a high-magnification image of the LDH platelets. The platelets were between 1 and 2 μm long and about 20–40 nm wide. Figure 1d displays a cross-sectional TEM image of the LDH. The LDH platelets were about 3 μm high and had a bottom layer of precursors (~0.5 μm thickness attached to the aluminum substrate).

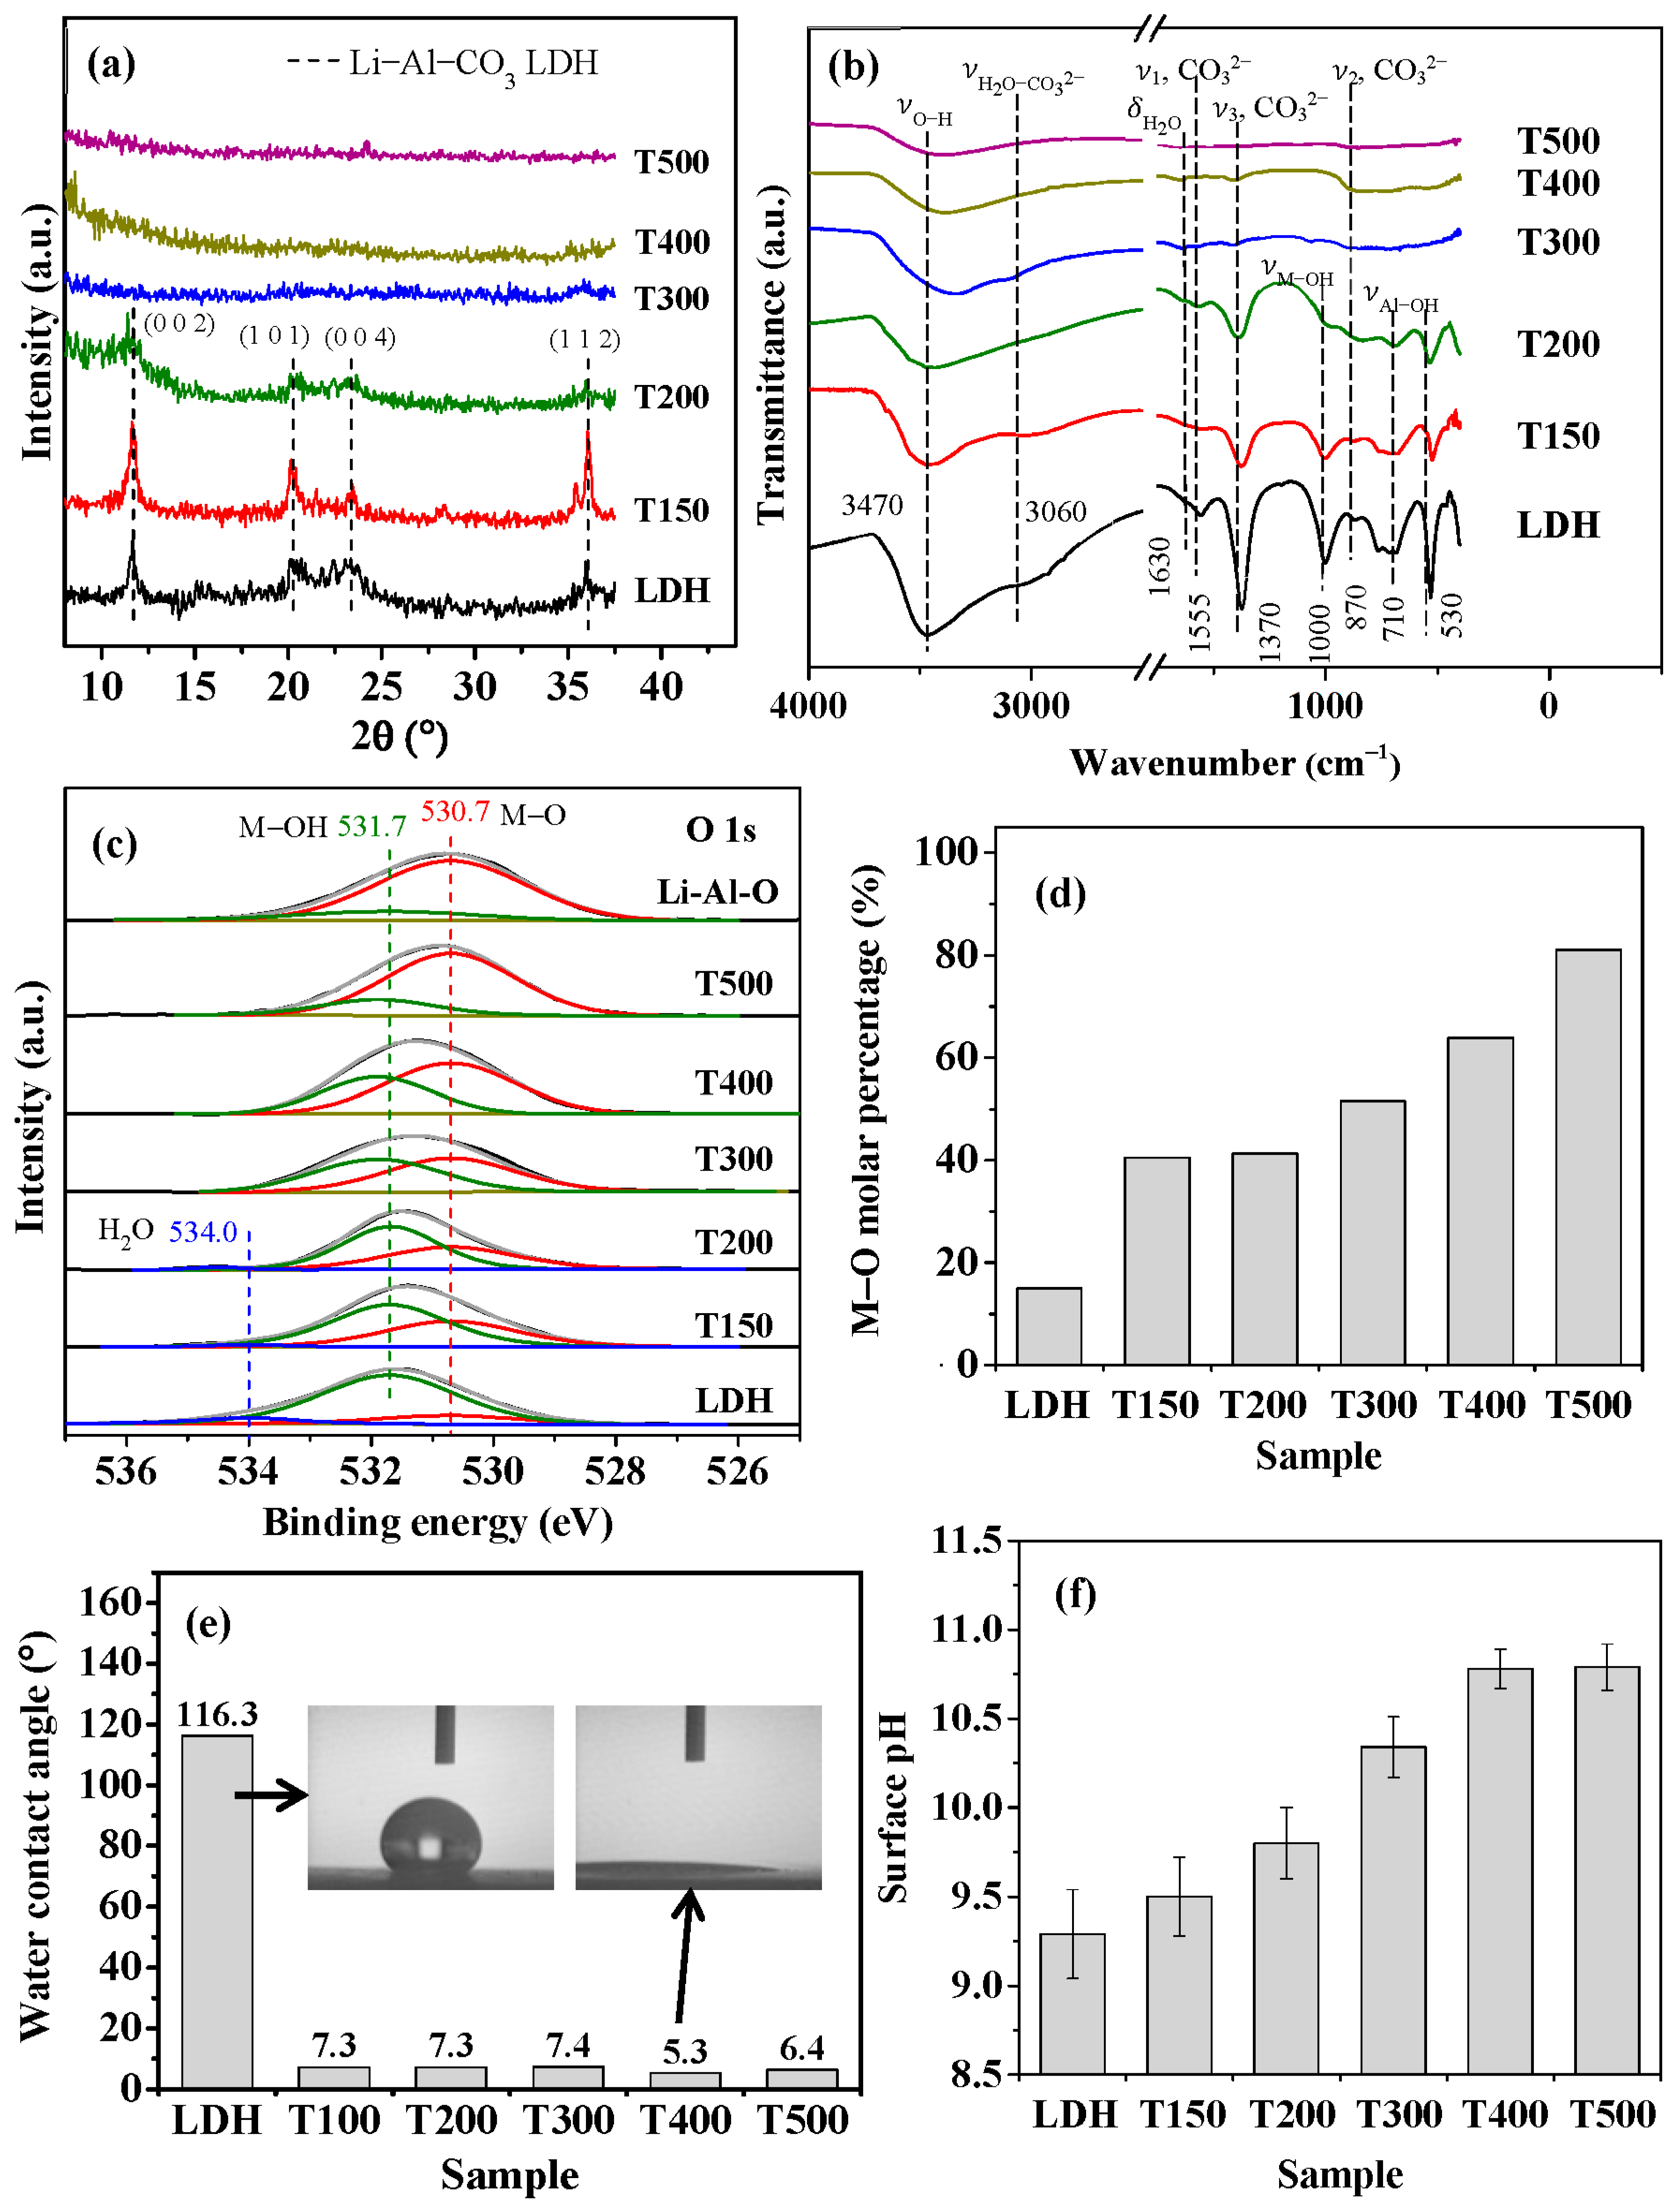
3.2. The Surface Characterization of Calcined LDH

Figure 2 displays the surface characteristics of the LDH and calcined LDH samples. Figure 2a shows the XRD patterns of the samples. As shown in Figure 2a, the pristine LDH and T150 exhibit a prominent Li–Al–CO3 LDH (002) characteristic peak at 2θ = 11.65°; the characteristic peaks at planes of (101), (004), and (112) are also shown. The characteristic peaks of Li–Al–CO3 LDH following calcination at 200 °C were less intense than that of the pristine LDH and T150. These characteristic peaks disappeared with calcination at a temperature above 300 °C, and there was no apparent other peak formation, indicating that the structure had transformed into an amorphous form. The Li–Al LDH was transformed into an amorphous mixed-metal oxide phase by calcination at 300–500 °C [45,49,50]. Figure 2b displays the FTIR spectra of the LDH and calcined LDH samples. In the spectrum of the LDH (bottom curve) in Figure 2b, the broad transmission band at ~3470 nm−1 arises from the H-bonding stretching vibration of the O–H groups (νO–H) in the metal hydroxide layers [51]. The intensity of this band decreases as the calcination temperature increases significantly above 300 °C. The decrease in the intensity of the νO–H band with increasing temperature indicates that calcination destroyed the metal hydroxide layers of LDH. The results supported that the intensity of M–OH (νM–OH = ~1000 cm−1) and Al–OH groups (νAl–OH = ~700 cm−1) decreased with increasing calcination temperature. The band corresponding to the bending mode of interlayer water molecules (δH2O) at 1630 nm−1 [52] disappears upon calcination above 300 °C, indicating the escape of water molecules from the interlayers at high temperatures. Similarly, the bands at ~1550, 1370, and 870 cm−1, which characterize the asymmetric stretching modes of CO32− [52], weaken as the calcination temperature increases and disappear upon calcination above 300 °C, revealing the removal of the intercalated CO32− groups. The FTIR examination results showed that the structure of LDH was significantly changed by calcination at temperatures above 300 °C.
Figure 2c displays XPS O 1s spectra of the LDH and calcined LDH samples. A calcined LDH sample calcined at 500 °C for 3 h (herein denoted as Li–Al–O) was used to identify the O 1s state of metal oxide. The O 1s XPS spectra in Figure 2c peak at 530.7, 531.7, and 534.0 eV, which are attributed to the metal–oxygen bonds (M–O), hydroxyl groups (–OH), and adsorbed water (H2O), respectively [53,54,55]. The LDH (the bottom curve in Figure 2c) exhibits a major peak of the M–OH bond at a binding energy of 531.7 eV. The Li–Al–O sample (top curve) yields a major peak associated with the M–O bond at a binding energy of 530.7 eV, indicating that calcination at 500 °C for 3 h can convert almost all M–OH bonds to M–O bonds. The H2O in the calcined LDH is insignificant in calcination above 300 °C. Thus, the LDH calcined for one hour at various temperatures had various M–OH and M–O compositions. Figure 2d plots the M–O molar percentages of the various calcined LDH samples, as determined from the XPS spectra in Figure 2c. The M–O molar percentage increased with temperature, rising from ~15% for LDH to ~81% for T500. The Li–Al–O had an M–O molar percentage of ~85% (not shown in Figure 2d). The evolution of surface hydroxyl groups (denoted as –OH) to oxygen species (denoted as –O–) during calcination can be expressed as the following dehydration reaction [50,56]:
–OH + –OH → –O– + H2O
Figure 2e shows the water contact angles of the LDH and calcined LDH samples. The water contact angle was significantly reduced from ~116° for pristine LDH to less than 10° by calcination at various temperatures, especially that of T400 being reduced to 53°. The inset in Figure 2e shows the significant difference in water contact angle between the pristine LDH and calcined LDH T400, confirming that calcination treatment changed the LDH film from hydrophobic to hydrophilic. Figure 2f shows the surface pH values of the LDH and calcined LDH. The pristine LDH had a surface pH of ~9.5. As the calcination temperature increased, the surface pH gradually increased. The surface pH reached ~10.75 at a calcination temperature of 400 °C, with no noticeable increase to 500 °C.

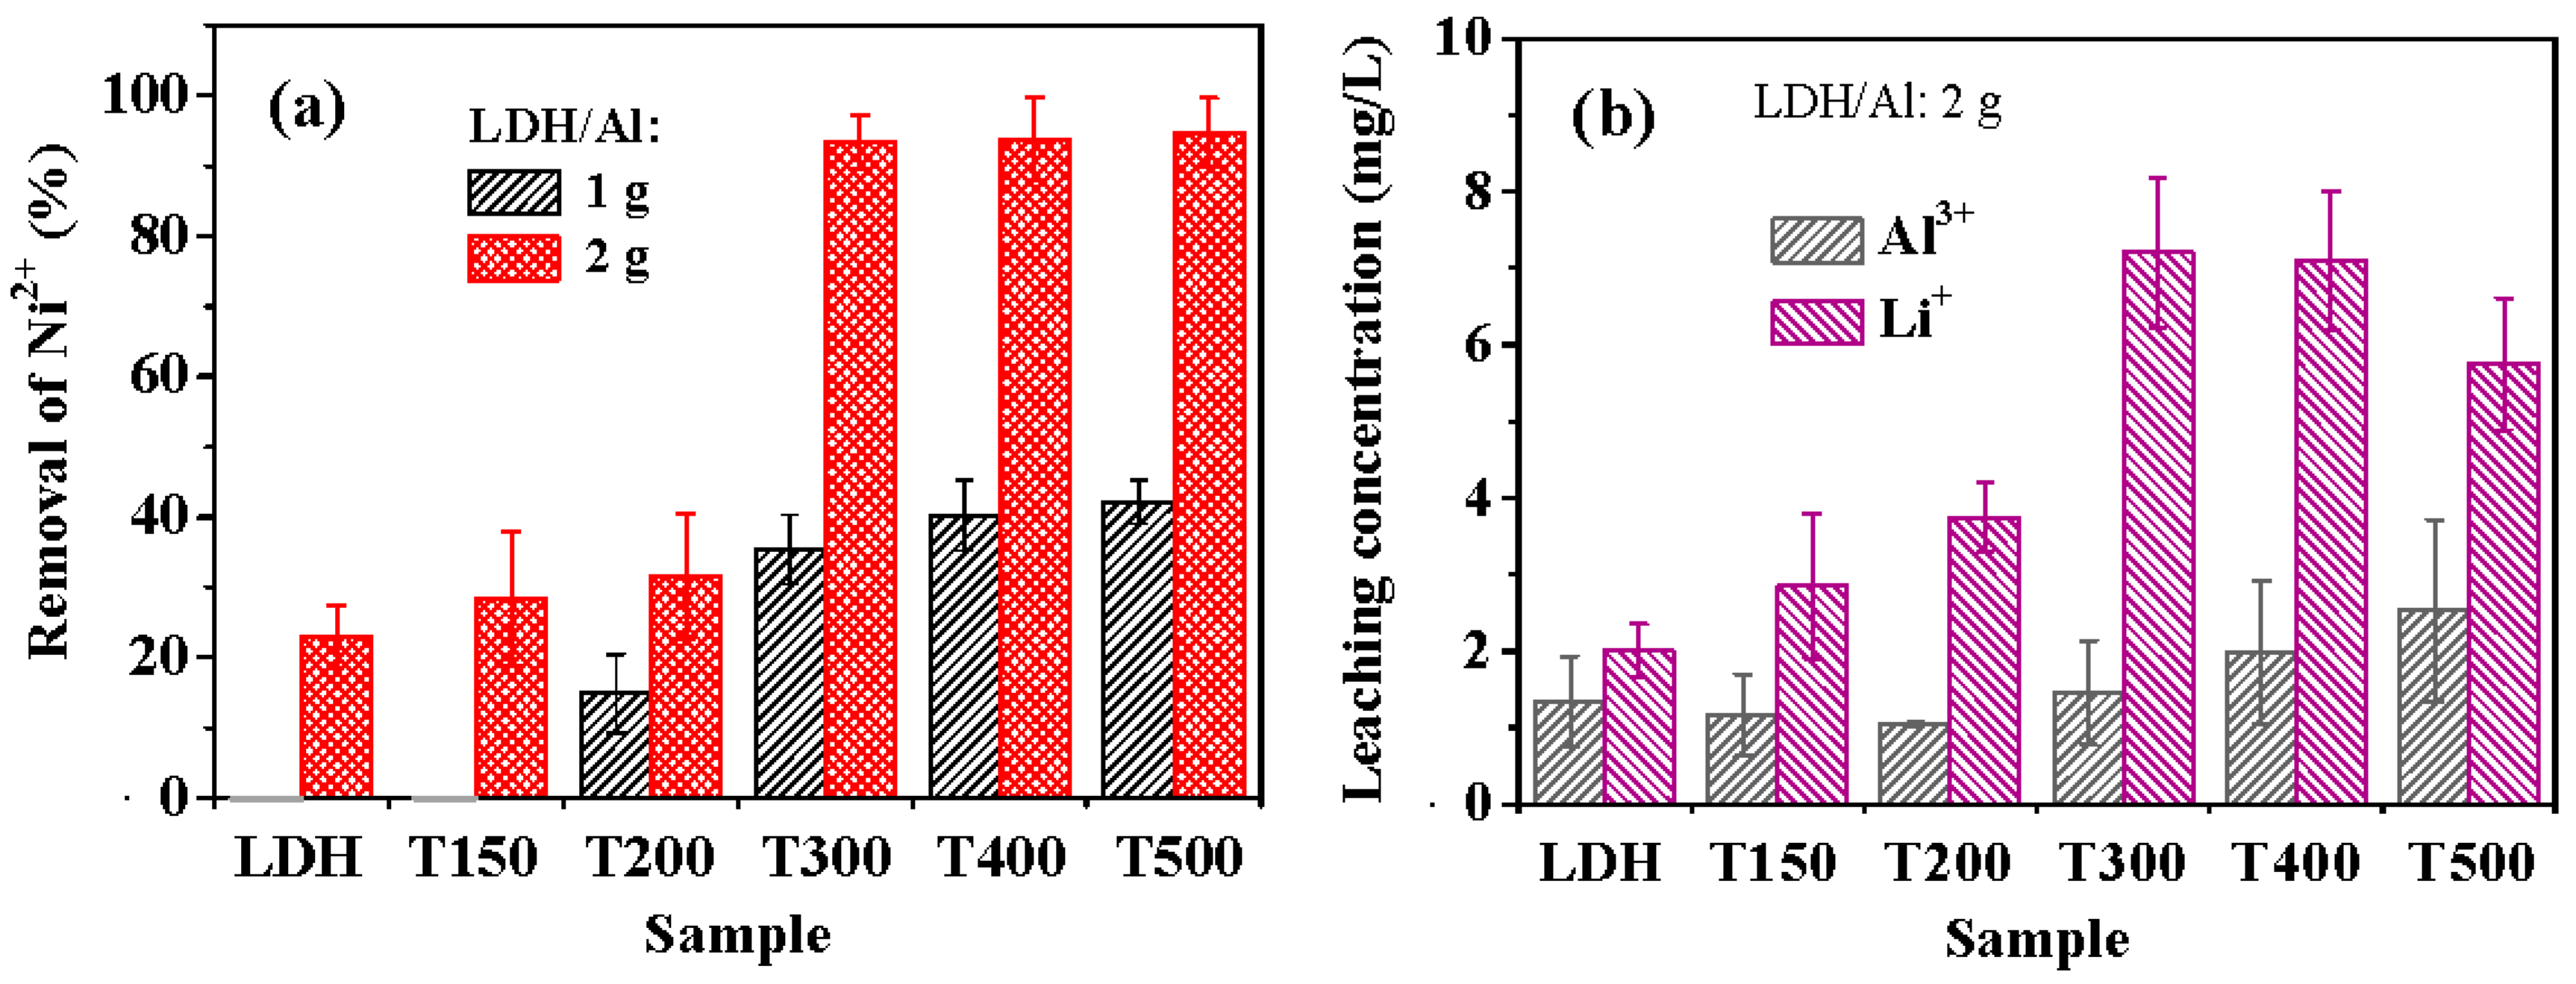
3.3. The Effect of LDH Calcination Temperature on Removal Efficiency

Figure 3a compares the Ni2+ removal efficiencies of the LDH and calcined LDH samples. As shown in Figure 3a, when 1 g of LDH/aluminum lathe waste was used, neither pristine LDH nor T150 had any capacity to remove Ni2+. The calcined LDH exhibited an enhanced ability to recover Ni2+ as the calcination temperature increased. As the calcination temperature increased to 300 °C, the removal efficiency was significantly increased to ~35%. At calcination temperatures of 300–500 °C, the removal efficiency of Ni2+ increased as the temperature increased, reaching ~42% at 500 °C. Using 2 g of LDH/aluminum lathe waste yielded a much higher removal efficiency of Ni2+ than 1 g at each calcination temperature, significantly above 300 °C. The Ni2+ removal efficiencies obtained using 2 g of LDH/aluminum lathe waste that had been calcined at 300, 400, and 500 °C exceeded 93%. LDH samples calcined at 300, 400, and 500 °C varied negligibly in recovery efficiency.
Figure 3b plots the leaching concentrations of Al3+ and Li+ of the LDH and calcined LDH samples during the recovery of Ni2+. As shown in Figure 3b, the LDH and calcined LDH samples had leaching concentrations of Al3+ of less than 2.5 mg/L, indicating that the leaching of Al3+ was insignificant. The Li+ leaching concentration generally increased with calcination temperature, from ~2.0 mg/L for LDH to ~7.2 mg/L for T300 and T400; it decreased to ~5.7 mg/L for T500. Lee and Jung [57] confirmed that the amount of Li+ released from calcined Li–Al LDH in pure water significantly increased with LDH calcination temperature above 300 °C. Based on first-principles calculations by Zhang et al. [58], the Li–O bonds in Li–Al LDH become weaker as the calcination temperature increases above ~200 °C. The release of Li+ in water is evidence of the weakening of the Li–O bonds. The release of Li+ by the breakage of Li–O bonds in water can be expressed as follows:
–O–Li + H2O → –O–H + OH(in solution) + Li+(in solution)
The reaction of Equation (4) generates OH, increasing the solution pH. As previously shown, Figure 2f and Figure 3b confirmed the reaction of Equation (4) from left to right concerning the surface pH and the Li+ leaching to increase the Li+ concentration in the aqueous solution. As there are heavy metal cations in the aqueous solution, the oxygen species attract heavy metal cations as follows:
–O–Li + Me2+(in solution) + H2O → –O–Me–OH + H+(in solution) + Li+(in solution)
Heavy metal cations bonded to surface oxygen species can electrostatically attract OH in aqueous solutions, possibly forming hydroxides. Figure 4 shows SEM surface morphologies following the removal of Ni2+ for 1 min using the LDH and calcined LDH samples. The LDH, T150, and T200 (Figure 4a–c) had bare reaction products on the platelet surfaces. In contrast, T300 and T400 (Figure 4d,e) had dense cross-linked meshwork structures that formed on the platelet surfaces. For T500 (Figure 4f), the reaction products were irregular aggregations on the platelet surfaces. LDH that had been calcined at 400 °C was used in the subsequent studies. The calcination of LDH reduced its mass. The calcined LDH accounted for approximately 0.04 g per 2 g of the T400 calcined LDH/Al framework.

3.4. The Kinetics of Ni2+/Cu2+ Recovery

The recovery of Ni2+/Cu2+ using T400 was performed to study its adsorption kinetics. The experimental data were fitted using four typical adsorption kinetic models: pseudo-first-order (Equation (6)), pseudo-second-order (Equation (7)), intraparticle diffusion (Equation (8)), and liquid film diffusion (Equation (9)), as follows [59,60]:
Pseudo-first-order model:    Q(t) = Qe(1 − exp(−k1t))
Pseudo-second-order model:    Q(t) = k2Qe2t/(1 + k2Qet)
Intraparticle diffusion model:    Q(t) = kidt0.5 + C
Liquid film diffusion model:    ln(1 − (Q(t)/Qe)) = −kflt + C
where t (min) is the adsorption time; Q(t) (mg/g) is the adsorption amount at time t; Qe (mg/g) is the equilibrium adsorption capacity; k1 (min−1), k2 (g/mg/min), kid (mg/g/min0.5) and kfd (min−1) are the rate constants of pseudo-first-order, pseudo-second-order, intraparticle diffusion, and liquid film diffusion models, respectively; C (mg/L) is a constant that is related to the thickness of the boundary layer.
Table 1 lists the kinetic parameters of the removal of Ni2+ and Cu2+, and the fitting results following the kinetic parameters are plotted in Figure 5. Figure 5a plots the variation of Ni2+ concentration with time. The concentration of Ni2+ decreased rapidly within the first ten minutes from the initial 75 mg/L to ~35 mg/L. Subsequently, it decreased slowly to ~8 mg/L at 60 min and 0.5 mg/L at 300 min. The inset of Figure 5a plots the solution pH during Ni2+ removal. The initial solution pH was ~6.3. As the T400 came into contact with the aqueous solution, the pH rose rapidly to 7.1. The solution pH then declined slowly to 6.7 in 60 min before staying between 6.6 and 6.8 over 5 h. It reveals the capability of the calcined LDH to rapidly raise the solution pH at the initial stage of recovery. As stated in Equation (4), calcined LDH rapidly forms OH in aqueous solution, which increases the solution pH rapidly. This reveals the ability of calcined LDH to rapidly increase the solution pH in the initial stage of recovery. During the later stage of recovery, Ni2+ may be condensed with hydroxide ions, as the reaction of Equation (5) occurred, causing the solution pH to drop. Figure 5b–d plot the fitted curves of the adsorption kinetics of Ni2+. As shown in Figure 5b, the pseudo-second-order model (R2 = 0.9979) fits the experimental data better than the pseudo-first-order model (R2 = 0.9779), suggesting that the removal of Ni2+ is a chemisorption process [61,62]. To identify the rate-controlling steps of the removal process, intraparticle diffusion (Figure 5c) and liquid film diffusion (Figure 5d) models are used. The diffusion of adsorbates can generally characterize the adsorption of adsorbates through a solid–liquid interface through the external boundary layer formed on a solid surface (liquid film diffusion) or the diffusion of adsorbates within the adsorbent to adsorbed sites (intraparticle diffusion) or a combination of the two. In Figure 5c, simulated by the intraparticle diffusion model, the adsorption process can be divided into two stages. In the first stage, the adsorption rate (kid, 1 = 20.03 mg/g/min0.5) is relatively high. This stage corresponds to the diffusion occurring on the outer surface [62,63], and this stage has a rapid diffusion rate. The second stage, with a low adsorption rate (kid, 2 = 2.195 mg/g/min0.5), corresponds to the diffusion of Ni2+ inside the calcined LDH [63,64]. This stage yields a low R2 of 0.6591, indicating that the intraparticle diffusion does not describe the diffusion process well. The liquid film diffusion model in Figure 5d fits better than the intraparticle diffusion model, with an R2 of 0.9668 and a small y-intercept of −0.86, showing that liquid film diffusion is the rate-controlling step.
Figure 6 presents the adsorption kinetics of Cu2+ removal by T400. Figure 6a plots the Cu2+ concentration against time. The concentration of Cu2+ decreased rapidly within the first 5 min from the initial 75 mg/L to ~25.9 mg/L. Subsequently, it decreased relatively slowly to ~3 mg/L at 60 min and 0.3 mg/L at 300 min. The inset in Figure 6a plots the solution pH during Cu2+ removal. The initial solution pH was ~3.9. As the T400 came into contact with the aqueous solution, the solution pH rose rapidly to 5.4 and remained between 5.3 and 5.5 for 120 min. Between 120 and 300 min, the solution pH increased linearly with time from 5.4 to 6.5. Figure 6b–d plot fitted curves for the kinetics of the adsorption of Cu2+. As shown in Figure 6b, the pseudo-second-order model fits the experimental data better than the pseudo-first-order model. The liquid film diffusion model in Figure 6d fits better than the intraparticle diffusion model in Figure 6c, with an R2 of 0.9649 and a small y-intercept of −1.46, indicating that liquid film diffusion is the rate-controlling step.
The concentrations of Li+ and Al3+ during the recovery of Ni2+/Cu2+ were measured to determine the leaching of T400 as a function of time. Figure 7 plots the leaching concentrations of Li+ and Al3+ during the Ni2+ (Figure 7a) and Cu2+ (Figure 7b) recovery. Figure 7a shows that the Li+ concentration increased rapidly to ~0.9 mmole/L within 5 min of Ni2+ recovery, showing that Li+ was released from the calcined LDH rapidly. The concentration of Al3+ during the recovery of Ni2+ was 0.05−0.1 mmole/L. The rate of Li+ leaching in 5 min was faster than the rate of Ni2+ recovery, confirming Li+ leaching (Equation (4)) followed by Ni2+ recovery (Equation (5)). In the later stage, the Li+ concentration was stable. Figure 7b shows that Li+ concentration increased rapidly to ~0.8 mmole/L within 5 min of Cu2+ recovery. Al3+ was barely detected (<0.1 mg/L).

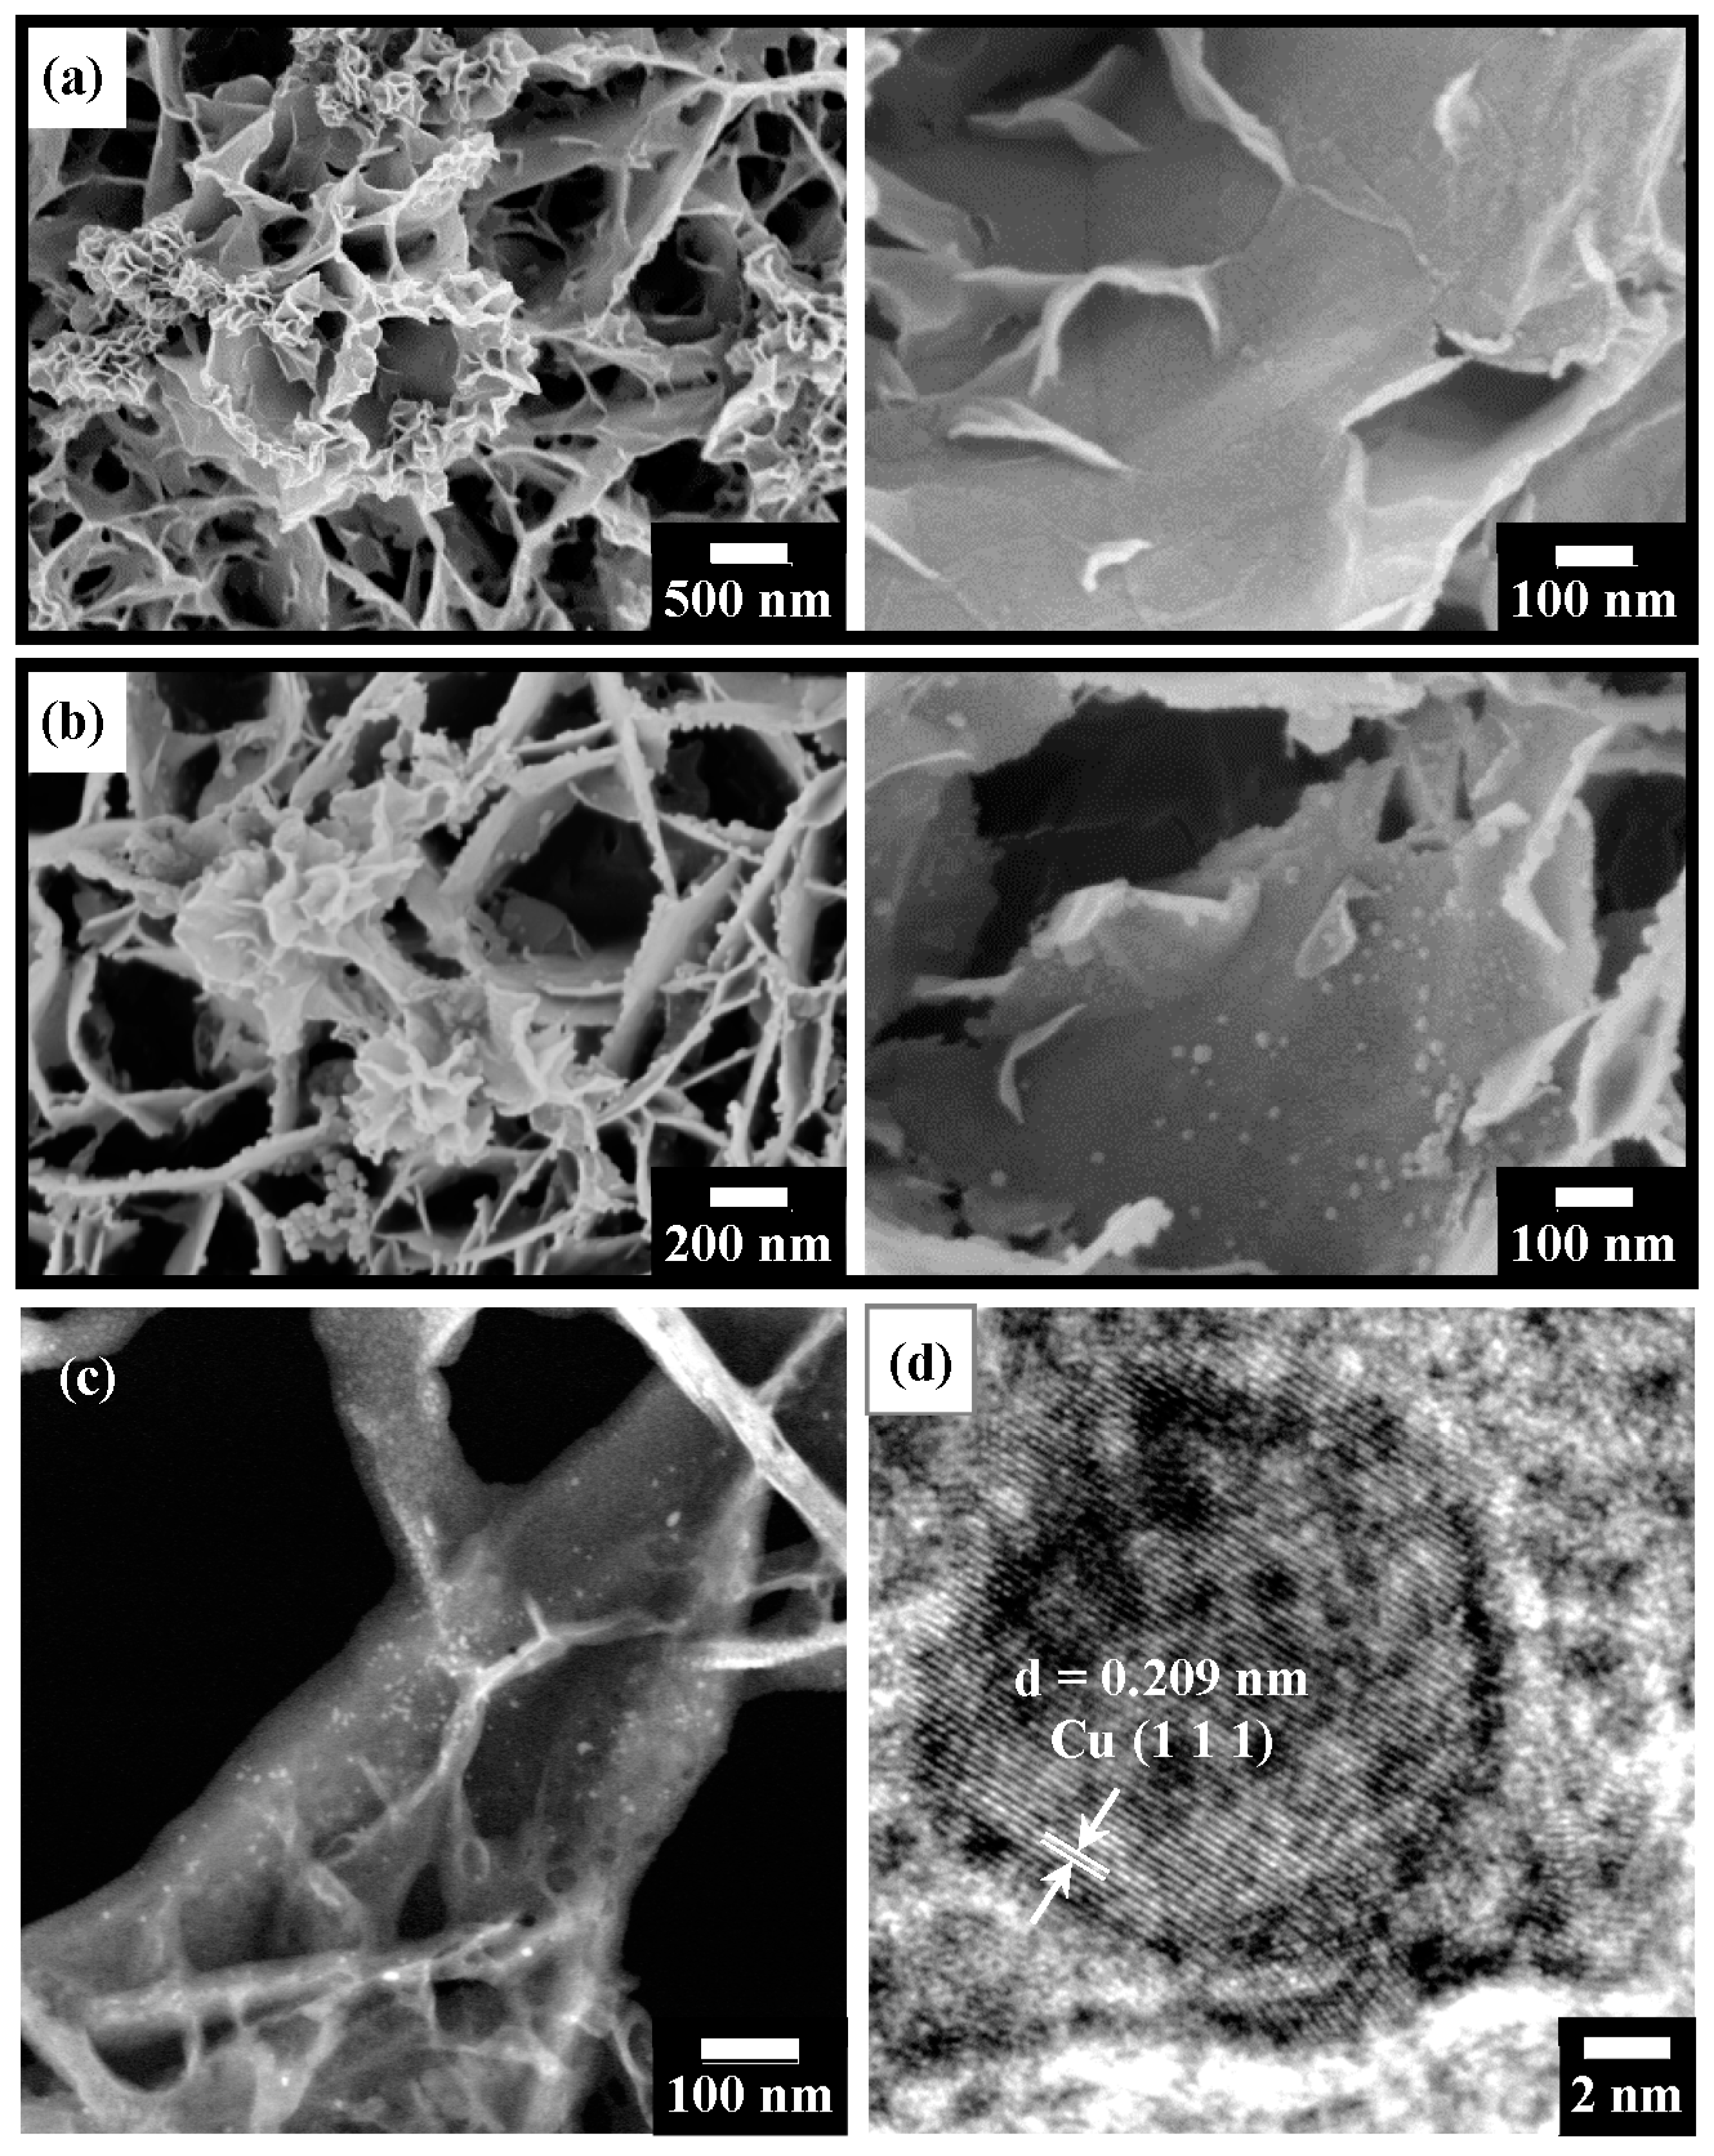
3.5. Morphologies of Ni/Cu-Containing Products and Derived Nano-Catalysts

Figure 8 presents microstructural observations of T400 after Ni2+ recovery and its derived nano-catalyst. Figure 8a displays the SEM surface image of T400 after Ni2+ recovery. The Ni-containing product observed in Figure 8a comprises dense filaments with a width of ~10 nm, uniformly covering the platelet surface. The elemental composition of T400 after the recovery of Ni2+/Cu2+ and H2 reduction as determined by SEM-EDS is presented in Table 2. As shown in Table 2, for the T400 after Ni2+ recovery for 5 h, EDS elemental analysis revealed a nickel content of 4.45 at.%. In addition, a trace amount, 0.37 at.%, of sulfur was detected on the Ni-containing product. The sulfur content decreased to very little intensity to detect after H2 reduction treatment for 3 h. Figure 8b–d display SEM and TEM observations of the Ni-containing product on T400 after H2 reduction treatment for 3 h. As shown in the SEM surface image of Figure 8b, the reduced Ni-containing product comprises nanoparticles with diameters of ~10 nm, densely and uniformly dispersed on the platelet surfaces. Figure 8c shows the TEM-HAADF image of the reduced Ni-containing product. The TEM-HAADF images revealed the Z contrast of the samples. Figure 8c shows bright nanoparticles densely dispersed on the platelet surfaces, revealing that the nanoparticles contain nickel. Figure 8d displays the HRTEM image of some nanoparticles. The nanoparticles have a d-spacing of 0.203 nm, corresponding to the Ni (111) plane.
Figure 9 shows observations of the microstructure of T400 after Cu2+ recovery and its derived nano-catalyst. The Cu-containing product (shown in Figure 9a) exhibits various morphologies, which can be classified into two types. One is nanoflower-like and is found at the edges of the platelets (left-hand image of Figure 9a); the other consists of nanoplatelet-like structures with a width of ~100 to 300 nm, formed on the platelet surface (right-hand image of Figure 9a). EDS elemental analysis (Table 2) reveals that the copper content was 5.36 at.%. The sulfur content of the Cu-containing product was 2.23 at.%, which was higher than that of the Ni-containing product. It decreased to 1.14 at.% after H2 reduction treatment for 1 h. The reduced Cu-containing product (shown in the SEM images in Figure 9b) after a reduction time of 1 h comprised nanoparticles of various sizes. As shown in the left-hand image of Figure 9b, relatively large particles (~35 nm in diameter) were primarily found at the edges of the platelets, with a few on the platelet surfaces. In the right-hand image of Figure 9b, relatively small nanoparticles with about 10–25 nm diameters are observed on the platelet surfaces. Figure 9c shows the TEM-HAADF image of the reduced Cu-containing product. Figure 9c shows bright nanoparticles dispersed on the platelet surfaces, revealing that the nanoparticles contain copper. The HRTEM image (Figure 9d) presents a nanoparticle with a diameter of ~15 nm. The nanoparticle has a d-spacing of 0.209 nm, corresponding to the Cu (111) plane.

3.6. Adsorption Isotherms

To investigate the interaction between the adsorbate and the adsorbent surface, adsorption equilibrium data were analyzed using Langmuir (Equation (10)) and Freundlich isotherm models (Equation (11)) as follows [41,60,65]:
Langmuir model:    1/Qe = 1/(kLQmCe) + 1/Qm
Freundlich model:    lnQe = lnkF + 1/n·lnCe
where Ce (mg/L) is the concentration of adsorbate at equilibrium; Qe (mg/g) is the amount of adsorbate adsorbed per unit weight of adsorbent at equilibrium; Qm (mg/g) is the maximum adsorption capacity; kL (L/mg) is the Langmuir constant related to adsorption energy; and kF (mg/g·(L/mg)1/n) and n are Freundlich constants related to adsorption capacity and adsorption intensity, respectively. The Langmuir isotherm describes that all specific adsorption sites have homogeneous adsorption capacity to adsorbates, whereas the Freundlich isotherm model assumes that adsorption sites are heterogeneous [60,62,65]. Figure 10 presents the isotherms of adsorption of Ni2+/Cu2+ using T400. As shown in Figure 10a, the amount of Ni2+/Cu2+ adsorbed increased with initial concentration. At the maximum initial cation concentration of 600 mg/L, the removal capacities of Ni2+ and Cu2+ were 376.1 and 460.2 mg/g, respectively. Table 3 presents the isotherm adsorption parameters. As shown in Table 3, the Freundlich model fits better than the Langmuir model for both Ni2+ and Cu2+, suggesting that the active adsorption sites for Ni2+/Cu2+ of the calcined Li–Al LDH were heterogeneously distributed, and the recovery of metal cations might have occurred on multiple molecular layers [65,66]. The Freundlich constants (n) exceed 1 (Table 3), indicating that the isotherms are favorable [62,67].

3.7. Characterization of Ni/Cu-Containing Products

Figure 11 presents the characterization of the used T400 after the recovery of Ni2+/Cu2+ at various initial solution pH levels for 1 h. T400 was used to investigate the effect of the solution pH on Ni/Cu-containing products. The products are denoted as Ni-pH4.0, Ni-pH6.3, Ni-pH7.5 and Cu-pH3.9, Cu-pH5.5, and Cu-pH7.5, indicating the metal cations in the aqueous solution and the solution pH. Figure 11a presents GAXRD patterns of the Ni-pH6.3 and Cu-pH5.5 products. The Ni-pH6.3 product (the bottom pattern in Figure 11a) yields characteristic peaks that correspond to α–Ni(OH)2 (JCPDS 38–0715) at 2θ values of 11.35° and 22.75°. α–Ni(OH)2, with the chemical formula of Ni(OH)2·xH2O, is an LDH-like-structured compound that is always hydrated because water molecules are intrinsic to its structure [68,69]. The Cu-pH5.5 product (upper pattern in Figure 11a) yields a sharp diffraction peak at a 2θ of 12.75°, which is assigned to the (001) plane of posnjakite (Cu4(SO4)(OH)6·H2O, JCPDS 83–1410). Posnjakite is a hydrated copper sulfate mineral with a layered structure [70]. The GAXRD pattern of the Cu-pH5.5 precursor includes another broad peak with 2θ from ~8° to ~12°. This broad peak corresponds to Cu–Al–SO4 LDH (Cu6Al2(SO4)(OH)16·4H2O, JCPDS 29–0529). As the dotted line in Figure 11a shows, the regeneration of the characteristic peak of the Li–Al–CO3 LDH (002) plane is insignificant in one hour.
Figure 11b shows FTIR spectra of the products following the recovery of Ni2+/Cu2+ by T400 at various solution pH values. Figure 11b also compares the spectrum of T400-water (bottom curve, showing the spectrum of the T400 dipped in pure water for one hour before the FTIR test). The spectra of the Ni-pH4.0, Ni-pH6.3, and Ni-pH7.5 products include insignificant νO–H bands at around 3400 nm−1. The νO–H bands in the spectra of the Cu-pH3.9, Cu-pH5.5, and Cu-pH7.5 were significantly more extensive than that obtained in T400-water, perhaps because of the newly formed products (posnjakite and Cu–Al–SO4 LDH). The spectra of the Ni- and Cu-containing products also reveal the regeneration of the δH2O band at 1630 nm−1, consistent with the XRD results (Figure 11a), which reveal that the newly formed Ni/Cu-containing products contained water molecules. In the spectra of Cu-pH3.9 and Cu-pH5.5, a sharp band at 1115 cm−1 is attributable to the vibration of S–O (νS–O) [71,72,73,74,75], indicating that the sulfate groups were intercalated into the newly formed phases. The νS–O band was absent in the spectrum of Cu-pH7.5, while the ν3, CO32− the band was present at 1380 cm−1. These results suggest that in the solution at a relatively high pH, carbonate groups, rather than sulfate groups, entered the interlayers because of the relatively high solubility of CO32− at a high pH [76], as well as the affinity of carbonate anions for intercalation into the interlayers of LDHs exceeding that of the sulfate anions [72,77]. In the spectra of the Ni-containing products, the νS–O band is relatively weak, indicating that the ability of the Ni-containing products to adsorb sulfate groups was insignificant. The weak adsorption of sulfate groups can be attributed to the substitution of some surface Al3+ for Ni2+, allowing some anions, such as SO42−, CO32−, and others, to enter the space between the Ni(OH)2 layers to maintain charge balance [78].
Figure 11c presents the Ni/Cu and S elemental contents of the Ni/Cu-containing products as determined by EDS. As shown in the left-hand panel of Figure 11c, the nickel content of the Ni-containing products increased significantly from 2.76 at.% to 5.17 at.% as the initial pH increased from 4.0 to 6.1, and then increased to 5.68 at.% at an initial pH of 7.5. These results suggest that the capacity to adsorb Ni2+ generally increased with initial solution pH. The copper content of the Cu-containing products (shown in the right-hand panel of Figure 11c) increased from 4.31 at.% to 5.16 at.% as the initial pH increased from 3.9 to 5.5, and then decreased as the initial pH of 7.5 (3.87 at.%). The copper content of the products decreased as the initial pH increased to 7.5 because some Cu2+ precipitated with hydroxide ions in solution at the high pH instead of forming Cu-containing products on the calcined LDH platelet surface. The sulfur contents of the Ni- and Cu-containing products on the calcined LDH platelet surface decreased as pH increased from 1.91 at.% at an initial pH of 4.0 to 0.94 at.% at an initial pH of 7.5 on the Ni-containing products. The sulfur contents in the Cu-containing products were relatively high at an initial pH of 3.9 and 5.5, while the sulfur content of the Cu-containing products at a pH of 7.5 was shallow, at only ~0.06 at.%. These results are consistent with the FTIR results in Figure 11b, which reveal that the Cu-containing products had a relatively high capacity to intercalate sulfate groups (νS–O) at low pH. At a high pH (the Cu-pH7.5), carbonate groups were more likely to be intercalated into interlayers than sulfate groups.
Figure 11d plots the zeta potentials of Li–Al LDH, gibbsite, and their calcination products in weakly acidic water (pH 5.0) as a function of time. The changes of T400 in Ni2+/Cu2+-containing aqueous solution with time are also shown. As those compounds were immersed in the weakly acidic water, the zeta potential of LDH at 1 min was +10.6 mV; that of gibbsite was +16.6 mV; notably, that of the T400 was −16.7 mV; and that of the C-gibbsite was −1.7 mV. By comparing the zeta potential of the LDH with that of the T400, the results in Figure 11d show that calcination changed the surface from positively charged to negatively charged. Similar results were found for the gibbsite and C-gibbsite. Furthermore, the influence of calcination on zeta potential from positive to negative was much stronger on Li–Al LDH than on the gibbsite. The Li–Al LDH is composed of gibbsite sheets with Li+ in some of the vacant octahedral sites to form positively charged layers [16,17,18]. It indicates that the addition of Li+ makes the surface of the calcined product of Li–Al LDH more negative than that of the gibbsite. The zeta potentials of T400-Ni and T400-Cu at 1 min were +6.7 and +7.3 mV, respectively, indicating that T400 was positively charged when in contact with solutions containing Ni2+/Cu2+, perhaps due to the rapid surface bonding of Ni2+/Cu2+. The zeta potential of Li–Al LDH increased, and that of the gibbsite decreased over time, but both remained positively charged at 60 min. The zeta potentials of calcined LDH T400 in weakly acidic water and Ni2+/Cu2+-containing aqueous solutions varied little in 60 min (<2 mV).

3.8. Recovery Mechanism

Figure 12 schematic represents the recovery mechanisms of Ni2+ (Figure 12a) and Cu2+ (Figure 12b) on calcined Li–Al LDH. Figure 12a schematically depicts the mechanism of Ni2+ recovery on calcined Li–Al LDH. As shown in the left-hand panel of Figure 12a, during the initial stage of recovery, some of the surface oxygen species immediately reacted with water and released OH, increasing the solution pH (Equation (4)). Some other surface oxygen species bonded to Ni2+, rapidly reducing the Ni2+ concentration (Equation (5)). The initially adsorbed Ni2+ attracted OH in solution electrostatically. In the later stage of recovery (right-hand panel of Figure 12a), the remaining Ni2+ gradually condensed with the high concentration of OH around the platelet surfaces, growing into condensates of α–Ni(OH)2. Figure 12b schematically depicts the mechanism of Cu2+ recovery on calcined Li–Al LDH. Similar to Ni2+, Cu2+ is primarily bound to surface oxygen species in the initial stage of recovery (as shown in the left-hand panel of Figure 12b). Cu2+ may be corrosive to calcined Li–Al LDH, especially at the platelet edges, so some Al3+ and OH were dissolved and released around the platelet surface. In the later stage of recovery (as shown in the right-hand panel of Figure 12b), Cu2+ precipitated or coprecipitated with Al3+, and the intercalation of sulfate groups accompanied this process into the metal hydroxide layers during the condensation.

4. Conclusions

This study established a method for recovering heavy metal cations from contaminated wastewater and converting the heavy metals into nano-catalysts. Li–Al–CO3 LDH was grown in situ on industrial aluminum lathe waste surface by immersing the waste in an alkaline aqueous solution that contained Li+ and Al3+. High-temperature calcination changed the surface properties and enhanced the ability to remove heavy metal cations from contaminated wastewater. The adsorption kinetic analysis revealed that the recovery of metal cations was a chemical reaction whose rate was controlled by external liquid film diffusion. This finding suggests that the surface bonding of the oxygen species with metal cations was an essential step in recovery, rapidly reducing the concentration of heavy metal cations. The Freundlich model fitted the adsorption isotherms, indicating that the adsorption was heterogeneous, perhaps because the condensed metal hydroxides provided new adsorption sites for heavy metal cations, allowing the condensed metal hydroxides to continue growing. The metal hydroxide products can be transferred into highly dispersed catalytic nanoparticles supported on Li–Al mixed oxide platelets by high-temperature hydrogen reduction treatment. The reduced nano-catalysts would be useful for specific applications such as the Cu–Ni two-stage catalytic reaction of ethanol steam reforming for hydrogen production. Other further applications include hydrocarbon reforming, dehydrogenation, hydrogenation (for the Ni catalyst), and hydrogenation of carbon–oxygen bonds into chemicals and fuels (for the Cu catalyst).

Author Contributions

Conceptualization, J.-Y.U. and Y.-J.C.; Methodology, J.-Y.U. and Y.-J.C.; validation, J.-Y.U. and Y.-J.C.; Formal analysis, Y.-J.C.; Investigation, Y.-J.C.; Resources, J.-Y.U.; data curation, Y.-J.C.; Writing—original draft preparation, Y.-J.C.; Writing—review and editing, Y.-J.C.; Visualization, J.-Y.U.; Supervision, J.-Y.U.; Project administration, Y.-J.C.; Funding acquisition, Y.-J.C. All authors have read and agreed to the published version of the manuscript.

Funding

This study is financially supported by National Science and Technology Council, Taiwan (grant number: NSTC 111-2221-E-005-064- and NSTC 111-2923-E-194-002-MY3). The authors are grateful for their support.

Data Availability Statement

The data that support the findings of this study are available on request from the corresponding author.

Conflicts of Interest

The authors declare no conflict of interest.

References

  1. De, S.; Zhang, J.; Luque, R.; Yan, N. Ni-based bimetallic heterogeneous catalysts for energy and environmental applications. Energy Environ. Sci. 2016, 9, 3314–3347. [Google Scholar] [CrossRef]
  2. Ndolomingo, M.J.; Bingwa, N.; Meijboom, R. Review of supported metal nanoparticles: Synthesis methodologies, advantages and application as catalysts. J. Mater. Sci. 2020, 55, 6195–6241. [Google Scholar] [CrossRef]
  3. Ye, R.-P.; Lin, L.; Li, Q.; Zhou, Z.; Wang, T.; Russell, C.K.; Adidharma, H.; Xu, Z.; Yao, Y.-G.; Fan, M. Recent progress in improving the stability of copper-based catalysts for hydrogenation of carbon–oxygen bonds. Catal. Sci. Technol. 2018, 8, 3428–3449. [Google Scholar] [CrossRef]
  4. Giurlani, W.; Zangari, G.; Gambinossi, F.; Passaponti, M.; Salvietti, E.; Di Benedetto, F.; Caporali, S.; Innocenti, M. Electroplating for decorative applications: Recent trends in research and development. Coatings 2018, 8, 260. [Google Scholar] [CrossRef]
  5. Pancrecious, J.K.; Ulaeto, S.B.; Ramya, R.; Rajan, T.; Pai, B. Metallic composite coatings by electroless technique–a critical review. Int. Mater. Rev. 2018, 63, 488–512. [Google Scholar] [CrossRef]
  6. Feng, X.; Long, R.; Wang, L.; Liu, C.; Bai, Z.; Liu, X. A review on heavy metal ions adsorption from water by layered double hydroxide and its composites. Sep. Purif. Technol. 2022, 284, 120099. [Google Scholar] [CrossRef]
  7. Shrestha, R.; Ban, S.; Devkota, S.; Sharma, S.; Joshi, R.; Tiwari, A.P.; Kim, H.Y.; Joshi, M.K. Technological trends in heavy metals removal from industrial wastewater: A review. J. Environ. Chem. Eng. 2021, 9, 105688. [Google Scholar] [CrossRef]
  8. Zubair, M.; Daud, M.; McKay, G.; Shehzad, F.; Al-Harthi, M.A. Recent progress in layered double hydroxides (LDH)-containing hybrids as adsorbents for water remediation. Appl. Clay Sci. 2017, 143, 279–292. [Google Scholar] [CrossRef]
  9. Wang, Q.; Lin, Q.; Li, Q.; Li, K.; Wu, L.; Li, S.; Liu, H. As (III) removal from wastewater and direct stabilization by in-situ formation of Zn-Fe layered double hydroxides. J. Hazard. Mater. 2021, 403, 123920. [Google Scholar] [CrossRef]
  10. Chai, W.S.; Cheun, J.Y.; Kumar, P.S.; Mubashir, M.; Majeed, Z.; Banat, F.; Ho, S.-H.; Show, P.L. A review on conventional and novel materials towards heavy metal adsorption in wastewater treatment application. J. Clean. Prod. 2021, 296, 126589. [Google Scholar] [CrossRef]
  11. Swanckaert, B.; Geltmeyer, J.; Rabaey, K.; De Buysser, K.; Bonin, L.; De Clerck, K. A review on ion-exchange nanofiber membranes: Properties, structure and application in electrochemical (waste) water treatment. Sep. Purif. Technol. 2022, 287, 120529. [Google Scholar] [CrossRef]
  12. Xiang, H.; Min, X.; Tang, C.-J.; Sillanpää, M.; Zhao, F. Recent advances in membrane filtration for heavy metal removal from wastewater: A mini review. J. Water Process Eng. 2022, 49, 103023. [Google Scholar] [CrossRef]
  13. Gurreri, L.; Tamburini, A.; Cipollina, A.; Micale, G. Electrodialysis applications in wastewater treatment for environmental protection and resources recovery: A systematic review on progress and perspectives. Membranes 2020, 10, 146. [Google Scholar] [CrossRef]
  14. Li, S.; Xu, H.; Wang, L.; Ji, L.; Li, X.; Qu, Z.; Yan, N. Dual-functional sites for selective adsorption of mercury and arsenic ions in [SnS4]4-/MgFe-LDH from wastewater. J. Hazard. Mater. 2021, 403, 123940. [Google Scholar] [CrossRef] [PubMed]
  15. Zhou, Y.; Liu, Z.; Bo, A.; Tana, T.; Liu, X.; Zhao, F.; Sarina, S.; Jia, M.; Yang, C.; Gu, Y. Simultaneous removal of cationic and anionic heavy metal contaminants from electroplating effluent by hydrotalcite adsorbent with disulfide (S2–) intercalation. J. Hazard. Mater. 2020, 382, 121111. [Google Scholar] [CrossRef] [PubMed]
  16. Kim, Y.; Son, Y.; Bae, S.; Kim, T.-H.; Hwang, Y. Adsorption of Chromate Ions by Layered Double Hydroxide–Bentonite Nanocomposite for Groundwater Remediation. Nanomaterials 2022, 12, 1384. [Google Scholar] [CrossRef] [PubMed]
  17. Chang, Y.-C.; Uan, J.-Y. Mg17Al12 phase in magnesium alloy waste facilitating the Ni2+ reduction in nickel plating wastewater. J. Hazard. Mater. 2021, 403, 123556. [Google Scholar] [CrossRef]
  18. Wang, F.; Lu, X.; Li, X.-y. Selective removals of heavy metals (Pb2+, Cu2+, and Cd2+) from wastewater by gelation with alginate for effective metal recovery. J. Hazard. Mater. 2016, 308, 75–83. [Google Scholar] [CrossRef]
  19. Chaillot, D.; Bennici, S.; Brendlé, J. Layered double hydroxides and LDH-derived materials in chosen environmental applications: A review. Environ. Sci. Pollut. Res. 2021, 28, 24375–24405. [Google Scholar] [CrossRef]
  20. Li, C.; Wei, M.; Evans, D.G.; Duan, X. Layered double hydroxide-based nanomaterials as highly efficient catalysts and adsorbents. Small 2014, 10, 4469–4486. [Google Scholar] [CrossRef]
  21. Tang, Y.; Slaný, M.; Yang, Y.; Li, S.; Qin, F.; Zhao, Y.; Zhang, Z.; Zhang, L. Highly active Mg–Al hydrotalcite for efficient O-methylation of phenol with DMC based on soft colloidal templates. J. Chem. Technol. Biotechnol. 2022, 97, 79–86. [Google Scholar] [CrossRef]
  22. Cavani, F.; Trifiro, F.; Vaccari, A. Hydrotalcite-type anionic clays: Preparation, properties and applications. Catal. Today 1991, 11, 173–301. [Google Scholar] [CrossRef]
  23. Evans, D.G.; Slade, R.C. Structural aspects of layered double hydroxides. In Layered Double Hydroxides; Springer: Berlin/Heidelberg, Germany, 2006; pp. 1–87. [Google Scholar] [CrossRef]
  24. Khan, A.I.; O’Hare, D. Intercalation chemistry of layered double hydroxides: Recent developments and applications. J. Mater. Chem. 2002, 12, 3191–3198. [Google Scholar] [CrossRef]
  25. Besserguenev, A.; Fogg, A.; Francis, R.; Price, S.; O’hare, D.; Isupov, V.; Tolochko, B. Synthesis and Structure of the Gibbsite Intercalation Compounds [LiAl2(OH)6]X {X = Cl, Br, NO3} and [LiAl2(OH)6]Cl·H2O Using Synchrotron X-ray and Neutron Powder Diffraction. Chem. Mater. 1997, 9, 241–247. [Google Scholar] [CrossRef]
  26. Fogg, A.M.; Freij, A.J.; Parkinson, G.M. Synthesis and anion exchange chemistry of rhombohedral Li/Al layered double hydroxides. Chem. Mater. 2002, 14, 232–234. [Google Scholar] [CrossRef]
  27. Serna, C.J.; Rendon, J.L.; Iglesias, J.E. Crystal-chemical study of layered [Al2Li(OH)6]+X· nH2O. Clays Clay Miner. 1982, 30, 180–184. [Google Scholar] [CrossRef]
  28. Lin, M.-C.; Chang, F.-T.; Uan, J.-Y. Synthesis of Li–Al-carbonate layered double hydroxide in a metal salt-free system. J. Mater. Chem. 2010, 20, 6524–6530. [Google Scholar] [CrossRef]
  29. Chen, Y.-J.; Huang, S.-H.; Uan, J.-Y.; Lin, H.-T. Synthesis of Catalytic Ni/Cu Nanoparticles from Simulated Wastewater on Li–Al Mixed Metal Oxides for a Two-Stage Catalytic Process in Ethanol Steam Reforming: Catalytic Performance and Coke Properties. Catalysts 2021, 11, 1124. [Google Scholar] [CrossRef]
  30. Huang, S.-H.; Chen, Y.-J.; Huang, W.-F.; Uan, J.-Y. Electrodeposition of a Li-Al Layered Double Hydroxide (LDH) on a Ball-like Aluminum Lathe Waste Strips in Structured Catalytic Applications: Preparation and Characterization of Ni-Based LDH Catalysts for Hydrogen Evolution. Catalysts 2022, 12, 520. [Google Scholar] [CrossRef]
  31. Fang, Q.; Ye, S.; Yang, H.; Yang, K.; Zhou, J.; Gao, Y.; Lin, Q.; Tan, X.; Yang, Z. Application of layered double hydroxide-biochar composites in wastewater treatment: Recent trends, modification strategies, and outlook. J. Hazard. Mater. 2021, 420, 126569. [Google Scholar] [CrossRef]
  32. Ye, H.; Liu, S.; Yu, D.; Zhou, X.; Qin, L.; Lai, C.; Qin, F.; Zhang, M.; Chen, W.; Chen, W. Regeneration mechanism, modification strategy, and environment application of layered double hydroxides: Insights based on memory effect. Coord. Chem. Rev. 2022, 450, 214253. [Google Scholar] [CrossRef]
  33. Lee, S.-B.; Ko, E.-H.; Park, J.Y.; Oh, J.-M. Mixed metal oxide by calcination of layered double hydroxide: Parameters affecting specific surface area. Nanomaterials 2021, 11, 1153. [Google Scholar] [CrossRef] [PubMed]
  34. Duan, X.; Evans, D.G. Layered Double Hydroxides; Springer Science & Business Media: Berlin/Heidelberg, Germany, 2006; Volume 119. [Google Scholar]
  35. Chen, M.; Li, S.; Li, L.; Jiang, L.; Ahmed, Z.; Dang, Z.; Wu, P. Memory effect induced the enhancement of uranium (VI) immobilization on low-cost MgAl-double oxide: Mechanism insight and resources recovery. J. Hazard. Mater. 2021, 401, 123447. [Google Scholar] [CrossRef] [PubMed]
  36. Fang, L.; Li, W.; Chen, H.; Xiao, F.; Huang, L.; Holm, P.E.; Hansen, H.C.B.; Wang, D. Synergistic effect of humic and fulvic acids on Ni removal by the calcined Mg/Al layered double hydroxide. RSC Adv. 2015, 5, 18866–18874. [Google Scholar] [CrossRef]
  37. Jiménez-López, B.; Leyva-Ramos, R.; Salazar-Rábago, J.; Jacobo-Azuara, A.; Aragón-Piña, A. Adsorption of selenium (iv) oxoanions on calcined layered double hydroxides of Mg-Al-CO3 from aqueous solution. Effect of calcination and reconstruction of lamellar structure. Environ. Nanotechnol. Monit. Manag. 2021, 16, 100580. [Google Scholar] [CrossRef]
  38. Laipan, M.; Fu, H.; Zhu, R.; Sun, L.; Steel, R.M.; Ye, S.; Zhu, J.; He, H. Calcined Mg/Al-LDH for acidic wastewater treatment: Simultaneous neutralization and contaminant removal. Appl. Clay Sci. 2018, 153, 46–53. [Google Scholar] [CrossRef]
  39. Lei, C.; Zhu, X.; Zhu, B.; Jiang, C.; Le, Y.; Yu, J. Superb adsorption capacity of hierarchical calcined Ni/Mg/Al layered double hydroxides for Congo red and Cr (VI) ions. J. Hazard. Mater. 2017, 321, 801–811. [Google Scholar] [CrossRef]
  40. Sun, M.; Xiao, Y.; Zhang, L.; Gao, X.; Yan, W.; Wang, D.; Su, J. High uptake of Cu2+, Zn2+ or Ni2+ on calcined MgAl hydroxides from aqueous solutions: Changing adsorbent structures. Chem. Eng. J. 2015, 272, 17–27. [Google Scholar] [CrossRef]
  41. Yang, F.; Sun, S.; Chen, X.; Chang, Y.; Zha, F.; Lei, Z. Mg–Al layered double hydroxides modified clay adsorbents for efficient removal of Pb2+, Cu2+ and Ni2+ from water. Appl. Clay Sci. 2016, 123, 134–140. [Google Scholar] [CrossRef]
  42. Chen, H.; Lin, J.; Zhang, N.; Chen, L.; Zhong, S.; Wang, Y.; Zhang, W.; Ling, Q. Preparation of MgAl-EDTA-LDH based electrospun nanofiber membrane and its adsorption properties of copper (II) from wastewater. J. Hazard. Mater. 2018, 345, 1–9. [Google Scholar] [CrossRef]
  43. Liang, X.; Zang, Y.; Xu, Y.; Tan, X.; Hou, W.; Wang, L.; Sun, Y. Sorption of metal cations on layered double hydroxides. Colloids Surf. A 2013, 433, 122–131. [Google Scholar] [CrossRef]
  44. Rocha, J.; Del Arco, M.; Rives, V.; Ulibarri, M. Reconstruction of layered double hydroxides from calcined precursors: A powder XRD and 27Al MAS NMR study. J. Mater. Chem. 1999, 9, 2499–2503. [Google Scholar] [CrossRef]
  45. Wong, F.; Buchheit, R. Utilizing the structural memory effect of layered double hydroxides for sensing water uptake in organic coatings. Prog. Org. Coat. 2004, 51, 91–102. [Google Scholar] [CrossRef]
  46. Kim, T.-H.; Lee, W.-J.; Lee, J.-Y.; Paek, S.-M.; Oh, J.-M. Isomorphous substitution of divalent metal ions in layered double hydroxides through a soft chemical hydrothermal reaction. Dalton Trans. 2014, 43, 10430–10437. [Google Scholar] [CrossRef]
  47. Richardson, M.C.; Braterman, P.S. Cation exchange by anion-exchanging clays: The effects of particle aging. J. Mater. Chem. 2009, 19, 7965–7975. [Google Scholar] [CrossRef]
  48. Aaltonen, M.; Peng, C.; Wilson, B.P.; Lundström, M. Leaching of metals from spent lithium-ion batteries. Recycling 2017, 2, 20. [Google Scholar] [CrossRef]
  49. Hou, X.; Kirkpatrick, R.J. Thermal Evolution of the Cl–LiAl2 Layered Double Hydroxide: A Multinuclear MAS NMR and XRD Perspective. Inorg. Chem. 2001, 40, 6397–6404. [Google Scholar] [CrossRef]
  50. Huang, S.-H.; Liu, S.-J.; Uan, J.-Y. Controllable luminescence of a Li–Al layered double hydroxide used as a sensor for reversible sensing of carbonate. J. Mater. Chem. C 2019, 7, 11191–11206. [Google Scholar] [CrossRef]
  51. Syu, J.-H.; Uan, J.-Y.; Lin, M.-C.; Lin, Z.-Y. Optically transparent Li–Al–CO3 layered double hydroxide thin films on an AZ31 Mg alloy formed by electrochemical deposition and their corrosion resistance in a dilute chloride environment. Corros. Sci. 2013, 68, 238–248. [Google Scholar] [CrossRef]
  52. Lin, M.-C.; Chang, F.-T.; Uan, J.-Y. Aqueous Li+/Al3+ alkaline solution for CO2 capture and the massive Li–Al–CO3 hydrotalcite precipitation during the interaction between CO2 gas and the Li+/Al3+ aqueous solution. J. Mater. Chem. A 2013, 1, 14773–14782. [Google Scholar] [CrossRef]
  53. Malki, A.; Mekhalif, Z.; Detriche, S.; Fonder, G.; Boumaza, A.; Djelloul, A. Calcination products of gibbsite studied by X-ray diffraction, XPS and solid-state NMR. J. Solid State Chem. 2014, 215, 8–15. [Google Scholar] [CrossRef]
  54. Newberg, J.T.; Starr, D.E.; Yamamoto, S.; Kaya, S.; Kendelewicz, T.; Mysak, E.R.; Porsgaard, S.; Salmeron, M.B.; Brown, G.E., Jr.; Nilsson, A. Formation of hydroxyl and water layers on MgO films studied with ambient pressure XPS. Surf. Sci. 2011, 605, 89–94. [Google Scholar] [CrossRef]
  55. Yan, Z.; Zhu, B.; Yu, J.; Xu, Z. Effect of calcination on adsorption performance of Mg–Al layered double hydroxide prepared by a water-in-oil microemulsion method. RSC Adv. 2016, 6, 50128–50137. [Google Scholar] [CrossRef]
  56. Fitzgerald, J.J.; Piedra, G.; Dec, S.F.; Seger, M.; Maciel, G.E. Dehydration studies of a high-surface-area alumina (pseudo-boehmite) using solid-state 1H and 27Al NMR. J. Am. Chem. Soc. 1997, 119, 7832–7842. [Google Scholar] [CrossRef]
  57. Lee, Y.; Jung, D.-Y. Lithium intercalation and deintercalation of thermally decomposed LiAl2-layered double hydroxides. Appl. Clay Sci. 2022, 228, 106631. [Google Scholar] [CrossRef]
  58. Zhang, Y.; Cheng, X.; Wu, C.; Köhler, J.; Deng, S. Electronic structure and lithium diffusion in LiAl2(OH)6Cl studied by first principle calculations. Molecules 2019, 24, 2667. [Google Scholar] [CrossRef]
  59. Shukla, N.; Sahoo, D.; Remya, N. Biochar from microwave pyrolysis of rice husk for tertiary wastewater treatment and soil nourishment. J. Clean. Prod. 2019, 235, 1073–1079. [Google Scholar] [CrossRef]
  60. Zhou, Y.; Liu, X.; Xiang, Y.; Wang, P.; Zhang, J.; Zhang, F.; Wei, J.; Luo, L.; Lei, M.; Tang, L. Modification of biochar derived from sawdust and its application in removal of tetracycline and copper from aqueous solution: Adsorption mechanism and modelling. Bioresour. Technol. 2017, 245, 266–273. [Google Scholar] [CrossRef]
  61. Behbahani, E.S.; Dashtian, K.; Ghaedi, M. Fe3O4-FeMoS4: Promise magnetite LDH-based adsorbent for simultaneous removal of Pb (II), Cd (II), and Cu (II) heavy metal ions. J. Hazard. Mater. 2021, 410, 124560. [Google Scholar] [CrossRef]
  62. Xu, X.; Li, P.; Yang, S.; Zhang, T.; Han, X.; Zhou, G.; Cao, Y.; Teng, D. The performance and mechanism of a Mg-Al double-layer oxide in chloride ion removal from an aqueous solution. Nanomaterials 2022, 12, 846. [Google Scholar] [CrossRef]
  63. Lin, C.-R.; Ivanova, O.S.; Edelman, I.S.; Knyazev, Y.V.; Zharkov, S.M.; Petrov, D.A.; Sokolov, A.E.; Svetlitsky, E.S.; Velikanov, D.A.; Solovyov, L.A. Carbon double coated Fe3O4@C@C nanoparticles: Morphology features, magnetic properties, dye adsorption. Nanomaterials 2022, 12, 376. [Google Scholar] [CrossRef] [PubMed]
  64. Xiang, H.; Ren, G.; Zhong, Y.; Xu, D.; Zhang, Z.; Wang, X.; Yang, X. Fe3O4@C nanoparticles synthesized by in situ solid-phase method for removal of methylene blue. Nanomaterials 2021, 11, 330. [Google Scholar] [CrossRef]
  65. Gong, J.; Liu, T.; Wang, X.; Hu, X.; Zhang, L. Efficient removal of heavy metal ions from aqueous systems with the assembly of anisotropic layered double hydroxide nanocrystals@ carbon nanosphere. Environ. Sci. Technol. 2011, 45, 6181–6187. [Google Scholar] [CrossRef] [PubMed]
  66. Yu, S.; Liu, Y.; Ai, Y.; Wang, X.; Zhang, R.; Chen, Z.; Chen, Z.; Zhao, G.; Wang, X. Rational design of carbonaceous nanofiber/Ni-Al layered double hydroxide nanocomposites for high-efficiency removal of heavy metals from aqueous solutions. Environ. Pollut. 2018, 242, 1–11. [Google Scholar] [CrossRef]
  67. Chilukoti, S.; Thangavel, T. Enhanced adsorption of Congo red on microwave synthesized layered Zn-Al double hydroxides and its adsorption behaviour using mixture of dyes from aqueous solution. Inorg. Chem. Commun. 2019, 100, 107–117. [Google Scholar] [CrossRef]
  68. Ge, X.; Gu, C.; Wang, X.; Tu, J. Anomalous self-reduction of layered double hydroxide (LDH): From α-Ni(OH)2 to hexagonal close packing (HCP) Ni/NiO by annealing without a reductant. Chem. Commun. 2015, 51, 1004–1007. [Google Scholar] [CrossRef]
  69. Hall, D.S.; Lockwood, D.J.; Bock, C.; MacDougall, B.R. Nickel hydroxides and related materials: A review of their structures, synthesis and properties. Proc. R. Soc. A Math. Phys. Eng. Sci. 2015, 471, 20140792. [Google Scholar] [CrossRef]
  70. Stanimirova, T.; Ivanova, K. Transformation of ktenasite-type minerals to langite, posnjakite, and brochantite under water treatment. Comptes Rendus L’academie Bulg. Sci. 2019, 72, 768–776. [Google Scholar] [CrossRef]
  71. Fuku, K.; Kanai, H.; Todoroki, M.; Mishima, N.; Akagi, T.; Kamegawa, T.; Ikenaga, N. Heterogeneous Fenton degradation of organic pollutants in water enhanced by combining iron-type layered double hydroxide and sulfate. Chem. Asian J. 2021, 16, 1887–1892. [Google Scholar] [CrossRef]
  72. Goh, K.-H.; Lim, T.-T. Influences of co-existing species on the sorption of toxic oxyanions from aqueous solution by nanocrystalline Mg/Al layered double hydroxide. J. Hazard. Mater. 2010, 180, 401–408. [Google Scholar] [CrossRef]
  73. Halajnia, A.; Oustan, S.; Najafi, N.; Khataee, A.; Lakzian, A. Adsorption–desorption characteristics of nitrate, phosphate and sulfate on Mg–Al layered double hydroxide. Appl. Clay Sci. 2013, 80, 305–312. [Google Scholar] [CrossRef]
  74. Song, Q.; Wang, J.; Sun, Q.; Wang, X.; Zhu, Z.; Pei, C.; Li, H.; Luo, Z.; Huang, X.; Huang, W. Anion-dependent topochemical conversion of CoAl-LDH microplates to hierarchical superstructures of CoOOH nanoplates with controllable orientation. Chem. Commun. 2020, 56, 10285–10288. [Google Scholar] [CrossRef]
  75. Sun, Z.; Wang, Y.; Liu, T.; Kong, X.; Pan, T.; Zhang, F.; Lei, X.; Duan, X. Super-stable mineralization of Cu, Cd, Zn and Pb by CaAl-layered double hydroxide: Performance, mechanism, and large-scale application in agriculture soil remediation. J. Hazard. Mater. 2023, 447, 130723. [Google Scholar] [CrossRef] [PubMed]
  76. Li, K.; Kumada, N.; Yonesaki, Y.; Takei, T.; Kinomura, N.; Wang, H.; Wang, C. The pH effects on the formation of Ni/Al nitrate form layered double hydroxides (LDHs) by chemical precipitation and hydrothermal method. Mater. Chem. Phys. 2010, 121, 223–229. [Google Scholar] [CrossRef]
  77. Yu, T.M.; Meira, A.C.R.; Kreutz, J.C.; Effting, L.; Giona, R.M.; Gervasoni, R.; de Moura, A.A.; Bezerra, F.M.; Bail, A. Exploring the surface reactivity of the magnetic layered double hydroxide lithium-aluminum: An alternative material for sorption and catalytic purposes. Appl. Surf. Sci. 2019, 467, 1195–1203. [Google Scholar] [CrossRef]
  78. Hengbin, Z.; Hansan, L.; Xuejing, C.; Shujia, L.; Chiachung, S. Preparation and properties of the aluminum-substituted α-Ni(OH)2. Mater. Chem. Phys. 2003, 79, 37–42. [Google Scholar] [CrossRef]
Figure 1. The macroscopic and microscopic views of the LDH/Al adsorbent material: (a) a photograph of industrial aluminum lathe waste (weight of 5 g), which would be employed as the substrates for the formation of Li–Al–CO3 LDH; (b) a photograph of some aluminum lathe waste strips after being coated with Li–Al–CO3 LDH, in which (c) SEM surface morphologies of the LDH are shown; and (d) TEM cross-sectional view of the LDH.
Nanomaterials 13 01477 g001
Figure 2. Surface characterization of LDH and calcined LDH with various calcination temperatures: (a) XRD patterns; (b) FTIR spectra; (c) O 1s XPS spectra; (d) M–O/M–OH molar percentage; (e) water contact angle; and (f) surface pH.
Nanomaterials 13 01477 g002
Figure 3. (a) Ni2+ removal efficiencies of LDH, T150, T200, T300, T400, and T500 from initial 75 mg/L Ni2+ aqueous solutions, indicating that using 2 g LDH/Al exhibits much better removal efficiencies than 1 g LDH/Al; (b) leaching concentrations of Li+ and Al3+ from the LDH, T150, T200, T300, T400, and T500 after Ni2+ removal experiments in aqueous solutions with initial 75 mg/L Ni2+. The time was 60 min for the Ni2+ removal experiments.
Nanomaterials 13 01477 g003
Figure 4. SEM surface morphologies after the recovery of Ni2+ for 1 min using (a) LDH and calcined LDH of: (b) T150; (c) T200; (d) T300; EUR T400; and (f) T500. As shown in (d,e), nanofilaments were observed on the platelet surface, especially T400 (as revealed in (e)). The initial Ni2+ concentration for the experiments was 75 mg/L.
Nanomaterials 13 01477 g004
Figure 5. (a) The removal of Ni2+ and pH change (inset) as a function of time using T400. Kinetic fitting curves simulated by: (b) pseudo-first-order and pseudo-second-order; (c) intraparticle diffusion; and (d) liquid film diffusion models. The adsorbent dosage of T400 for this experiment was 0.4 g/L.
Nanomaterials 13 01477 g005
Figure 6. (a) The removal of Cu2+ and pH change (inset) as a function of time using T400. Kinetic fitting curves simulated by: (b) pseudo-first-order and pseudo-second-order; (c) intraparticle diffusion; and (d) liquid film diffusion models. The adsorbent dosage of T400 for this experiment was 0.4 g/L.
Nanomaterials 13 01477 g006
Figure 7. The leaching concentrations of Li+ and Al3+ from T400 as the removal of: (a) Ni2+ and(b) Cu2+. The Ni2+ and Cu2+ removal concentration data were re-plotted from Figure 5a and Figure 6a.
Nanomaterials 13 01477 g007
Figure 8. (a) SEM surface image of T400 after Ni2+ recovery for 5 h, indicating nanofilaments on the platelet surface; (b) SEM surface image of the sample of (a) after H2 reduction treatment, showing nanoparticles on the platelet surface; (c) TEM-HAADF observation of the sample of (b), showing bright nanoparticles; and (d) HRTEM image from the sample of (c), showing Ni (111) planes with d = 0.203 nm.
Nanomaterials 13 01477 g008
Figure 9. (a) SEM surface images of T400 after Cu2+ recovery for 5 h, showing nanoflower-like structures on platelet edges (left image) and nanoplatelets on platelet surfaces (right image); (b) SEM surface images of the sample of (a) after H2 reduction treatment, showing nanoparticles on platelet edges (left image) and on platelet surfaces (right image); (c) TEM-HAADF view of the sample of (b), indicating bright nanoparticles; and (d) HRTEM image from the sample of (c), showing Cu (111) planes in a Cu nanoparticle with d = 0.209 nm.
Nanomaterials 13 01477 g009
Figure 10. Adsorption isotherms fitted by Langmuir and Freundlich models for removal of: (a) Ni2+ and (b) Cu2+ using T400. The adsorbent dosage of T400 for the experiments was 0.4 g/L, with a one-hour immersion of the T400 in Ni2+/Cu2+-containing solutions.
Nanomaterials 13 01477 g010
Figure 11. Characterization of the used T400 after the recovery of Ni2+/Cu2+ at various initial solution pH levels for 1 h: (a) XRD pattern; (b) FTIR spectra; (c) EDS elemental content on products; and (d) Zeta potentials of Li–Al LDH, gibbsite, and their calcination products in weakly acidic water (pH 5.0) as a function of time. The changes of T400 in Ni2+/Cu2+-containing aqueous solution with time are also shown. The initial Ni2+/Cu2+ concentration for the experiments was 75 mg/L.
Nanomaterials 13 01477 g011
Figure 12. Schematic representations of the recovery mechanisms of (a) Ni2+ and (b) Cu2+ on calcined Li–Al LDH.
Nanomaterials 13 01477 g012
Table 1. Kinetic parameters and adjusted coefficients of determination of the adsorption kinetic models for Ni2+/Cu2+ removal using T400.
Ni2+Cu2+
Pseudo-first-order modelk1 (mg/g/min)0.07790.1729
Qe (mg/g)180.8180.1
R20.97790.9619
Pseudo-second-order modelk2 (mg/g/min)0.0005960.001730
Qe (mg/g)194.4188.0
R20.99790.9963
Intraparticle diffusion modelKid, 1 (mg/g/min0.5)20.0312.14
C (mg/g)38.13100.9
R20.94360.9402
kid, 2 (mg/g/min0.5)2.1950.997
C (mg/g)154.1171.6
R20.65910.7384
Liquid film diffusion modelkfd (min−1)0.03180.0228
C (mg/g)−0.530−1.460
R20.99530.9649
Table 2. Elemental composition of T400 after the recovery of Ni2+/Cu2+ and H2 reduction as determined by SEM-EDS.
Elemental Composition (Atomic %)
as Determined by SEM-EDS
OAlNiS
After Ni2+ recovery for 5 h73.0022.184.450.37
After H2 reduction for 3 h61.7033.334.97--
OAlCuS
After Cu2+ recovery for 5 h72.3720.055.362.23
After H2 reduction for 1 h65.2127.745.921.14
Table 3. Adjusted coefficients of determination of Langmuir and Freundlich isotherm models for Ni2+/Cu2+ removal using T400.
Ni2+Cu2+
Langmuir modelQm (mg/g)306.7363.6
kL (L/mg)0.34320.3508
R20.77090.7661
Freundlich modelkF (mg/g·(L/mg)1/n)143.8146.0
n6.9425.528
R20.96010.9672
Disclaimer/Publisher’s Note: The statements, opinions and data contained in all publications are solely those of the individual author(s) and contributor(s) and not of MDPI and/or the editor(s). MDPI and/or the editor(s) disclaim responsibility for any injury to people or property resulting from any ideas, methods, instructions or products referred to in the content.

