Abstract
The importance of nitrite ions has long been recognized due to their extensive use in environmental chemistry and public health. The growing use of nitrogen fertilizers and additives containing nitrite in processed food items has increased exposure and, as a result, generated concerns about potential harmful health consequences. This work presents the development of an electrochemical sensor based on graphene/glassy carbon electrode (EGr/GC) with applicability in trace level detection of nitrite in water samples. According to the structural characterization of the exfoliated material, it appears as a mixture of graphene oxide (GO; 21.53%), few-layers graphene (FLG; 73.25%) and multi-layers graphene (MLG; 5.22%) and exhibits remarkable enhanced sensing response towards nitrite compared to the bare electrode (three orders of magnitude higher). The EGr/GC sensor demonstrated a linear range between 3 × 10⁻⁷ and 10−3 M for square wave voltammetry (SWV) and between 3 × 10⁻⁷ and 4 × 10⁻⁴ M for amperometry (AMP), with a low limit of detection LOD (9.9 × 10⁻⁸ M). Excellent operational stability, repeatability and interference-capability were displayed by the modified electrode. Furthermore, the practical applicability of the sensor was tested in commercially available waters with excellent results.
1. Introduction
Due to its crucial involvement in the creation of cellular components, including nucleic acids and proteins, nitrogen is an essential and necessary element for all living organisms [1]. Recently, bioavailable nitrogen levels have been significantly impacted by human activities [2]. The extensive and widespread usage of nitrogen-based agricultural fertilizers has significantly expanded in the last years and is directly correlated with a profound effect on water pollution [3] and drinking water contamination [4]. The nitrogen cycle on earth includes the naturally occurring ionic species nitrate and nitrite [5]. Nitrite (), a common inorganic ion, is a byproduct of nitrifying bacteria in soil and water oxidizing ammonia nitrogen to nitrate. Normally, the nitrite amounts that can be typically present in water systems are low, but, occasionally, imbalances in the nitrifying process result in nitrite system accumulation. Moreover, the leakage of reactive nitrogen into the environment generates an overexposure to nitrites that endangers both ecosystems and human health [6]. On the other hand, the importance of nitrites has long been recognized in environmental chemistry and public health, since they are usually present in different pharmaceuticals and household items, widely employed in the food sector as food preservatives (E249, E250) [7] and corrosion inhibitors in industrial water [8]. Nitrite-containing foods are not consumed on a daily basis and nitrites do not accumulate in the body. However, endogenous is created via the oxidation of NO, as well as the reduction of dietary nitrate (), as a result of microorganisms in our saliva, stomach and intestines [9]. It has long been acknowledged that serious, harmful health consequences (such as respiratory distress, central nervous system problems, carcinogenic tumors, thyroid affections, genetic modifications, and even death) might occur from nitrite overexposure [10,11,12,13] High nitrite levels lead to a serious blood condition called methemoglobinemia or ‘Blue Baby Syndrome’, in which the body is deprived of oxygen, since nitrites oxidize the iron component of red blood cells (hemoglobin), causing them to lose their ability to transport oxygen [14]. In view of all of these health posing risks, the World Health Organization (WHO) has established guidelines on acceptable levels of human intake based on the lack of particular short-term health consequences (methemoglobinemia and thyroid effects). The WHO defines acceptable concentrations of nitrite in drinking water as 3 mg/L (214.2 μM) [15], while the Scientific Committee on Foods, confirmed by the Joint Food and Agriculture Organization (FAO)/WHO Expert Committee on Food Additives (JECFA), defines an acceptable daily intake of nitrite from food sources as 0.06 mg/kg body weight [16]. Consequently, monitoring the nitrite content in the environment, public health and the food industry is crucial, and the development of simple, sensitive and efficient analytical tools is essential and must be addressed. Until now, different types of spectroscopic [17,18], chromatographic [19,20,21], capillary electrophoretic [22] and electrochemical methods [23,24,25] have been developed and used for nitrite detection. Among these, due to its rapidity, sensibility and low costs, the electrochemical aproach has become one of the most popular and extensively used analytical tools [26]. To create electrochemical sensors with increased sensitivity and accuracy for nitrite detection, different nanomaterials have been embedded on electrode surfaces: nickel/PDDA/reduced graphene oxide [27], Ag–Fe3O4–graphene oxide magnetic nanocomposites [28], Fe3O4–reduced graphene oxide composite [29], metal-organic framework derived rod-like Co@carbon [30], La-based perovskite-type lanthanum aluminate nanorod-incorporated graphene oxide nanosheets [31], cobalt oxide decorated reduced graphene oxide and carbon nanotubes [32], gold–copper nanochain network [33], carbon nanotube (CNTs), chitosan and iron (II) phtalocyanine (C32H16FeN8) composite [34]; gold nanoparticles/chitosan/MXenes nanocomposite [35], worm-like gold nanowires and assembled carbon nanofibers–CVD graphene hybrid [36]; photochemically-made gold nanoparticles [37], or graphene nanoparticles [38]. Among these, the special properties of graphene are unequivocal and long-time recognized [39], justifying their extensive applicability and usage in sensors technology [40,41].
The novelty of this work is related to the development and applicability of a graphene-based sensor for the quantitative analysis of trace levels of nitrites in different commercially available water samples. Compared to the majority of previously reported modified electrodes used in nitrite assay, the prepared sensor has the advantage of a simple, one-step and low cost preparation method.
2. Materials and Methods
2.1. Chemicals
The chemicals used during the experiments were of analytical grade and were not further purified before usage. Graphite rods (6 mm diameter, 99.995% purity); potassium chloride (KCl, 99.98%); sodium dihydrogen phosphate (NaH2PO4, 100%) and di-sodium hydrogen phosphate anhydrous (Na2HPO4, 99.7%) were supplied by VWR Chemicals (Leuven, Belgium). Sodium acetate anhydrous (CH3COONa, ≥99.0%); ammonium sulphate ((NH4)2SO4, ≥99.0%), sodium chloride (NaCl, 99.5%); sodium carbonate anhydrous (Na2CO3, 99.3%), magnesium chloride hexahydrate (MgCl2∙6H2O, 99–102%); magnesium sulphate (MgSO4, 99%); magnesium nitrate hexahydrate (Mg(NO3)2∙6H2O, 99%) were provided by REACTIVUL Bucuresti (Bucharest, Romania). Potassium ferrocyanide K4[Fe(CN)6] and L(+)-Ascorbic acid (C6H8O6, AA, ≥99%) were acquired from Merck (Darmstadt, Germany). Sodium acetate anhydrous (CH3COONa, ≥99.0%) was purchased from ChimReactiv SRL (Bucharest, Romania). N,N-dimethylformamide (DMF) was acquired from Fluka Chemie GmbH (Buchs, Switzerland), while boric acid (H3BO3, 99%) was provided by Andra Chim SRL (Bucharest, Romania). The MQuant® Nitrite Test (Merck KGaA, Darmstadt, Germany) was employed for UV-Vis investigation of nitrite solutions. Deionized water with a resistivity of at least 18.2 MΩ × cm was used to prepare all solutions.
2.2. Apparatus
In order to reveal the morphological characteristics of the graphene sample, we employed a Hitachi HD2700 instrument (Hitachi, Japan) equipped with a cold field emission gun (CSEG). The structural characterization of graphene was performed by X-ray powder diffraction (XRD), with a Bruker D8 Advance Diffractometer (40 kV; 0.5 mA) equipped with a LYNXEYE detector (λ = 1.5406 Å). After the deconvolution of the recorded pattern, some parameters of graphene samples were determined: the graphene crystallite size (D), the interlayer distance (d) and the number of layers (n). The graphene Raman spectrum was recorded with an NTEGRA Spectra platform, placed on a NEWPORT RS4000 optical table and equipped with a SOLAR TII confocal Raman spectrometer coupled with an Olympus IX71 microscope in two different configurations (Moscow, Russia). A Christ-Alpha 1-4 LSC freeze-drier (Martin Christ Gefriertrocknungsanlagen GmbH, Osterode am Harz, Germany) was employed for drying the sample obtained after electrochemical exfoliation of graphite rods.
For electrochemical measurements (Cyclic Voltammetry—CV; Square Wave Voltammetry—SWV; Amperometry—AMP; and Electrochemical Impedance Spectroscopy—EIS) a Potentiostat/Galvanostat instrument PGSTAT-302N (Metrohm-Autolab B.V., Utrecht, The Netherlands) coupled with a personal computer was employed. The working electrode was either bare glassy carbon electrode (3 mm diameter), or that modified with graphene. The counter electrode was a large platinum sheet (2 cm2 area) and the reference was an Ag/AgCl electrode.
2.3. Graphene Synthesis by Electrochemical Exfoliation of Graphite Rods (EGr)
In an electrochemical cell filled with the appropriate solution (0.05 M (NH4)2SO4 + 0.1 M H3BO3 + 0.05 M NaCl), two graphite rods (anode and cathode) were immersed and connected to the exfoliation system. The solution temperature was kept at around 10 °C with a thermostat and the time parameters for current pulse exfoliation were set before starting the graphene synthesis: current pulse duration 0.8 s; pause between two current pulses 0.2 s [42]. The exfoliation started after applying a bias of 12 V for 4 h, after which the process was stopped. The resulting black suspension was thoroughly washed with distilled water (8 L) to remove the ions superficially attached to the graphene flakes. The large graphite particles were removed by filtration with Whatman qualitative paper (white-ribbon filter). The last step was the drying, which was done by lyophilisation. The sample was then denoted as EGr.
2.4. Glassy-Carbon Modification with Graphene (EGr/GC)
N,N-dimethylformamide (DMF) organic solvent was selected for the dispersion of graphene sample (2 mg/mL). Due to its high boiling point (153 °C), it evaporates slowly at room temperature, allowing the graphene flakes to form a stable layer on top of the electrode. The GC electrode was covered with a total volume of 10 µL from the graphene sample in DMF and dried at room temperature for 24 h. We tested several electrodes covered with different volume (5; 8; 10; 12 and 14 µL) of graphene and measured their electrochemical signal towards NO2− oxidation. The modification led to the increase of both faradaic and capacitive currents and the optimum amount was found to be 10 µL (see Figure S1 in Supplementary Materials). The electrochemical performances of bare GC and EGr/GC electrodes towards the nitrite electrochemical detection and quantification were tested and compared.
3. Results and Discussions
3.1. Morphological and Structural Characterization of Graphene Sample
The morphological characteristics of graphene sample, such as the lateral dimensions of the sheets and their transparency, were investigated by SEM/TEM techniques. In Figure 1a,b, two representative SEM micrographs are shown, which clearly indicate that the sample contains flakes with lateral size ranging from hundreds of nm to a few micrometers. The basal planes of the large flakes can be visualized as grey and smooth areas, whereas the edges of the flakes appear as bright lines. The transparency of the flakes proves the successful exfoliation of graphite rods and also confirms that graphene is composed of few-layer and multi-layer sheets (see the TEM micrograph in Figure 1c). The TEM technique uses electrons that pass through the sample, so multiple sheets appear darker relative to single sheets. The flakes are not only thin but also randomly oriented, generating a porous layer when deposited on top of a solid substrate. As expected, the layer porosity increases the active area of the modified electrode, leading to an increase of the electrochemical signal. Besides the morphological aspects of graphene, the structural characteristics were also evaluated by XRD and Raman spectroscopy.
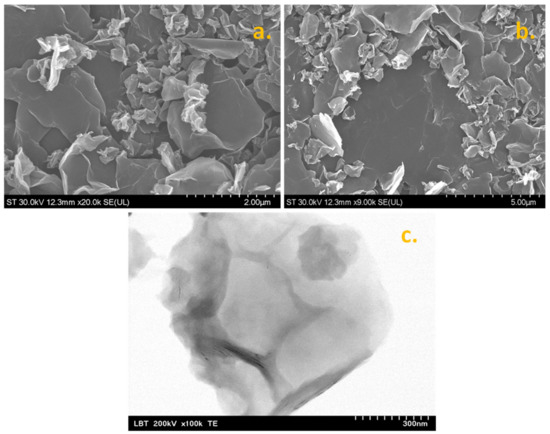
Figure 1.
SEM micrographs of synthesized graphene powder (a,b); TEM micrograph of graphene flakes (c).
The XRD pattern of the sample is presented in Figure 2 and reveals three important peaks attributed to the reflections of graphene oxide (GO) layers (around 9°), few-layers graphene (FLG; around 21°), and finally multi-layers graphene (MLG; around 26°). As can be seen in the inset of Figure 2, the identified structures have different values for the d spacing (the distance between two adjacent layers), such as 0.975 nm for GO, 0.412 nm for FLG and 0.377 nm for MLG. The high value observed for GO may be attributed to the abundance of oxygen-containing groups attached to graphene layers, which keeps the layers apart. In the case of FLG and MLG, the number of functional groups is smaller and so is the d value. It is important to mention that the majority of MLG flakes were removed during the filtration procedure on Whatman qualitative paper, so their amount in the sample is small (5.22%). FLG is predominant within the sample (73.25%), while GO is 21.53%. The other structural parameters determined for graphene sample are also presented in the inset table: the mean size of graphene crystallite (D) and the average number of layers present within the graphene crystallites (n) [43].
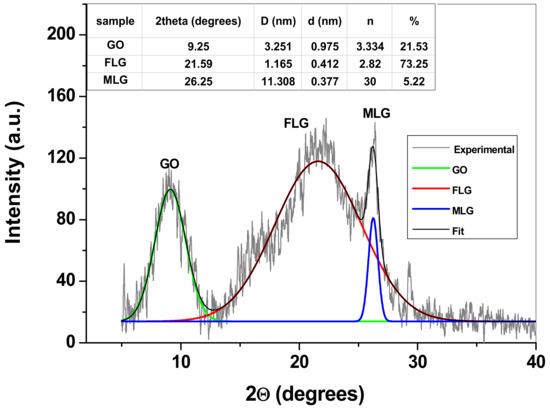
Figure 2.
The recorded XRD pattern of graphene sample (background subtracted). Inset table: The structural parameters of graphene crystallites.
Raman spectroscopy was additionally employed to investigate the structural disorder degree in the employed graphene sample. In Figure 3, the recorded Raman spectrum is presented, which exhibits all the characteristic bands of graphene: the defect band (D) at ~1350 cm−1 is the most intense and appears due to the structural defects present in the sp2 hybridized carbon network; the graphite band (G) at ~1568 cm−1 is characteristic of graphitic structures and is generated by the in-plane vibration mode of the sp2 hybridized carbon network; at ~2700 cm−1 is the 2D band, which is a second-order overtone of different in-plane vibrations; at ~2900 cm−1 is the D + G band, which is a combination of scattering peaks. As can be seen in Figure 3, the intensity of the D band is higher than that of the G band (ID/IG = 1.087), which correlates well with the presence of defects in the graphene lattice. Such defects may be generated by the oxygen-containing groups from graphene oxide which, according to the XRD pattern, represents ~21.5% of the sample. According to the work of Cançado et al. [44], the ID/IG ratio may be related to the in-plane crystallite size (La) of graphene (as expressed by Equation (1)) and indicates the magnitude of the defect-free domains:
where El represents the laser excitation energy (2.33 eV).
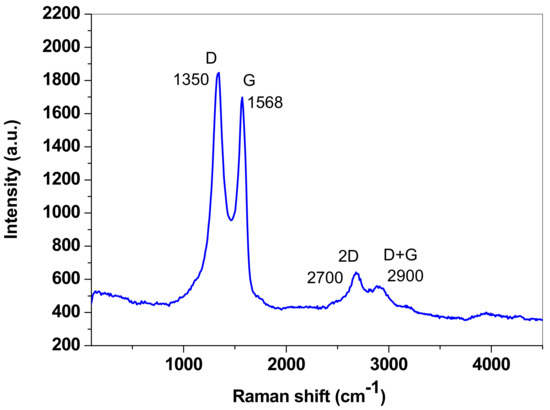
Figure 3.
The Raman spectrum of the graphene sample.
For the synthesized graphene sample, La was determined to be 17.46 nm.
3.2. Electrochemical Studies with GC and EGr/GC Electrodes
Before the investigation of the electro-catalytic properties of EGr/GC electrode towards NO2− oxidation, the active area of the graphene-modified electrode was determined and compared with that of the bare GC electrode. Hence, cyclic voltammograms were recorded with different scanning rates (from 2 to 100 mV/s) in the presence of 10−3 M K4[Fe(CN)6] (0.2 M KCl supporting electrolyte). Using the Randles–Ševcik equation [45] and, respectively, the Ip versus υ1/2 plot, the active area was calculated (see Figure S2a,b in the Supplementary Materials). The Ip versus υ1/2 plot was fit by the following linear regression equation: Ip = 2.11 × 10⁻⁷ + 3.11 × 10⁻⁵ × υ1/2 (R2 = 0.996) and, from the corresponding slope, the EGr/GC area was determined to be 0.049 cm2. As expected, the value was considerably larger than that obtained for bare GC electrode (0.028 cm2), due to the porous morphology of the graphene layer.
Next, the experiments were focused on studying the effect of the pH solution on the electrochemical response of the EGr/GC electrode towards NO2− oxidation (10−3 M). The influence was studied by cyclic voltammetry, within the 3.6–8.0 pH range. As can be seen in Figure 4, both the peak current and the peak potential are affected by the pH. In the case of peak current (Ip), its value increased with the increase of pH up to pH 5.0, then began to decrease (see Figure 5a). On the other hand, the peak potential (Ep) strongly decreased in acidic solution (pH 3.6–pH 5.0), then kept an almost constant value between pH 6.0 and pH 8.0 (see Figure 5b). According to the literature, in acidic solution the nitrite anions are protonated (HNO2) due to their low pKa value (3.3) [46] and so protons may be involved in the electro-oxidation process. At higher pH (>5.0), the shortage of protons will make the oxidation of nitrite more difficult and, consequently, the peak current decreases. Therefore, acetate buffer of pH 5.0 was selected as the optimum electrolyte for the detection and determination of nitrite in laboratory and real solutions.
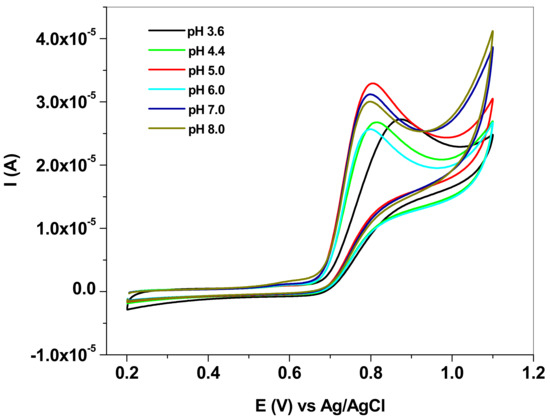
Figure 4.
Cyclic voltammograms recorded with EGr/GC electrode in solutions of various pHs (3.6–8.0), each containing 10−3 M sodium nitrite (NaNO2); 10 mV/s scan rate.
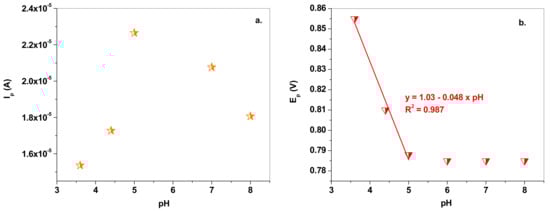
Figure 5.
(a) Variation of peak current (Ip) with the pH solution; (b) variation of the peak potential (Ep) with the pH solution.
Since the NO2− oxidation is an irreversible process (no peak in the reverse scan), the Laviron equation [47] may be used to determine the number of electrons involved in the reaction. Equation (2) shows the variation of the peak potential, Ep, with the natural logarithm of the scan rate, lnυ, for irreversible reactions (oxidation) when employing the linear sweep voltammetry technique.
where αa is the charge transfer coefficient, ks is the standard rate constant of the surface reaction, n is the number of electrons involved in the reaction and E0′ is the formal potential.
LSVs were recorded in pH 5.0 acetate solution containing 10−3 M NaNO2 at various scanning rates, from 2 to 100 mV/s. Based on the Ep vs. lnυ plot and the linear regression equation (Ep = 0.899 + 0.023 × lnυ), we determined the value of (1−αa)n from the corresponding slope (Figure 6). Assuming that, for a totally irreversible electrode process, αa is ~0.5, the number of electrons involved in the oxidation of nitrite is equal to two. As previously reported by Ma et al. [48], the electrochemical oxidation process of NO2− at EGr/GC electrode in acidic solution follows the mechanism (Equation (3)):
NO2− + H2O -------> NO3− + 2H+ + 2e−
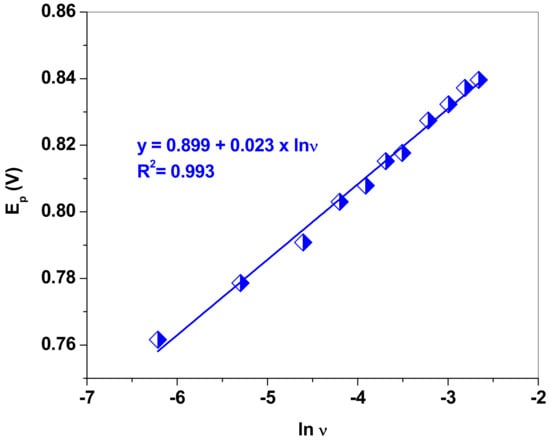
Figure 6.
The dependence of the peak potential (Ep) versus the natural logarithm of scan rate (lnυ) for the EGr/GC electrode.
In order to evidence the electro-catalytic properties of the EGr/GC electrode towards NO2− oxidation, CV measurements were recorded with bare and graphene-modified electrodes and the results are presented in Figure 7 (10−3 M NaNO2 in pH 5.0 acetate buffers; 10 mV/s scan rate). It is worth mentioning that, in the case of the bare GC electrode (blue curve), the oxidation peak is small and broad and appears at very high potential (+1.18 V). In contrast, the EGr/GC electrode exhibits a considerably higher electrochemical peak (three times higher) and the peak potential is shifted towards lower values (+0.8 V). Such behavior confirms that the graphene layer has an important role in promoting the electron transfer from the solution containing NO2− anions to the glassy-carbon surface.
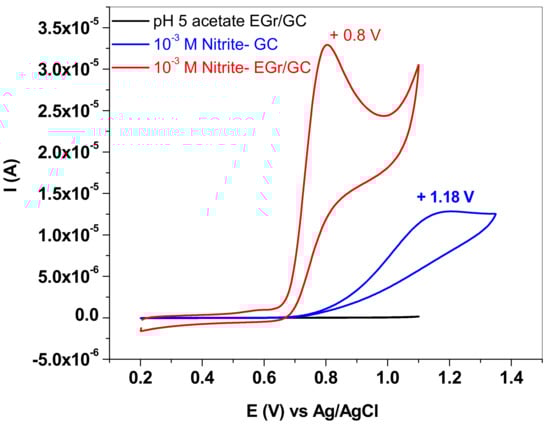
Figure 7.
CVs recorded with bare and graphene-modified electrode (blue and red curve, respectively) in solution containing 10−3 M sodium nitrite in pH 5.0 acetate; 10 mV/s scan rate.
Next, the electrochemical parameters for NO2− detection were determined by employing the SWV technique. This technique is more sensitive in comparison with the classical cyclic voltammetry, due to the elimination of the capacitive current. Figure 8a presents the SW voltammograms recorded with a graphene-modified electrode in solutions containing various concentrations of sodium nitrite (3 × 10⁻⁷–10−3 M NaNO2; pH 5.0 acetate; 10 mV/s scan rate). The inset of the figure shows the signals recorded at very low concentrations (e.g., 3 × 10⁻⁷ and 6 × 10⁻⁷ M). In these cases, the peak potential is slightly shifted towards higher potentials (+0.88 V), which is a normal behavior for an irreversible process.
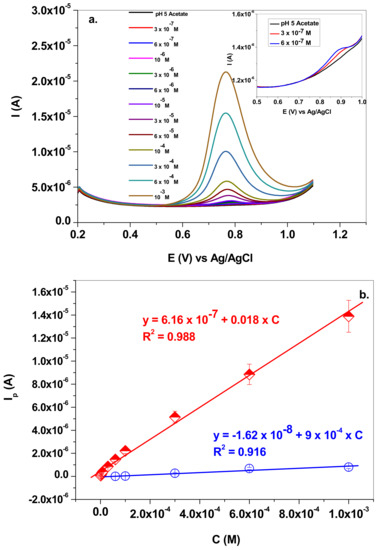
Figure 8.
(a) SW voltammograms recorded with graphene-modified electrode in solutions containing various concentrations of sodium nitrite (3 × 10⁻⁷–10−3 M) in pH 5.0 acetate; 10 mV/s scan rate; (b) corresponding calibration plot (EGr/GC—red curve) in comparison with that obtained for bare GC electrode (blue curve).
The corresponding calibration plot is presented in Figure 8b, in comparison with that obtained for the bare GC electrode. The linear regression equations corresponding to each electrode are: Ip = 6.16 × 10⁻⁷ + 0.018 × C (R2 = 0.988) for EGr/GC; and Ip = −1.62 × 10⁻⁸ + 9 × 10⁻⁴ × C (R2 = 0.916) for bare GC. For the graphene-modified electrode, the linear range was 3 × 10⁻⁷–10−3 M, the sensitivity was determined to be 0.018 A/M, the limit of quantification (LOQ) was 3 × 10⁻⁷ M and the limit of detection (LOD) was 9.9 × 10⁻⁸ M. As expected, the bare GC electrode had considerably lower performances, such as: linear range: 6 × 10⁻⁵–10−3 M; sensitivity 9 × 10⁻⁴ A/M; limit of quantification (LOQ) 6 × 10⁻⁵ M; and limit of detection (LOD) 1.82 × 10⁻⁵ M.
Similar results were obtained by employing the amperometric technique and the recorded signals and calibration plots are presented in Figure 9a,b. In this case, the linear range for EGr/GC electrode was also wide, from 3 × 10⁻⁷ to 4 × 10⁻⁴ M NaNO2, the limit of quantification (LOQ) was 3 × 10⁻⁷ M, the sensitivity was 0.018 A/M and the detection limit (LOD) was 9.09 × 10⁻⁸ M. The detection limit was calculated by dividing the limit of quantification by 3.3. For plotting of the calibration curves, we employed background subtracted signals. As observed in the case of the SW technique, the sensitivity of the EGr/GC electrode was two orders of magnitude higher than that of the bare GC, demonstrating the advantages of using graphene-modified electrodes in the electrochemical detection of nitrite ions.
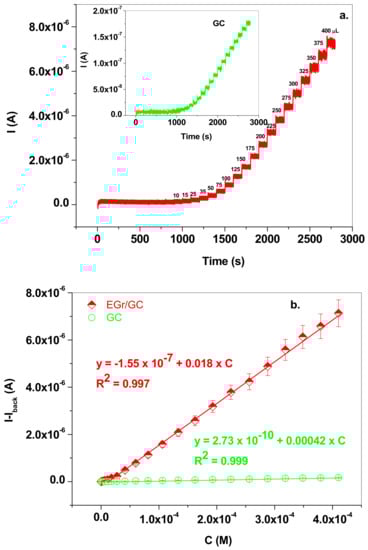
Figure 9.
(a) Amperometric signals recorded with EGr/GC (red; +0.8 V applied potential) and GC (inset, green; +1.18 V applied potential) electrodes after the addition of NaNO2 from 10−3 M stock solution in supporting electrolyte of pH 5.0; the concentration range was from 3 × 10⁻⁷ to 4 × 10⁻⁴ M for EGr/GC electrode and from 3.3 × 10⁻⁶ to 4 × 10⁻⁴ M for bare GC; (b) The corresponding calibration curves for EGr/GC (red) and GC (green) electrodes, using background subtracted signals (b).
The performances of the EGr/GC electrode towards nitrite detection were compared with those of other modified electrodes reported in the literature (Table 1). With few exceptions, the performances are similar, or even better, both in terms of linear range and limit of detection.

Table 1.
Performance evaluation of various modified electrodes for nitrite detection.
In order to prove the selectivity of the EGr/GC electrode towards NO2− detection different interfering species were employed (Figure 10). The amperometric signal recorded at a potential of +0.8 V indicates that Na2CO3, MgCl2, MgSO4, Mg(NO3)2 had no effect on the electrochemical signal of the NO2− specie. NaCl slightly decreased the NO2− signal, while ascorbic acid increased the signal.
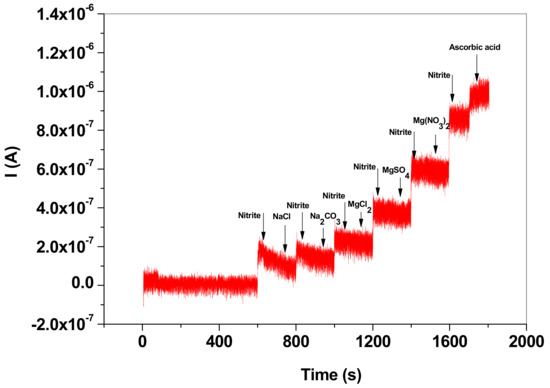
Figure 10.
Amperometric signal recorded with EGr/GC electrode in the presence of nitrite and interfering species: NaCl, Na2CO3, MgCl2, MgSO4, Mg(NO3)2 and ascorbic acid; the interfering species had a concentration of 10−5 M (+0.8 V applied potential; pH 5.0 acetate buffer).
Based on the fact that the electrode exhibited excellent electro-catalytic properties, it was further used for the determination of nitrite in mineral waters. Two commercial waters were employed, bought from a local supermarket. According to the label, the first one contains the minerals (mean value; mg/L): Ca2+ (73.65); Mg2+ (3.101); Na+ (8.655); HCO3 (250.1); SO4− (<40); Cl− (16.379); K+ (1.078); and NO2− (<0.05). The following procedure was employed to determine the NO2− concentration from the water. First, the water pH was brought to pH 5.0, after the addition of the corresponding amounts of acetic acid (0.2 M) and sodium acetate (0.2 M). The electrochemical signal of NO2− was recorded in the mineral water solution and its concentration was denoted as Cx1. Next, four beakers were filled with mineral water and increasing volumes (50; 80; and 100 µL) of NaNO2 stock solution (10−3 M). The final volume in each beaker was 10 mL and the added NaNO2 concentrations were denoted as C1, C2 and C3, respectively. The corresponding SW electrochemical signals were also recorded and the peak current was represented as a function of NaNO2 added concentrations (Figure 11a,b). In this case, Cx1 was found to be 5.21 × 10⁻⁷ M, which corresponds to 0.023 mg/L NO2−, in excellent agreement with the mineral water label (NO2− < 0.05 mg/L).
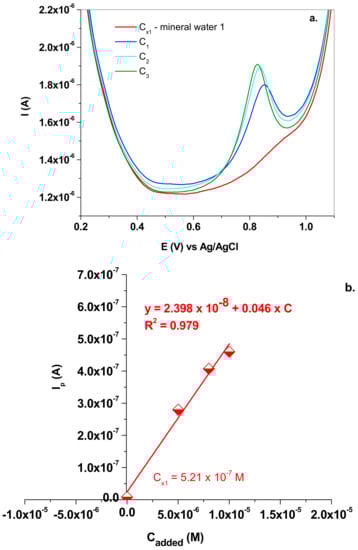
Figure 11.
(a) SW voltammograms recorded in mineral water 1 (Cx1) and in solutions containing the added NaNO2 (C1; C2 and C3); 10 mV/s scan rate; (b) the standard addition plot which allowed the determination of Cx1.
The same procedure was applied in the case of the second mineral water, which contained the following minerals (mean value; mg/L): Na+ (2); K+ (1.4); Mg2+ (2.4); Ca2+ (9.2); F− (<0.03); Cl− (<5); SO4− (6.2); HCO3 (42.7); NO2− (<0.01); NO3 (4.29).
The SW voltammograms can be seen in Figure 12a and the corresponding addition plot in Figure 12b. In this case, Cx2 was determined to be 9.3 × 10⁻⁷ M, which corresponds to 0.04 mg/L NO2−.
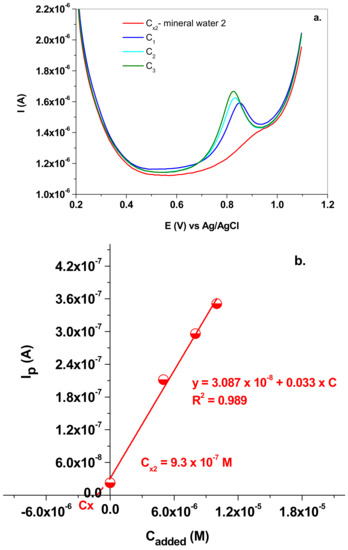
Figure 12.
(a) SW voltammograms recorded in mineral water 2 (Cx2) and in solutions containing the added NaNO2 (C1; C2 and C3); 10 mV/s scan rate; (b) the standard addition plot which allowed the determination of Cx2.
To further check the accuracy of the electrochemical method, the UV-Vis colorimetric method was complementarily used. Since NaNO2 solution has no absorption peak in the visible range, the MQuant® Nitrite Test (Merck) was employed. The test is based on the reaction between nitrite and sulphanilic acid, which forms a diazonium cation. The cation subsequently couples to the aromatic amine 1-naphthylamine and produces a red-violet azo dye with absorption at λmax = 540 nm. In the case of the first mineral water, the spectrophotometric method indicated that Cx1(UV) = 6.21 × 10⁻⁷ M, while for the second mineral water Cx2(UV) = 7 × 10⁻⁷ M (Figures S3 and S4 in Supplementary Materials).
4. Conclusions
A graphene sample was prepared by electrochemical exfoliation of graphite rods in an electrochemical cell filled with the appropriate solution: 0.05 M (NH4)2SO4 + 0.1 M H3BO3 + 0.05 M NaCl. After preparation, the optimum volume (10 µL) of graphene dispersed in DMF (2 mg/mL concentration) was deposited on top of a glassy carbon electrode (EGr/GC) and then tested towards nitrite detection, in laboratory solutions and real samples. The reported results indicated that the developed graphene-based electrochemical sensor is a reliable and highly sensitive tool for nitrite assay in waters, since it displayed excellent stability and reproducibility, exhibiting a low limit of detection (9.09 × 10⁻⁸ M). Since the developed sensing platform is able to detect, with a high degree of accuracy and reliability low nitrite concentrations, it may be further used to monitor nitrite levels in both industrial and environmental conditions and provide a necessary tool in the prevention of water pollution.
Supplementary Materials
The following supporting information can be downloaded at: https://www.mdpi.com/article/10.3390/nano13091468/s1, Figure S1: Variation of nitrite peak current with the amount of graphene deposited on top of GC electrode (10−3 M NaNO2 solution (pH 5); 2 mg/mL graphene in DMF); Figure S2: Cyclic voltammograms recorded with various scan rates (from 2 to 100 mV/s) in solution containing 10−3 M potassium ferrocyanide (0.2 M KCl supporting electrolyte) (a); Ip versus υ1/2 plot, which allowed the determination of the active area (b); Figure S3: UV-Vis spectra recorded in mineral water 1 (Cx1) and in solutions containing mineral water 1 and the added NaNO2 volumes of 10−3 M stock solution (10; 30 and 50 µL corresponding to C1; C2 and C3 concentrations, respectively); one spoon (75 mg) of MQuant® Nitrite Test powder was added in each beaker to color the solutions (a); the standard addition plot which allowed the determination of Cx1 (b); Figure S4: UV-Vis spectra recorded in mineral water 2 (Cx2) and in solutions containing mineral water 2 and the added NaNO2 volumes of 10−3 M stock solution (10; 30 and 50 µL corresponding to C1; C2 and C3 concentrations, respectively); one spoon (75 mg) of MQuant® Nitrite Test powder was added in each beaker to color the solutions (a); the standard addition plot which allowed the determination of Cx2 (b).
Author Contributions
Investigation and formal analysis, F.P. and C.V.; projects funding, C.V. and L.M.; writing—review and editing, L.M. and S.P. All authors have read and agreed to the published version of the manuscript.
Funding
This work was supported by grants from the Ministry of Research, Innovation and Digitization, CNCS/CCCDI—UEFISCDI, projects number PN-III-P2-2.1-PED-2019-2410 (500PED/2021) and PN-III-P1-1.1-TE-2021-0358 and through the ‘Nucleu’ Program within the National Plan for Research, Development and Innovation 2022–2027, project number PN 23 24 03 01.
Data Availability Statement
Data will be provided upon reasonable request to the corresponding author.
Acknowledgments
The authors are grateful to Alexandru Turza and Bogdan Ionut Cozar for XRD and Raman measurements, respectively. They are also grateful to Septimiu Tripon for SEM analysis of graphene sample and to Lucian Barbu Tudoran for TEM analysis of graphene sample.
Conflicts of Interest
The authors declare no conflict of interest. The funders had no role in the design of the study; in the collection, analyses, or interpretation of data; in the writing of the manuscript; or in the decision to publish the results.
References
- Kuypers, M.; Marchant, H.; Kartal, B. The microbial nitrogen-cycling network. Nat. Rev. Microbiol. 2018, 16, 263–276. [Google Scholar] [CrossRef] [PubMed]
- Galloway, J.N.; Townsend, A.R.; Erisman, J.W.; Bekunda, M.; Cai, Z.; Freney, J.R.; Martinelli, L.A.; Seitzinger, S.P.; Sutton, M.A. Transformation of the Nitrogen Cycle: Recent Trends, Questions, and Potential Solutions. Science 2008, 320, 889–892. [Google Scholar] [CrossRef]
- Mateo-Sagasta, J.; Marjani Zadeh, S.; Turral, H. More People, More Food, Worse Water? A Global Review of Water Pollution from Agriculture; FAO: Rome, Italy, 2018. [Google Scholar]
- Camargo, J.A.; Alonso, Á. Ecological and toxicological effects of inorganic nitrogen pollution in aquatic ecosystems: A global assessment. Environ. Int. 2006, 32, 831–849. [Google Scholar] [CrossRef] [PubMed]
- Bailey, S.J.; Vanhatalo, A.; Winyard, P.G.; Jones, A.M. The nitrate-nitrite-nitric oxide pathway: Its role in human exercise physiology. Eur. J. Sport Sci. 2012, 12, 309–320. [Google Scholar] [CrossRef]
- Howarth, R.W. Human acceleration of the nitrogen cycle: Drivers, consequences, and steps toward solutions. Water Sci. Technol. 2004, 49, 7–13. [Google Scholar] [CrossRef]
- Usher, C.D.; Telling, G.M. Analysis of nitrate and nitrite in foodstuffs. J. Sci. Food Agric. 1975, 26, 1793–1805. [Google Scholar] [CrossRef]
- Hosseini, F.; Majdi, M.; Naghshi, S.; Sheikhhossein, F.; Djafarian, K.; Shab-Bidar, S. Nitrate-nitrite exposure through drinking water and diet and risk of colorectal cancer: A systematic review and meta-analysis of observational studies. Clin. Nutr. 2021, 40, 3073–3081. [Google Scholar] [CrossRef]
- González-Soltero, R.; Bailén, M.; de Lucas, B.; Ramírez-Goercke, M.I.; Pareja-Galeano, H.; Larrosa, M. Role of Oral and Gut Microbiota in Dietary Nitrate Metabolism and Its Impact on Sports Performance. Nutrients 2020, 12, 3611. [Google Scholar] [CrossRef]
- Said Abasse, K.; Essien, E.E.; Abbas, M.; Yu, X.; Xie, W.; Sun, J.; Akter, L.; Cote, A. Association between Dietary Nitrate, Nitrite Intake, and Site-Specific Cancer Risk: A Systematic Review and Meta-Analysis. Nutrients 2022, 14, 666. [Google Scholar] [CrossRef]
- Essien, E.E.; Said Abasse, K.; Côté, A.; Mohamed, K.S.; Baig, M.M.F.A.; Habib, M.; Naveed, M.; Yu, X.; Xie, W.; Jinfang, S.; et al. Drinking-water nitrate and cancer risk: A systematic review and meta-analysis. Arch. Environ. Occup. Health 2022, 77, 51–67. [Google Scholar] [CrossRef]
- Barry, K.H.; Jones, R.R.; Cantor, K.P.; Beane Freeman, L.E.; Wheeler, D.C.; Baris, D.; Johnson, A.T.; Hosain, G.M.; Schwenn, M.; Zhang, H.; et al. Ingested Nitrate and Nitrite and Bladder Cancer in Northern New England. Epidemiology 2020, 31, 136–144. [Google Scholar] [CrossRef] [PubMed]
- Brender, J.D.; Werler, M.M.; Kelley, K.E.; Vuong, A.M.; Shinde, M.U.; Zheng, Q.; Huber, J.C.; Sharkey, J.R.; Griesenbeck, J.S.; Romitti, P.A.; et al. Nitrosatable Drug Exposure During Early Pregnancy and Neural Tube Defects in Offspring: National birth defects prevention study. Am. J. Epidemiol. 2011, 174, 1286–1295. [Google Scholar] [CrossRef] [PubMed]
- McNulty, R.; Kuchi, N.; Xu, E.; Gunja, N. Food-induced methemoglobinemia: A systematic review. J. Food Sci. 2022, 87, 1423–1448. [Google Scholar] [CrossRef] [PubMed]
- World Health Organization. Guidelines for Drinking Water Quality: Fourth Edition Incorporating the First and Second Addenda, 4th ed + 1st add + 2nd add; World Health Organization: Geneva, Switzerland, 2022; License: CC BY-NC-SA 3.0 IGO, ISBN 9789240045064 (electronic version), 9789240045071 (print version); Available online: https://apps.who.int/iris/handle/10665/352532 (accessed on 15 March 2023).
- SCF (Scientific Committee for Food), Thirty-Eighth Series (1997) (No Catalogue: GT 07 97620-EN-DE-FR), Opinions on: Nitrate and Nitrite. Available online: https://food.ec.europa.eu/system/files/2020-12/sci-com_scf_reports_38.pdf (accessed on 15 March 2023).
- Singh, P.; Singh, M.K.; Beg, Y.R.; Nishad, G.R. A review on spectroscopic methods for determination of nitrite and nitrate in environmental samples. Talanta 2019, 191, 364–381. [Google Scholar] [CrossRef]
- Wang, H.; Wan, N.; Ma, L.; Wang, Z.; Cui, B.; Han, W.; Chen, Y. A novel and simple spectrophotometric method for detection of nitrite in water. Analyst 2018, 143, 4555–4558. [Google Scholar] [CrossRef]
- Jireš, J.; Douša, M. Nitrites as precursors of N-nitrosation in pharmaceutical samples—A trace level analysis. J. Pharm. Biomed. Anal. 2022, 213, 114677. [Google Scholar] [CrossRef]
- Lin, S.-L.; Hsu, J.-W.; Fuh, M.-R. Simultaneous determination of nitrate and nitrite in vegetables by poly(vinylimidazole-co-ethylene dimethacrylate) monolithic capillary liquid chromatography with UV detection. Talanta 2019, 205, 120082. [Google Scholar] [CrossRef]
- Wang, X.-F.; Fan, J.-C.; Ren, R.; Jin, Q.; Wang, J. Rapid determination of nitrite in foods in acidic conditions by high-performance liquid chromatography with fluorescence detection. J. Sep. Sci. 2016, 39, 2263–2269. [Google Scholar] [CrossRef]
- Gottardo, R.; Taus, F.; Pigaiani, N.; Bortolotti, F.; Lonati, D.; Scaravaggi, G.; Locatelli, C.A.; Tagliaro, F. Intentional and unintentional nitrite intoxications: A novel diagnostic strategy based on the direct ion determination by capillary electrophoresis. Toxicol. Anal. Clin. 2022, 34, S26. [Google Scholar] [CrossRef]
- Wang, Q.-H.; Yu, L.-J.; Liu, Y.; Lin, L.; Lu, R.-G.; Zhu, J.-P.; He, L.; Lu, Z.-L. Methods for the detection and determination of nitrite and nitrate: A review. Talanta 2017, 165, 709–720. [Google Scholar] [CrossRef]
- Yang, Y.; Lei, Q.; Li, J.; Hong, C.; Zhao, Z.; Xu, H.; Hu, J. Synthesis and enhanced electrochemical properties of AuNPs@MoS2/rGO hybrid structures for highly sensitive nitrite detection. Microchem. J. 2022, 172, 106904. [Google Scholar] [CrossRef]
- Lin, Z.; Cheng, S.; Li, H.; Li, L. A novel, rapidly preparable and easily maintainable biocathode electrochemical biosensor for the continuous and stable detection of nitrite in water. Sci. Total Environ. 2022, 806, 150945. [Google Scholar] [CrossRef] [PubMed]
- Magerusan, L.; Pogacean, F.; Pruneanu, S. Enhanced Acetaminophen Electrochemical Sensing Based on Nitrogen-Doped Graphene. Int. J. Mol. Sci. 2022, 23, 14866. [Google Scholar] [CrossRef] [PubMed]
- Paisanpisuttisin, A.; Poonwattanapong, P.; Rakthabut, P.; Ariyasantichai, P.; Prasittichai, C.; Siriwatcharapiboon, W. Sensitive electrochemical sensor based on nickel/PDDA/reduced graphene oxide modified screen-printed carbon electrode for nitrite detection. RSC Adv. 2022, 12, 29491–29502. [Google Scholar] [CrossRef]
- Li, B.-Q.; Nie, F.; Sheng, Q.-L.; Zheng, J.-B. An electrochemical sensor for sensitive determination of nitrites based on Ag–Fe3O4–graphene oxide magnetic nanocomposites. Chem. Pap. 2015, 69, 911–920. [Google Scholar] [CrossRef]
- Radhakrishnan, S.; Krishnamoorthy, K.; Sekar, C.; Wilson, J.; Kim, S.J. A highly sensitive electrochemical sensor for nitrite detection based on Fe2O3 nanoparticles decorated reduced graphene oxide nanosheets. Appl. Catal. B 2014, 148–149, 22–28. [Google Scholar] [CrossRef]
- Yang, Z.; Zhou, X.; Yin, Y.; Xue, H.; Fang, W. Metal-organic framework derived rod-like Co@carbon for electrochemical detection of nitrite. J. Alloy Compd. 2022, 911, 164915. [Google Scholar] [CrossRef]
- Govindasamy, M.; Wang, S.-F.; Huang, C.-H.; Alshgari, R.A.; Ouladsmane, M. Colloidal synthesis of perovskite-type lanthanum aluminate incorporated graphene oxide composites: Electrochemical detection of nitrite in meat extract and drinking water. Microchim. Acta 2022, 189, 210. [Google Scholar] [CrossRef]
- Zhao, Z.; Zhang, J.; Wang, W.; Sun, Y.; Li, P.; Hu, J.; Chen, L.; Gong, W. Synthesis and electrochemical properties of Co3O4-rGO/CNTs composites towards highly sensitive nitrite detection. Appl. Surf. Sci. 2019, 485, 274–282. [Google Scholar] [CrossRef]
- Huang, S.-S.; Liu, L.; Mei, L.-P.; Zhou, J.-Y.; Guo, F.-Y.; Wang, A.-J.; Feng, J.-J. Electrochemical sensor for nitrite using a glassy carbon electrode modified with gold-copper nanochain networks. Microchim. Acta 2015, 183, 791–797. [Google Scholar] [CrossRef]
- Craciun, C.; Andrei, F.; Bonciu, A.; Brajnicov, S.; Tozar, T.; Filipescu, M.; Palla-Papavlu, A.; Dinescu, M. Nitrites Detection with Sensors Processed via Matrix-Assisted Pulsed Laser Evaporation. Nanomaterials 2022, 12, 1138. [Google Scholar] [CrossRef] [PubMed]
- Wang, T.; Xu, X.; Wang, C.; Li, Z.; Li, D. A Novel Highly Sensitive Electrochemical Nitrite Sensor Based on a AuNPs/CS/Ti3C2 Nanocomposite. Nanomaterials 2022, 12, 397. [Google Scholar] [CrossRef] [PubMed]
- Le, H.T.; Tran, D.T.; Kim, N.H.; Lee, J.H. Worm-like gold nanowires assembled carbon nanofibers-CVD graphene hybrid as sensitive and selective sensor for nitrite detection. J. Colloid Interface Sci. 2021, 583, 425–434. [Google Scholar] [CrossRef] [PubMed]
- Talbi, M.; Al-Hamry, A.; Teixeira, P.R.; Paterno, L.G.; Ali, M.B.; Kanoun, O. Enhanced Nitrite Detection by a Carbon Screen Printed Electrode Modified with Photochemically-Made AuNPs. Chemosensors 2022, 10, 40. [Google Scholar] [CrossRef]
- Ahmadi, M.T.; Bodaghzadeh, M.; Rahimian Koloor, S.S.; Petrů, M. Graphene Nanoparticle-Based, Nitrate Ion Sensor Characteristics. Nanomaterials 2021, 11, 150. [Google Scholar] [CrossRef] [PubMed]
- Singh, S.; Hasan, M.R.; Sharma, P.; Narang, J. Graphene nanomaterials: The wondering material from synthesis to applications. Sens. Int. 2022, 3, 100190. [Google Scholar] [CrossRef]
- Hernaez, M. Applications of Graphene-Based Materials in Sensors. Sensors 2020, 20, 3196. [Google Scholar] [CrossRef]
- Khan, M.A.; Ramzan, F.; Ali, M.; Zubair, M.; Mehmood, M.Q.; Massoud, Y. Emerging Two-Dimensional Materials-Based Electrochemical Sensors for Human Health and Environment Applications. Nanomaterials 2023, 13, 780. [Google Scholar] [CrossRef]
- Pogacean, F.; Coros, M.; Magerusan, L.; Mirel, V.; Turza, A.; Katona, G.; Staden, R.-I.; Pruneanu, S. Exfoliation of graphite rods via pulses of current for graphene synthesis: Sensitive detection of 8-hydroxy-2′-deoxyguanosine. Talanta 2018, 196, 182–190. [Google Scholar] [CrossRef]
- Warren, B.E. X-ray Diffraction, 1st ed.; Addison-Wesley: Reading, UK, 1969; pp. 27–40. ISBN 0486663175. [Google Scholar]
- Cançado, L.G.; Takai, K.; Enoki, T.; Endo, M.; Kim, Y.A.; Mizusaki, H.; Jorio, A.; Coelho, L.N.; Magalhães-Paniago, R.; Pimenta, M.A. General equation for the determination of the crystallite size La of nanographite by Raman spectroscopy. Appl. Phys. Lett. 2006, 88, 163106. [Google Scholar] [CrossRef]
- Zanello, P. Inorganic Electrochemistry: Theory, Practice and Application; The Royal Society of Chemistry: London, UK, 2003; ISBN 0-85404-661-5. [Google Scholar]
- Milczarek, G. Selective and sensitive detection of nitrite based on NO sensing on a polymer-coated rotating disc electrode. J. Electroanal. Chem. 2007, 610, 199–204. [Google Scholar] [CrossRef]
- Laviron, E. General expression of the linear potential sweep voltammogram in the case of diffusionless electrochemical systems. J. Electroanal. Chem. 1979, 101, 19–28. [Google Scholar] [CrossRef]
- Ma, X.; Miao, T.; Zhu, W.; Gao, X.; Wang, C.; Zhao, C.; Ma, H. Electrochemical detection of nitrite based on glassy carbon electrode modified with gold–polyaniline–graphene nanocomposites. RSC Adv. 2014, 4, 57842–57849. [Google Scholar] [CrossRef]
- Anindya, W.; Wahyuni, W.T.; Rafi, M.; Riza Putra, B. Electrochemical sensor based on graphene oxide/PEDOT:PSS composite modified glassy carbon electrode for environmental nitrite detection. Int. J. Electrochem. Sci. 2023, 18, 10003. [Google Scholar] [CrossRef]
- Han, Y.; Zhang, R.; Dong, C.; Cheng, F.; Guo, Y. Sensitive electrochemical sensor for nitrite ions based on rose-like AuNPs/MoS2/graphene composite. Biosens. Bioelectron. 2019, 142, 111529. [Google Scholar] [CrossRef]
- Dorovskikh, S.I.; Klyamer, D.D.; Fedorenko, A.D.; Morozova, N.B.; Basova, T.V. Electrochemical Sensor Based on Iron(II) Phthalocyanine and Gold Nanoparticles for Nitrite Detection in Meat Products. Sensors 2022, 22, 5780. [Google Scholar] [CrossRef]
- Wang, Z.; Liao, F.; Guo, T.; Yang, S.; Zeng, C. Synthesis of crystalline silver nanoplates and their application for detection of nitrite in foods. J. Electroanal. Chem. 2012, 664, 135–138. [Google Scholar] [CrossRef]
- Promsuwan, K.; Thavarungkul, P.; Kanatharana, P.; Limbut, W. Flow injection amperometric nitrite sensor based on silver microcubics-poly (acrylic acid)/poly (vinyl alcohol) modified screen printed carbon electrode. Electrochim. Acta 2017, 232, 357–369. [Google Scholar] [CrossRef]
- Rameshkumar, P.; Ramaraj, R. Electroanalysis of nitrobenzene derivatives and nitrite ions using silver nanoparticles deposited silica spheres modified electrode. J. Electroanal. Chem. 2014, 731, 72–77. [Google Scholar] [CrossRef]
- Menart, E.; Jovanovski, V.; Hočevar, S.B. Silver particle-decorated carbon paste electrode based on ionic liquid for improved determination of nitrite. Electrochem. Commun. 2015, 52, 45–48. [Google Scholar] [CrossRef]
Disclaimer/Publisher’s Note: The statements, opinions and data contained in all publications are solely those of the individual author(s) and contributor(s) and not of MDPI and/or the editor(s). MDPI and/or the editor(s) disclaim responsibility for any injury to people or property resulting from any ideas, methods, instructions or products referred to in the content. |
© 2023 by the authors. Licensee MDPI, Basel, Switzerland. This article is an open access article distributed under the terms and conditions of the Creative Commons Attribution (CC BY) license (https://creativecommons.org/licenses/by/4.0/).