Article

Effect of Manganese Distribution on Sensor Properties of SnO2/MnOx Nanocomposites

by
Rodion Eshmakov
1,
Darya Filatova
1,
Elizaveta Konstantinova
2 and
Marina Rumyantseva
1,*
1
Chemistry Department, Moscow State University, 119991 Moscow, Russia
2
Physics Department, Moscow State University, 119991 Moscow, Russia
*
Author to whom correspondence should be addressed.
Nanomaterials 2023, 13(9), 1437; https://doi.org/10.3390/nano13091437
Submission received: 30 March 2023 / Revised: 14 April 2023 / Accepted: 19 April 2023 / Published: 22 April 2023
(This article belongs to the Special Issue Synthesis and Applications of Nanostructured Gas Sensors)

Abstract

:
Nanocomposites SnO2/MnOx with various manganese content (up to [Mn]/[Sn] = 10 mol. %) and different manganese distribution were prepared by wet chemical technique and characterized by X-ray diffraction, scanning electron microscopy (SEM) with energy dispersive X-ray (EDX) analysis and mapping, IR and Raman spectroscopy, total reflection X-ray fluorescence, mass-spectrometry with inductive-coupled plasma (ICP-MS), X-ray photoelectron spectroscopy (XPS), electron paramagnetic resonance (EPR) spectroscopy. A different distribution of manganese between the volume and the surface of the SnO2 crystallites was revealed depending on the total Mn concentration. Furthermore, the identification of surface MnO2 segregation was performed via Raman spectroscopy. There is a strong dependence of the sensor signal toward CO and, especially, NO) on the presence of MnO2 surface segregation. However, manganese ions intruding the SnO2 crystal structure were shown to not almost effect on sensor properties of the material.

1. Introduction

SnO2 is a well-known material for resistive-type semiconductor gas sensors [1]. It is known that an increase in the SnO2 selectivity and sensor response toward various gases can be achieved by surface modification with catalytic oxides to obtain a composite [2]. Therefore, manganese oxides (MnO2, Mn2O3), which have high catalytic activity in redox reactions involving oxygen and its compounds [3,4], are of interest for use as SnO2 modifiers [5,6,7]. Among many methods of synthesis of SnO2-based materials, one of the simplest and easy to use are various modifications of the sol-gel technique [8,9,10], which provides materials with high specific surface area [11,12] due to small grain size and allows to use different ways of introducing a modifier to the blank SnO2 [13,14]. To prepare nanocomposites with SnO2 surface modified with manganese oxides but not bulk doping, it is logical to use the appropriate modification procedures, such as impregnation by a solution of manganese-containing compound with following annealing on air to decompose manganese precursor to oxide [15]. The choice of Mn-containing precursor is based on its thermal properties, solubility, and storage stability: many manganese salts [7,16] seem to be suitable as well as soluble in organic solvents manganese (III) acetylacetonate [17,18].
So, different ways of preparing SnO2/MnOx materials were suggested. At the same time, the structure and sensor properties of SnO2/MnOx composites have not been adequately studied. There are also controversial and arguable data characterizing such composites’ phase composition and manganese oxidation state. For example, SnO2/MnOx materials were prepared in the same manner in the works [8,11,12], but the ascribed oxidation state of manganese is different in all these articles and varies from +2 to +4. A very questionable conclusion about Mn2+ introduction in SnO2 lattice was made [8] in contradiction with known X-ray diffraction data: the observed lattice volume decreasing can’t be a consequence of the effect of Sn (IV) substitution by Mn (II) because of larger ionic radius of the latter one [19,20,21]. However, an exciting study of Mn2O3 solubility in SnO2 at 600 °C was performed [11], but these data were related to high Mn: Sn ratios. It seems the direct analysis of the chemical state of manganese in materials with low Mn content (less than dozens molar percent) is a complicated task, and numerous authors had a failure using traditional methods such as X-ray photoelectron spectroscopy [6,19].
The main aim of this work is to clarify microstructure parameters, the chemical state of elements and their distribution in materials based on sol-gel synthesized SnO2, which was modified by impregnation-annealing (at 300 °C) technique with MnOx using manganese(III) acetylacetonate as a manganese-containing precursor, with several contemporary analytical techniques (total reflection X-ray fluorescence, Raman, electron paramagnetic resonance, X-ray photoelectron spectroscopies, mass-spectroscopy with inductive-coupled plasma, etc.). Furthermore, such data are necessary to elucidate sensor properties of materials which were studied when detecting model gases CO and NO in dry air to reveal the role of manganese in sensor signal formation.

2. Materials and Methods

2.1. Materials Synthesis

2.1.1. Synthesis of Nanocrystalline SnO2

Nanocrystalline SnO2 was prepared by α-stannic acid precipitation from tin (IV) chloride aqueous solution with concentrated ammonia solution. A solution of NH3·H2O (13 M) was added dropwise into the water solution of SnCl4·5H2O (16.3 g, 0.3 M) with vigorous stirring until pH ~6 was reached. The synthesis was carried out at room temperature (RT). As a result, the following reaction took place:
SnCl 4 + 4 NH 3 · H 2 O + n 2 H 2 O SnO 2 · nH 2 O + 4 NH 4 Cl
The white dense gel-like precipitate was separated by centrifugation. Then it was washed ten times with 0.1 M NH4NO3 solution (to prevent peptization) and with distilled water until chloride ions were removed. An opalescence absence was verified by adding AgNO3 solution (0.01 M). Next, the SnO2·nH2O gel was dried at 50 °C for 24 h. The resulting glassy solid (6.8 g, yield 87%) was grounded to a powder state in an agate mortar and annealed in air at 300 °C for 24 h (sample name–SnO2_300, Table 1).

2.1.2. Synthesis of SnO2/MnOx Nanocomposites

The «impregnation and annealing» method obtained SnO2/MnOx nanocomposite as powders. Manganese (III) acetylacetonate (Mn(acac)3) used in the synthesis was prepared by a well-known procedure described in [22] and recrystallized by slow evaporation on air at RT from saturated solution in chloroform with the addition of ×5 excess of heptane. The mushy mixtures of SnO2 nanocrystalline powder and fresh manganese (III) acetylacetonate ethanolic solution were taken in Mn:Sn = 1:99 (sample name–SnO2_Mn1) and 10:90 (sample name–SnO2_Mn10) molar proportions, were dried at 50 °C and annealed at 300° C for 24 h.
Both samples were treated with hydrochloric and oxalic acids to remove manganese-containing segregation from the tin (IV) oxide surface. Weighed amounts (100 mg) of SnO2_Mn1 and SnO2_Mn10 were deposited into small test tubes, and 1.00 mL of saturated (at RT) H2C2O4 solution was added to each probe. Prepared suspensions were heated at 70 °C in an ultrasonic bath for 1 h. After that, 0.100 mL of HCl (conc.) was mixed with suspensions, and they were left for one night. Finally, precipitates were separated by centrifugation, washed with distilled water five times, and dried at 50 °C (sample names–SnO2_Mn1_w, SnO2_Mn10_w).

2.2. Materials Characterization

The thermal stability of manganese (III) acetylacetonate used for materials preparation was studied by thermogravimetry (TG) combined with differential scanning calorimetry (DSC) and mass-spectrometry (MS) using NETZSCH STA 409 PC thermobalance with NETZSCH QMS 403C MS system (NETZSCH-Gerätebau GmbH, Selb, Germany). Samples were heated in a corundum crucible from RT to 550 °C (5 °C/min) in the airflow (30 mL/min).
Fourier transforms infrared (FTIR) spectroscopy measurements were performed to check the completeness of Mn(acac)3 thermolysis on Frontier (Perkin Elmer Inc., Beaconsfield, UK) spectrometer in the transmission mode in the wavenumber range of 400–4000 cm−1 with a step of 1 cm−1. Samples (about 5 mg) were ground with 100 mg of potassium bromide (Aldrich, for FTIR analysis) and pressed into tablets 6 mm in diameter.
The Microstructure and morphology of prepared materials were investigated by scanning electron microscopy (SEM) with Zeiss Supra 40 FE-SEM microscope (Carl Zeiss, Inc., Oberkochen, Germany) with an in-lens detector. The accelerating voltage was set to 10 kV, and the aperture size was 30 microns.
The specific surface area (Ssurf) of nanocrystalline oxides was measured by low-temperature nitrogen adsorption using a Chemisorb 2750 instrument (Micromeritics, Norcross, GA, USA). The surface area is available for adsorption was calculated using the BET model (Brunauer, Emmett, Teller). The size of aggregates whose surface is available for gas adsorption (dBET) was calculated for each material in the approach of uniform spherical shape:
d BET = 6 ρ S surf
where ρ is the density of material (accepted equal to the blank SnO2—6.95 g/cm3).
The phase composition of the obtained materials was investigated by X-ray diffraction (XRD) with a DRON-4-07 (Burevestnik, St. Petersburg, Russia) and Rigaku D/MAX 2500 (Rigaku, Japan, Tokyo) diffractometers equipped with CuKα (λ = 1.5406 Ǻ) radiation source. Obtained diffraction patterns were processed using the STOE WinXPOW software (v. 1.06). The ICDD PDF2 database was used to identify the crystal phases. The SnO2 crystalline grain size (dXRD) was calculated using the Scherrer formula for (110), (101) and (111) diffraction maxima.
To clarify the manganese state in SnO2/MnOx materials, the phase composition and crystal structure of the synthesized samples were also studied by Raman spectroscopy. The studies were carried out without specific sample preparation on the i-Raman Plus spectrometer (B&W Tek, Plainsboro, NJ, USA) equipped with a BAC 151C microscope and 532 nm laser and Horiba LabRam Evolution Raman spectrometer (Horiba Ltd., Minami-ku, Kyoto, Japan) equipped with a single-mode CW-laser (633 nm, 170 mW) in the confocal microscope (Olympus, Shinjuku, Tokyo, Japan) scheme with a spatial amplification of ×50 and numeric aperture 0.25. During the measurements, only 25% of the maximum possible laser power was used. Spectra processing (baseline correction, peak fitting, and integration) was implemented with Origin Pro 2021 v. 9.8.0.200 software package.
Elemental composition mapping was performed using NVision 40 microscope (Carl Zeiss, Oberkochen, Germany) with an energy dispersive X-ray analyzer (EDX) X-MAX (Oxford Instruments, Abingdon, Oxfordshire, UK) at an accelerating voltage of 20 kV and aperture of 60 microns.
Total reflection X-ray fluorescence analysis (TXRF) was used to determine the elemental composition of SnO2_Mn1 and SnO2_Mn10. Sample SnO2-300 was taken as a control. The analysis was carried out with Bruker S2 Picofox TXRF spectrometer (Bruker Corporation, Billerica, MA, USA). Special techniques of sample preparation were used. To determine the total manganese content, the sample (6 mg) was dispersed in 0.100 mL of polyvinyl alcohol 0.3 g/L solution, 0.300 mL deionized water and 0.100 mL standard Co2+ solution with a concentration of 100 mg/L. A 0.005 mL probe of stirred suspension was taken, placed on a quartz support and dried before the measurements. An attempt to study the manganese distribution between the SnO2 surface and lattice was also made: first, weighed material (12 mg) was treated with 1.00 mL of saturated (at RT) oxalic acid solution in an ultrasonic bath for 1 h at 70 °C with followed addition of 0.100 mL of HCl (conc.) and kept for one night at RT. Second, the 0.400 mL probe was taken from the supernatant solution, and 0.100 mL of standard (Co2+ solution, 100 mg/L) was added to the specimen. A dried 0.005 mL droplet of this mixture was used to determine the amount of manganese in the MnOx segregation state.
The remaining manganese content in SnO2_Mn1_w and SnO2_Mn10_w samples (which appeared to contain manganese only in the SnO2 crystal structure) was studied by inductively coupled plasma mass spectrometry (ICP MS) on a quadrupole ICP mass spectrometer (Agilent 7500c: Agilent Technologies, Santa Clara, CA, USA), which was controlled with a PC using the ChemStation (version G1834B) software package (Agilent Technologies, Santa Clara, CA, USA). Sample SnO2-300 was taken as a blank. Measurements were performed for the 55Mn isotope. Before analysis, pre-weighed powders (10 mg) were entirely dissolved in the mixture of HF (conc.) and HCl (conc.) at a ratio of 1:2, respectively, using a two-steps program in closed-type microwave system (Milestone ETHOS Advanced Microwave Labstation, Milestone Srl, Sorisole (BG), Italy) with temperature and pressure control options. The working frequency of the system was 2455 MHz, and the radiated power was 800 W. In the first stage, samples were heated from room temperature to 200 °C for 30 min. Then in the second stage, the reached temperature was kept for 30 min else. The resulting solutions were diluted to a volume of 6 mL by adding deionized water. After that, the 0.100 mL sample probes were diluted 100 times with deionized water. The ICP MS single element standards (Mn) were prepared from the standard solution (High-Purity Standards, Charleston, SC, USA) with a 10 mg/L concentration. The solution of the control sample was used to measure the background signal.
The chemical state of elements (Sn, O, Mn) in SnO2-300 and SnO2_Mn1 was studied by X-ray photoelectron spectroscopy (XPS) using Omicron ESCA+ (Scienta Omicron, Uppsala, Sweden) spectrometer with monochromatized aluminum anode Al Kα (1486.6 eV) with neutralizer. The binding energy step was 0.1 eV/s. Transmittance energy was 20 eV. Spectra of C 1s (trace carbon), O 1s, Sn 3d, Mn 3s, and Mn 2p were recorded. Unifit v. 2006 was used for spectra processing by approximating Gaussian and Lorentzian peak functions combination and background fitting. No special sample preparation procedure was used before analysis.
Oxidative active centers on the surface of prepared materials were studied by thermo-programmed reduction with hydrogen (TPR-H2) on Chemisorb 2750 instrument (Micromeritics, Norcross, GA, USA) without specific sample preparation. Pre-weighed specimen (15–20 mg) was placed into a quartz flow test tube equipped with a thermocouple located in close proximity to the sample. The flow value 50 mL/min of Ar-H2 mixture (8% vol. H2) was set, and the temperature was raised by 10 °C/min till 800 °C. Hydrogen consumption during sample reduction was detected by a thermal conductivity detector (TCD) and recorded in arbitrary units. The volume of consumed hydrogen (VH2) was calculated by the following equation:
V H 2 = k × T 1 T 2 TCD m · dT
The proportion quotient k = 0.28 mL/(g·a.u.) was determined by calibration measurements of a standard Ag2O sample with H2 absorption of 96.55 mL/g at normal conditions. The ideal gas approximation was used to recalculate the amount of consumed H2 at real temperature and pressure.
Paramagnetic centers on the surface of the synthesized materials were investigated by electron paramagnetic resonance spectroscopy (EPR) with Bruker ELEXSYS-580 spectrometer (Bruker Corporation, Billerica, MA, USA) at working frequency 9.5 GHz and apparatus sensitivity 5·1010 spin/Gs. A standard sample with Mn2+ ions was used to determine the g-factor values. A reference sample of CuCl2·2H2O was used to calculate the concentrations of paramagnetic centers in the material. Theoretical spectra simulated in Easyspin software were used to prove the material’s qualitative and quantitative composition of spin centers. Experimental spectra were obtained at 298 K. Samples were analysed and diluted 100 times with blank SnO2 (SnO2-300).
Gas sensor properties of prepared materials (excepting SnO2_Mn10_w) toward CO and NO were investigated by measuring the resistance of thick films in situ in a flow cell under a controlled gas flow of 100 ± 0.1 mL/min. The gas mixture for measurements was prepared by dilution of certified gas mixtures (CO 2530 ppm in N2, NO 246 ppm in N2) with dry synthetic air (relative humidity RH about 1%) using a pure air generator (GChV-1,2-3,5; Chimelectronika, Moscow, Russia) and RRG-12 electron mass-flow controllers (Eltochpribor, Zelenograd, Moscow, Russia). The concentrations of NO in gas mixtures were additionally verified with a Teledyne API N500 CAPS NOX Analyzer (Teledyne API, Inc., San Diego, CA, USA). The sensor signal values were calculated as follows:
S = R air R gas R gas
where Rair is sample resistance in pure air, and Rgas is sample resistance in air, containing a preassigned concentration of target gas.
Sensitive layers were deposited on chips with platinum microheaters in the form of mushy dispersion in α-terpineol, which was evaporated into the air by heating the layer at 300 °C for 1 h. Heating control and resistance values reading were carried out automatically by a 4-channel analyzer with a measuring range from 1 to 1012 Ω at 1.3 V. Temperature and concentration signal dependencies were investigated. In the first case test gas mixture with constant concentration (CO 20 ppm; NO 4 ppm) was supplied to the flow cell alternatively with air (exposure time 15 min) at a fixed temperature for 1.5 h. The temperature was varied with a 30 °C step in the 30–300 °C. In the second case, the data were recorded at the constant pre-determined temperature, corresponding to maximum and stable sensor signal under various test gas concentrations (5, 10, 20, 50 and 100 ppm at 270 °C for CO; 0.5, 1, 2, 4 and 8 ppm at 270 °C for NO).
3. Results and Discussion

3.1. Suitability Test of Manganese(III) Acetylacetonate as a Source of MnOx Modificator for SnO2

According to the known crystallographic data, [23] synthesized manganese (III) acetylacetonate (Mn(acac)3) adopts δ-Mn(acac)3 structure, also named in Inorganic crystal structures database (ICSD) ACACMN23 as it illustrated on Figure S1 (Supplementary Information).
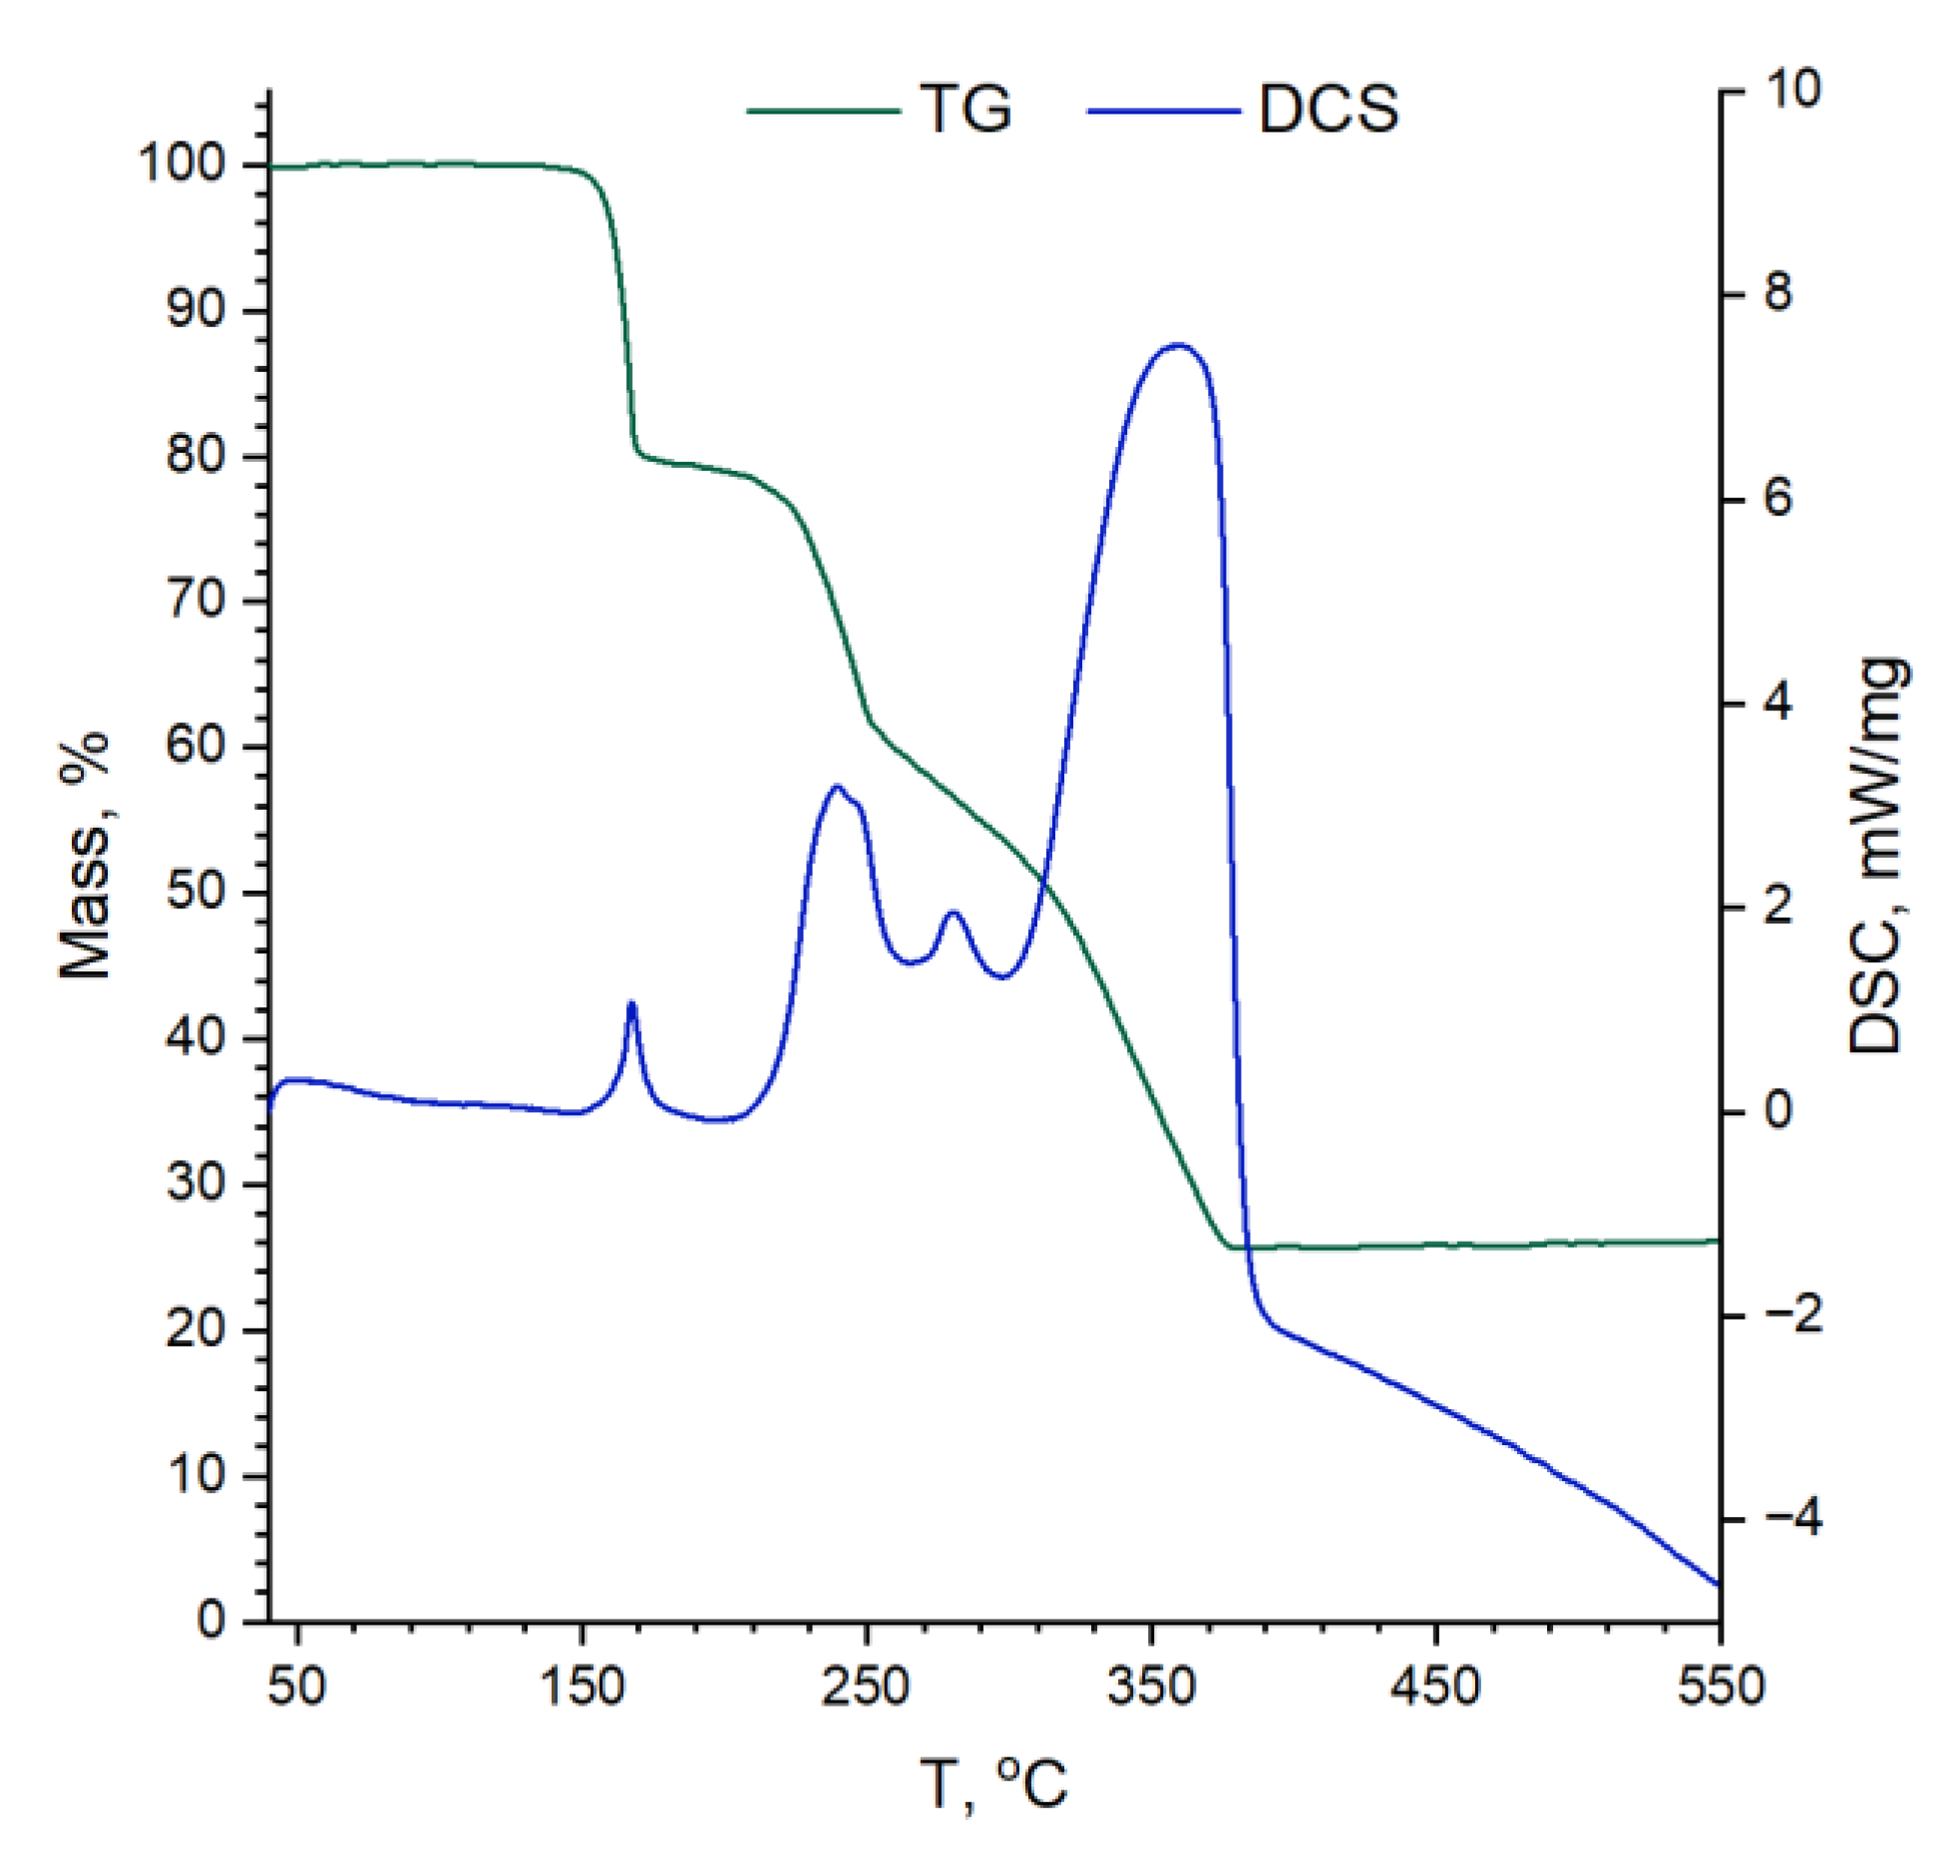
Thermogravimetry (TG) study jointed with differential scanning calorimetry (DCS) and mass-spectral (MS) detection of volatile decomposition products has shown that decomposition of Mn(acac)3 undergoes in 4 stages (Figure 1). Initially, about 20% of sample mass was lost rapidly in the temperature range of 140–160 °C that could be accounted for by one acetylacetonate-ligand loss and substituting it by oxo- or hydroxylic groups. During the next two slower stages (200–380 °C), nearly 75% of the weight was lost due to the formation of MnO2 mixed with the remaining carbon. Finally, in the last stage, it is slowly oxidized by air, which is proved by the appearance of a CO2+ (m/z = 44 g/mol) signal at a temperature above 380 °C. As demonstrated by DCS data, stages 1–3 are exothermic, and the latter one is endothermic.
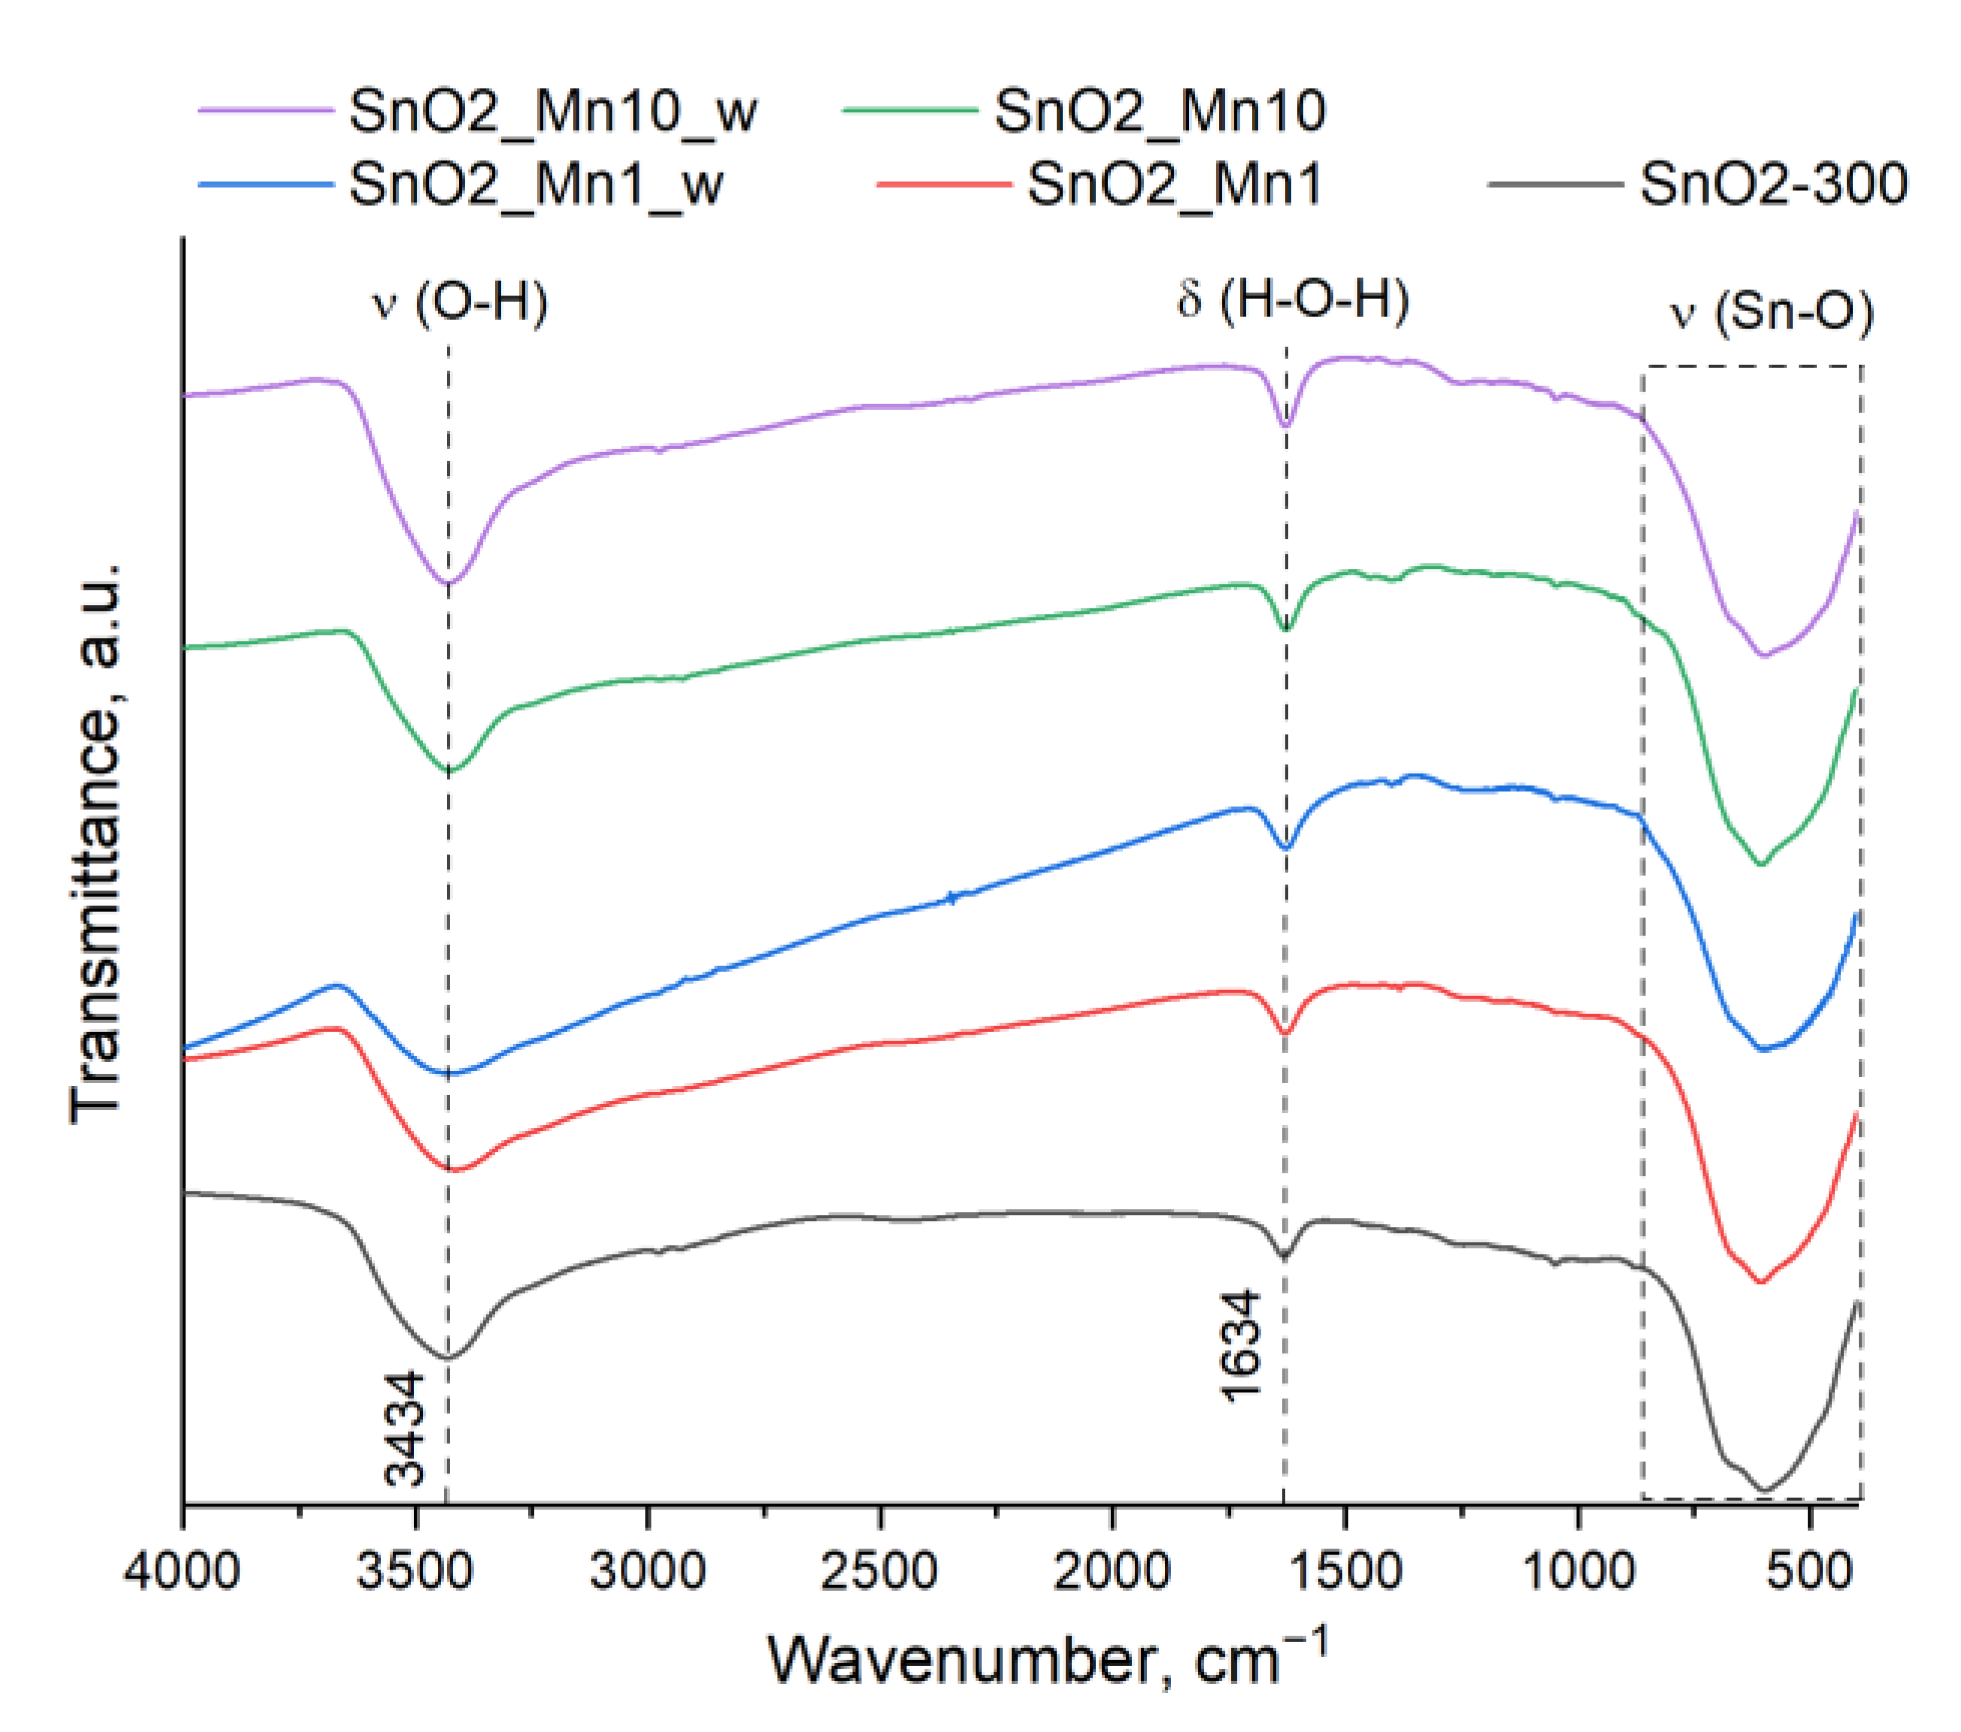
Fourier transforms infrared (FTIR) spectra of blank SnO2 and SnO2/MnOx powders (Figure 2) show the absence of characteristic bands for C-H-O organic compounds. The only strong absorption bands presented on these spectra correspond to the crystal structure Sn-O vibrations (400–870 cm−1), adsorbed water (1634 cm−1) and hydroxyl groups (3000–3670 cm−1) [24]. So, one can accept that Mn(acac)3 decomposes completely during the 24 h annealing of SnO2 impregnated with manganese (III) acetylacetonate.

3.2. Morphology, Microstructure and Phase Composition of Prepared Materials

Scanning electron microscopy (SEM) has shown that the prepared materials consist of aggregates formed by irregularly shaped particles of various sizes (Figure 3a). Adding manganese (Mn: Sn = 1–10 mol.%) by impregnation-annealing does not lead to visible changes in the morphology of SnO2-300-based materials (Figure 3b). However, the surface of the particles of the etched samples SnO2-Mn1_w and SnO2_Mn10_w seems to be smoother and clearer (Figure 3c).
Although the resolving power of used equipment is insufficient to get sharp images of individual crystalline grains (Figure S2, Supplementary Information), their size (dSEM) could be estimated approximately in the 5–10 nm range for each prepared material.
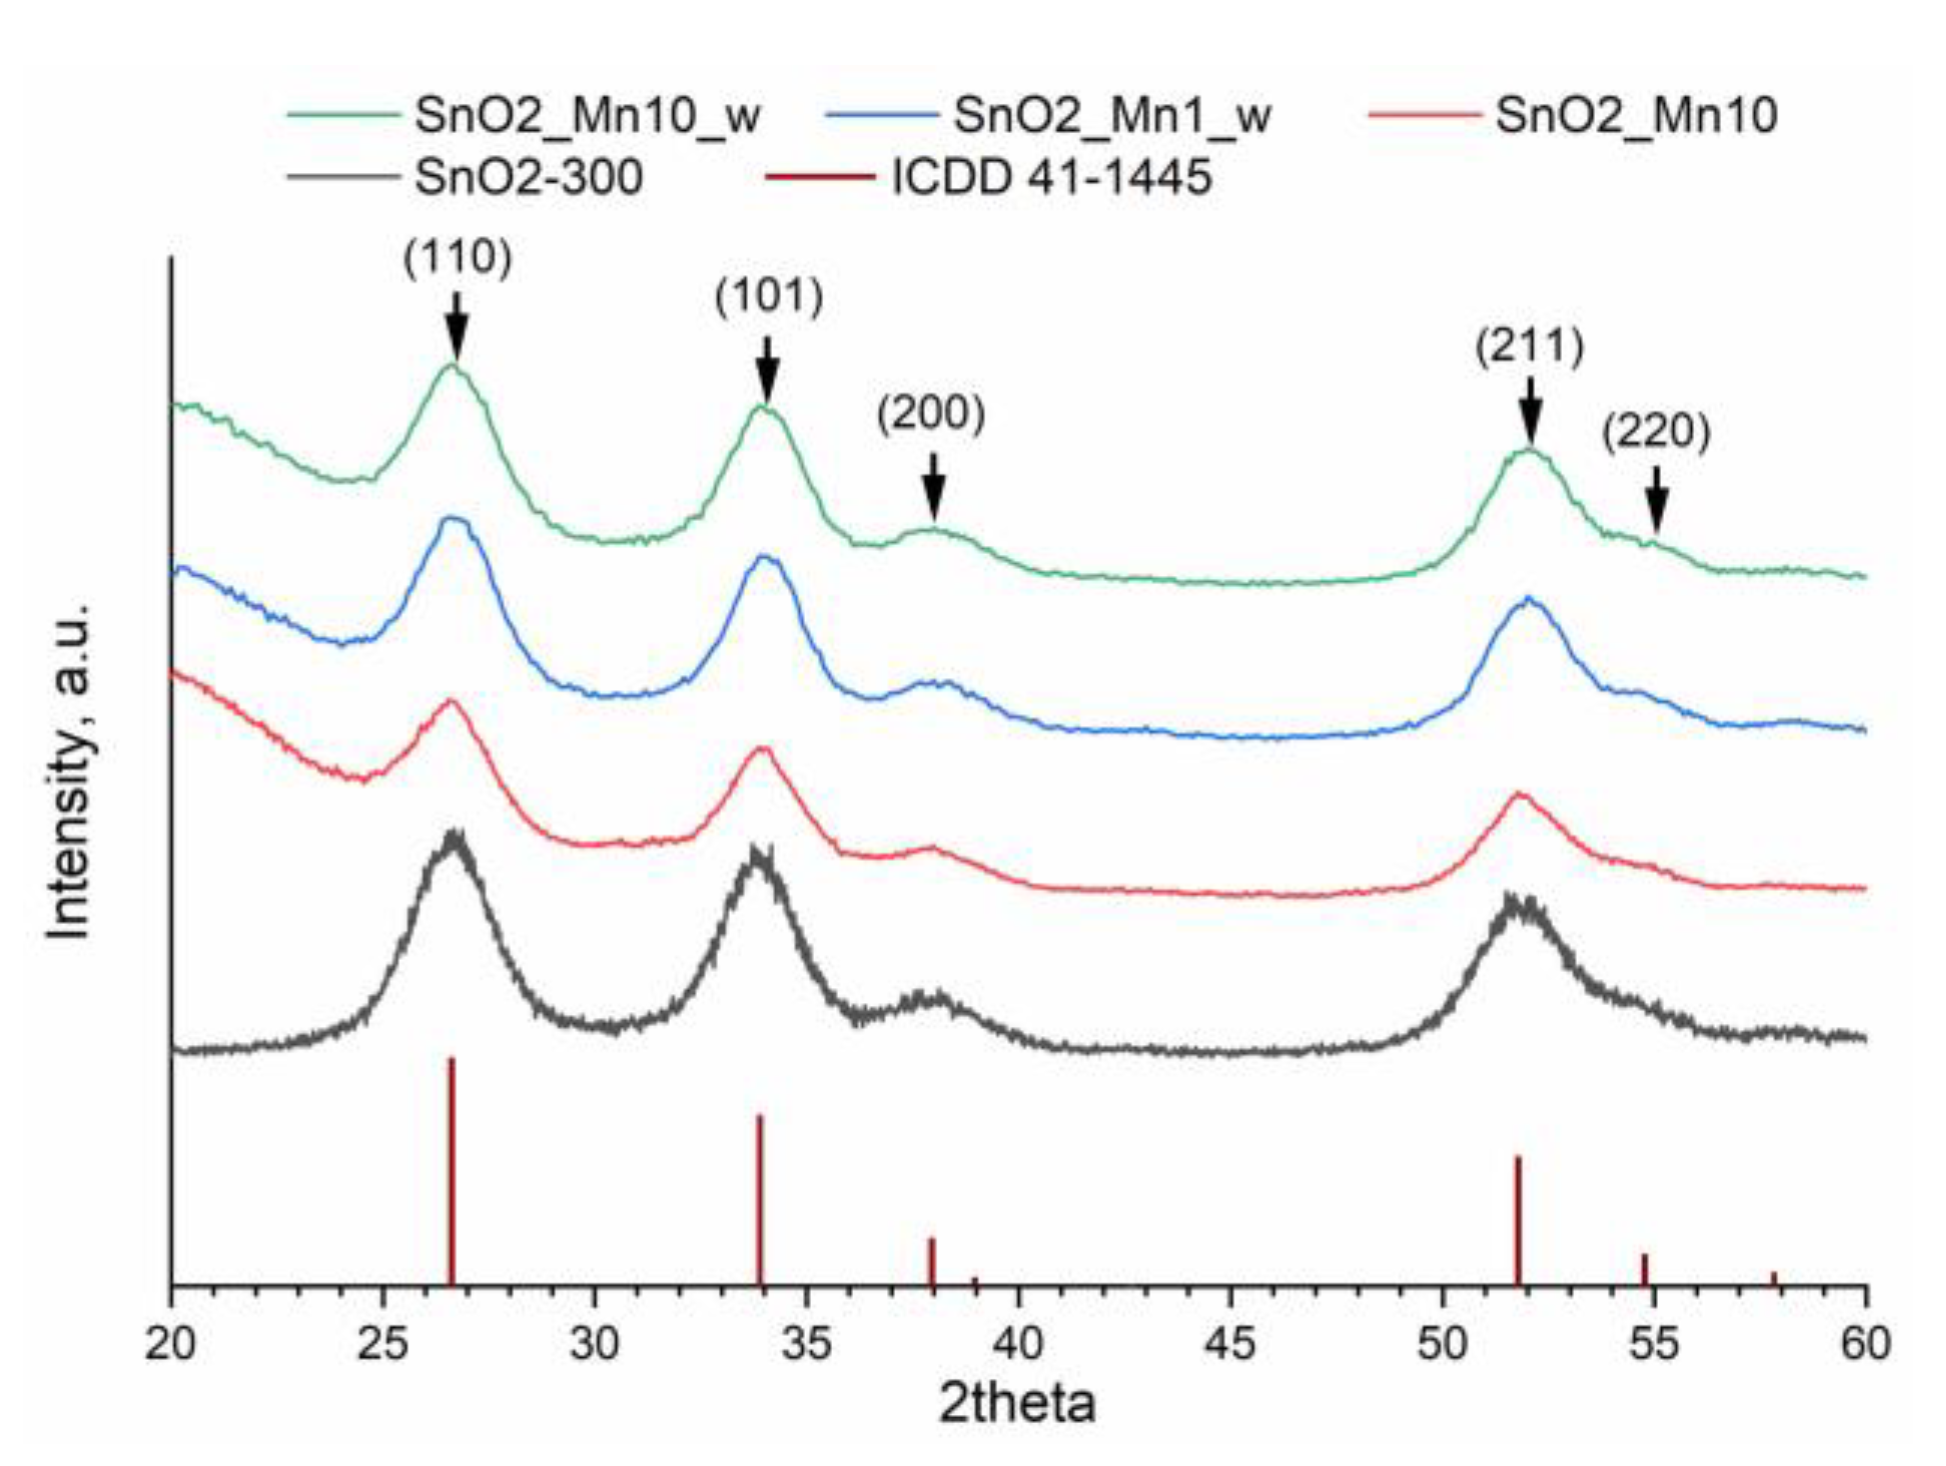
As shown by the X-ray diffraction (XRD) study, synthesized tin (IV) oxide is single phase and matches cassiterite (rutile-type) structure (ICDD 41-1445). As for SnO2/MnOx composites, no new crystalline phases were found even in the SnO2_Mn10 sample (Figure 4), which agrees with known data [11]. The size of the coherent scattering region (crystalline grain size, dXRD) calculated by the Scherer equation is 3–4 nm for SnO2-300 and slightly larger for SnO2_Mn10 (4.5–5 nm) and etched materials (4–4.5 nm).
Specific surface area (Ssurf) values of all the SnO2/MnOx composites are close to each other and equal to 100–105 m2/g, slightly less than the Ssurf of blank SnO2 (120 m2/g). Therefore, the size of aggregates whose surface is available for gas adsorption (dBET) calculated by Formula (2) is about 8 nm for SnO2/MnOx materials and near 7 nm for blank SnO2 that does not contradict with XRD data and testifies to the gas permeability of observed agglomerates.
The whole information discussed in microstructure and phase composition is summarized in Table 2.
One can see a tendency to increase the SnO2 grain size with increased manganese content in the composites. The etched samples SnO2_Mn1_w and SnO2_Mn10_w retain a larger crystallite size than the SnO2-300. So, it could be stated that manganese forces the growth and aggregation of crystallites during the annealing stage of composites preparation.

3.3. Elemental Composition and Manganese Surface-Bulk Distribution in SnO2/MnOx Materials

3.3.1. Investigation of Surface Composition and Chemical State via Raman Spectroscopy

Raman spectroscopy is more than just a method of phase analysis in the case of studying such materials as SnO2/MnOx nanocomposites. The form of the spectrum also depends on the crystallite size and phase distribution in the sample [12,13]. Prepared manganese-containing materials are brown colored, so they absorb visible light significantly, especially in short-wavelength regions. Thus, during the Raman spectra measurements, the excitation radiation will be absorbed quickly in the surface layer of the sample without deep penetration through the sample. Vice versa X-ray radiation during XRD studies has negligible absorbance in the sample and interacts with the whole sample. That’s why Raman spectroscopy will primarily characterize the surface of the sample.
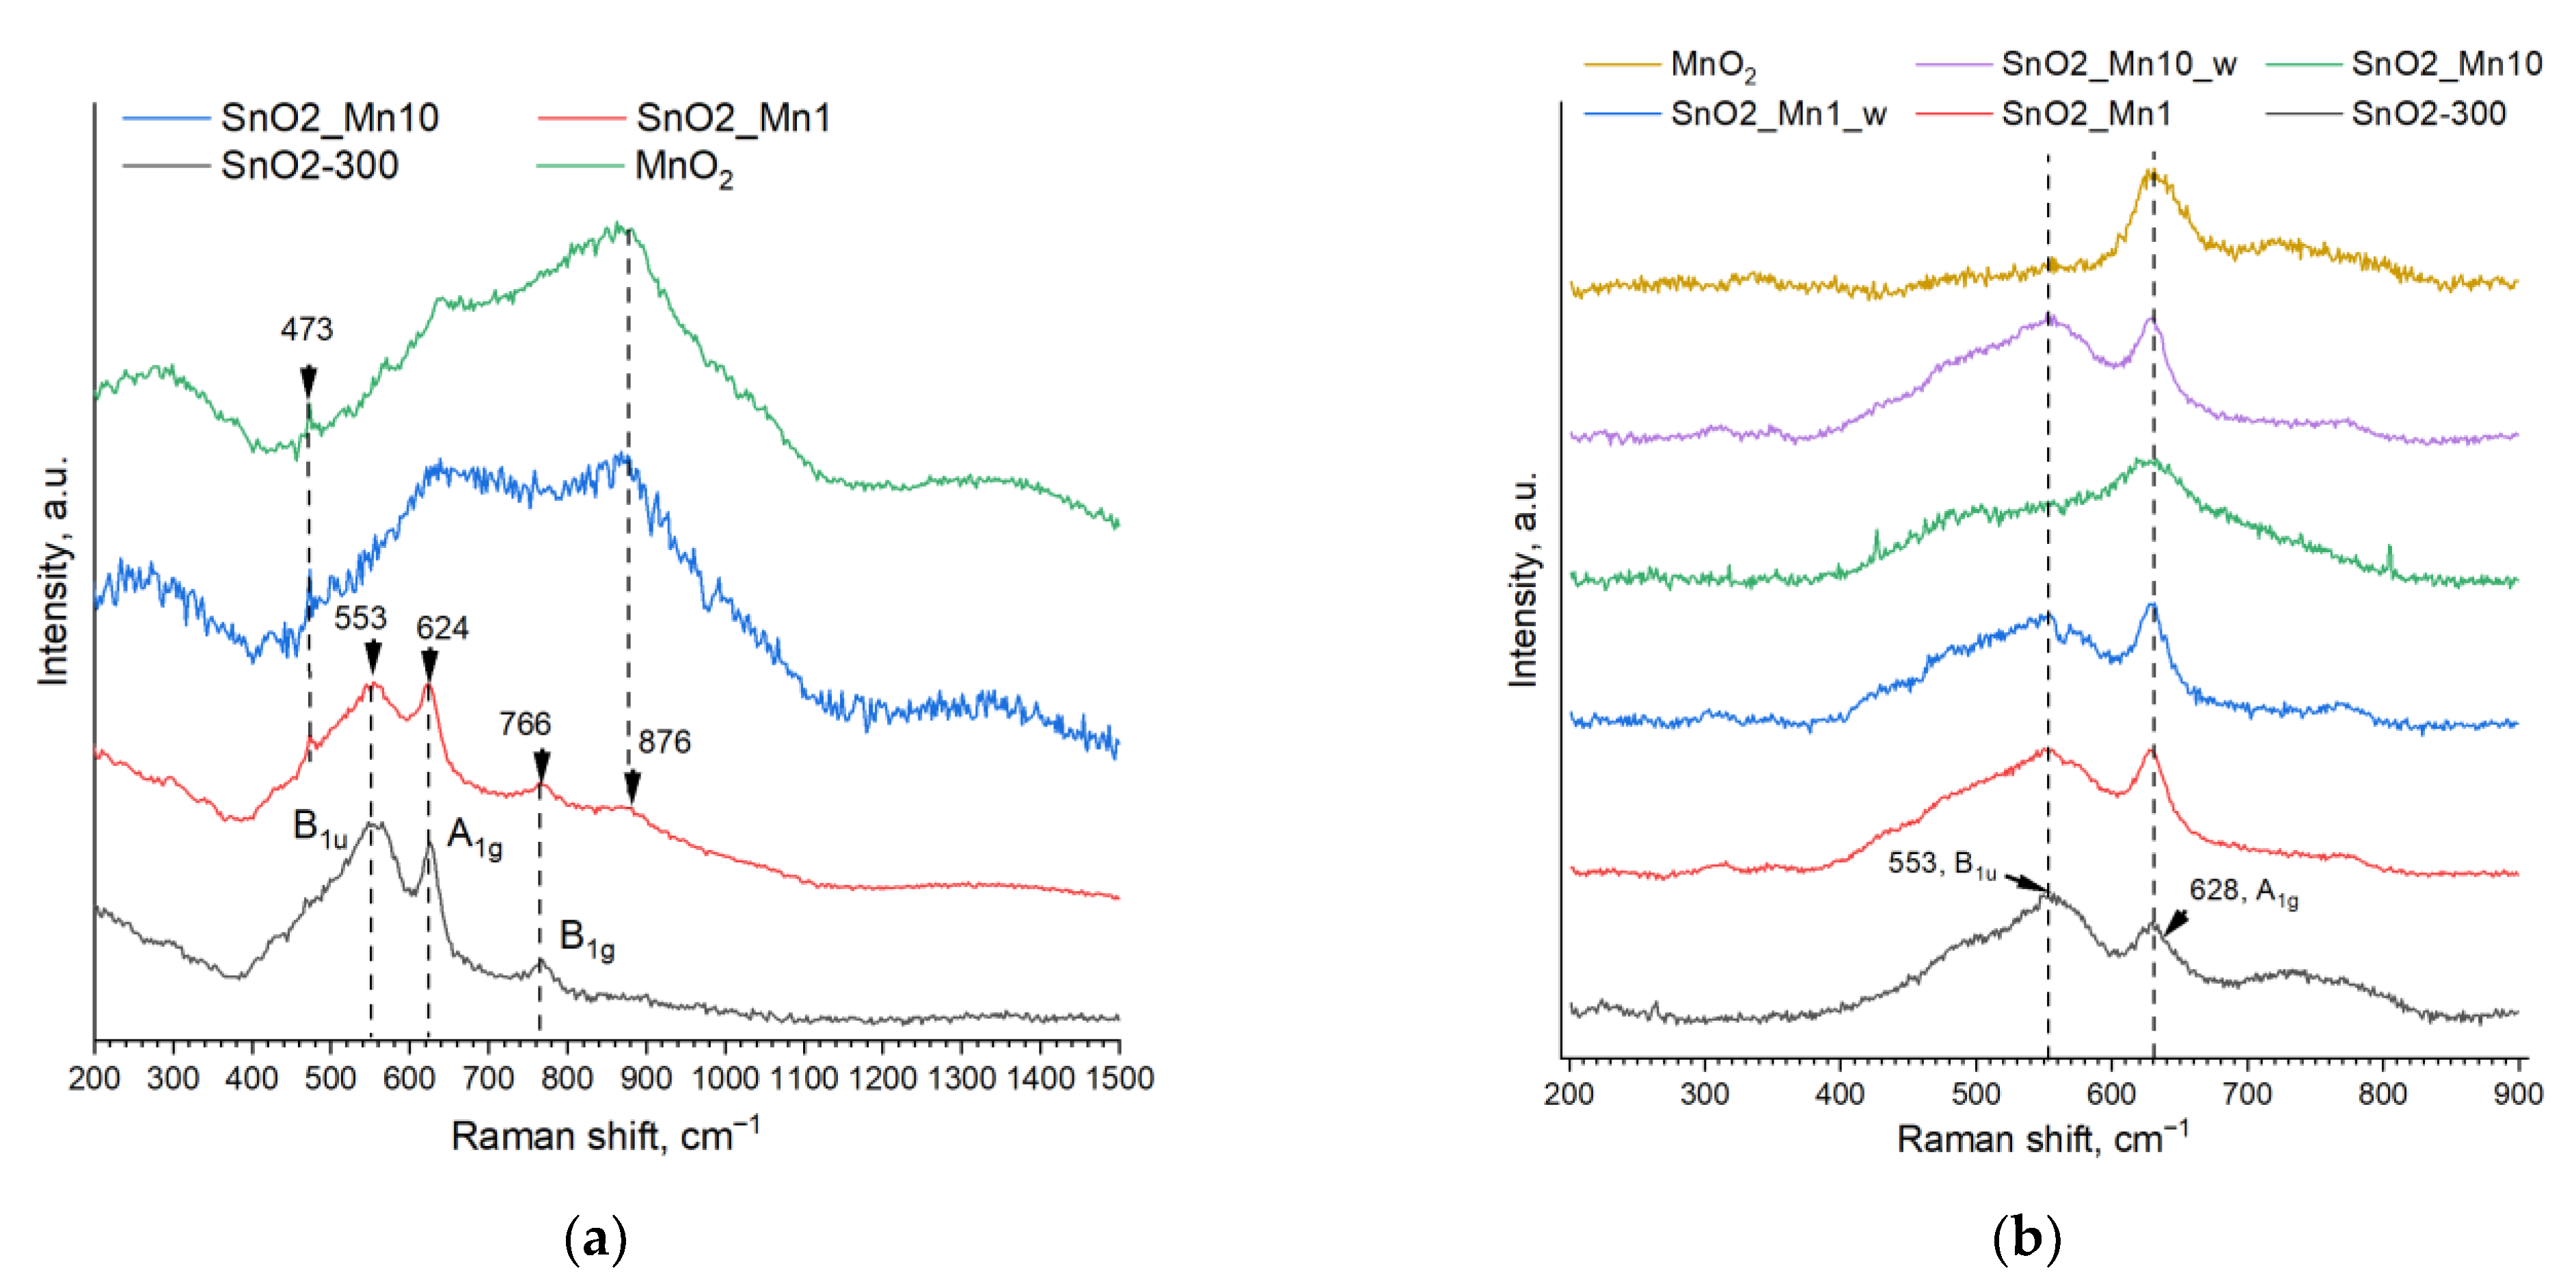
However, strong absorption of laser radiation causes such problems as a lack of Raman signal and sample overheating, which leads to a shift of Raman bands and an increase in background signal. When using a 532 nm laser as a radiation source, the SnO2_Mn10 sample and reference manganese dioxide spectra were uninformative because of the abovementioned problems. However, high-quality spectra were obtained for whiter samples with lower manganese content (Figure 5a).
The spectrum of the SnO2-300 sample corresponds to the spectrum of tin (IV) oxide with the same dXRD grain size described in [25]. Almost the same peaks are found in the spectrum of SnO2_Mn1. Besides, on the spectrum of SnO2_Mn1 there is a well-discernible peak at 473 cm−1, which is also present on SnO2_Mn10 and MnO2 spectra but almost indistinguishable on the spectrum of blank SnO2. There are no SnO2 bands in the SnO2_Mn10 spectrum. The MnO2 spectrum is precisely the same but contains a wide halo in the range of 500–1200 cm−1, which is also present to some extent in the spectrum of SnO2_Mn 1 but is not detected in the spectrum of SnO2-300. An arguable but expected (due to thermal stability data of manganese oxides) conclusion can be made based on these observations: manganese is present as manganese dioxide on the surface of SnO2_Mn1 and SnO2_Mn10 nanocomposites. However, the obtained MnO2 spectrum does not correspond to any known MnO2 spectrum [26,27].
An attempt was made to override the issues found using a red 633 nm laser instead of a green 532 nm laser as a radiation source. It is supposed to be less absorbed by manganese-containing samples causing overheating to a small extent.
As it turned out, the non-artifact spectra of even the dark manganese-containing samples and MnO2 can be acquired using a 633 nm laser (Figure 5b). Moreover, obtained MnO2 spectrum matches well with previously published data for pyrolusite-type manganese dioxide [28]. On the contrary, the blank tin (IV) oxide spectrum becomes less informative: the absence of the B1g band and the decreasing intensity of A1g are notable.
The spectra of SnO2_Mn1, SnO2_Mn1_w and SnO2_Mn10_w presented in Figure 6b are quite similar to the SnO2-300 spectrum in terms of intensity and width of the peaks. Contrary, the SnO2_Mn10 spectrum looks like a combination of MnO2 and SnO2 spectra. Peaks fitting by Gaussian functions were carried out to prove these diversities quantitatively (Table 3).
Undoubtedly, the SnO2 A1g peak (named further as «sharp peak») brings the main contribution to the sharp Raman peak in the spectra of SnO2_Mn1, SnO2_Mn1_w and SnO2_Mn10_w samples, because square ratios of sharp peak and broad peak (designation for a band at 553 cm−1) are very similar to blank SnO2. Moreover, the color of the sample correlates with the relative intensity of the sharp peak, as shown by I/FWHM values. Likewise, MnO2 peak contribution defines the shape of a sharp peak in the SnO2_Mn10 spectrum.
In conclusion, it is very reasonable to consider the presence of MnO2 segregation on the surface of SnO2/MnOx nanocomposites SnO2_Mn1 and SnO2_Mn10. Concerning the etched samples SnO2_Mn1_w and SnO2_Mn10w, it is difficult to imagine the existence of MnO2 on their surface after the treatment by concentrated H2C2O4/HCl mixture at elevated temperature, but their color indicates the presence of manganese in the material.

3.3.2. Direct Determination of Manganese Concentration and Distribution

Although Raman spectroscopy mainly detects MnO2 segregation on the SnO2 surface in SnO2/MnOx nanocomposites, this method is not applicable for determining the uniformity of the manganese distribution over the surface and establishing the quantitative composition. That is why energy dispersive X-ray analysis (EDX) and elemental composition mapping for Sn, Mn, O and trace carbon were carried out for SnO2_Mn1, SnO2_Mn10 and etched samples SnO2_Mn10_w at ×102, ×103 and ×105 magnification as the manganese in SnO2_Mn10 was suspected to be distributed unevenly. However, performed mapping at the chosen scales proves the uniform surface distribution of manganese in prepared materials, even in the SnO2_Mn10 (Figure 6 and Figure S3, Supplementary Information).
The interesting detail is the detection of manganese in the SnO2_Mn10_w sample, prepared from SnO2_Mn10 by etching with the concentrated mixture of H2C2O4 and HCl. It was supposed that manganese be removed from the surface of the nanocomposite as a soluble form of Mn (II)–oxalic complex or chloride salt. Still, manganese intruded into the SnO2 lattice is not, because of the high resistance of SnO2 to acids in opposite to excellent reactivity of any MnOx with H2C2O4 or HCl. Therefore, manganese forms substitution defects in the SnO2 rutile-type lattice [8,11,12]. Furthermore, according to the known Shannon’s ionic radii values, the only manganese state possible to replace Sn (IV) in octahedral coordination (rionic = 69 pm) is the same coordinated high-spin Mn(III) ion (rionic = 64.5 pm). The EDX elemental composition data are presented in Table 4.
One of the main disadvantages of the EDX technique–a matrix effect–may bring an unavoidable systematic error in the quantitative analysis results. Total reflection X-ray fluorescence spectroscopy (TXRF) is considered to be a more accurate method for elemental analysis, to the same extent as atomic emission spectroscopy (AES) with inductively coupled plasma (ICP) [29]. So, the trial to verify EDX data and determine manganese surface/lattice concentrations was carried out using TXRF with internal standard (Co2+ solution).
The suspensions of SnO2-300, SnO2_Mn1 and SnO2_Mn10 were analyzed to determine the total manganese concentration. Surface-located manganese concentration was determined by examination of supernatant solutions of mixtures of the same samples with oxalic and hydrochloric acids. It was supposed to calculate the concentration of manganese intruded in the SnO2 crystal structure as the difference between total and surface manganese concentrations. Unfortunately, this technique appeared to be not accurate enough (Table 5) and gives inadequate absolute values for analysis of suspensions which gives the total manganese quantity in materials.
To solve this analytical problem, ICP MS was used to determine low concentrations of manganese in acid-etched samples SnO2_Mn1_w and SnO2_Mn10_w. (Table 6). The obtained values were accepted as the concentrations of manganese in the crystal structure of SnO2 in samples SnO2_Mn1 and SnO2_Mn10, respectively. Molar fractions of Sn and Mn were calculated assuming Mn and Sn in SnO2_Mn1_w and SnO2_Mn10_w as stoichiometric Mn2O3 and SnO2.
Therefore, the total concentration of manganese was calculated by summation lattice Mn concentration revealed by ICP MS and surface Mn content determined by TXRF. Assuming that tin presents in the samples as SnO2, lattice manganese as Mn2O3 and surface manganese as MnO2, it became possible to calculate molar fractions of Sn and Mn in materials (Table 7).
The values indirectly calculated from TXRF and ICP MS molar ratio Mn: Sn converge with direct results of TXRF analysis of suspensions. EDX gives overestimated manganese concentrations, especially for the SnO2_Mn10_w sample. According to the ICP MS data, the manganese solubility limit in the SnO2 lattice is not reached for samples with Mn: Sn total ratio of less than 10 mol. % that means a possibility of material evolution with manganese surface-to-lattice migration during the continuous heating at 300 °C.
In summary, SnO2/MnOx nanocomposites prepared by the impregnation-annealing technique are heterogeneous materials made of “multilayer particles”. The thin discontinuous top layer is composed of MnO2. The middle layer can be imagined as Mn (III)-rich defected SnO2 structure, and the inner one is probably SnO2 nearly free of Mn (III).

3.4. Investigation of Active Centers on the Surface of Blank SnO2 and SnO2/MnOx Composites

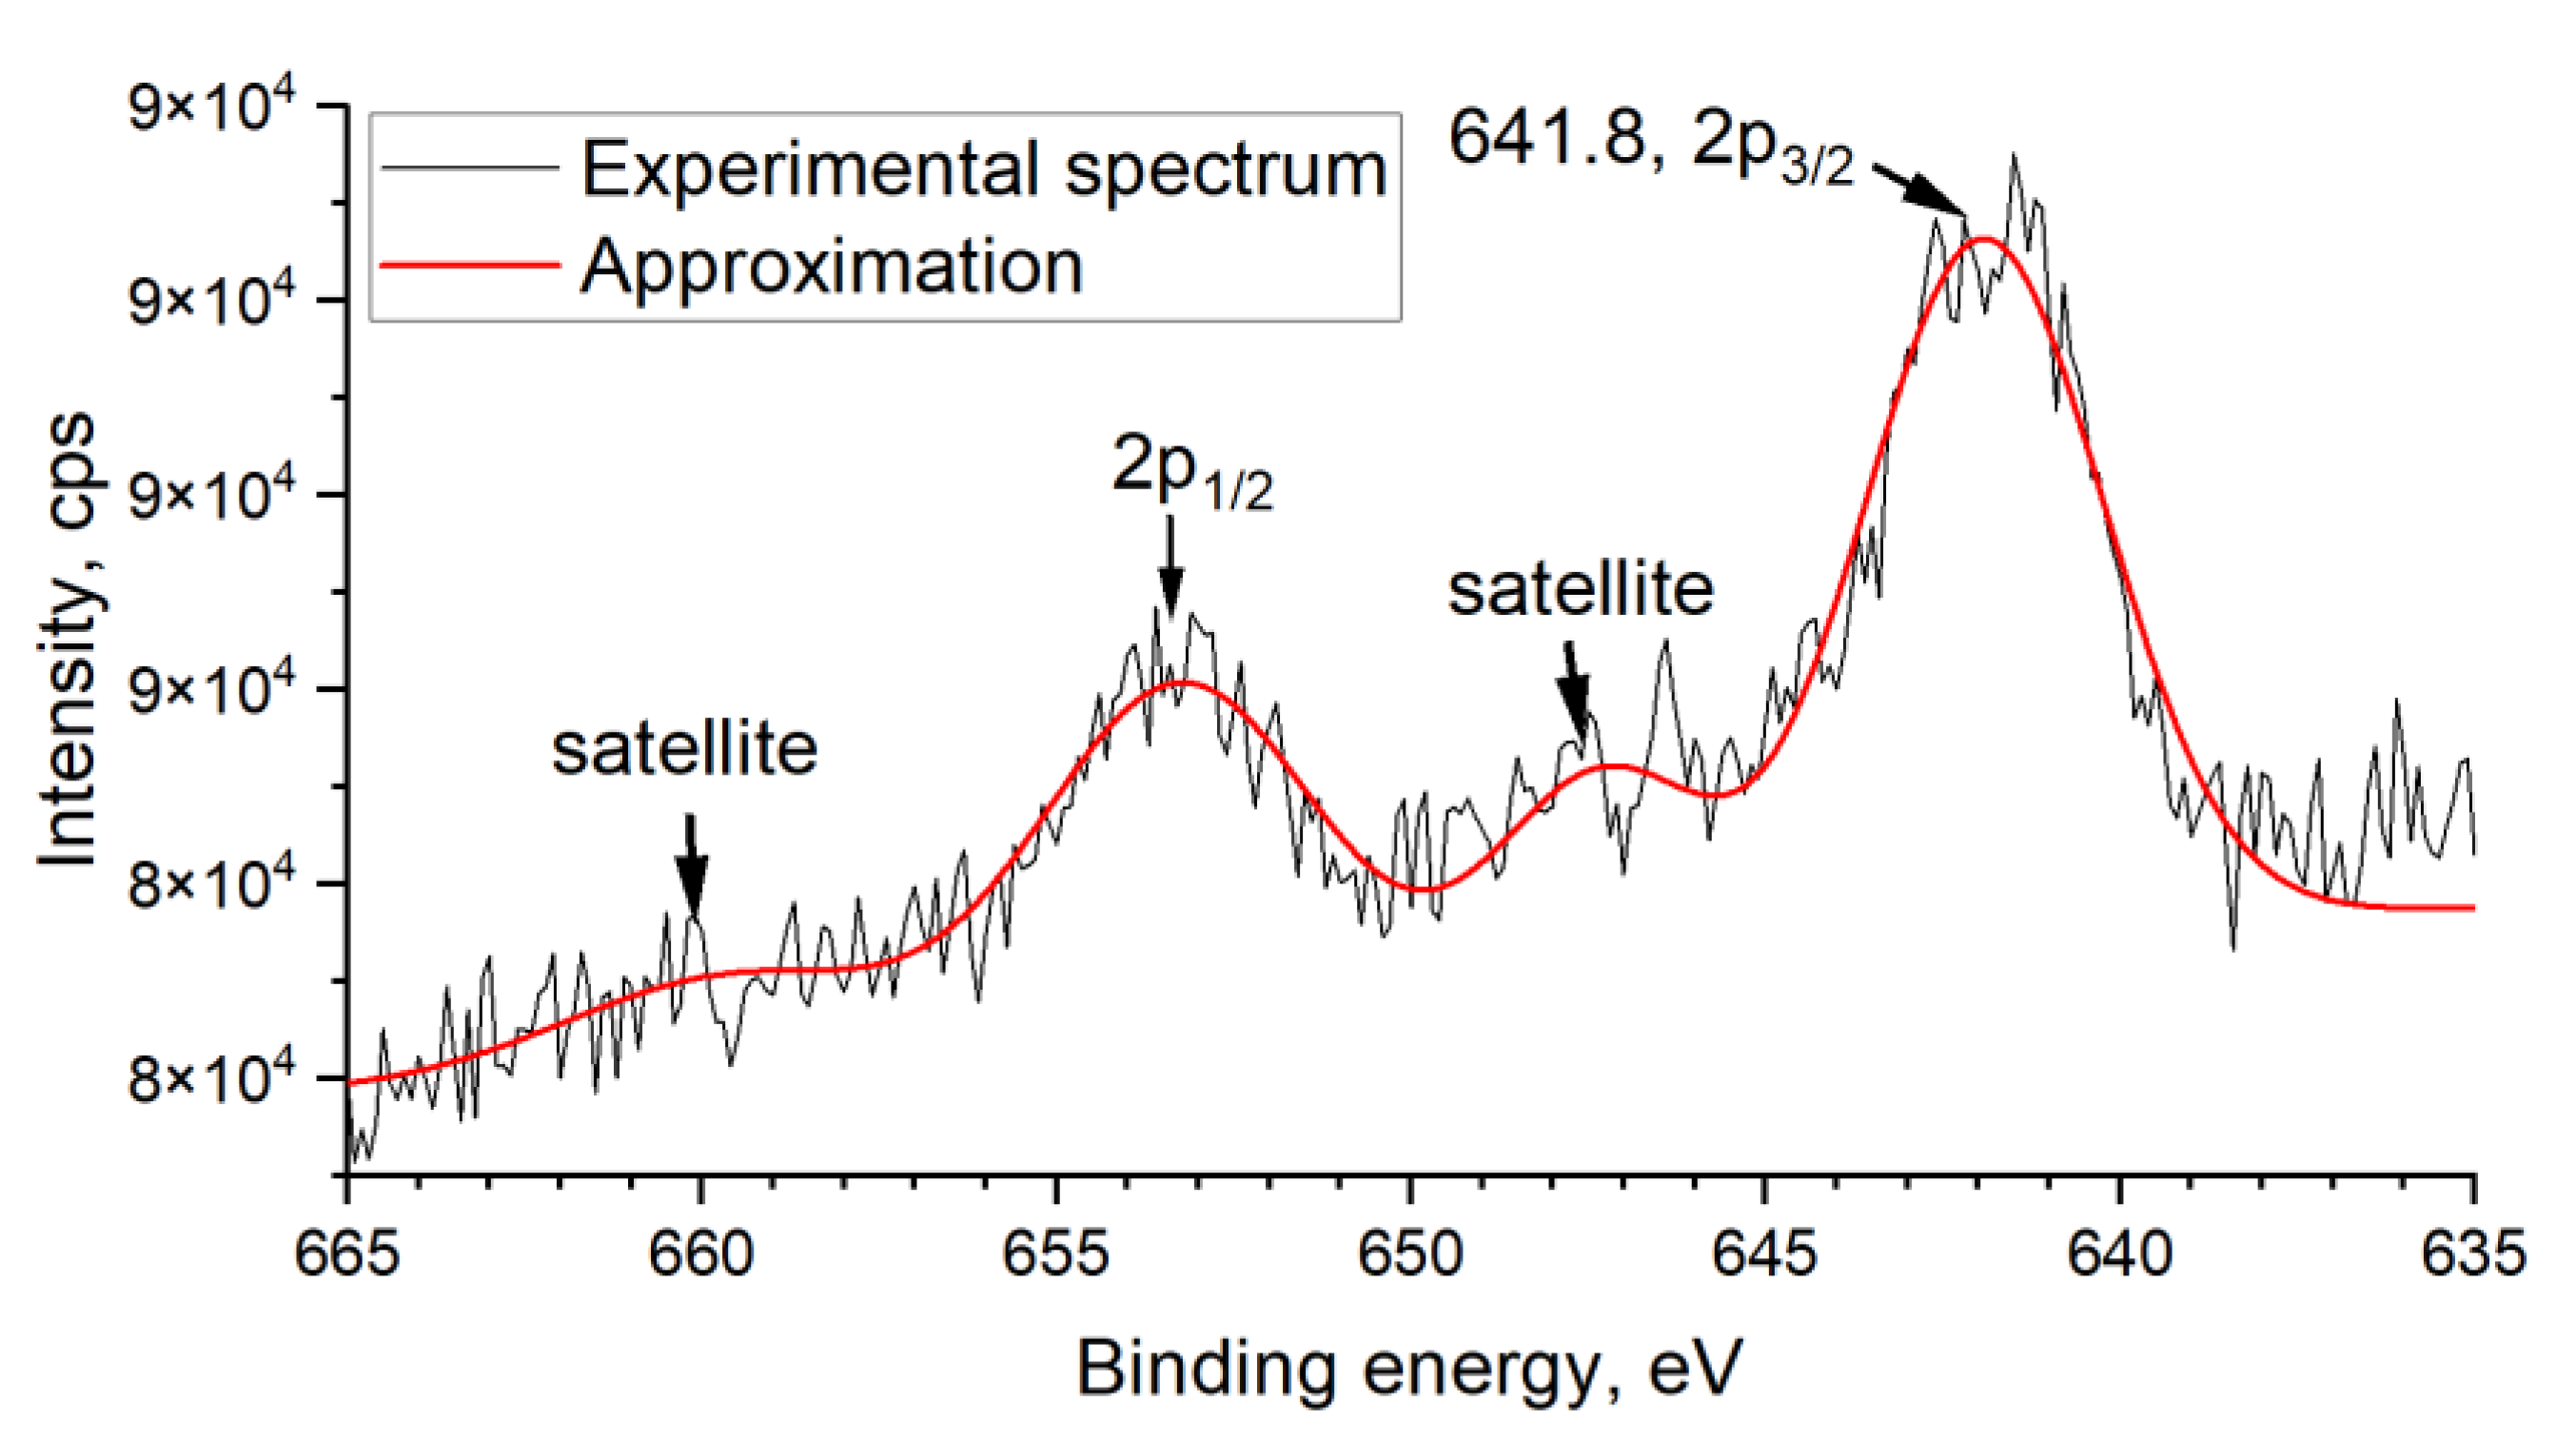
X-ray photoelectron spectroscopy (XPS) is one of the most advanced techniques for discovering the oxidation state of elements in different compounds. The influence of chemical factors on electron binding energy (BE) is the biggest for the pre-valence shell of the atom. Thus, using the Mn 3s region to determine the oxidation state is better. However, the attempt to obtain the Mn 3s spectrum for SnO2_Mn1 failed due to apparatus restrictions and too low manganese content. Besides observed Mn 2p spectrum was useless for this aim: although the obtained binding energy of 641.8 eV for Mn 2p3/2 can be attributed to Mn (IV) in MnO2 [30], according to the published data, the difference between Mn 2p3/2 peaks for Mn +3 and+4 consists only 0.5–1 eV [31,32]. This fact makes XPS analysis of the manganese chemical state uninformative for such samples as SnO2_Mn1 (Figure 7) or SnO2_Mn10_w, where Raman spectroscopy can’t detect the manganese-containing phase.
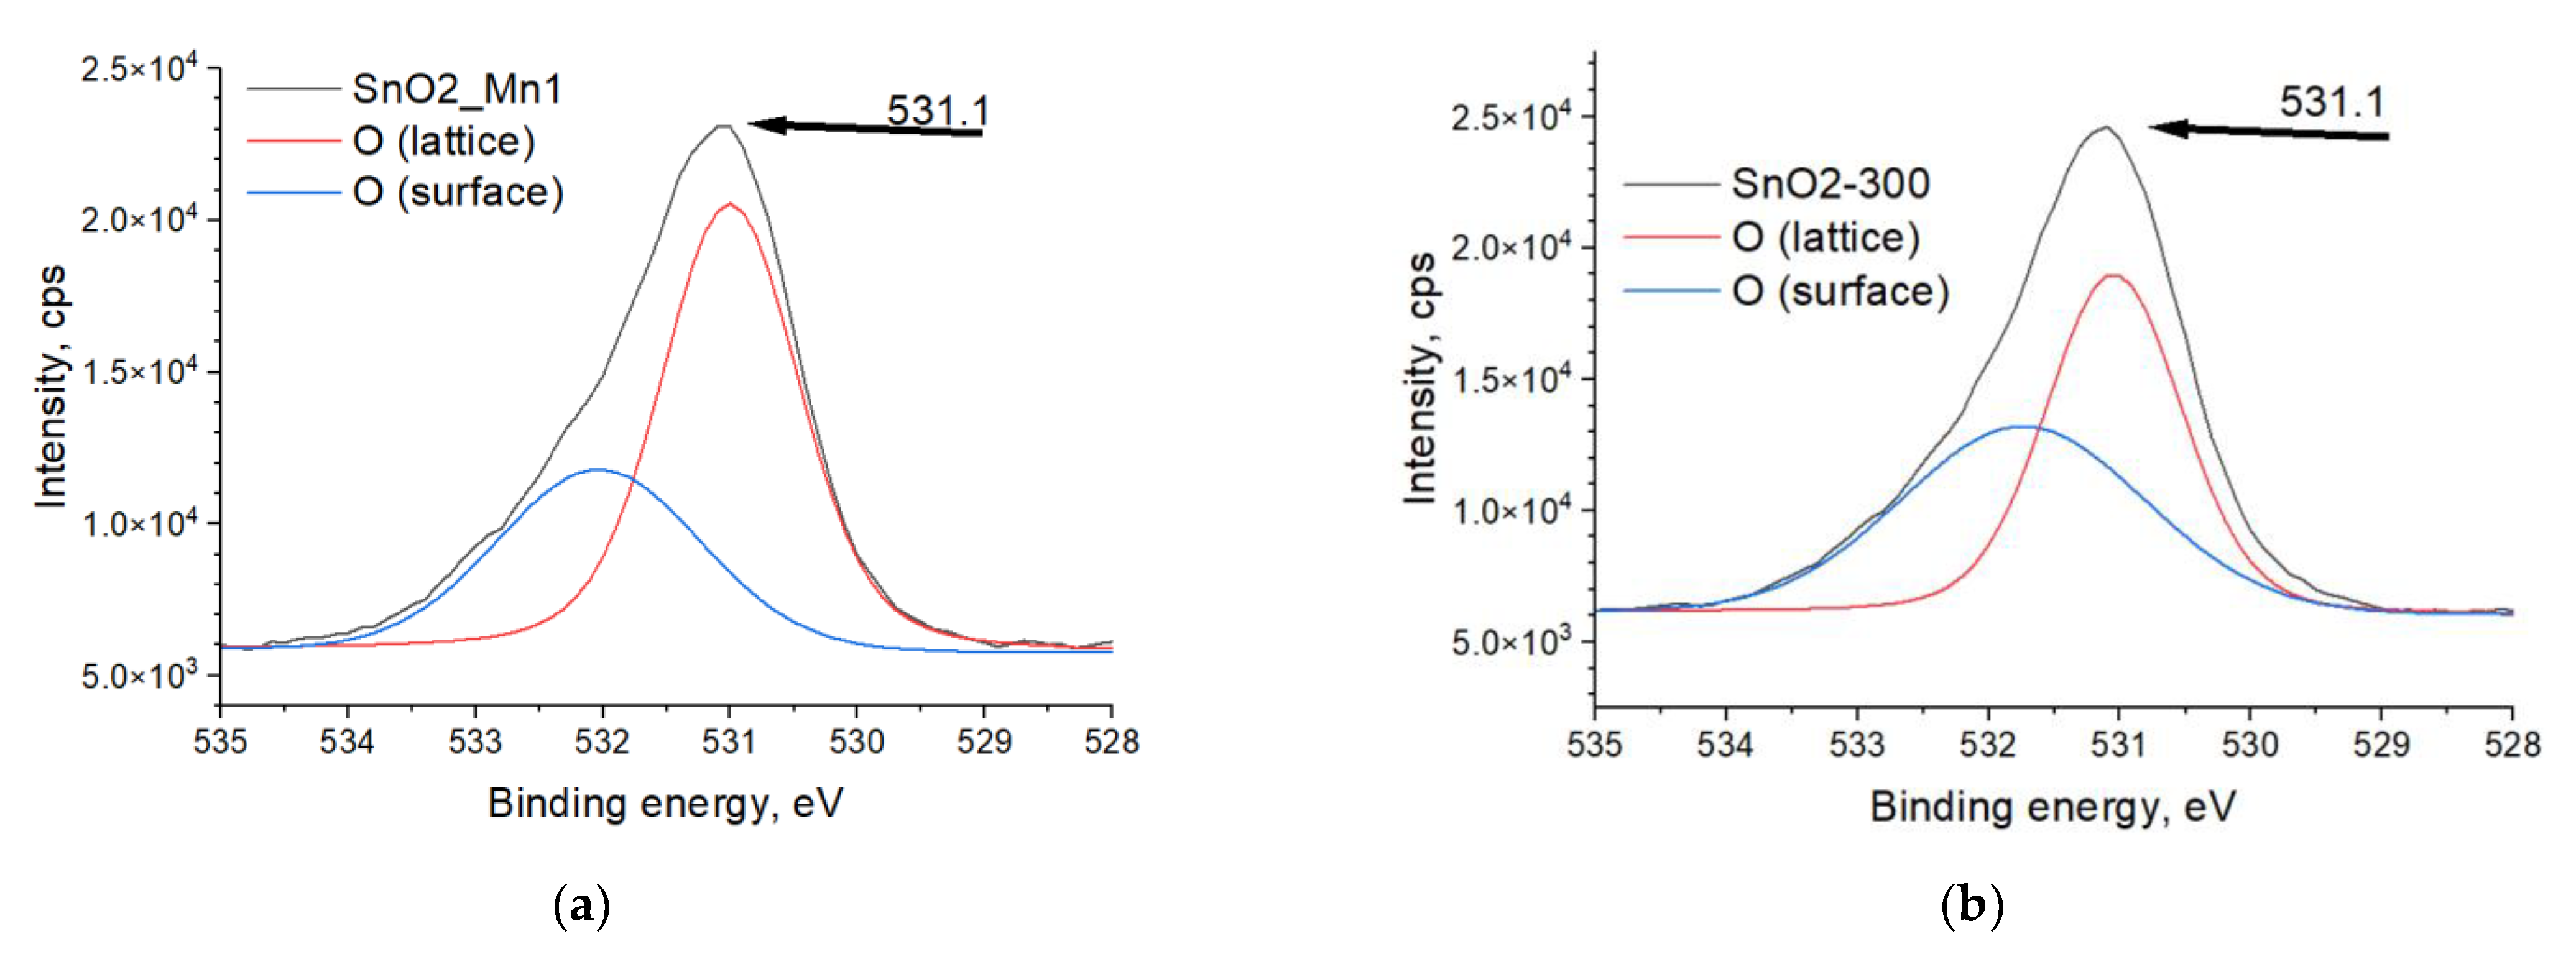
As for oxide-based sensing materials, XPS is considered helpful in investigating the chemical state of oxygen, which gives O 1s spectra in the shape of one asymmetric broad peak (Figure 8a,b). There is no exact rule on how to fit this peak by Gauss-Lorentz functions, but in general, it is supposed that the main sharp peak corresponds to oxygen atoms of oxide structure, minor diffuse peak matches surface oxygen state like hydroxyl groups, adsorbed water, and chemisorbed oxygen [33,34]. The location of the O (lattice) peak is the same for both analyzed samples, although the ratio of minor and main peak areas differs (Table 8).
As shown in Table 8, impregnation-annealing modification of SnO2 by manganese results in a decrease in surface oxygen concentration compared to blank SnO2. This effect could be a consequence of manganese (III) low-valence doping of SnO2, which leads to the formation of an electron-depleted layer on the surface of the material and a decrease in its affinity to oxygen.
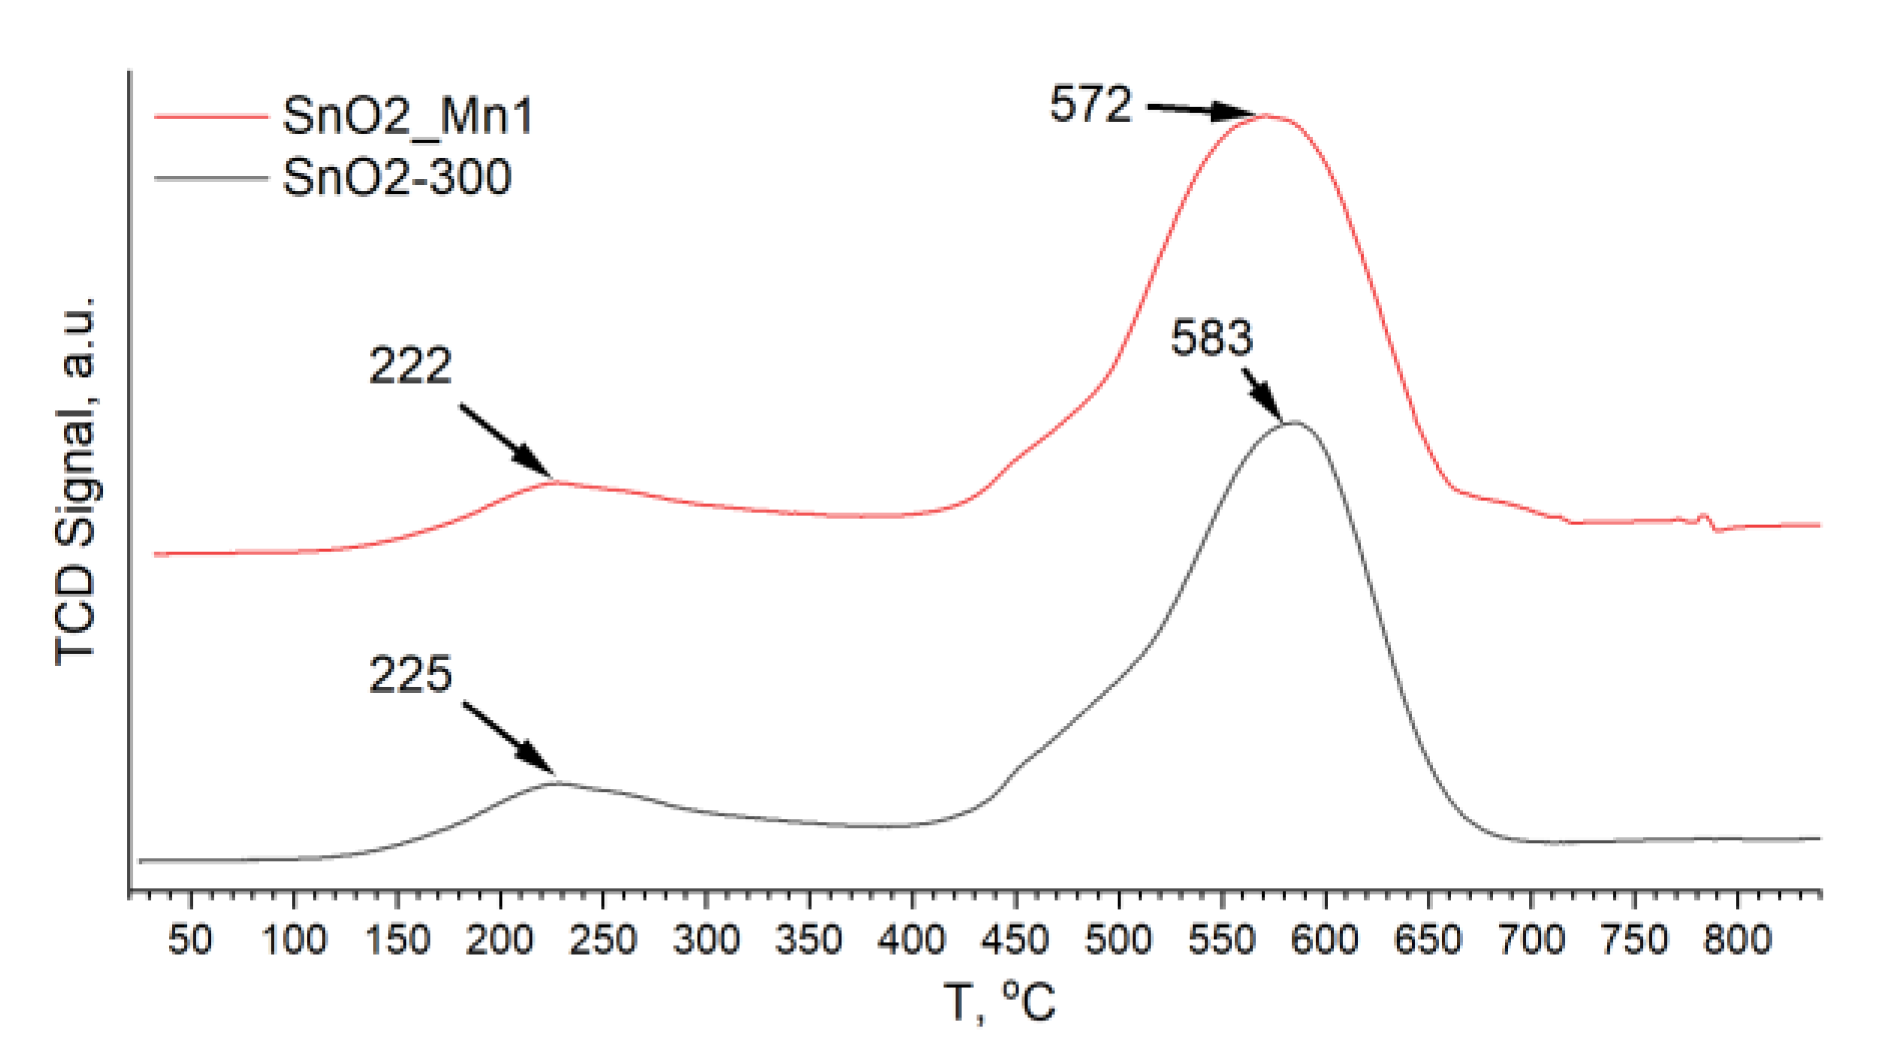
Another helpful method is a thermo-programmed reduction with hydrogen (TPR-H2), which describes the change of the material’s redox properties and the quantity of chemisorbed oxygen [2]. There are two regions on the TPR-H2 curve of nanocrystalline SnO2-based materials (Figure 9): low-temperature (approx. 100–350 °C) and high-temperature. (approx. 350–750 °C). The area of the first peak is proportional to the quantity of chemisorbed oxygen. In contrast, the position of the peak maximum is related to the ratio of different chemisorbed oxygen forms: the lower the peak maximum temperature, the stronger the oxidizing agent prevails among the forms of chemisorbed oxygen.
The high-temperature peak corresponds to the reduction of tin dioxide to metal. The position of the maximum temperature of the peak is related to the oxidation potential of the material but may undergo a shift depending on the parameters of the microstructure. Modifying SnO2 with MnOx leads to a shift of the high-temperature peak to lower temperatures by approx. 10 °C. This indicates the participation of the manganese-containing phase in the reduction of SnO2 with hydrogen. The differences in the position of the chemisorbed oxygen reduction peak between modified and unmodified SnO2 are much smaller. In this case, there is a significant difference in the ratios of the peak areas of the reduction of chemisorbed oxygen and oxide (Table 9).
The manganese-modified material has a smaller contribution from the reduction of chemisorbed oxygen to the uptake of hydrogen by the sample, which agrees with XPS results. The total amount of hydrogen consumed during the reduction of the samples is less than the theoretical value n(H2)/n(SnO2) = 2, corresponding to the reduction of stoichiometric SnO2 to Sn0. This may be due to the high defectiveness of tin dioxide obtained at a low annealing temperature of 300 °C.
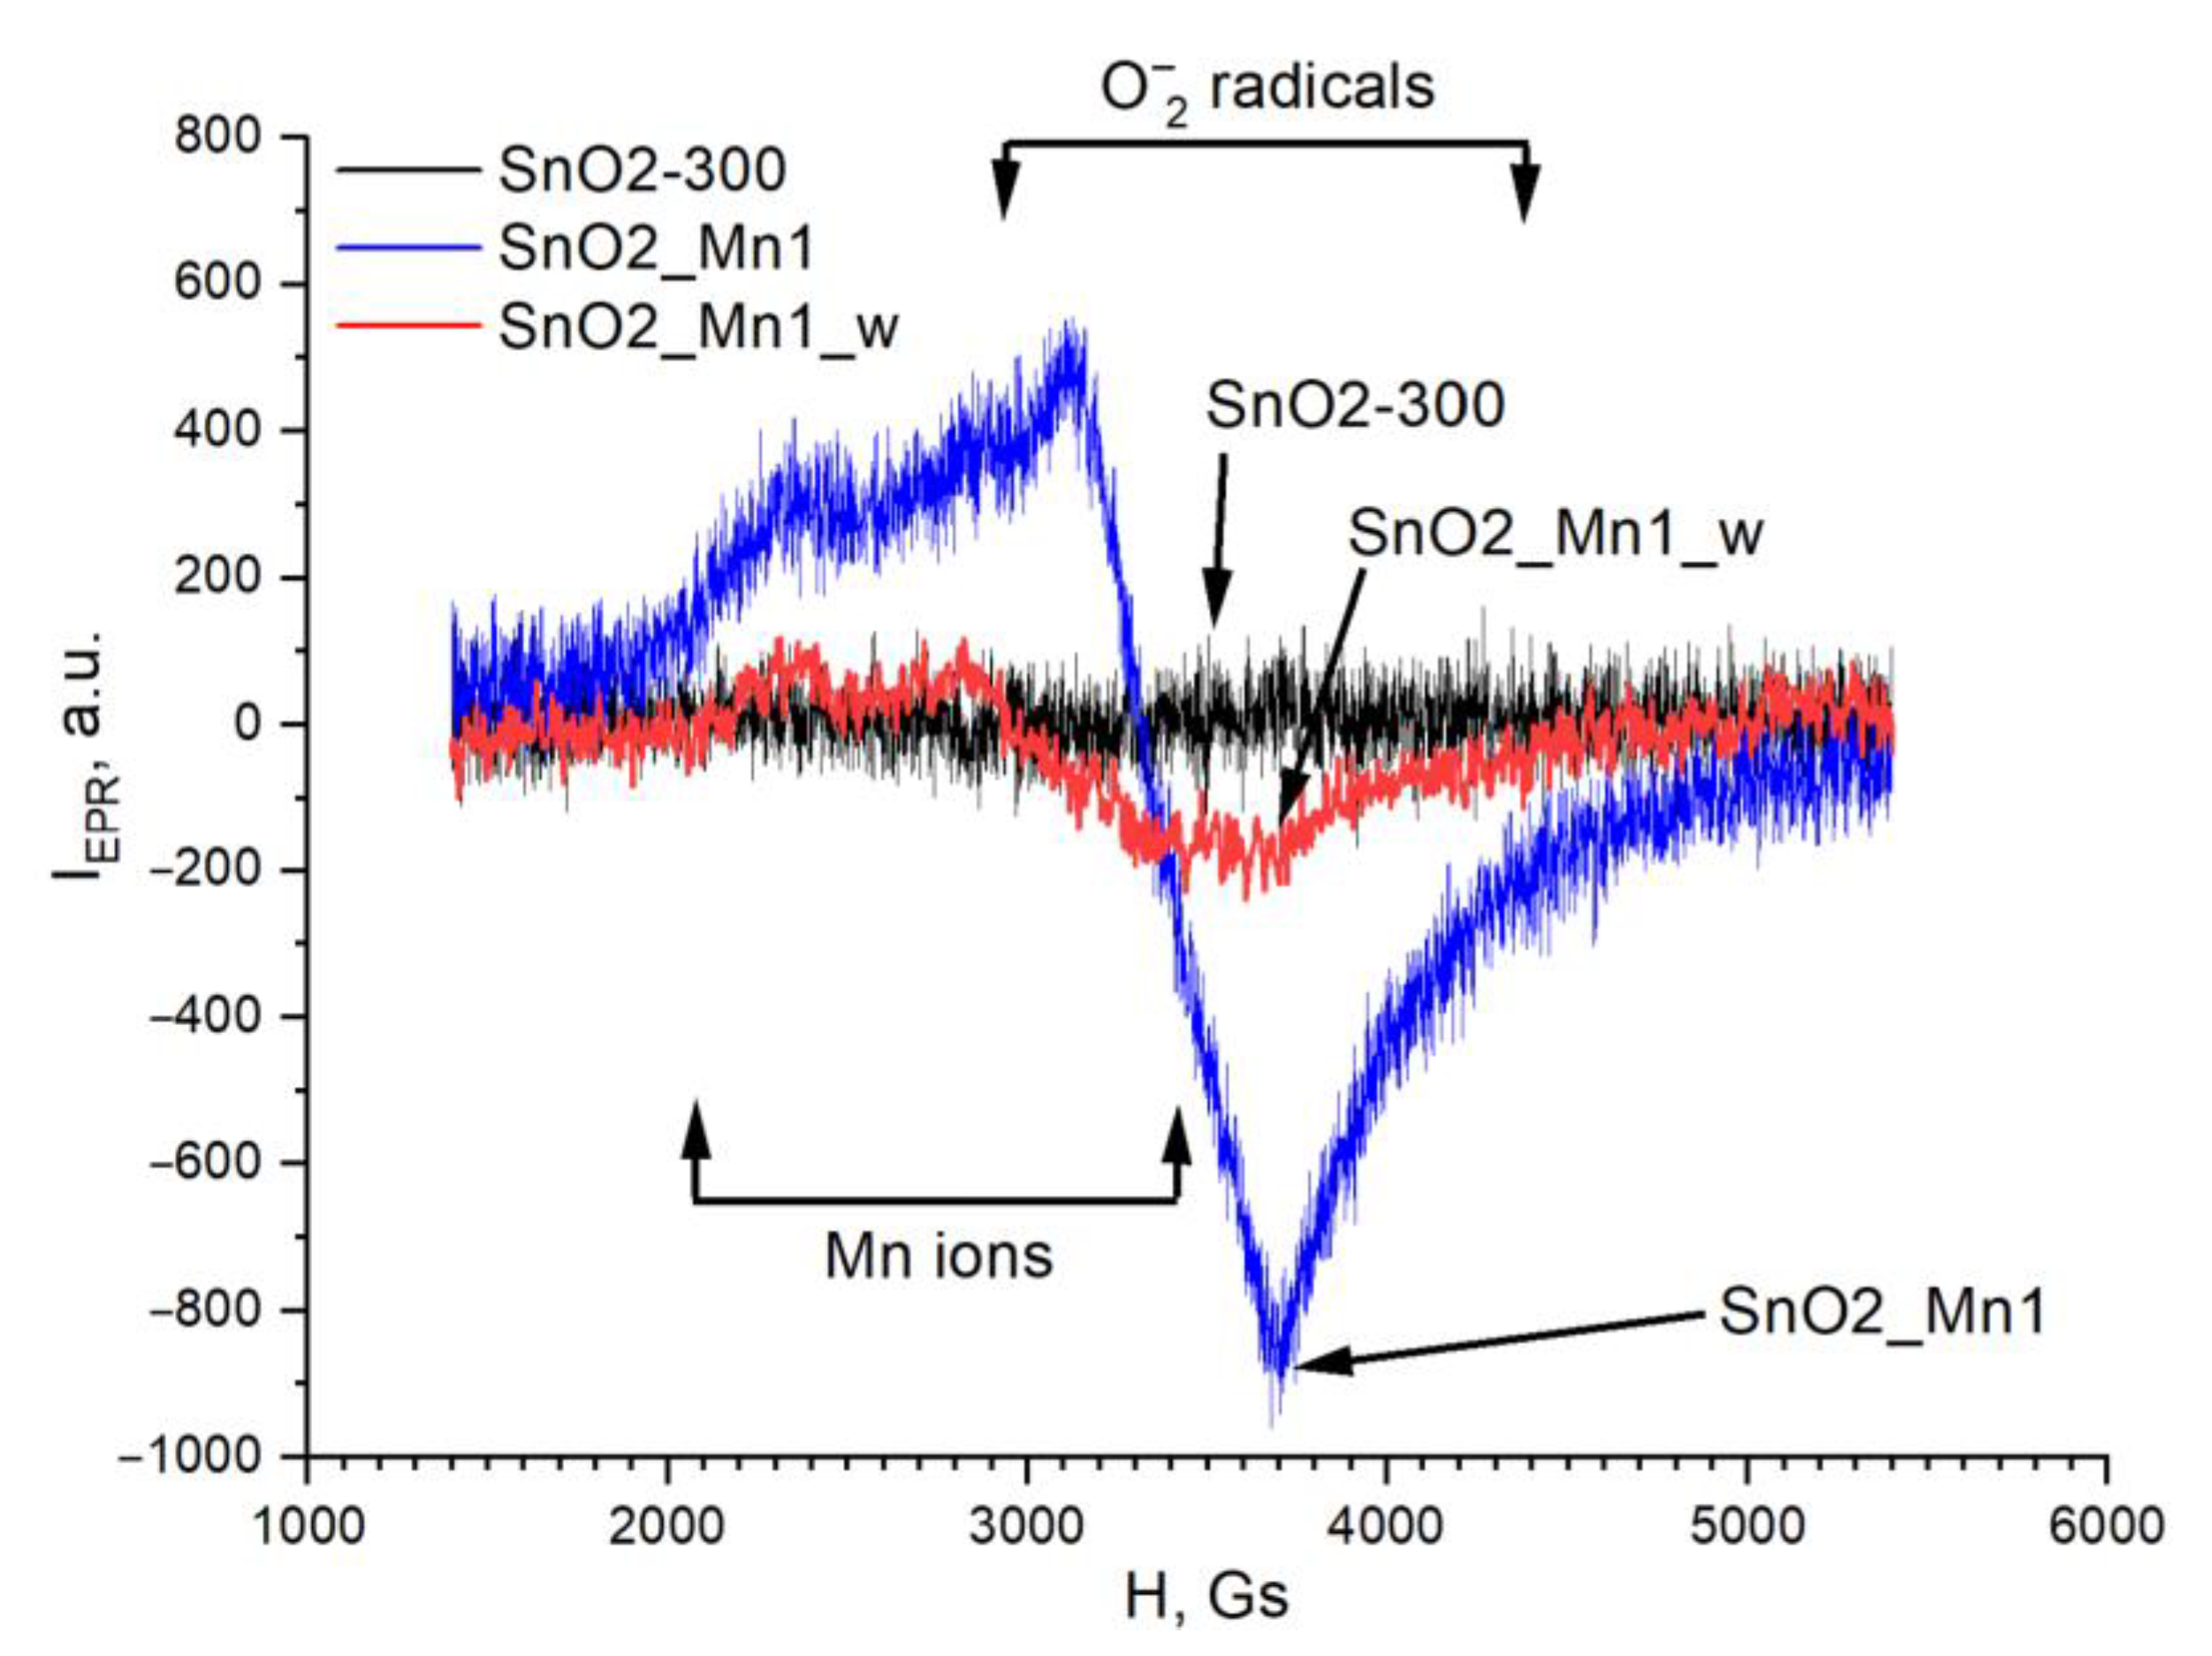
The additional information about manganese and chemisorbed oxygen state was obtained by electron paramagnetic resonance spectroscopy (EPR). This method deals with paramagnetic centers only, which were presented in SnO2/MnOx materials as manganese ions and oxygen-containing radicals.
The EPR spectrum of unmodified SnO2 does not demonstrate the signals related to superoxide radicals and manganese ions (Figure 10). The spectra of sample SnO2_Mn1 are a superposition of the EPR signals of manganese (III) ions (or manganese ions in other oxidation states) and oxygen radical anions O2 (g1 = 2.02, g2 = 2.009, g3 = 2.003). The observed lines in the spectra are strongly broadened due to dipole-dipole and/or exchange interactions. Moreover, the hyperfine splitting caused by the interaction of an unpaired electron with the paramagnetic (I = 5/2) nucleus of the manganese atom contributes to the broadening of the EPR signal of manganese ions.
The EPR spectrum of the etched SnO2_Mn1_w sample discerns from the others by weaker signals from both manganese ions and O2 radicals. The first observation is explained by a significantly lower (about three times) manganese content in the material compared to sample SnO2_Mn1. Second, because of the signal absence of oxygen anion-radicals O2 in the spectrum of unmodified SnO2, one can conclude that manganese in the form of MnOx segregation on the surface of SnO2 promotes the formation of superoxide ions. Manganese introduced into the crystal structure of SnO2 does not bring such an effect. This observation does not contradict the results of studying the state of oxygen by XPS since EPR is sensitive only to paramagnetic forms of oxygen. At the same time, XPS is equally sensitive to all.
The detection of O2 ions in the EPR spectra obtained at room temperature agrees with the published data: superoxide ions are one of the forms of chemisorbed oxygen, which is most stable at temperatures up to 200 °C [1]. These particles are also responsible for forming the sensor response of the material toward reducing gases when operating in the designated temperature range.

3.5. Gas Sensing Properties of Nanocrystalline SnO2 and SnO2/MnOx Nanocomposites toward CO and NO

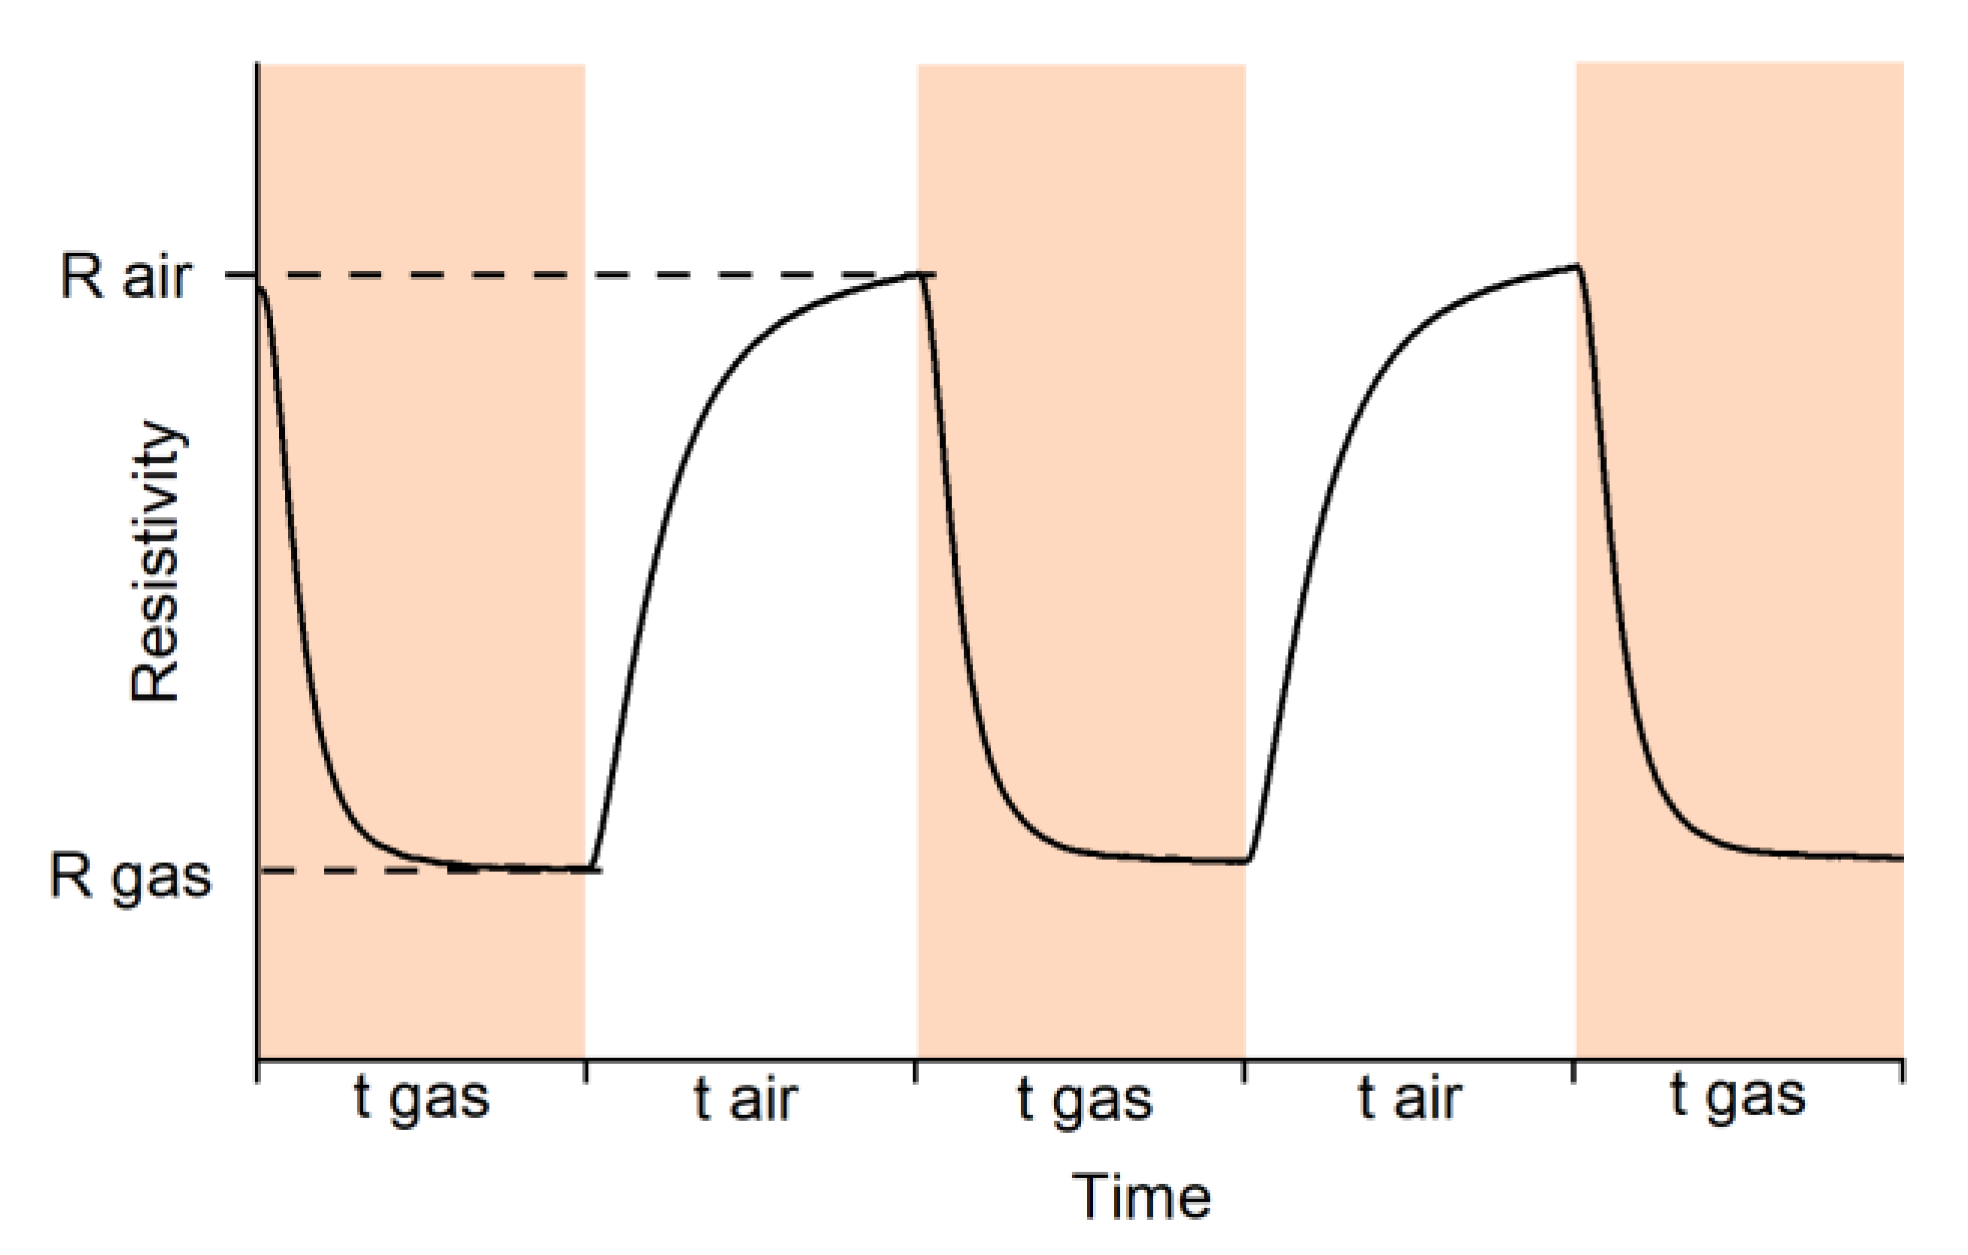
When detecting CO, a decrease in the resistance of SnO2_300 and SnO2_Mn_1 was observed in the presence of the target gas, which is typical for n-type semiconductors (Figure 11). This decrease in resistance is due to the CO oxidation with chemisorbed oxygen:
2 CO gas + O 2 ads 2 CO 2 gas + e
CO gas + O ads CO 2 gas + e
where CO(gas) is CO molecule in the gas phase, O 2 ads , O ads are different forms of chemisorbed oxygen, CO2(gas) is a product of the oxidation of CO gas desorbed into the gas phase. Upon change to an atmosphere of dry air, a return of the resistance to the value close to the initial value in the air was observed.
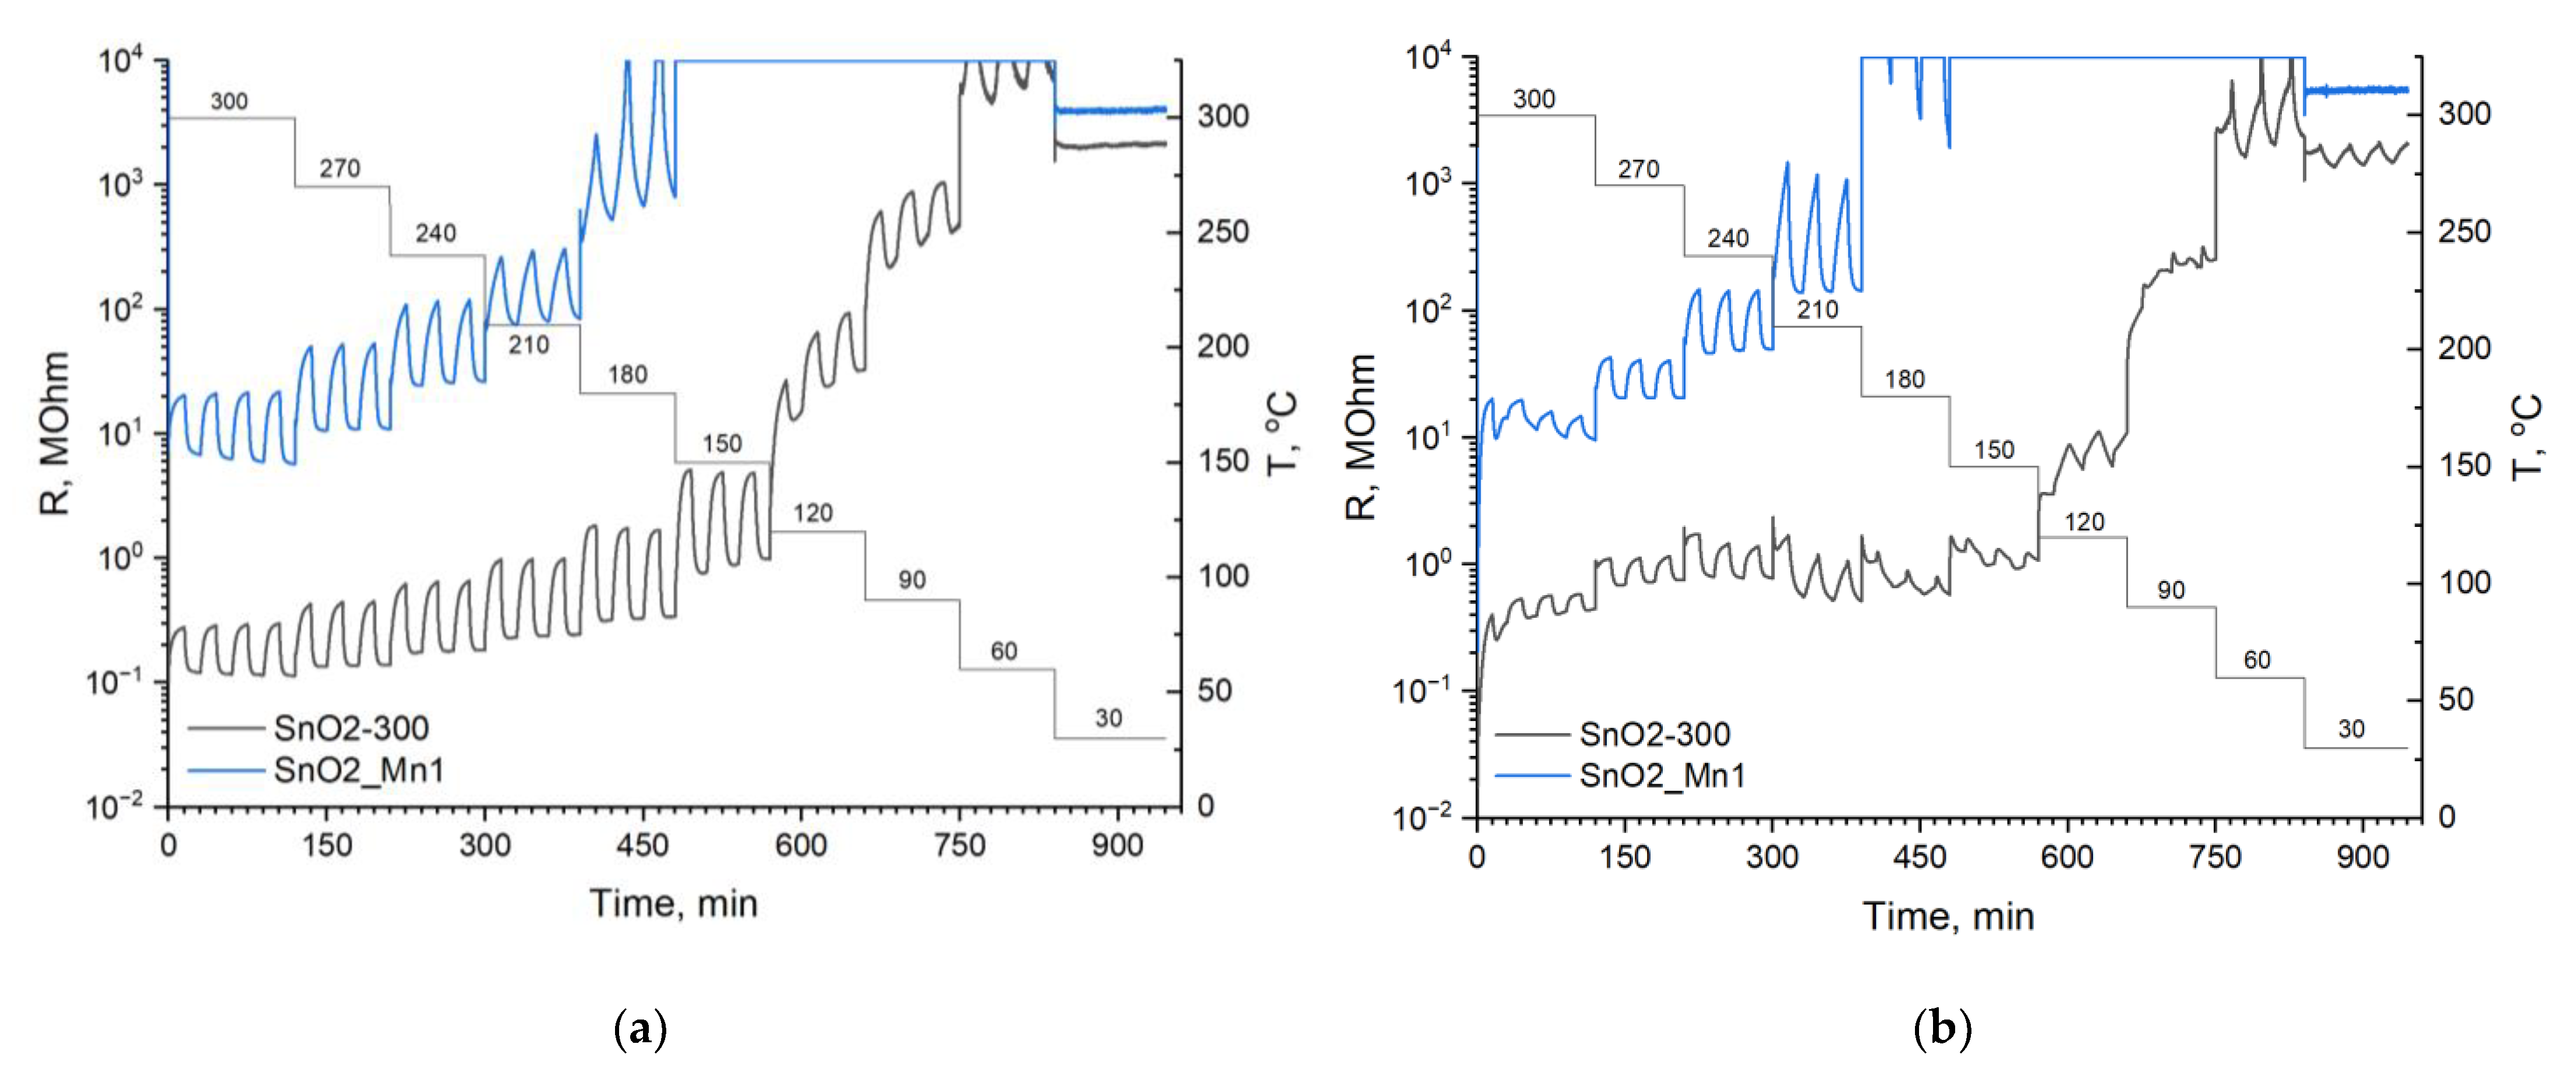
The resistance of SnO2_Mn1 appeared to be higher than that of unmodified SnO2 by two orders of magnitude (Figure 12a). Previously, it was shown that manganese cations are introduced into the SnO2 crystal structure, and these observations indicate the formation of acceptor defects in the SnO2 structure in SnO2/MnOx composites. Therefore, the oxidation state of manganese intruded SnO2 crystal structure is less than +4. Considering the ionic radii of the Mnn+ cations in an octahedral oxygen environment and the stability diagram of manganese oxides [35], the most suitable manganese cation for the SnO2 structure is the high-spin Mn3+, and the reaction of formation of a solid solution in SnO2 will take the following form (Kröger–Vink notation):
Mn 2 O 3 2 SnO 2 2 Mn Sn + 3 O O × + V O
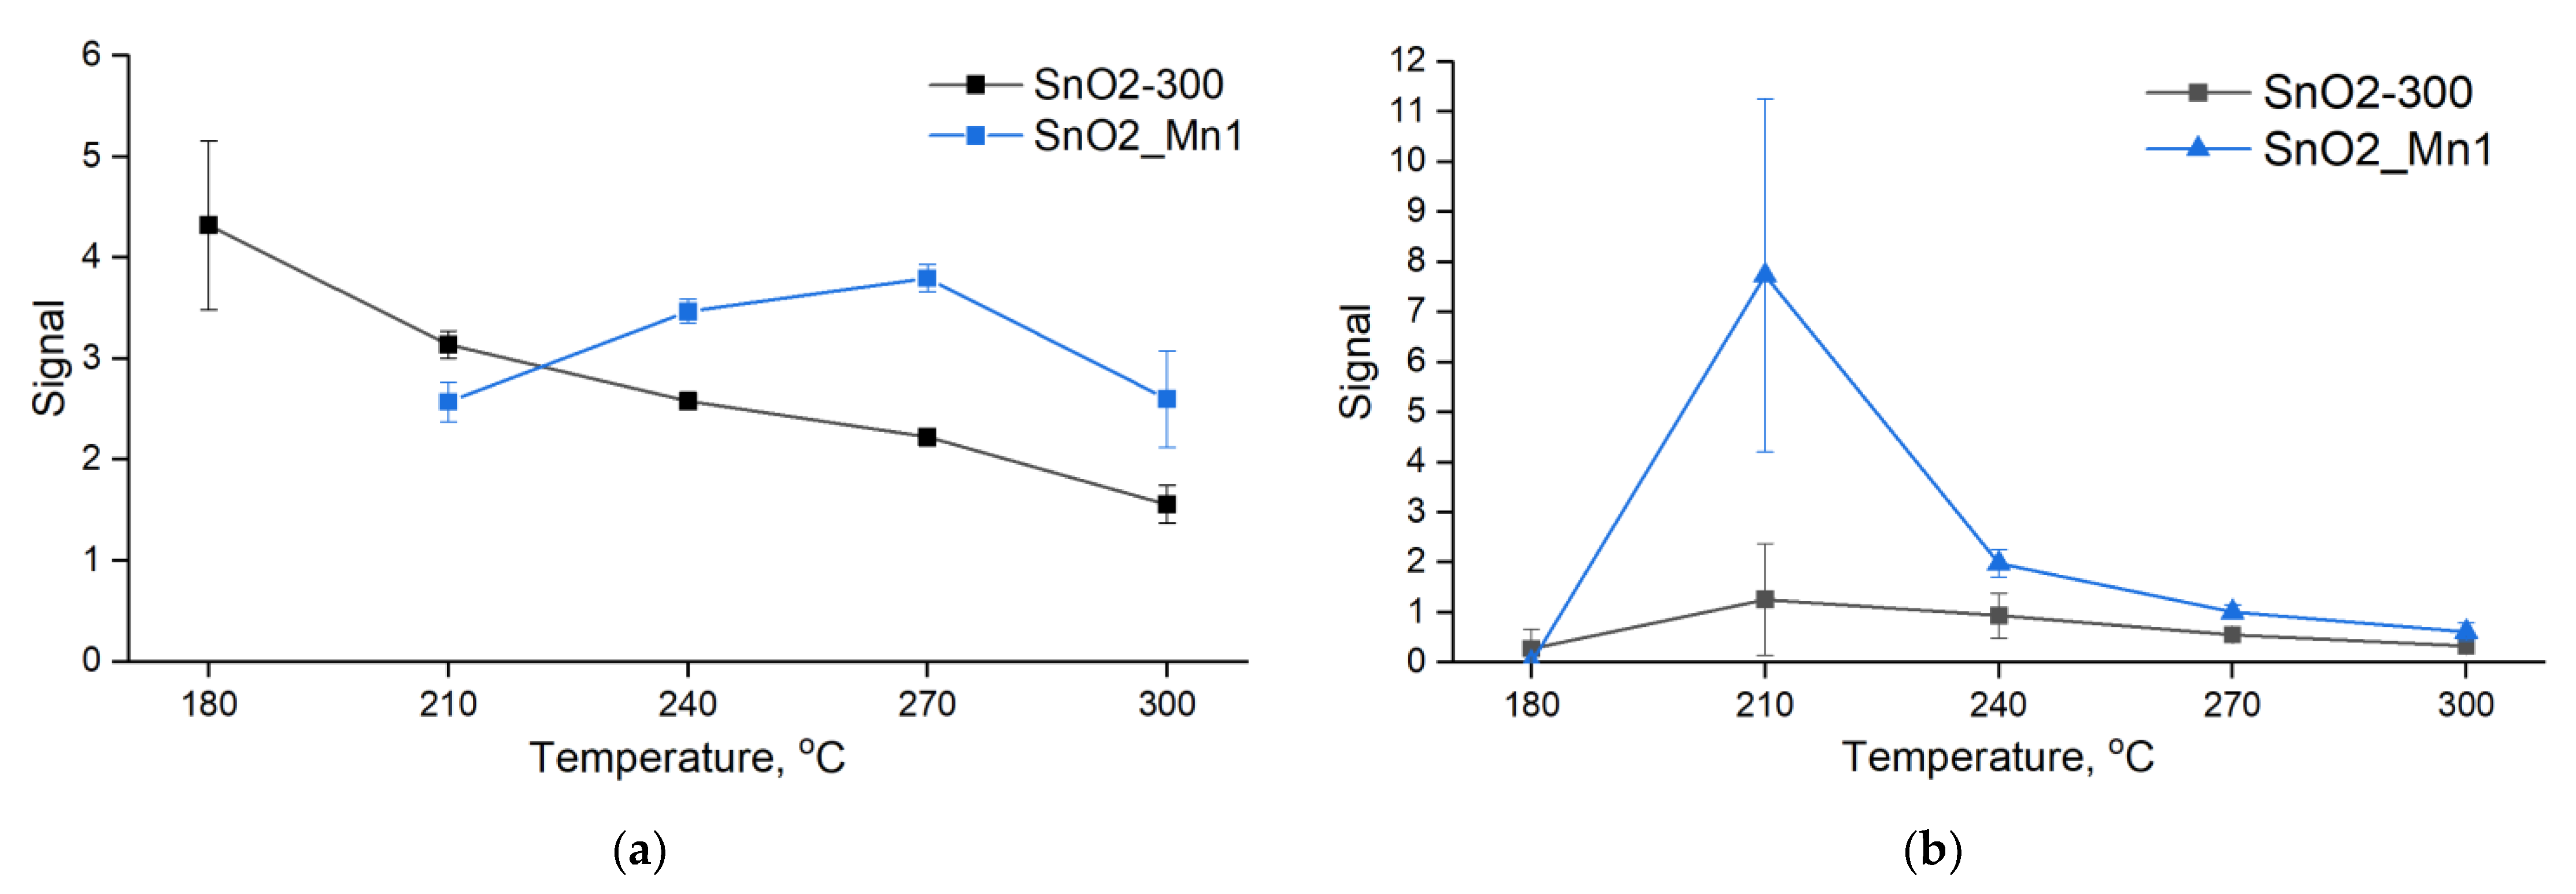
It is shown in Figure 12 that the resistance of materials increases with decreasing temperature. However, for temperatures below 180 °C, a correct resistance measurement for the SnO2_Mn1 material is impossible because of overcoming the threshold value of used equipment.
Measurements in NO containing atmosphere (4 ppm NO in dry air) revealed that the SnO2 signal shape has a more complex profile (Figure 12b) than a typical one (Figure 11). In this case, signal inversion is observed for tin dioxide at temperatures below 150 °C.
During the interaction of SnO2 and SnO2/MnOx composites with NO, several competing reactions can occur with the capture of electrons from the conduction band of SnO2:
NO gas + 1 2 O 2 gas NO 2 gas
NO 2 gas + e NO 2 ads
and vice versa, with the injection of electrons localized on chemisorbed oxygen into the conduction band of SnO2:
NO gas + O 2 ads NO 2 gas + 1 2 O 2 gas + e
The modification of SnO2 with manganese oxides leads to the prevalence of the NO oxidation reaction with the participation of ionized forms of chemisorbed oxygen, which agrees with the results obtained by the EPR spectroscopy.
The likely reason for the inversion of the SnO2 signal when detecting NO is a decrease in the concentration of chemisorbed oxygen forms with strong oxidizing properties. As shown in previous works, at temperatures below 200 °C, physically adsorbed O2 molecules and O2 radical anions predominate on the SnO2 surface. At the same time, tin dioxide, synthesized in this work, is characterized by an extremely low concentration of chemisorbed oxygen in O2 form (Figure 10). According to the Weitz limitation [36], in the case of equilibrium ionosorption, the degree of surface coverage by charged particles cannot exceed 10−3 parts of the monolayer. Thus, an increase in the concentration of chemisorbed oxygen in O2 form upon modification of the SnO2 surface with manganese oxides (Figure 10) hinders the adsorption of the resulting NO2 in NO2 form (reaction (9)), which eliminates the inversion of the sensor response.
The temperature dependences of the sensor response of SnO2 and SnO2_Mn1 materials toward CO and NO are shown in Figure 13a,b. High values of the standard deviation of the signal magnitude at low temperatures may be evidence of a violation of the reversibility of the reactions that determine the sensor response of the material and may be a consequence of hardware noise when measuring high resistances.
To study the influence of the processes leading to the formation of a sensor response, the concentration dependences of the signal when detecting CO and NO at temperatures of the maximum stable signal was investigated. In addition, to clarify the effect of MnOx surface segregation on the sensor properties of SnO2, a sensor was made of SnO2_Mn1_w material, which contains manganese only in the form of cations introduced into the SnO2 structure.
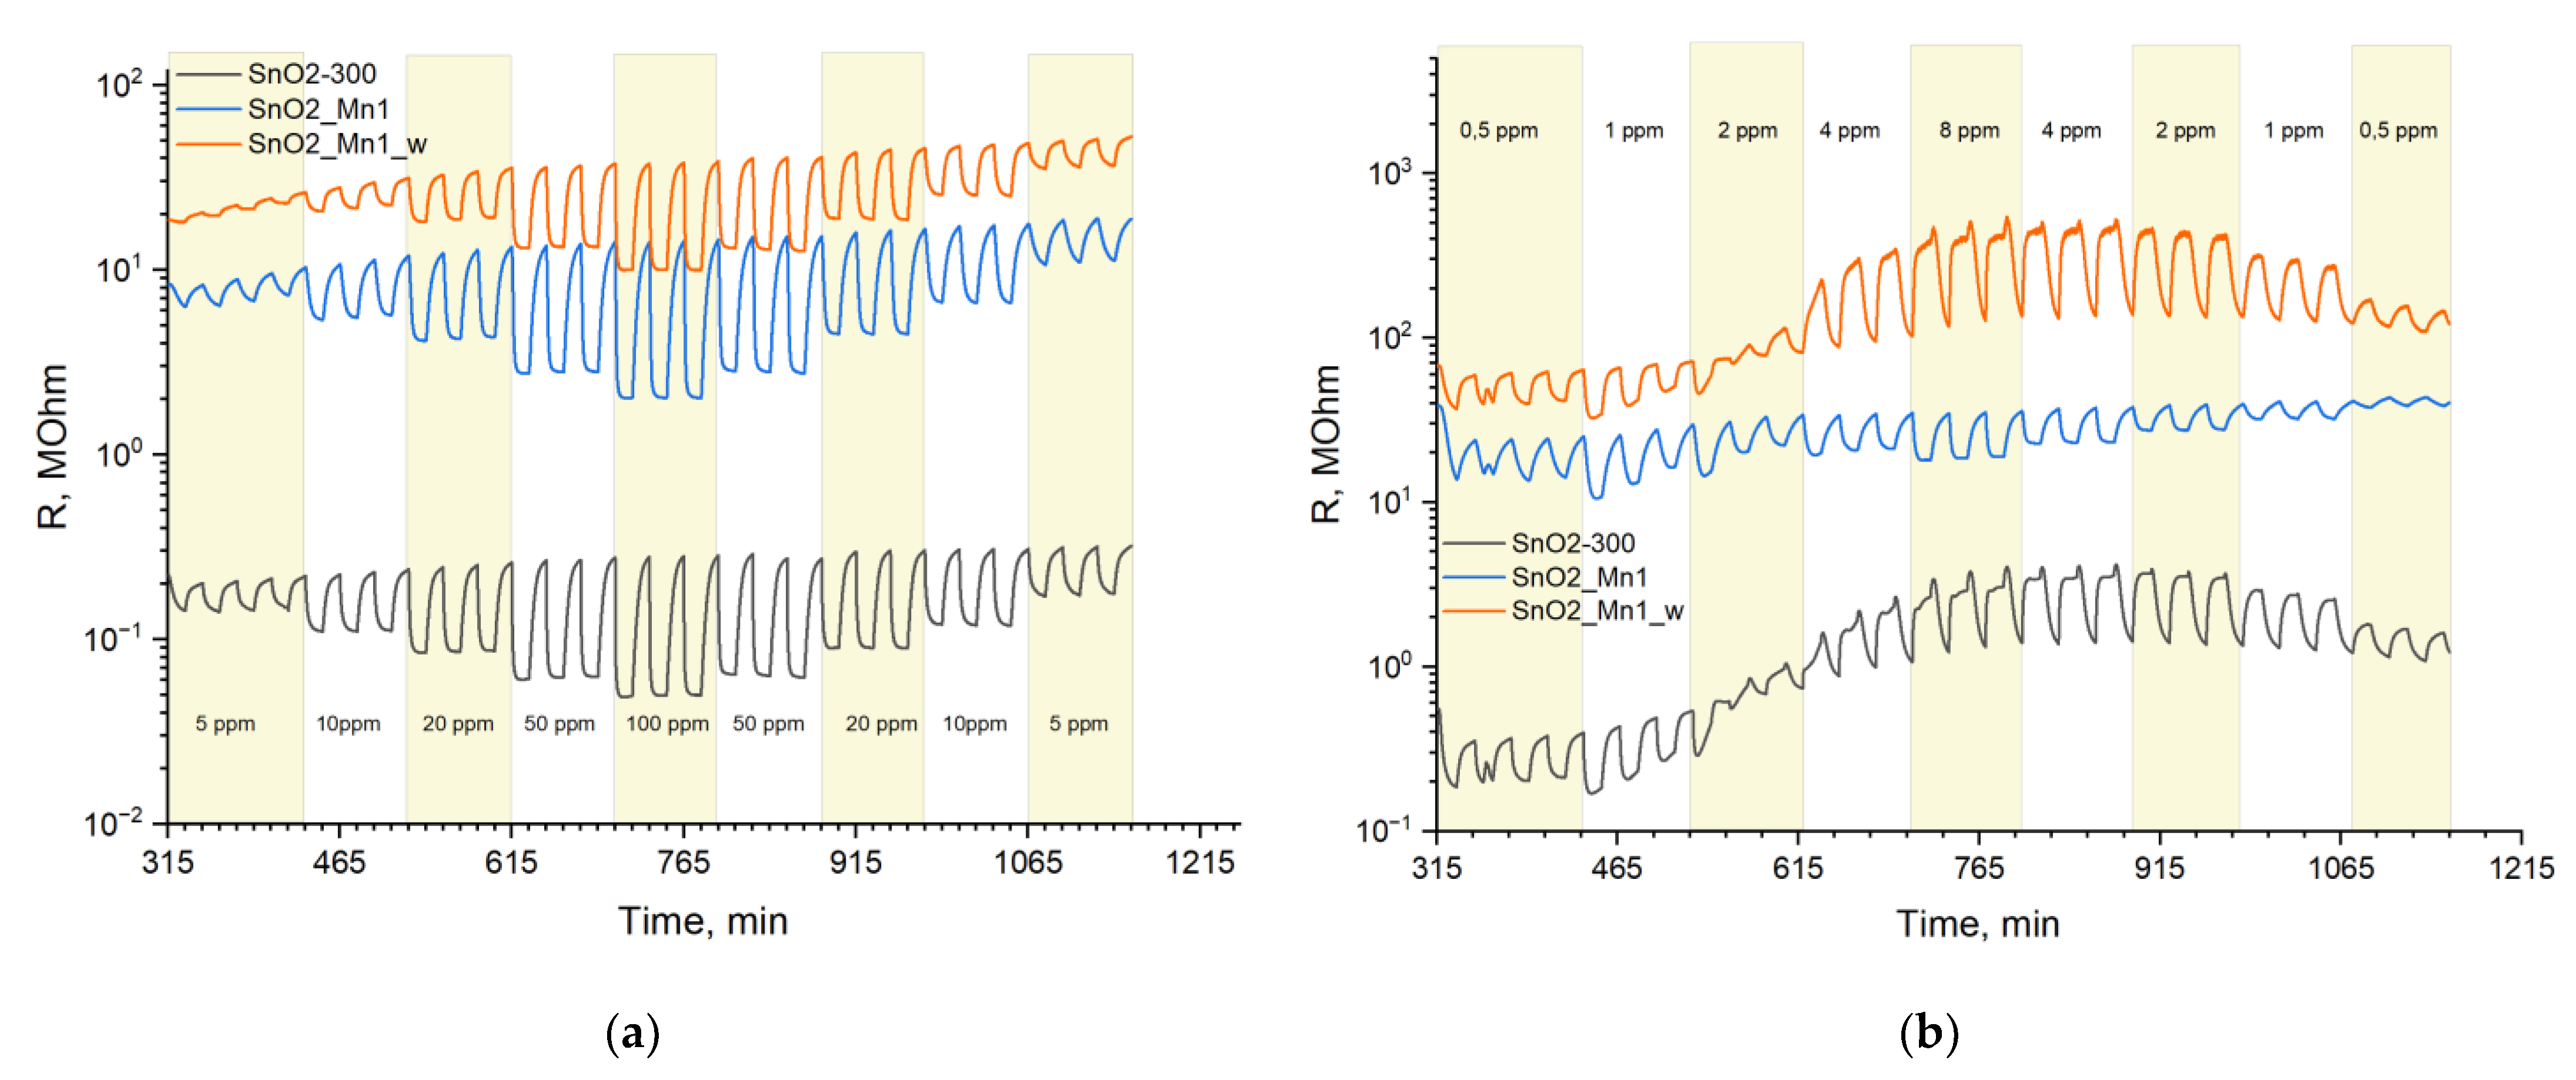
The signal of SnO2-300 and SnO2/MnOx composites toward CO seemed to be the simplest and most predictable. For this reason, CO was chosen to study general patterns. The dependences of the materials resistance with a change in CO concentration at constant measurement temperature are shown in Figure 14a.
The resistance of the SnO2_Mn1_w material was found to be on par with the parent SnO2_Mn1 material. Therefore, an increase in the resistance of tin dioxide modified with manganese oxides is a consequence of the incorporation of manganese (III) cations into the crystal structure of the oxide (Equation (7)).
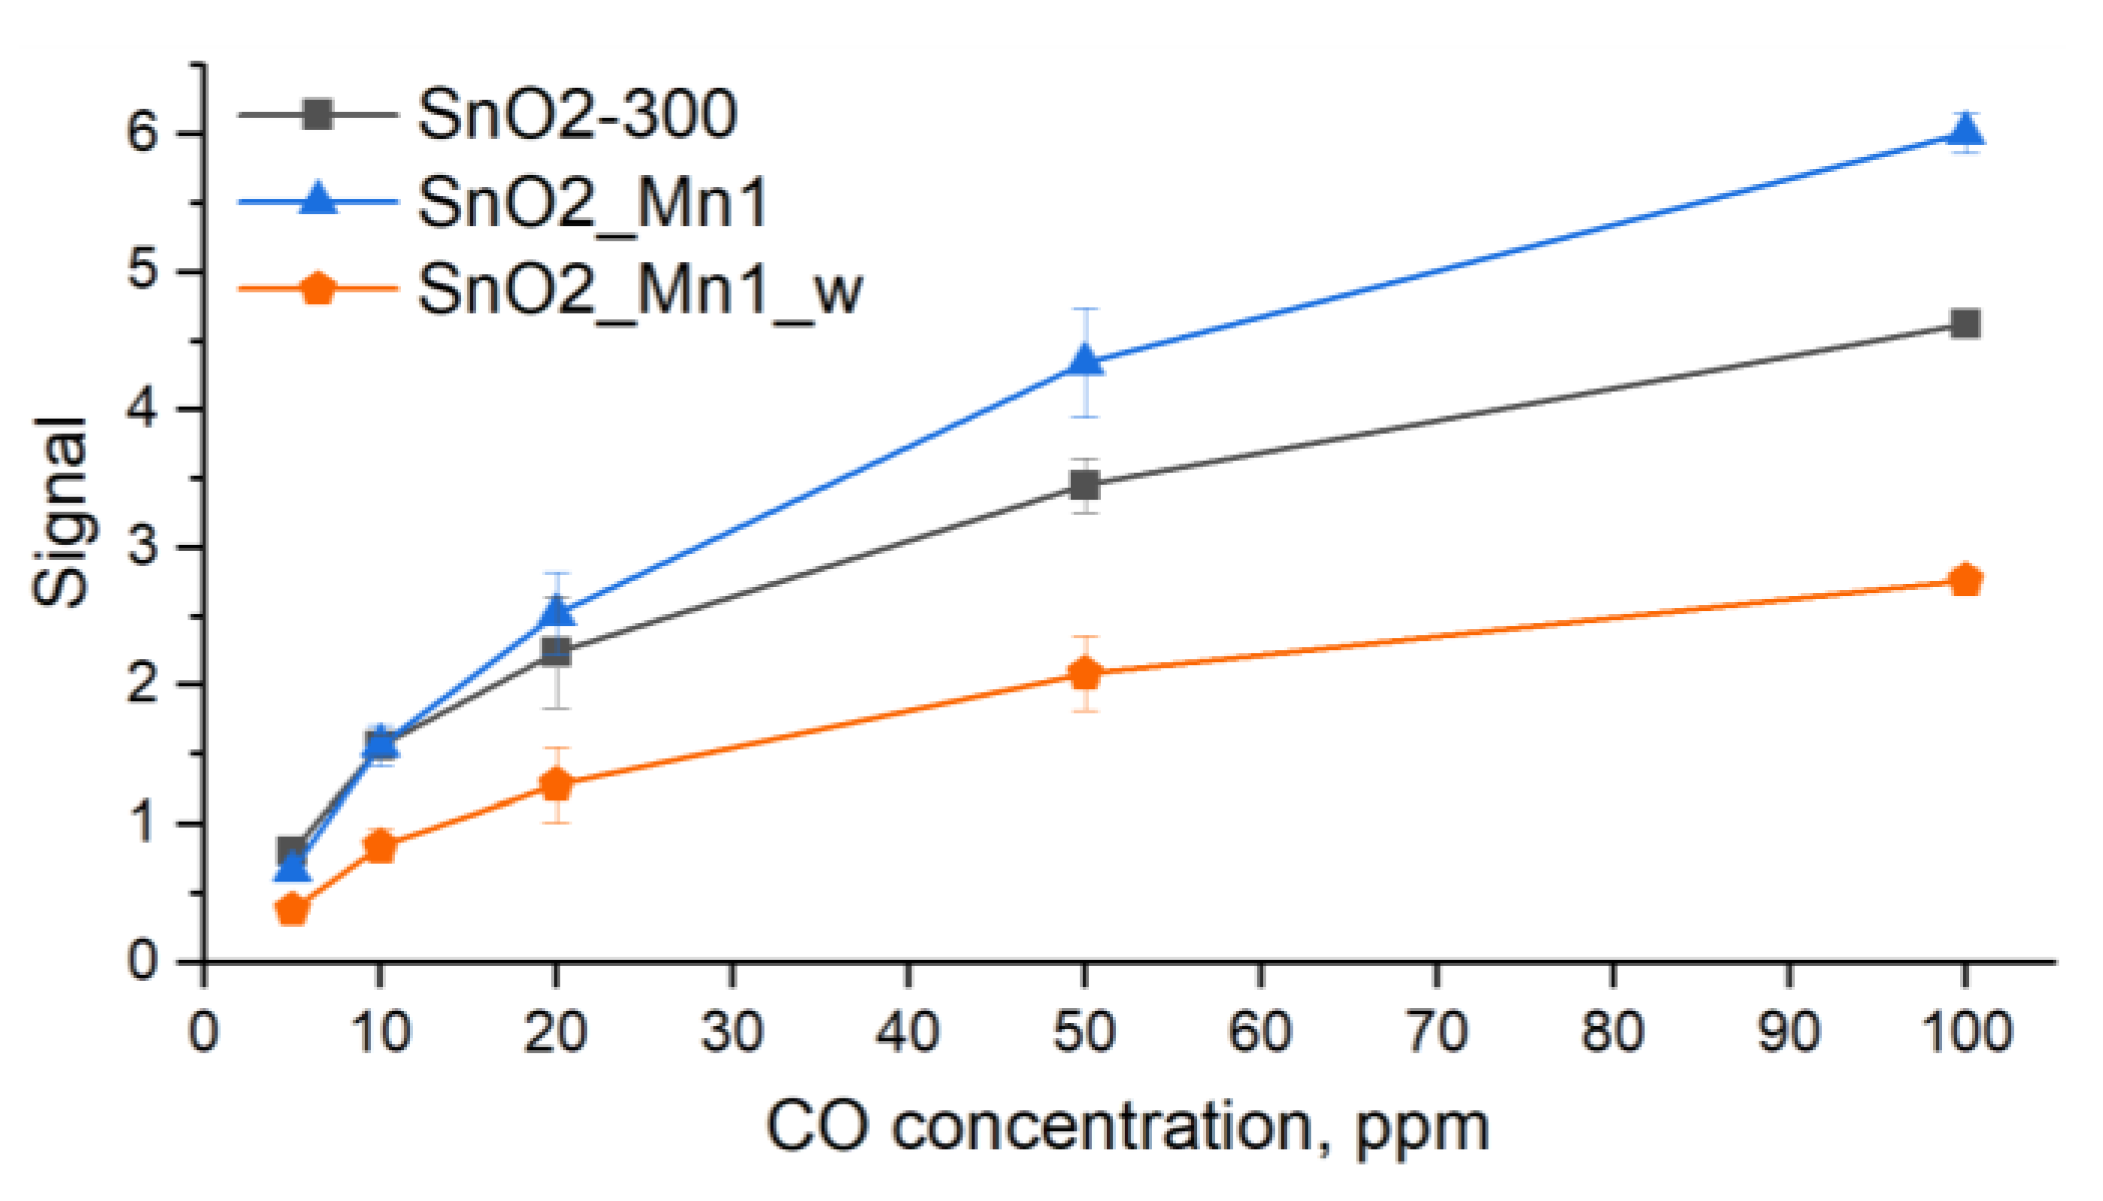
Even after prolonged annealing, as seen in Figure 14a, there is some drift of the baseline (resistance in clean air), which indicates that the equilibrium was not fully reached during the measurements. The signal value of the SnO2_Mn1 material is slightly superior compared to unmodified SnO2-300, while the SnO2_Mn1_w material is noticeably inferior to SnO2 (Figure 15).
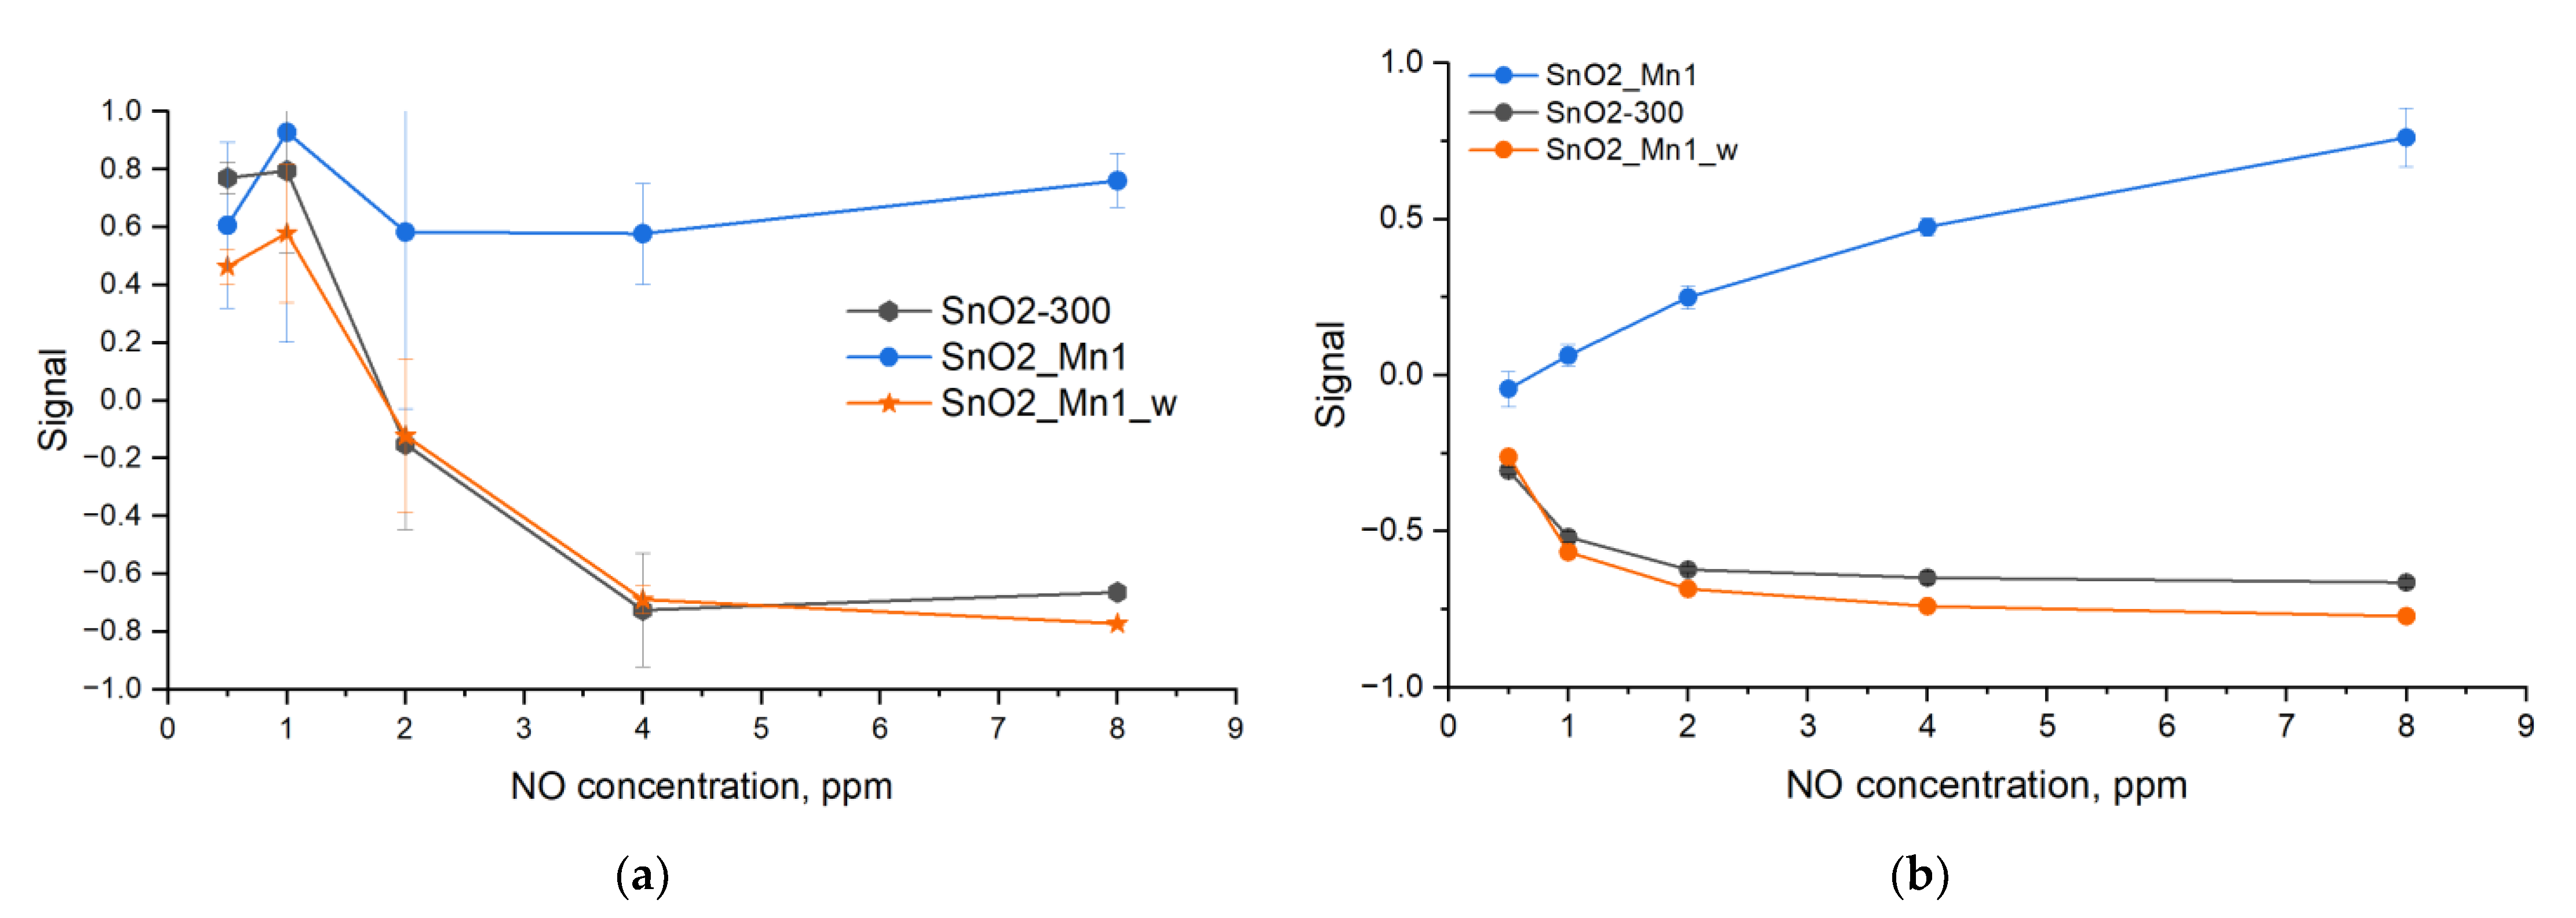
When studying the temperature dependence of the signal to nitrogen monoxide, it was found that unmodified SnO2 in a certain temperature range demonstrate signal inversion. To explain the observed phenomena, NO was chosen to study the concentration dependence of the signal (Figure 14b). The results show that the sensor signal of etched SnO2_Mn1_w has the same shape as that of SnO2-300. Therefore, the surface segregation of MnOx defines the shape of the sensor signal of the SnO2/MnOx composites toward NO.
Note that the signal decreases for SnO2_Mn1 as the NO concentration increases from 1 ppm to 2 ppm (Figure 16a). Unmodified SnO2-300 and SnO2_Mn1_w in this interval detects NO as a reducing agent and, when the concentration exceeds 4 ppm, even when descending gas concentration, as an oxidizing agent (Figure 16b). It means that the action of sufficiently high concentrations of nitrogen monoxide causes poisoning of the surface of the material by NO oxidation products according to Reaction (9), causing the replacement of chemisorbed oxygen by surface nitrite ions, which leads to the suppression of Reaction (10). The presence of MnOx segregation on the SnO2 surface does not exclude the poisoning of the material surface. Still, it promotes Reaction (10), as a result of which the SnO2_Mn1 material has a time-stable signal toward NO and a small baseline drift (Figure 16b).

4. Conclusions

Nanocomposites SnO2/MnOx with 4–5 nm grain size and specific surface area of 100–105 m2/g were prepared by the chemical precipitation of SnO2 and its modification with MnOx by impregnation-annealing technique. The detailed characterization was carried out to determine microstructure parameters (SEM, XRD, BET, Raman spectroscopy), to investigate phase and elemental composition of synthesized materials, including manganese distribution between bulk and surface of SnO2 grains (Raman spectroscopy, EDX mapping, TXRF, ICP-MS) and, finally, to obtain the information about the chemical state of active surface centers (XPS, EPR, TPR-H2). Several significant observations were made: (1) although the manganese is introduced as a surface modifier, there is a doping effect caused by the redistribution of manganese between surface segregation and SnO2 crystal structure; (2) manganese presents in SnO2/MnOx nanocomposites in two different states–as MnO2 surface phase and as Mn(III) ions in the SnO2 crystal structure; (3) surface manganese-containing segregation has a significant influence on sensor properties of SnO2/MnOx nanocomposites. The presence of manganese in the total concentration of Mn: Sn = 1 mol.% increases SnO2 sensitivity when detecting typical reducing gas CO and prevents signal inversion when detecting NO.

Supplementary Materials

The following are available online at https://www.mdpi.com/article/10.3390/nano13091437/s1, Figure S1: Powder X-ray diffraction pattern of synthesized Mn(acac)3 in comparison with a calculated pattern of δ-Mn(acac)3; Figure S2: SEM images obtained with Zeiss Supra 40 FE-SEM microscope at ×750·103 of the following samples: (a) SnO2_Mn10; (b) SnO2_Mn1_w; Figure S3: SEM images, Sn and Mn EDX maps of SnO2_Mn1 (a–c), SnO2_Mn10 (d–f), SnO2_Mn10_w (g–i), respectively, at ×105 magnification.

Author Contributions

Conceptualization, M.R.; methodology, E.K., D.F. and M.R.; formal analysis, R.E.; investigation, R.E., D.F. and E.K.; data curation, R.E.; writing—original draft preparation, R.E.; writing—review and editing, M.R.; supervision, M.R. All authors have read and agreed to the published version of the manuscript.

Funding

This research was funded by Russian Science Foundation, grant number 22-13-00111, https://rscf.ru/en/project/22-13-00111/ (accessed on 13 April 2023).

Institutional Review Board Statement

Not applicable.

Informed Consent Statement

Not applicable.

Data Availability Statement

The data that support the findings of this study are available from the corresponding author upon reasonable request.

Acknowledgments

Raman and FTIR experiments, TG/DSC/MS experiment and verification of NO concentration (Teledyne API N500 CAPS NOX Analyzer) were performed using the equipment purchased through the Lomonosov Moscow State University Program of Development. EPR experiments were performed using the facilities of the Collective Use Center at Moscow State University. The research infrastructure of the “Educational and Methodical Center of Lithography and Microscopy”, M.V. Lomonosov Moscow State University, was used. The research by SEM and EDX was performed using the equipment of the Joint Research Center for Physical Methods of Research of Kurnakov Institute of General and Inorganic Chemistry of the Russian Academy of Sciences. The authors acknowledge Sapkov I. and Bozhyev I. from the Faculty of Physics, MSU, for SEM investigations; Platonov V. from the Chemistry Department, MSU, for technical support, XRD and EDX analysis; Shatalova T. from the Chemistry Department, MSU, for performing of TG/DSC/MS experiment; Kapitanova O. from Chemistry Department, MSU, for Raman measurements on Horiba spectrometer.

Conflicts of Interest

The authors declare no conflict of interest.

References

  1. Korotčenkov, G.S. Properties, Advantages and Shortcomings for Applications Volume 1: Conventional Approaches. In Handbook of Gas Sensor Materials; Springer: Cham, Switzerland, 2013. [Google Scholar]
  2. Marikutsa, A.V.; Vorob´eva, N.A.; Rumyantseva, M.N.; Gas´kov, A.M. Active Sites on the Surface of Nanocrystalline Semiconductor Oxides ZnO and SnO2 and Gas Sensitivity. Russ. Chem. Bull. 2017, 66, 1728–1764. [Google Scholar] [CrossRef]
  3. Ramesh, K.; Chen, L.; Chen, F.; Liu, Y.; Wang, Z.; Han, Y.-F. Re-Investigating the CO Oxidation Mechanism over Unsupported MnO, Mn2O3 and MnO2 Catalysts. Catal Today 2008, 131, 477–482. [Google Scholar] [CrossRef]
  4. Yang, W.; Peng, Y.; Wang, Y.; Wang, Y.; Liu, H.; Su, Z.; Yang, W.; Chen, J.; Si, W.; Li, J. Controllable Redox-Induced in-Situ Growth of MnO2 over Mn2O3 for Toluene Oxidation: Active Heterostructure Interfaces. Appl. Catal. B 2020, 278, 119279. [Google Scholar] [CrossRef]
  5. Fliegel, W.; Behr, G.; Werner, J.; Krabbes, G. Preparation, Development of Microstructure, Electrical and Gas-Sensitive Properties of Pure and Doped SnO2 Powders. Sens. Actuators B Chem. 1994, 19, 474–477. [Google Scholar] [CrossRef]
  6. Lavanya, N.; Sekar, C.; Fazio, E.; Neri, F.; Leonardi, S.G.; Neri, G. Development of a Selective Hydrogen Leak Sensor Based on Chemically Doped SnO2 for Automotive Applications. Int. J. Hydrog. Energy 2017, 42, 10645–10655. [Google Scholar] [CrossRef]
  7. Yang, F.; Guo, Z. Comparison of the Enhanced Gas Sensing Properties of Tin Dioxide Samples Doped with Different Catalytic Transition Elements. J. Colloid Interface Sci. 2015, 448, 265–274. [Google Scholar] [CrossRef]
  8. Gu, F.; Wang, S.F.; Lü, M.K.; Qi, Y.X.; Zhou, G.J.; Xu, D.; Yuan, D.R. Luminescent Properties of Mn2+-Doped SnO2 Nanoparticles. Inorg. Chem. Commun. 2003, 6, 882–885. [Google Scholar] [CrossRef]
  9. Chesler, P.; Hornoiu, C.; Mihaiu, S.; Vladut, C.; Calderon-Moreno, J.M.; Anastasescu, M.; Moldovan, C.; Firtat, B.; Brasoveanu, C.; Muscalu, G.; et al. Nanostructured SnO2–ZnO composite gas sensors for selective detection of carbon monoxide. Beilstein J. Nanotechnol. 2016, 7, 2045–2056. [Google Scholar] [CrossRef]
  10. Stanoiu, A.; Somacescu, S.; Calderon-Moreno, J.M.; Teodorescu, V.S.; Florea, O.G.; Sackmann, A.; Simion, C.E. Low level NO2 detection under humid background and associated sensing mechanism for mesoporous SnO2. Sens. Actuators B 2016, 231, 166–174. [Google Scholar] [CrossRef]
  11. Sun, Q.; Xu, X.; Peng, H.; Fang, X.; Liu, W.; Ying, J.; Yu, F.; Wang, X. SnO2-Based Solid Solutions for CH4 Deep Oxidation: Quantifying the Lattice Capacity of SnO2 Using an X-Ray Diffraction Extrapolation Method. Chin. J. Catal. 2016, 37, 1293–1302. [Google Scholar] [CrossRef]
  12. Yin, X.-T.; Wu, S.-S.; Dastan, D.; Nie, S.; Liu, Y.; Li, Z.-G.; Zhou, Y.-W.; Li, J.; Faik, A.; Shan, K.; et al. Sensing Selectivity of SnO2-Mn3O4 Nanocomposite Sensors for the Detection of H2 and CO Gases. Surf. Interfaces 2021, 25, 101190. [Google Scholar] [CrossRef]
  13. Gulevich, D.; Rumyantseva, M.; Gerasimov, E.; Khmelevsky, N.; Tsvetkova, E.; Gaskov, A. Synergy Effect of Au and SiO2 Modification on SnO2 Sensor Properties in VOCs Detection in Humid Air. Nanomaterials 2020, 10, 813. [Google Scholar] [CrossRef]
  14. Vladimirova, S.A.; Rumyantseva, M.N.; Filatova, D.G.; Chizhov, A.S.; Khmelevsky, N.O.; Konstantinova, E.A.; Kozlovsky, V.F.; Marchevsky, A.V.; Karakulina, O.M.; Hadermann, J.; et al. Cobalt Location in p-CoOx/n-SnO2 Nanocomposites: Correlation with Gas Sensor Performances. J. Alloy. Compd. 2017, 721, 249–260. [Google Scholar] [CrossRef]
  15. Guo, Y.; Zeng, L.; Xu, X.; Liu, Y.; Liu, Y.; Fu, X.; Gao, Z.; Qian, Z.; Xu, J.; Fang, X.; et al. Regulating SnO2 Surface by Metal Oxides Possessing Redox or Acidic Properties: The Importance of Active O2/O22− and Acid Sites for Toluene Deep Oxidation. Appl. Catal. A Gen. 2020, 605, 117755. [Google Scholar] [CrossRef]
  16. Shah, S.S.; Aziz, M.d.A.; Mohamedkhair, A.K.; Qasem, M.A.A.; Hakeem, A.S.; Nazal, M.K.; Yamani, Z.H. Preparation and Characterization of Manganese Oxide Nanoparticles-Coated Albizia Procera Derived Carbon for Electrochemical Water Oxidation. J. Mater. Sci. Mater. Electron. 2019, 30, 16087–16098. [Google Scholar] [CrossRef]
  17. Babich, I.V.; Davydenko, L.A.; Sharanda, L.F.; Plyuto, Y.V.; Makkee, M.; Moulijn, J.A. Oxidative Thermolysis of Mn(acac)3 on the Surface of γ-Alumina Support. Acta 2007, 456, 145–151. [Google Scholar] [CrossRef]
  18. Kumar, V.G.; Aurbach, D.; Gedanken, A. Influence of PH on the Structure of the Aqueous Sonolysis Products of Manganese(III) Acetylacetonate. J. Mater. Res. 2002, 17, 1706–1710. [Google Scholar] [CrossRef]
  19. Venugopal, B.; Nandan, B.; Ayyachamy, A.; Balaji, V.; Amirthapandian, S.; Panigrahi, B.K.; Paramasivam, T. Influence of Manganese Ions in the Band Gap of Tin Oxide Nanoparticles: Structure, Microstructure and Optical Studies. RSC Adv. 2014, 4, 6141–6150. [Google Scholar] [CrossRef]
  20. Ahmad, N.; Khan, S.; Ansari, M.M.N. Optical, Dielectric and Magnetic Properties of Mn Doped SnO2 Diluted Magnetic Semiconductors. Ceram. Int. 2018, 44, 15972–15980. [Google Scholar] [CrossRef]
  21. Lee, C.-H.; Nam, B.-A.; Choi, W.-K.; Lee, J.-K.; Choi, D.-J.; Oh, Y.-J. Mn:SnO2 Ceramics as p-Type Oxide Semiconductor. Mater. Lett. 2011, 65, 722–725. [Google Scholar] [CrossRef]
  22. Pinchas, S.; Silver, B.L.; Laulicht, I. Infrared Absorption Spectra of the 18O-Labeled Acetylacetonates of Cr(III) and Mn(III). J. Chem. Phys. 1967, 46, 1506–1510. [Google Scholar] [CrossRef]
  23. Geremia, S.; Demitri, N. Crystallographic Study of Manganese(III) Acetylacetonate: An Advanced Undergraduate Project with Unexpected Challenges. J. Chem. Educ. 2005, 82, 460. [Google Scholar] [CrossRef]
  24. Kumar, A.; Rout, L.; Dhaka, R.S.; Samal, S.L.; Dash, P. Design of a Graphene Oxide-SnO2 Nanocomposite with Superior Catalytic Efficiency for the Synthesis of β-Enaminones and β-Enaminoesters. RSC Adv. 2015, 5, 39193–39204. [Google Scholar] [CrossRef]
  25. Abello, L.; Bochu, B.; Gaskov, A.; Koudryavtseva, S.; Lucazeau, G.; Roumyantseva, M. Structural Characterization of Nanocrystalline SnO2 by X-Ray and Raman Spectroscopy. J. Solid State Chem. 1998, 135, 78–85. [Google Scholar] [CrossRef]
  26. Sannasi, V.; Subbian, K. Influence of Moringa Oleifera Gum on Two Polymorphs Synthesis of MnO2 and Evaluation of the Pseudo-Capacitance Activity. J. Mater. Sci. Mater. Electron. 2020, 30, 17120–17132. [Google Scholar] [CrossRef]
  27. Baral, A.; Das, D.P.; Minakshi, M.; Ghosh, M.K.; Padhi, D.K. Probing Environmental Remediation of RhB Organic Dye Using a-MnO2 under Visible- Light Irradiation: Structural, Photocatalytic and Mineralization Studies. ChemistrySelect 2016, 1, 4277–4285. [Google Scholar] [CrossRef]
  28. Post, J.; Mckeown, D.; Heaney, P. Raman Spectroscopy Study of Manganese Oxides: Tunnel Structures. Am. Mineral. 2020, 105, 1175–1190. [Google Scholar] [CrossRef]
  29. Stosnach, H. Trace Element Analysis Using a Benchtop Txrf Spectrometer. ICDD Adv. X-ray Anal. 2005, 20, 141–145. [Google Scholar]
  30. Manickam, M.; Singh, P.; Issa, T.B.; Thurgate, S.; De Marco, R. Lithium insertion into manganese dioxide electrode in MnO2/Zn aqueous battery Part I. A preliminary study. J. Power Sources 2004, 130, 254–259. [Google Scholar] [CrossRef]
  31. Stranick, M.A. Mn2O3 by XPS. Surf. Sci. Spectra 1999, 6, 39–46. [Google Scholar] [CrossRef]
  32. Stranick, M.A. MnO2 by XPS. Surf. Sci. Spectra 1999, 6, 31–38. [Google Scholar] [CrossRef]
  33. Payne, B.P.; Biesinger, M.C.; McIntyre, N.S. Use of Oxygen/Nickel Ratios in the XPS Characterisation of Oxide Phases on Nickel Metal and Nickel Alloy Surfaces. J. Electron Spectrosc. Relat. Phenom. 2012, 185, 159–166. [Google Scholar] [CrossRef]
  34. Dupin, J.-C.; Gonbeau, D.; Vinatier, P.; Levasseur, A. Systematic XPS Studies of Metal Oxides, Hydroxides and Peroxides. Phys. Chem. Chem. Phys. 2000, 2, 1319–1324. [Google Scholar] [CrossRef]
  35. Cheraghi, A.; Yoozbashizadeh, H.; Ringdalen, E.; Safarian, J. Kinetics and Mechanism of Low-Grade Manganese Ore Reduction by Natural Gas. Metall. Mater. Trans. B 2019, 50, 1566–1580. [Google Scholar] [CrossRef]
  36. Oprea, A.; Bârsan, N.; Weimar, U. Characterization of Granular Metal Oxide Semiconductor Gas Sensitive Layers by Using Hall Effect Based Approaches. J. Phys. D Appl. Phys. 2007, 40, 7217. [Google Scholar] [CrossRef]
Figure 1. Thermogravimetry and differential scanning calorimetry curves of Mn(acac)3 decomposing in airflow.
Nanomaterials 13 01437 g001
Figure 2. FTIR spectra of blank SnO2 and SnO2/MnOx materials.
Nanomaterials 13 01437 g002
Figure 3. SEM images obtained with Zeiss Supra 40 FE-SEM microscope at ×30·103 magnification of the following samples: (a) SnO2-300 (b) SnO2_Mn10; (c) SnO2_Mn10_w.
Nanomaterials 13 01437 g003
Figure 4. Powder X-ray diffraction patterns of prepared materials compared with a calculated pattern of cassiterite-type SnO2 (ICDD 41-1445).
Nanomaterials 13 01437 g004
Figure 5. (a) Raman spectra of blank SnO2, SnO2/MnOx nanocomposites with molar Mn:Sn ratio of 1% and 10% and MnO2 («pure», «Reakhim») obtained with 532 nm radiation. Intensities were normalized; (b) Raman spectra of synthesized materials were obtained with 633 nm radiation. Intensities were normalized. Baseline correction was implemented. The assignment of the frequencies of the SnO2 peaks was performed according to the data from [25].
Nanomaterials 13 01437 g005
Figure 6. SEM images of SnO2_Mn10 sample at different magnifications: (a) ×102; (b) ×103; (c) ×105; and manganese distribution EDX maps of SnO2_Mn10 sample at same magnifications: (d) ×102; (e) ×103; (f) ×105.
Nanomaterials 13 01437 g006aNanomaterials 13 01437 g006b
Figure 7. XPS spectrum of SnO2_Mn1 in Mn 2p region.
Nanomaterials 13 01437 g007
Figure 8. XPS spectra of (a) SnO2-300 and (b) SnO2_Mn1 in the O 1s region. The «O (lattice)» curve corresponds to the main peak, and «O (surface)»–is the minor peak.
Nanomaterials 13 01437 g008
Figure 9. TPR-H2 curves of SnO2-300 and SnO2_Mn1.
Nanomaterials 13 01437 g009
Figure 10. EPR spectra of SnO2-300, SnO2_Mn1 and SnO2_Mn1_w. Regions of signals of manganese ions and O2 ions are highlighted.
Nanomaterials 13 01437 g010
Figure 11. A typical shape of resistance dependence on test gas composition of n-type semiconducting oxide during the reducing gas detection.
Nanomaterials 13 01437 g011
Figure 12. Resistance curves of SnO2-300 and SnO2_Mn1 during the cyclic test gas composition change at different temperatures when detecting: (a) 20 ppm CO; (b) 4 ppm NO.
Nanomaterials 13 01437 g012
Figure 13. Temperature dependence signal curves of SnO2-300 and SnO2_Mn1 when detecting: (a) 20 ppm CO; (b) 4 ppm NO.
Nanomaterials 13 01437 g013
Figure 14. Resistance curves of SnO2-300, SnO2_Mn1 and SnO2_Mn1_w during the cyclic test gas composition change at different gas concentrations to detect: (a) CO; (b) NO at 270 °C.
Nanomaterials 13 01437 g014
Figure 15. During the cyclic test gas composition, the signal concentration-dependence curves of SnO2-300, SnO2_Mn1 and SnO2_Mn1_w change to detect CO descending from 100 ppm to 5 ppm.
Nanomaterials 13 01437 g015
Figure 16. Signal concentration-dependence curves of SnO2-300, SnO2_Mn1 and SnO2_Mn1_w during the cyclic test gas composition change when detecting NO at 270 °C: (a) ascending from concentration from 0.5 to 8 ppm, (b) descending concentration from 8 to 0.5 ppm.
Nanomaterials 13 01437 g016
Table 1. Samples designations and synthesis conditions.
Sample NamePreassigned Mn:Sn Ratio, mol. %Prepared fromAcid Etching
SnO2-3000-No
SnO2_Mn11%SnO2-300No
SnO2_Mn1010%SnO2-300No
SnO2_Mn1_w-SnO2_Mn1Yes
SnO2_Mn10_w-SnO2_Mn10Yes
Table 2. The phase composition and microstructure parameters of prepared SnO2 and SnO2/MnOx nanocomposites.
SamplePhase Composition
by XRD
dXRD, nmSsurf, m2/gdBET, nmdSEM, nm
SnO2-300SnO23.5–4.012075–10
SnO2_Mn1SnO24.0–4.510585–10
SnO2_Mn10SnO24.5–5.01008.55–10
SnO2_Mn1_wSnO24.0–4.510585–10
SnO2_Mn10_wSnO24.0–4.5--5–10
Table 3. Colors of samples and properties of the peaks of Raman spectra obtained with a 633 nm radiation source. The peak at 628 cm−1 is named «sharp», and the wide band at approx. 553 cm−1 named «broad». Isharp means the intensity of a sharp peak, and FWHMsharp is full width at half maximum for a sharp peak.
SampleColorRaman ShiftsharpSharp/SbroadIsharp/FWHMsharp
SnO2-300Creamy6320.091.1
SnO2_Mn1Sand6300.062.0
SnO2_Mn1_wSand6300.102.3
SnO2_Mn10Black6301.80.65
SnO2_Mn10_wSand6300.082.2
MnO2Black6332.21.0
Table 4. Elemental composition (in molar fractions) of SnO2/MnOx materials obtained by EDX.
ElementSnO2_Mn1SnO2_Mn10SnO2_Mn10_w
Sn0.990.880.99
Mn0.010.120.01
Table 5. Elemental composition of SnO2/MnOx materials obtained by TXRF. Given errors were calculated from known method errors.
ElementSnO2-300SnO2_Mn1SnO2_Mn10
Sn (molar fraction)10.99 ± 0.0040.89 ± 0.04
Mn (total, molar fraction)00.01 ± 0.0040.11 ± 0.04
Mn (total, weight fraction)01.4·10−3 ± 0.6·10−320·10−3 ± 8·10−3
Mn (surface, weight fraction)01.4·10−3 ± 0.2·10−331·10−3 ± 6·10−3
Table 6. The manganese content in blank SnO2 and etched SnO2/MnOx materials obtained by ICP MS. Given errors were calculated from known method errors.
ElementSnO2-300SnO2_Mn1_wSnO2_Mn10_w
Mn (total, weight fraction)1·10−5 ± 0.05·10−590·10−5 ± 4.5·10−5200·10−5 ± 10·10−5
Sn (molar fraction)1.00.9975 ± 0.00010.9945 ± 0.0003
Mn (total, molar fraction)0.00.0025 ± 0.00010.0055 ± 0.0003
Table 7. The manganese content in SnO2/MnOx materials obtained by TXRF and ICP MS. Given errors were calculated from known method errors.
Element QuantitySnO2_Mn1SnO2_Mn10
Mn (total, weight fraction)2.3·10−3 ± 0.245·10−333·10−3 ± 6.1·10−3
Mn (surface, weight fraction)1.4·10−3 ± 0.2·10−331·10−3 ± 6·10−3
Mn (lattice, weight fraction)0.9·10−3 ± 0.045·10−32·10−3 ± 0.1·10−3
Mn (surface)/Mn (total)0.6 ± 0.150.94 ± 0.25
Sn (molar fraction)0.994 ± 0.9·10−30.91 ± 14·10−3
Mn (total, molar fraction)0.006 ± 0.9·10−30.09 ± 14·10−3
Mn (surface, molar fraction)0.0035 ± 0.4·10−30.0845 ± 8·10−3
Mn (lattice, molar fraction)0.0025 ± 0.4·10−30.0055 ± 0.8·10−3
Table 8. XPS data for Sn 3d, Mn 2p and O 1s regions. Srel–areas of oxygen main (lattice) and minor (surface) peaks related to the total peak area.
SampleBE Sn 3d5/2, eVBE Mn 2p3/2, eVBE O 1s, eVSrel(Olattice)Srel(Osurface)
SnO2-300487.1-531.10.520.48
SnO2_Mn1487.2641.8531.10.640.36
Table 9. TPR-H2 data for SnO2-300 and SnO2_Mn1. Tmax1—temperature of low-temperature peak maximum, Tmax2—temperature of high-temperature peak maximum; S2, S1 and Stotal are areas of high-, low-temperature peaks and their sum, respectively; n(H2)/n(SnO2)—quantity of H2 consumed during reduction of 1 mole of SnO2.
SampleTmax1, °CTmax2, °CS1/S2S1/Stotaln(H2)/n(SnO2)
SnO2-3002255830.20.161.8
SnO2_Mn12225720.160.141.9
Disclaimer/Publisher’s Note: The statements, opinions and data contained in all publications are solely those of the individual author(s) and contributor(s) and not of MDPI and/or the editor(s). MDPI and/or the editor(s) disclaim responsibility for any injury to people or property resulting from any ideas, methods, instructions or products referred to in the content.