Abstract
Photocatalyst performance is often limited by the poor separation and rapid recombination of photoinduced charge carriers. A nanoheterojunction structure can facilitate the separation of charge carrier, increase their lifetime, and induce photocatalytic activity. In this study, CeO2@ZnO nanocomposites were produced by pyrolyzing Ce@Zn metal–organic frameworks prepared from cerium and zinc nitrate precursors. The effects of the Zn:Ce ratio on the microstructure, morphology, and optical properties of the nanocomposites were studied. In addition, the photocatalytic activity of the nanocomposites under light irradiation was assessed using rhodamine B as a model pollutant, and a mechanism for photodegradation was proposed. With the increase in the Zn:Ce ratio, the particle size decreased, and surface area increased. Furthermore, transmission electron microscopy and X-ray photoelectron spectroscopy analyses revealed the formation of a heterojunction interface, which enhanced photocarrier separation. The prepared photocatalysts show a higher photocatalytic activity than CeO2@ZnO nanocomposites previously reported in the literature. The proposed synthetic method is simple and may produce highly active photocatalysts for environmental remediation.
1. Introduction
The continued use of fossil fuels has resulted in a global energy crisis, environmental pollution, and climate change [1,2], thus, more sustainable energy resources are essential to combat these issues [3]. Photocatalytic technologies [4,5] for exploiting light energy have drawn particular attention [6,7,8]. Such catalysts can be used to produce hydrogen from water for energy storage and convert the excess carbon dioxide in the atmosphere to valuable chemical feedstocks and fuels, such as methane and methanol [9,10,11,12,13,14]. Furthermore, photocatalytic materials can be used to degrade organic pollutants in contaminated water [15,16,17]. In particular, compared with traditional methods for water treatment, photocatalysis requires less energy and can achieve a complete degradation of pollutants. Therefore, photocatalytic systems are highly promising for clean energy production and environmental remediation. To achieve high photocatalytic activity, photoinduced charge carriers (i.e., electrons and holes) must be effectively generated and separated in the photocatalysts.
Several photocatalytic mechanisms for the degradation of organic pollutants such as dyes have been reported. Briefly, upon irradiation with ultraviolet light, electrons in the valence band (VB) are excited to the conduction band (CB); thus, holes are created in the VB. The electrons in the CB react with adsorbed oxygen to form superoxide radicals (•O2−), whereas the holes in the VB react with water to form hydroxyl radicals (•OH), and these two radicals react with organic pollutants and degrade them. To date, many photocatalysts have been reported, including CdS [18,19], ZnO [20], CeO2 [21], TiO2 [22], WO3 [23], and graphitic carbon nitride (g-C3N4) [24]. However, the charge carriers generated by these single-phase catalysts can easily recombine, resulting in short carrier lifetimes and low catalytic efficiencies. To address this problem, multiphase catalysts, such as nanocomposites, i.e., Fe2O3/Cu2O [25], ZnO/TiO2 [26], GQDs/NiSe-NiO [27], g-C3N4/Ni-ZnO [28], and MoS2/TiO2 nanocomposites [29], have been prepared. These nanocomposites can increase the lifetimes of the charge carriers by restricting the generated electrons and holes in different phases and reducing their recombination.
Considering the matched band gaps of CeO2 and ZnO, we have reported on a CeO2@ZnO nanocomposite as an efficient photocatalyst [30]. In our previous study, a Ce@Zn-bimetallic metal–organic framework (Ce@Zn-MOF) precursor was prepared with a Zn:Ce atomic ratio of 1; subsequently, the Ce@Zn-MOF precursor was subjected to thermal decomposition to obtain photocatalytic CeO2@ZnO nanocomposites. The optimal pyrolysis temperature was identified as 450 °C based on the structure, morphology, and photocatalytic degradation performance of the nanocomposites. However, the effects of the Zn:Ce ratio have not been studied.
Therefore, in this study, we fabricated Ce/Zn-MOF precursors with various Zn:Ce atomic ratios (0:10, 2:8, 4.5:5.5, 6.7:3.3, 8:2, and 10:0). CeO2@ZnO nanocomposites were then obtained via thermal decomposition at the previously identified optimal temperature (450 °C). The structure, morphology, and optical properties of CeO2, ZnO, and the CeO2@ZnO nanocomposites were investigated via X-ray diffractometry (XRD), scanning electron microscopy (SEM), transmission electron microscopy (TEM), and UV-vis absorption spectroscopy. In addition, the prepared nanocomposites were employed for photocatalytic water remediation using rhodamine B (RhB) as a model organic pollutant. Finally, the photocatalytic degradation mechanism was determined.
2. Experimental Method
2.1. Precursor and Photocatalyst Synthesis
Ce-MOF, Zn-MOF, and Ce/Zn-MOF were prepared according to our previously reported method. Briefly, Ce(NO3)2·6H2O (30 mmol) and 2-methylimidazole (63 mmol) were dissolved in methanol (500 mL), and the mixture was stirred, precipitated, and centrifuged to obtain Ce-MOF. To prepare the bimetallic Ce/Zn-MOF precursors Zn(NO3)2·6H2O and Ce(NO3)2·6H2O in atomic ratios of 0:10, 2:8, 4.5:5.5, 6.7:3.3, 8:2, and 10:0 were added to methanol. The samples with Zn:Ce ratios of 0:10 and 10:0 yielded Ce-MOF and Zn-MOF, respectively. Ce-MOF, Zn-MOF, and Ce/Zn-MOF were obtained via sequential precipitation, washing, centrifugation, and drying. Finally, the Ce-MOF, Zn-MOF, and Ce/Zn-MOF precursors were pyrolyzed at 450 °C in a tubular sintering furnace for 3 h to produce the CeO2, ZnO, and the CeO2@ZnO nanocomposites [30]. The annealed samples are denoted as CeO2@ZnO-x, where x is the ratio of Zn to Ce; for example, the sample with a ratio of 2:8 is denoted as CeO2@ZnO-0.2.
2.2. Characterization
The effect of different ratios of ZnO and CeO2 on the lattice structure of the CeO2@ZnO nanocomposites was determined using XRD (Dmax-rB, Rigaku; Tokyo, Japan, Cu-Kαλ = 1.5418 Å) with a tube voltage and current of 40 kV and 80 mA, respectively. The changes in the morphology, microstructure, and elemental distribution of the CeO2@ZnO-x nanocomposites were observed using field emission SEM (ZEISS Gemini 500) and TEM (FEITecnai G2 F30). For TEM analysis, the CeO2@ZnO-x nanocomposites were ultrasonically dispersed in ethanol for 10 min and then dropped onto a Cu grid, and TEM observation was carried out at an acceleration voltage of 200 kV. The electronic structures and valence states of the elements were characterized using X-ray photoelectron spectroscopy (XPS). The optical band gaps of the nanocomposites were determined using UV-vis spectroscopy (UH4150, Hitachi). The spectrometer was equipped with an integrating sphere.
The photocatalytic activity of the prepared CeO2@ZnO nanocomposites was evaluated by measuring the degradation of RhB as a model organic pollutant using a multi-channel photochemical reaction system (PCX-50C). The light source was ultraviolet light at 365 nm with a real power density of 320 mWcm−2. For the degradation tests, the nanocomposites (50 mg) were ultrasonically dispersed in an aqueous RhB solution (50 mL, 10 mg/L) for 10 min. The suspension was then placed in the dark for 60 min with continuous magnetic agitation until it reached dynamic adsorption–desorption equilibrium. Before irradiation, an aliquot (3 mL) of the degradation solution was extracted and centrifuged to determine the degree of degradation. Subsequently, during light irradiation, aliquots (3 mL) were collected every 5 min and analyzed. Note that no precious metal catalyst was added during the degradation process. In addition, electron paramagnetic resonance (EPR, Bruker EMXplus) spectroscopy was used to identify the free radicals produced upon light irradiation to investigate the degradation mechanism. For these measurements, the nanomaterials were added to a 5,5-dimethyl-1-pyridine-N-oxide (DMPO) solution and mixed with deionized water or CH3OH to detect the concentrations of hydroxyl(•OH) and superoxide (•O2−) radicals, respectively. The transient photocurrent and electrochemical impedance spectroscopy (EIS) measurements were conducted on an electrochemical workstation (CHI660E) with three electrodes. A Pt wire and Ag/AgCl were used as the counter and reference electrodes, respectively. For the photocurrent measurement, indium tin oxide glass coated with the photocatalyst was used as the working electrode, whereas a glass-carbon electrode coated with the photocatalyst was the working electrode for the EIS measurement. A Na2SO4 solution (0.5 M) was used as the electrolyte. Photoluminescence (PL) spectra were recorded on a spectrofluorometer (Hitachi F7000) equipped with a 250 nm excitation source.
3. Results and Discussion
Figure 1a shows the XRD patterns of the nanomaterials formed by the pyrolysis of the MOF precursors at 450 °C. The diffraction peaks of the nanomaterial formed by pyrolyzing Ce-MOF are indexed to cubic CeO2 (JCPDS Card No. 81-0792) [31]. When the Zn:Ce ratio increases to 0.2, the intensity of the CeO2 diffraction peaks decreases slightly (Figure 1a, CeO2@ZnO-0.2). With a further increase in the Zn:Ce ratio, these CeO2 peaks decrease in intensity, and new diffraction peaks corresponding to hexagonal wurtzite ZnO (JCPDS Card No. 36-1451) appear (Figure 1a, CeO2@ZnO-0.45) [32], suggesting the formation of a CeO2@ZnO nanocomposite. When the Zn:Ce ratios are 0.67 and 0.8 (Figure 1a, CeO@ZnO-0.67 and CeO@ZnO-0.8, respectively), the peaks corresponding to CeO2 disappear, and those corresponding to ZnO increase in intensity. XPS analysis revealed that some CeO2 was present in these two samples, and the lack of diffraction peaks is likely a result of the low quantity of CeO2, which resulted in these peaks being X-ray invisible or obscured by those of ZnO. Finally, the pyrolysis product of Zn-MOF displays the characteristic diffraction peaks of ZnO. The phase evolution in the nanocomposites with respect to the Zn:Ce ratio is more distinct from 2ϴ = 29° to 59° (Figure 1b), wherein the peaks corresponding to CeO2 gradually disappear, whereas those related to ZnO gradually intensify. Notably, the positions of the peaks corresponding to CeO2 and ZnO do not change with the Zn:Ce ratio, indicating that Zn did not enter the CeO2 lattice and vice versa.
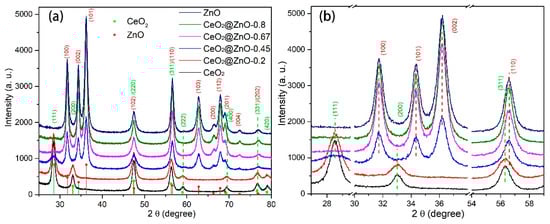
Figure 1.
(a) XRD patterns for the CeO2, ZnO, and CeO2@ZnO nanocomposites (predicted peak positions for cubic CeO2 and hexagonal ZnO are shown on the x-axis) and (b) an enlarged figure showing the most intense diffraction peaks in (a).
Figure 2 shows the morphologies of the CeO2, ZnO, and CeO2@ZnO nanocomposites. As shown in Figure 2a, CeO2 has a smooth nanosphere morphology and uniform size distribution (approximate diameter ~800 nm). With an increase in the Zn:Ce ratio, additional nanoparticles merge on the nanospheres (Figure 2b, CeO2@ZnO-0.2), and the surfaces of the nanospheres become rough. For CeO2@ZnO-0.45 and CeO2@ZnO-0.67, the large nanospheres disappear, and only small nanoparticles are observed in the nanocomposites. With a further increase in the Zn:Ce ratio, the small nanoparticles aggregate, as shown in Figure 2e,f. Thus, adding Zn converts the large spheres into small nanoparticles, but excess Zn results in the aggregation of the small nanoparticles, which should decrease the specific surface area of the nanocomposites.
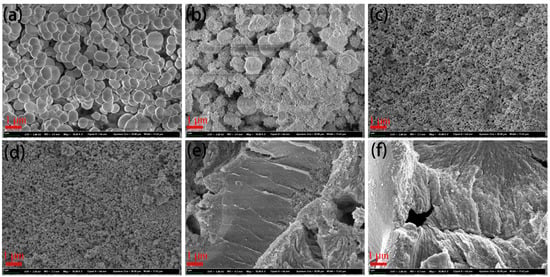
Figure 2.
SEM images of (a) CeO2, (b) CeO2@ZnO-0.2, (c) CeO2@ZnO-0.45, (d) CeO2@ZnO-0.67, (e) CeO2@ZnO-0.8, and (f) ZnO.
The microstructures of the CeO2, ZnO, and CeO2@ZnO nanocomposites were observed using TEM. The nanospheres in Figure 3a are approximately 758 nm in diameter. In addition, the high-resolution TEM (HRTEM) images reveal that the lattice fringes at the edges of the nanospheres have interplanar distances of 0.313 and 0.269 nm, which correspond to the (111) and (200) crystal planes of cubic CeO2, respectively. Consistent with the SEM results, when the Zn:Ce ratio is 0.2, some nanoparticles are attached to the edges of the CeO2 nanospheres, while the size of the CeO2 nanospheres does not change significantly. These nanoparticles show lattice fringes corresponding to both cubic CeO2 and hexagonal wurtzite ZnO; in particular, the 0.141 nm interplanar distance corresponds to the (200) plane of ZnO. With a further increase in the Zn:Ce ratio, the number of hexagonal wurtzite ZnO nanoparticles gradually increases, whereas the number of CeO2 spheres in the cubic phase decreases. The diameter of the observed nanoparticles is approximately 10 nm. In addition, two sets of diffraction rings are observed in the selected area electron diffraction (SAED) pattern (Figure 3d-1). Importantly, an obvious boundary is observed between the ZnO and CeO2 phases, indicating the formation of a ZnO@CeO2 nanoheterojunction (Figure 3d-1). For the ZnO formed by the pyrolysis of the Zn-MOF precursor (Figure 3f-1), the size of the nanoparticles increases to approximately 25 nm, mainly because of the aggregation and growth of the nanoparticles at high temperatures. Its lattice fringes are detected at 0.247 and 0.2827 nm, corresponding to the (101) and (100) crystal phases of hexagonal wurtzite ZnO, respectively.
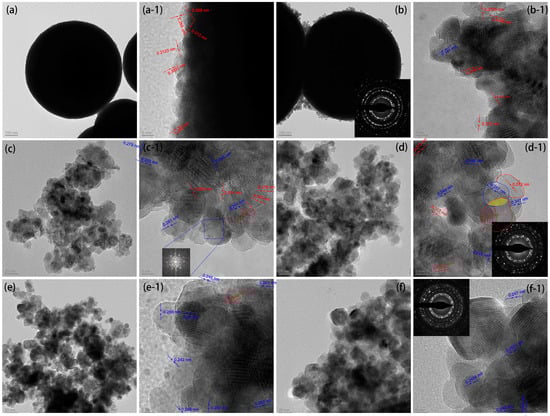
Figure 3.
TEM images of (a) CeO2, (b) CeO2@ZnO-0.2, (c) CeO2@ZnO-0.45, (d) CeO2@ZnO-0.67, (e) CeO2@ZnO-0.8, and (f) ZnO. The suffix “-1” indicates the high-resolution TEM images, and the insets show the corresponding selected area electron diffraction patterns. The lattice fringes in red and blue correspond to CeO2 and ZnO, respectively.
The elemental distribution in CeO2@ZnO-0.67 was also characterized via EDS mapping. As shown in Figure 4, Zn, Ce, and O are distributed uniformly in the nanocomposite. However, the distribution of Ce is sparser than those of Zn and O, which is consistent with the high Zn content in CeO2@ZnO-0.67.
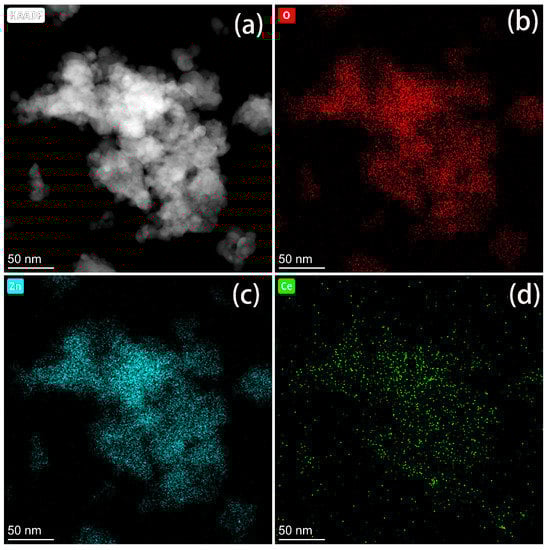
Figure 4.
(a) Scanning tunneling electron microscopy high-angle annular dark field image of CeO2@ZnO-0.67 and the corresponding (b) O, (c) Zn, and (d) Ce elemental maps.
XPS measurements were conducted to investigate the elemental composition and surface chemical valence states. The C 1s peak is related to the adventitious carbon introduced during pyrolysis. Therefore, the spectra were calibrated based on the C=C peak at a binding energy of 285.0 eV. As expected, the XPS survey spectra of the CeO2@ZnO nanocomposites contain peaks corresponding to Ce, Zn, and O. In the Ce 3d high-resolution XPS spectra of CeO2 (black curve in Figure 5b), the Ce3+ and Ce4+ peaks are detected [33,34,35], indicating the presence of CeO2 and Ce2O3. The Ce2O3 phase was not detected via XRD, possibly because of its amorphous nature. In contrast, in the XPS spectra of the CeO2@ZnO nanocomposites, the Ce3+ peaks are weakened until they disappear, indicating that Ce is present exclusively in the CeO2 phase. The split peaks in the high-resolution Zn 2p spectra correspond to Zn 2p3/2 and 2p1/2, respectively, indicating that Zn is present as Zn2+ [36]. Interestingly, the Zn peaks in the CeO2@ZnO nanocomposites are at lower binding energies than those in ZnO, suggesting the formation of an interface between CeO2 and ZnO. In the high-resolution O 1s spectra (Figure 5d), three peaks at 529.1, 530.2, and 531.6 eV can be assigned to the oxygen bonded to Ce, Zn, and surface hydroxyl radicals [33,37,38], respectively. Overall, the XPS and HRTEM results indicate that a heterojunction interface between ZnO and CeO2 nanoparticles is formed via pyrolysis. The interface is crucial for photocatalytic applications because photoelectrons can migrate across the interface and be effectively separated from the photogenerated holes.
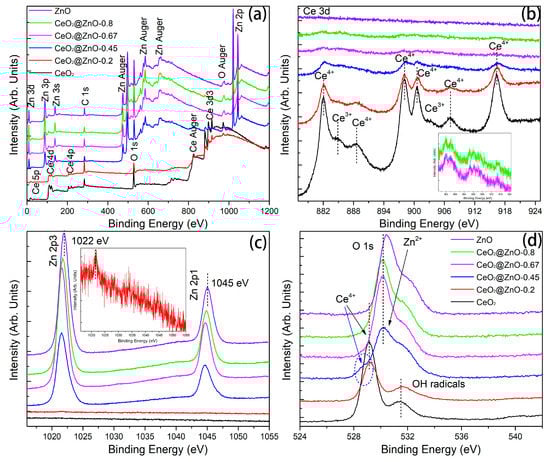
Figure 5.
XPS spectra of the CeO2, ZnO, and CeO2@ZnO nanocomposites: (a) survey spectra and high-resolution (b) Ce 3d, (c) Zn 2p, and (d) O 1s spectra.
The optical properties of the CeO2, ZnO, and CeO2@ZnO nanocomposites were investigated using UV-vis absorption spectroscopy, and the results are shown in Figure 6a. With an increase in the Zn:Ce ratio, the optical absorption edge shows a progressive blue shift. The optical band gaps of the CeO2, ZnO, and CeO2@ZnO nanocomposites were obtained using the Tauc formula [39]: αhν = A(hν − Eg)2, where α, h, ν, A, and Eg are the absorption coefficient, Planck’s constant, the frequency of the incident light, a constant, and the optical band gap, respectively. The fitting curves for (αhν)2 vs. hν are shown in Figure 6b. The linear part of the curve is extrapolated, and the x intersection is the optical band gap. Thus, the optical band gaps of the CeO2, CeO2@ZnO-0.2, CeO2@ZnO-0.45, CeO2@ZnO-0.67, CeO2@ZnO-0.8, and ZnO nanomaterials are 2.789, 3.06, 3.164, 3.195, 3.20, and 3.214 eV, respectively, showing an increasing trend with an increase in the Zn:Ce ratio. As the Zn:Ce ratio is increased, a transformation from CeO2 to CeO2@ZnO to ZnO occurs, and the size of the composite decreases from 800 nm to 10 nm. The quantum effects arising from particle size limitations cause a blue-shift in the absorption edge and an increase in the band gap. Crucially, the band gap determines the range of light that can be absorbed and, thus, used during photocatalytic degradation.
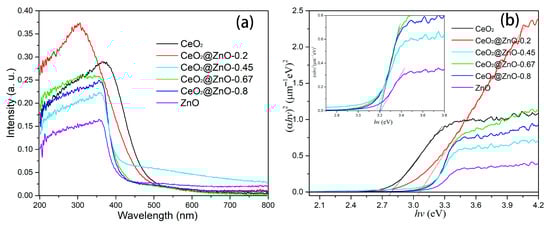
Figure 6.
(a) UV-visible absorption spectra and (b) plots of (αhν)2 vs. hν for the CeO2, ZnO, and CeO2@ZnO nanocomposites.
The catalytic activity of the photocatalyst was evaluated by analyzing the degree of photodegradation of RhB, as calculated using Equation (1) [19]:
where C0 and C represent the UV-vis light absorption coefficients of RhB at adsorption equilibrium in the dark and upon light irradiation, respectively. Figure 7a shows the photodegradation efficiency for RhB with respect to irradiation time. The photocatalytic efficiency of CeO2 for RhB is very low. The smooth and large nanospheres of CeO2 have a low specific surface area, leading to a small contact area between CeO2 and RhB. The photodegradation efficiency of CeO2@ZnO-0.2 slightly increases, which can be attributed to the nanoparticles attached to the CeO2 nanospheres. With a further increase in the Zn:Ce ratio, the CeO2@ZnO-0.67 nanocomposite exhibits the best photocatalytic efficiency (approximately ~97% RhB degradation after 30 min of irradiation). However, the photocatalytic efficiencies of CeO2@ZnO-0.8 and ZnO are lower than that of the CeO2@ZnO-0.67.
Photodegradation efficiency (%) = (1 − C/C0) × 100%,
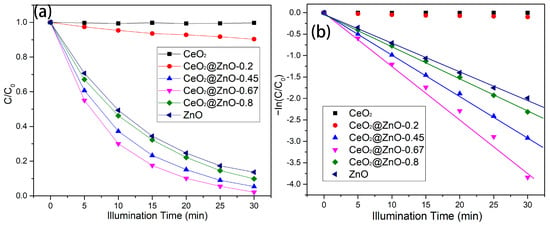
Figure 7.
(a) Degradation efficiencies and (b) kinetic plots for the degradation of RhB over the CeO2, ZnO, and CeO2@ZnO nanocomposites during with respect to irradiation time.
The experimental data were fitted using the pseudo-first-order kinetic model shown in Equation (2) [30,34].
Here, k (min−1) is the kinetic degradation rate constant, and t (min) is the reaction time. As shown in Figure 7b, the plots of −In(C/C0) vs. t. approximately follow a linear relationship, indicating that this model can be used to analyze the photodegradation rate. The degradation rates over CeO2 and CeO2@ZnO-0.2 are very low and not reported here. The kinetic degradation rate constant (k) values for the photodegradation of RhB over CeO2@ZnO-0.45, CeO2@ZnO-0.67, CeO2@ZnO-0.8, and ZnO were calculated as 0.0955, 0.124, 0.0749, and 0.0669, respectively. The CeO2@ZnO-0.67 nanocomposite exhibits the best photodegradation rate constant (0.124), which is superior to the highest photodegradation rate constant observed in our previous study on CeO2@ZnO photocatalysts (0.1096). Therefore, the optimal Zn/Ce atomic ratio was 0.67 at the optimal pyrolysis temperature (450 °C). We have summarized recent reports on the photodegradation performance of CeO2@ZnO, which are listed in Table 1. As can be seen from Table 1, CeO2@ZnO-0.67, the nanocomposites prepared by the binary MOF pyrolysis method in this paper, show better performance.

Table 1.
Summary of different synthetic methods of CeO2, ZnO, and CeO2@ZnO nanomaterials with regard to photodegradation.
The production of free radicals was investigated under dark and light conditions using EPR spectroscopy. The peak intensities in the EPR spectra reflect the concentrations of free radicals. As shown in Figure 8, no free radicals are detected in the dark, whereas two types of free radicals are formed upon light irradiation. Furthermore, the concentration of free radicals produced by the CeO2@ZnO-0.67 nanocomposite is the highest under light irradiation, confirming that these free radicals are responsible for enhancing the photodegradation efficiency.
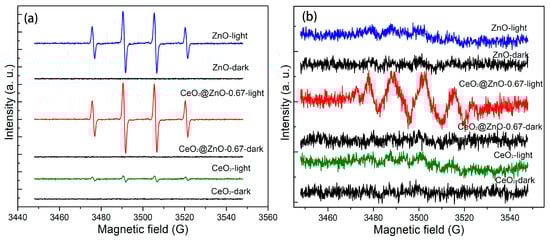
Figure 8.
EPR spectra of the CeO2, ZnO, and CeO2@ZnO nanocomposites in the dark and under light irradiation: (a) DMPO-OH and (b) DMPO-O2−.
To investigate the separation ability of the photogenerated electrons and holes, the transient photocurrent characteristics of the CeO, ZnO, and CeO2@ZnO-0.67 nanocomposites were measured. As shown in Figure 9a, the CeO2@ZnO-0.67 nanocomposite produces a stronger photocurrent than CeO2 and ZnO, indicating that has the highest number of photogenerated charge carriers under illumination. In addition, the PL spectra of the CeO2, ZnO, and CeO2@ZnO-0.67 were measured. As shown in Figure 9b, the intensity of the luminescent peak for CeO2@ZnO-0.67 is significantly lower than that of CeO2 and ZnO, which indicates that the electron–hole pairs generated by CeO2@ZnO-0.67 have a low recombination rate. The efficiency of the direct electron transfer and separation of photogenerated electrons was evaluated using EIS (Figure 9c). In the EIS spectra, the arc radius determines the resistance of the interface layer, which affects the separation of electrons. A small arc radius means that electrons can be transported quickly. Among the three photocatalysts, CeO2@ZnO-0.67 exhibits the smallest arc radius, indicating its excellent charge transfer ability. Cycling experiments were performed to evaluate the stability and recyclability of CeO2@ZnO-0.67. Figure 9d shows that the high photodegradation efficiency of CeO2@ZnO-0.67 is maintained after three cycles.
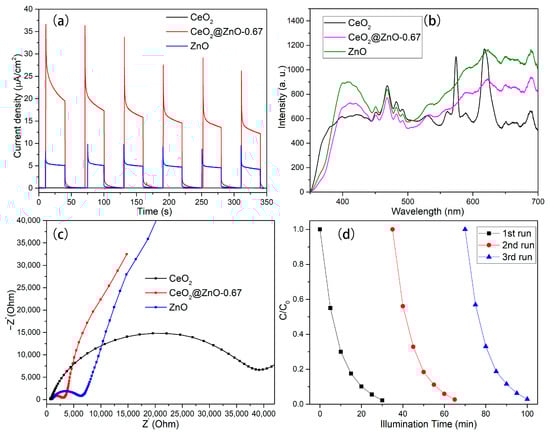
Figure 9.
(a) Transient photocurrent curves, (b) PL spectra, (c) and EIS Nyquist plots for CeO, CeO2@ZnO-0.67, and ZnO, respectively. (d) Cycling experiments of the photodegradation of RhB over CeO2@ZnO-0.67.
Based on the previously described analysis, the separation mechanism of the photogenerated electron–hole pairs is shown in Figure 10. Generally, the photoexcited electrons easily recombine with the holes in the VB. In CeO2 or ZnO pure phase materials, the recombination of excited electrons in CB and holes in VB is dominant, which considerably reduces the efficiency of photodegradation. Therefore, the inhibition of charge carrier recombination is crucial for enhancing photocatalytic efficiency. Unlike CeO2 and ZnO, the CeO2@ZnO nanocomposite contains a heterojunction interface, which prevents the recombination of photogenerated charge carriers and ensures the production of free radicals for Z-scheme catalytic photodegradation. In detail, the excited electrons in ZnO preferentially recombine with the holes in CeO2, which enables the electrons in the CB of CeO2 and the holes in the VB of ZnO to interact fully with oxygen and water to generate free radicals for dye decomposition.
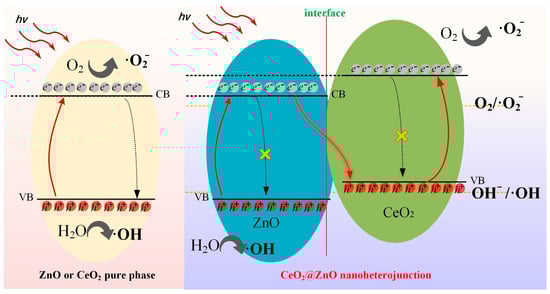
Figure 10.
Separation mechanisms of photogenerated electron–hole pairs of the pure phase materials and the CeO2@ZnO nanoheterojunction.
4. Conclusions
In this study, CeO2@ZnO nanocomposites with various Zn:Ce ratios were prepared via the pyrolysis of Ce/Zn-MOFs precursors. As the Zn:Ce ratio increases from zero to one, pure CeO2, CeO2@ZnO nanocomposites, and pure ZnO are obtained. Pure CeO2 exists as nanospheres with diameters of approximately 800 nm. With an increase in the Zn:Ce ratio, the CeO2@ZnO nanocomposites gradually transform from nanospheres to nanoparticles of approximately 10 nm diameter, increasing the specific surface area. In addition, a heterojunction is formed, as evidenced by TEM and XPS analysis. The optical band gaps of the nanocomposites widen with an increase in the Zn:Ce ratio owing to the heterojunction interface and quantum size effects. Among the produced photocatalysts, the CeO2@ZnO nanocomposite with a Zn:Ce ratio of 0.67 exhibits the best photocatalytic efficiency, which is higher than that of a CeO2@ZnO nanocomposite with a Zn:Ce ratio of 1. In addition, this work can be extended to the preparation of other metal oxide nanocomposites, and excellent photocatalytic performance can be obtained.
Author Contributions
Methodology, X.A., C.L., Y.C. and L.M.; Writing-original draft, X.A., S.Y. and L.M.; Writing-review & editing, X.A.; Investigation, C.L., K.L. and L.M.; Formal analysis, C.L., Y.C. and K.L.; Supervision, L.M.; Project administration, L.M. All authors have read and agreed to the published version of the manuscript.
Funding
This work was jointly supported by the National Natural Science Foundation of China (No. 12204245), the Natural Science Foundation of the Jiangsu Higher Education Institutions of China (Nos. 21KJB140018, 21KJD430006, and 22KJB510030), Applied Fundamental Research Foundation of Nantong City, China (No. JC2021103), and Natural Science Foundation of Nanjing Xiaozhuang University (No. 2020NXY11).
Data Availability Statement
Not applicable.
Conflicts of Interest
The authors declare no conflict of interest.
References
- Verma, A.K. Sustainable development and environmental ethics. Int. J. Environ. Sci. 2019, 10, 1–5. [Google Scholar]
- Khan, S.A.R.; Sharif, A.; Golpîra, H.; Kumar, A. A green ideology in Asian emerging economies: From environmental policy and sustainable development. Sustain. Dev. 2019, 27, 1063–1075. [Google Scholar] [CrossRef]
- Saleh, T.A. Global trends in technologies and nanomaterials for removal of sulfur organic compounds: Clean energy and green environment. J. Mol. Liq. 2022, 359, 119340. [Google Scholar] [CrossRef]
- Gong, J.; Li, C.; Wasielewski, M.R. Advances in solar energy conversion. Chem. Soc. Rev. 2019, 48, 1862–1864. [Google Scholar] [CrossRef] [PubMed]
- Hayat, M.B.; Ali, D.; Monyake, K.C.; Alagha, L.; Ahmed, N. Solar energy-A look into power generation, challenges, and a solar-powered future. Int. J. Energy Res. 2019, 43, 1049–1067. [Google Scholar] [CrossRef]
- Fang, Z.; Hu, X.; Yu, D. Integrated Photo-Responsive Batteries for Solar Energy Harnessing: Recent Advances, Challenges, and Opportunities. ChemPlusChem 2020, 85, 600–612. [Google Scholar] [CrossRef] [PubMed]
- Mevada, D.; Panchal, H.; ElDinBastawissi, H.A.; Elkelawy, M.; Sadashivuni, K.; Ponnamma, D.; Thakar, N.; Sharshir, S.W. Applications of evacuated tubes collector to harness the solar energy: A review. Int. J. Ambient. Energy 2022, 43, 344–361. [Google Scholar] [CrossRef]
- Nagadurga, T.; Narasimham, P.V.R.L.; Vakula, V.S. Harness of maximum solar energy from solar PV strings using particle swarm optimisation technique. Int. J. Ambient. Energy 2021, 42, 1506–1515. [Google Scholar] [CrossRef]
- Esswein, A.J.; Nocera, D.G. Hydrogen production by molecular photocatalysis. Chem. Rev. 2007, 107, 4022–4047. [Google Scholar] [CrossRef]
- Preethi, V.; Kanmani, S. Photocatalytic hydrogen production. Mater. Sci. Semicond. Process. 2013, 16, 561–575. [Google Scholar] [CrossRef]
- Guo, S.; Li, X.; Li, J.; Wei, B. Boosting photocatalytic hydrogen production from water by photothermally induced biphase systems. Nat. Commun. 2021, 12, 1343. [Google Scholar] [CrossRef] [PubMed]
- Du, C.; Wang, X.; Chen, W.; Feng, S.; Wen, J.; Wu, Y.A. CO2 transformation to multicarbon products by photocatalysis and electrocatalysis. Mater. Today Adv. 2020, 6, 100071. [Google Scholar] [CrossRef]
- Ola, O.; Maroto-Valer, M.M. Review of material design and reactor engineering on TiO2 photocatalysis for CO2 reduction. J. Photochem. Photobiol. C Photochem. Rev. 2015, 24, 16–42. [Google Scholar] [CrossRef]
- Tseng, I.-H.; Wu, J.C.; Chou, H.-Y. Effects of sol-gel procedures on the photocatalysis of Cu/TiO2 in CO2 photoreduction. J. Catal. 2004, 221, 432–440. [Google Scholar] [CrossRef]
- Koe, W.S.; Lee, J.W.; Chong, W.C.; Pang, Y.L.; Sim, L.C. An overview of photocatalytic degradation: Photocatalysts, mechanisms, and development of photocatalytic membrane. Environ. Sci. Pollut. Res. 2020, 27, 2522–2565. [Google Scholar] [CrossRef] [PubMed]
- Sakkas, V.A.; Islam, M.A.; Stalikas, C.; Albanis, T.A. Photocatalytic degradation using design of experiments: A review and example of the Congo red degradation. J. Hazard. Mater. 2010, 175, 33–44. [Google Scholar] [CrossRef]
- Yang, L.; Liya, E.Y.; Ray, M.B. Degradation of paracetamol in aqueous solutions by TiO2 photocatalysis. Water Res. 2008, 42, 3480–3488. [Google Scholar] [CrossRef]
- Cheng, L.; Xiang, Q.; Liao, Y.; Zhang, H. CdS-based photocatalysts. Energy Environ. Sci. 2018, 11, 1362–1391. [Google Scholar] [CrossRef]
- Ma, L.; Ai, X.; Yang, X.; Cao, X.; Han, D.; Song, X.; Jiang, H.; Yang, W.; Yan, S.; Wu, X. Cd (II)-based metal-organic framework-derived CdS photocatalysts for enhancement of photocatalytic activity. J. Mater. Sci. 2021, 56, 8643–8657. [Google Scholar] [CrossRef]
- Ai, X.; Yan, S.; Ma, L. Morphologically Controllable Hierarchical ZnO Microspheres Catalyst and Its Photocatalytic Activity. Nanomaterials 2022, 12, 1124. [Google Scholar] [CrossRef]
- Hezam, A.; Namratha, K.; Drmosh, Q.A.; Ponnamma, D.; Wang, J.; Prasad, S.; Ahamed, M.; Cheng, C.; Byrappa, K. CeO2 nanostructures enriched with oxygen vacancies for photocatalytic CO2 reduction. ACS Appl. Nano Mater. 2019, 3, 138–148. [Google Scholar] [CrossRef]
- Nakata, K.; Fujishima, A. TiO2 photocatalysis: Design and applications. J. Photochem. Photobiol. C Photochem. Rev. 2012, 13, 169–189. [Google Scholar] [CrossRef]
- Peleyeju, M.G.; Viljoen, E.L. WO3-based catalysts for photocatalytic and photoelectrocatalytic removal of organic pollutants from water–A review. J. Water Process Eng. 2021, 40, 101930. [Google Scholar] [CrossRef]
- Wen, J.; Xie, J.; Chen, X.; Li, X. A review on g-C3N4-based photocatalysts. Appl. Surf. Sci. 2017, 391, 72–123. [Google Scholar] [CrossRef]
- Abhilash, M.R.; Akshatha, G.; Srikantaswamy, S. Photocatalytic dye degradation and biological activities of the Fe2O3/Cu2O nanocomposite. RSC Adv. 2019, 9, 8557. [Google Scholar] [CrossRef]
- Liao, S.; Donggen, H.; Yu, D.; Su, Y.; Yuan, G. Preparation and characterization of ZnO/TiO2, SO42-/ZnO/TiO2 photocatalyst and their photocatalysis. J. Photochem. Photobiol. A Chem. 2004, 168, 7–13. [Google Scholar] [CrossRef]
- Srivastava, S.; Yadav, R.K.; Pande, P.P.; Singh, S.; Chaubey, S.; Singh, P.; Gupta, S.K.; Gupta, S.; Kim, T.W.; Tiwary, D. Dye degradation and sulfur oxidation of methyl orange and thiophenol via newly designed nanocomposite GQDs/NiSe-NiO photocatalyst under homemade LED light. In Photochemistry and Photobiology; Wiley: Hoboken, NJ, USA, 2022. [Google Scholar] [CrossRef]
- Qamar, M.A.; Shahid, S.; Javed, M.; Iqbal, S.; Sher, M.; Bahadur, A.; AL-Anazy, M.M.; Laref, A.; Li, D. Designing of highly active g-C3N4/Ni-ZnO photocatalyst nanocomposite for the disinfection and degradation of the organic dye under sunlight radiations. Colloids Surf. A Physicochem. Eng. Asp. 2021, 614, 126176. [Google Scholar] [CrossRef]
- He, H.; Lin, J.; Fu, W.; Wang, X.; Wang, H.; Zeng, Q.; Gu, Q.; Li, Y.; Yan, C.; Tay, B.K.; et al. MoS2/TiO2 edge-on heterostructure for efficient photocatalytic hydrogen evolution. Adv. Energy Mater. 2016, 6, 1600464. [Google Scholar] [CrossRef]
- Ma, L.; Ai, X.; Jiang, W.; Liu, P.; Chen, Y.; Lu, K.; Song, X.; Wu, X. Zn/Ce metal-organic framework-derived ZnO@CeO2 nano-heterojunction for enhanced photocatalytic activity. Colloid Interface Sci. Commun. 2022, 49, 100636. [Google Scholar] [CrossRef]
- Kumar, P.; Kumar, P.; Kumar, A.; Meena, R.C.; Tomar, R.; Chand, F.; Asokan, K. Structural, morphological, electrical and dielectric properties of Mn doped CeO2. J. Alloys Compd. 2016, 672, 543–548. [Google Scholar] [CrossRef]
- Kaur, P.; Rani, S.; Lal, B. Excitation dependent photoluminescence properties of ZnO nanophosphor. Optik 2019, 192, 162929. [Google Scholar] [CrossRef]
- Rajendran, S.; Khan, M.M.; Gracia, F.; Qin, J.; Gupta, V.K.; Arumainathan, S. Ce3+-ion-induced visible-light photocatalytic degradation and electrochemical activity of ZnO/CeO2 nanocomposite. Sci. Rep. 2016, 6, 31641. [Google Scholar] [CrossRef] [PubMed]
- Zhu, L.; Li, H.; Xia, P.; Liu, Z.; Xiong, D. Hierarchical ZnO decorated with CeO2 nanoparticles as the direct Z-scheme heterojunction for enhanced photocatalytic activity. ACS Appl. Mater. Interfaces 2018, 10, 39679–39687. [Google Scholar] [CrossRef] [PubMed]
- Zeng, C.H.; Xie, S.; Yu, M.; Yang, Y.; Lu, X.; Tong, Y. Facile synthesis of large-area CeO2/ZnO nanotube arrays for enhanced photocatalytic hydrogen evolution. J. Power Sources 2014, 247, 545–550. [Google Scholar] [CrossRef]
- Zhu, L.; Li, H.; Liu, Z.; Xia, P.; Xie, Y.; Xiong, D. Synthesis of the 0D/3D CuO/ZnO heterojunction with enhanced photocatalytic activity. J. Phys. Chem. C 2018, 122, 9531–9539. [Google Scholar] [CrossRef]
- Khan, M.M.; Ansari, S.A.; Pradhan, D.; Han, D.H.; Lee, J.; Cho, M.H. Defect-induced band gap narrowed CeO2 nanostructures for visible light activities. Ind. Eng. Chem. Res. 2014, 53, 9754–9763. [Google Scholar] [CrossRef]
- Mu, J.; Shao, C.; Guo, Z.; Zhang, Z.; Zhang, M.; Zhang, P.; Chen, B.; Liu, Y. High photocatalytic activity of ZnO-carbon nanofiber heteroarchitectures. ACS Appl. Mater. Interfaces 2011, 3, 590–596. [Google Scholar] [CrossRef]
- Ma, L.; Ma, S.; Chen, H.; Ai, X.; Huang, X. Microstructures and optical properties of Cu-doped ZnO films prepared by radio frequency reactive magnetron sputtering. Appl. Surf. Sci. 2011, 257, 10036–10041. [Google Scholar] [CrossRef]
- Xiao, Y.; Yu, H.; Dong, X.T. Ordered mesoporous CeO/ZnO composite with photodegradation concomitant photocatalytic hydrogen production performance. J. Solid State Chem. 2019, 278, 120893. [Google Scholar] [CrossRef]
- Li, C.; Chen, R.; Zhang, X.; Shu, S.; Xiong, J.; Zheng, Y.; Dong, W. Electrospinning of CeO2-ZnO composite nanofibers and their photocatalytic property. Mater. Lett. 2011, 65, 1327. [Google Scholar] [CrossRef]
- Zhang, Q.; Zhao, X.; Duan, L.; Shen, H.; Liu, R. Controlling oxygen vacancies and enhanced visible light photocatalysis of CeO2/ZnO nanocomposites. J. Photochem. Photobiol. A Chem. 2020, 392, 112156. [Google Scholar] [CrossRef]
- Huang, L.; Bao, D.; Jiang, X.; Li, J.; Zhang, L.; Sun, X. Fabrication of stable high-performance urchin-like CeO2/ZnO@Au hierarchical heterojunction photocatalyst for water remediation. J. Colloid Interface Sci. 2021, 588, 713. [Google Scholar] [CrossRef] [PubMed]
- Luo, K.; Li, J.; Hu, W.; Li, H.; Zhang, Q.; Yuan, H.; Yu, F.; Xu, M.; Xu, S. Synthesizing CuO/CeO2/ZnO ternary nano-photocatalyst with highly effective utilization of photo-excited carriers under sunlight. Nanomaterials 2020, 10, 1946. [Google Scholar] [CrossRef] [PubMed]
- Shah, N.; Bhangaonkar, K.; Pinjari, D.V.; Mhaske, S.T. Ultrasound and conventional synthesis of CeO2/ZnO nanocomposites and their application in the photocatalytic degradation of rhodamine B dye. J. Adv. Nanomater. 2017, 2, 133. [Google Scholar] [CrossRef]


Disclaimer/Publisher’s Note: The statements, opinions and data contained in all publications are solely those of the individual author(s) and contributor(s) and not of MDPI and/or the editor(s). MDPI and/or the editor(s) disclaim responsibility for any injury to people or property resulting from any ideas, methods, instructions or products referred to in the content. |
© 2023 by the authors. Licensee MDPI, Basel, Switzerland. This article is an open access article distributed under the terms and conditions of the Creative Commons Attribution (CC BY) license (https://creativecommons.org/licenses/by/4.0/).