Article

Co-Carbonized Waste Polythene/Sugarcane Bagasse Nanocomposite for Aqueous Environmental Remediation Applications

by
Moonis Ali Khan
1,*,
Ayoub Abdullah Alqadami
1,
Saikh Mohammad Wabaidur
1 and
Byong-Hun Jeon
2
1
Chemistry Department, College of Science, King Saud University, Riyadh 11451, Saudi Arabia
2
Department of Earth Resources and Environmental Engineering, Hanyang University, Seoul 04763, Republic of Korea
*
Author to whom correspondence should be addressed.
Nanomaterials 2023, 13(7), 1193; https://doi.org/10.3390/nano13071193
Submission received: 2 March 2023 / Revised: 22 March 2023 / Accepted: 23 March 2023 / Published: 27 March 2023

Abstract

:
The conversion of worthless municipal solid wastes to valuables is a major step towards environmental conservation and sustainability. This work successfully proposed a technique to utilize the two most commonly available municipal solid wastes viz polythene (PE) and sugarcane bagasse (SB) for water decolorization application. An SBPE composite material was developed and co-pyrolyzed under an inert atmosphere to develop the activated SBPEAC composite. Both SBPE and SBPEAC composites were characterized to analyze their morphological characteristics, specific surface area, chemical functional groups, and elemental composition. The adsorption efficacies of the composites were comparatively tested in the removal of malachite green (MG) from water. The SBPEAC composite had a specific surface area of 284.5 m2/g and a pore size of ~1.33 nm. Batch-scale experiments revealed that the SBPEAC composite performed better toward MG adsorption compared to the SBPE composite. The maximum MG uptakes at 318 K on SBPEAC and SBPE were 926.6 and 375.6 mg/g, respectively. The adsorption of MG on both composites was endothermic. The isotherm and kinetic modeling data for MG adsorption on SBPEAC was fitted to pseudo-second-order kinetic and Langmuir isotherm models, while Elovich kinetic and D-R isotherm models were better fitted for MG adsorption on SBPE. Mechanistically, the MG adsorption on both SBPE and SBPEAC composites involved electrostatic interaction, H-bonding, and π-π/n-π interactions.

1. Introduction

Synthetic dyes are widely used as coloring agents in many industries. During their manufacturing operations, these industries annually discharge about 10–15% of their synthetic dyes into the aquatic environment [1,2]. Most of the synthetic dyes were toxic, could cause teratogenic and carcinogenic mutations [3], posing potential threats to public health and the ecosystem. Malachite green (MG), a triphenylmethane dye, was used in textiles as a dyestuff and in aquaculture as an antimicrobial agent. MG is known to be harmful to living creatures because of its potential carcinogenicity, mutagenicity, and teratogenicity in mammals and its destruction of the respiratory system, liver, kidney, intestine, gill, and gonads. Because of its noxious effects on living beings, the use of MG in aquaculture applications has been banned in many developed countries. However, due to its efficiency and cost-effectiveness, it is still being commercialized in developing countries [4,5,6]. Thus, for environmental and human health conservation, it is essential to remove or minimize MG concentration in discharged effluents.
To date, several treatment technologies, such as photocatalytic degradation, solvent extraction, membrane filtration, coagulation, and advanced oxidation, have been developed to minimize and/or remove dyes from wastewater [5,6,7,8,9]. Nevertheless, these technologies are often time-consuming, expensive, and, in some cases, ineffective [7]. Adsorption, because of its simplicity, operation ease, and cost-effectiveness, has received much attention in sequestering pollutants from water. Synthesized materials with outstanding physical and chemical properties have been utilized as adsorbents [9,10,11]. Among them, activated carbon, with a high specific surface area, porosity, and loads of surface functionalities, appears to be the most desirable material for the removal of pollutants from water. However, production and regeneration costs limit its wide-scale usage, especially in developing counties.
The activated carbon-based adsorbents developed from agricultural and industrial wastes effectively compete with commercial activated carbon in eliminating organic and inorganic pollutants [8]. Various activated carbon-based adsorbents have been developed by utilizing agricultural and industrial wastes such as Eucalyptus globulus seeds [9], maize cob [10], de-oiled soya [11], and forestry waste mixture [12] for the removal of MG dye from the water. Date stone-based activated carbon was developed by Hijab et al. [13] via microwave and thermal treatment methods for the removal of MG dye with an uptake capacity of 98 mg/g from aqueous solutions.
Sugarcane bagasse (SB) is one of the largest solid industrial waste residues, which can invariably pose a serious environmental concern if not attended to. Annually, more than 279 million tons of SB waste have been generated as by-products, posing potential waste management and disposal issues [14]. According to Rocha et al. [15], the average composition of cellulose, lignin, and hemicellulose in 60 bagasse samples was 42.19, 21.56, and 27.6%, respectively. Chemical analysis revealed that carboxyl, hydroxyl, and phenolic [16] groups were abundantly present over the SB surface. These groups aid in binding heavy metals and dyes [17,18]. Among other wastes, plastic solid waste generation is steadily increasing with time [18,19]. Globally, the random disposal of plastic wastes can lead to freshwater, soil, and ocean contamination [19,20]. Among plastic wastes, polyethylene (PE) is the most dominant universal plastic waste with low monetary value [21]. PE constitutes more than 40% of municipal waste plastic [22]. It is a non-biodegradable waste and, thus, poses a potential threat to ecology and human health. Therefore, it is better to opt for technologies that can convert plastic waste into valuable products. Lian et al. [23] developed graphene/mesoporous carbon electrode materials from the upcycled waste of PE plastic with the addition of GO through low-temperature carbonization at 700 °C. Chen et al. [24] developed activated carbon from polyurethane plastic waste by carbonization and activation for the removal of MG from an aqueous solution with a maximum uptake capacity of 1428 mg/g. Magnetic CoFe2O4/Co3Fe7@carbon nanostructures using waste plastics (PET) as the carbon precursor for dye adsorption were developed by Wei and Kamali [25]. The observed adsorption capacities of methylene blue (MB) and methyl orange dyes were 278 and 238 mg/g, respectively. Therefore, the utilization of solid municipal wastes such as plastic and biomass for their conversion to value-added products for energy and environmental applications is one of the best ways toward their management.
Thus, the aim of the current study was to develop the SBPE composite using waste SB and PE and co-carbonize it at 600 °C under an inert atmosphere to transform it into an SBPEAC composite. Co-carbonization was expected to improve the physicochemical properties of the composite while enhancing its MG removal capacity from aqueous solutions. To the best of our knowledge, the production of activated carbon by blending waste PE and SB and its application in removing MG from an aqueous solution has yet to be reported. Both SBPE and SBPEAC composites were characterized, and their efficacy as an adsorbent was comparatively tested in the removal of MG dye from water. Experimental parameters such as pH, contact time, initial dye concentration, and temperature were optimized through batch-scale study. Additionally, the adsorption data were modeled through isotherm, kinetic, and thermodynamic studies.

2. Experimental

2.1. Chemicals and Reagents

Malachite green (MG, 99%) and crystal violet (CV, ≥90%) were purchased from Sigma-Aldrich, St. Louis, MO, USA. Methylene blue (MB, >96%) were procured from CDH, Delhi, India. Nitric acid (HNO3, 69–71%) and sodium hydroxide (NaOH, 97.5%) were purchased from Merck, Darmstadt, Germany. Hydrochloric acid (HCl, 37%) was obtained from Sigma-Aldrich, Munich, Germany. Deionized (D.I.) water was used for the experiments, collected from the Milli-Q water purification system (Millipore, Burlington, MA, USA).

2.2. Characterization

The BET surface area of the SBPEAC composite was measured using 3Flex (Micromeritics, Norcross, GA, USA). The surface morphologies of SBPE and SBPEAC composites were analyzed by transmission electron microscopy (TEM, Leo 912A 8B OMEGA EF-TEM, Carl Zeiss, Oberkochen, Germany, at 120 keV). The crystallinity of SBPE and SBPEAC composites were analyzed via an X-ray diffractometer (XRD, SmartLab, Rigaku, Austin, TX, USA). The elemental composition of pristine and MG-saturated SBPE and SBPEAC composites was analyzed by X-ray photoelectron spectroscopy (XPS, theta probe-based system, Thermo Fisher Scientific, Waltham, MA, USA). The chemical functional groups present over the surface of pristine and MG-saturated SBPE and SBPEAC composites was analyzed by Fourier transform infrared spectroscopy (FT-IR, Nicolet 6700, Thermo Scientific, Waltham, MA, USA).

2.3. Development of SBPE and SBPEAC Composites

Sugarcane bagasse (SB) and waste PE bags were procured from a local juice shop and grocery store in Riyadh, Saudi Arabia. The SB was washed with D.I water to remove dirt and traces of sugarcane juice. Thereafter, the SB was manually cut into small pieces. The small pieces of SB were crushed to power in a domestic grinder and sieved to a uniform particle size. Likewise, the PE bags were cut into small pieces, and 0.2 g of PE bag pieces were dissolved in 100 mL toluene at 120 °C through refluxing. SB particles (0.8 g) were suspended into dissolved PE and stirred for 2 h at 100 rpm to uniformly coat PE suspension over SB particles. Thereafter, the air was purged into the suspension to evaporate toluene. Finally, a composite sample with an SB:PE (0.8:0.2 w/w) ratio nomenclature as SBPE was formed. In addition, the composite sample was co-carbonized through pyrolysis in a silica crucible covered with a lid. During pyrolysis, a sample, nomenclature, such as SBPEAC, was heated for 2 h at 600 °C under an inert atmosphere (nitrogen flow 100 mL/min) with a heating rate of 5 °C/min. An SBPEAC sample yield was 99%.

2.4. Adsorption Studies

To determine the optimum conditions for the adsorption of MG, MB, and CV dyes on SBPE and SBPEAC, the influences of various experimental parameters, including contact time (t: 2–600 min), solution pH (2.2–9.5), and initial dye concentrations (Co: 20–100 mg/L) were studied through batch scale experiments. The general experimental procedure was as follows: 0.005 g each of SBPE and SBPEAC were separately dispersed in 50 mL of MG, MB, and CV solutions (Co: 50 mg/L). The desired pH of the solutions was adjusted using 0.1 M HCl/NaOH solutions. Thereafter, the flasks were equilibrated over a rotatory shaker at 100 rpm for a specified contact time. At equilibrium, the samples were centrifugally separated, and the residual MG, MB, and CV dye concentrations were quantitatively measured using a UV/Vis spectrophotometer (Thermo Scientific, Evolution 600, Madison WI USA) at maximum wavelengths (λmax) of 616, 665, and 590 nm, respectively. The respective adsorption capacities (qe mg/g) and the removal efficiencies (Re%) of dyes were determined as:
q e , m g / g = C o C e × V m
R e , % = C o C e C o × 100
where qe (mg/g) is the equilibrium adsorption capacity of adsorbents toward dyes, Co and Ce (mg/L) refer to the initial and final (equilibrium) dye concentrations, respectively, m (g) is the number of adsorbents, and V (L) is the volume of dye solutions.

3. Results and Discussion

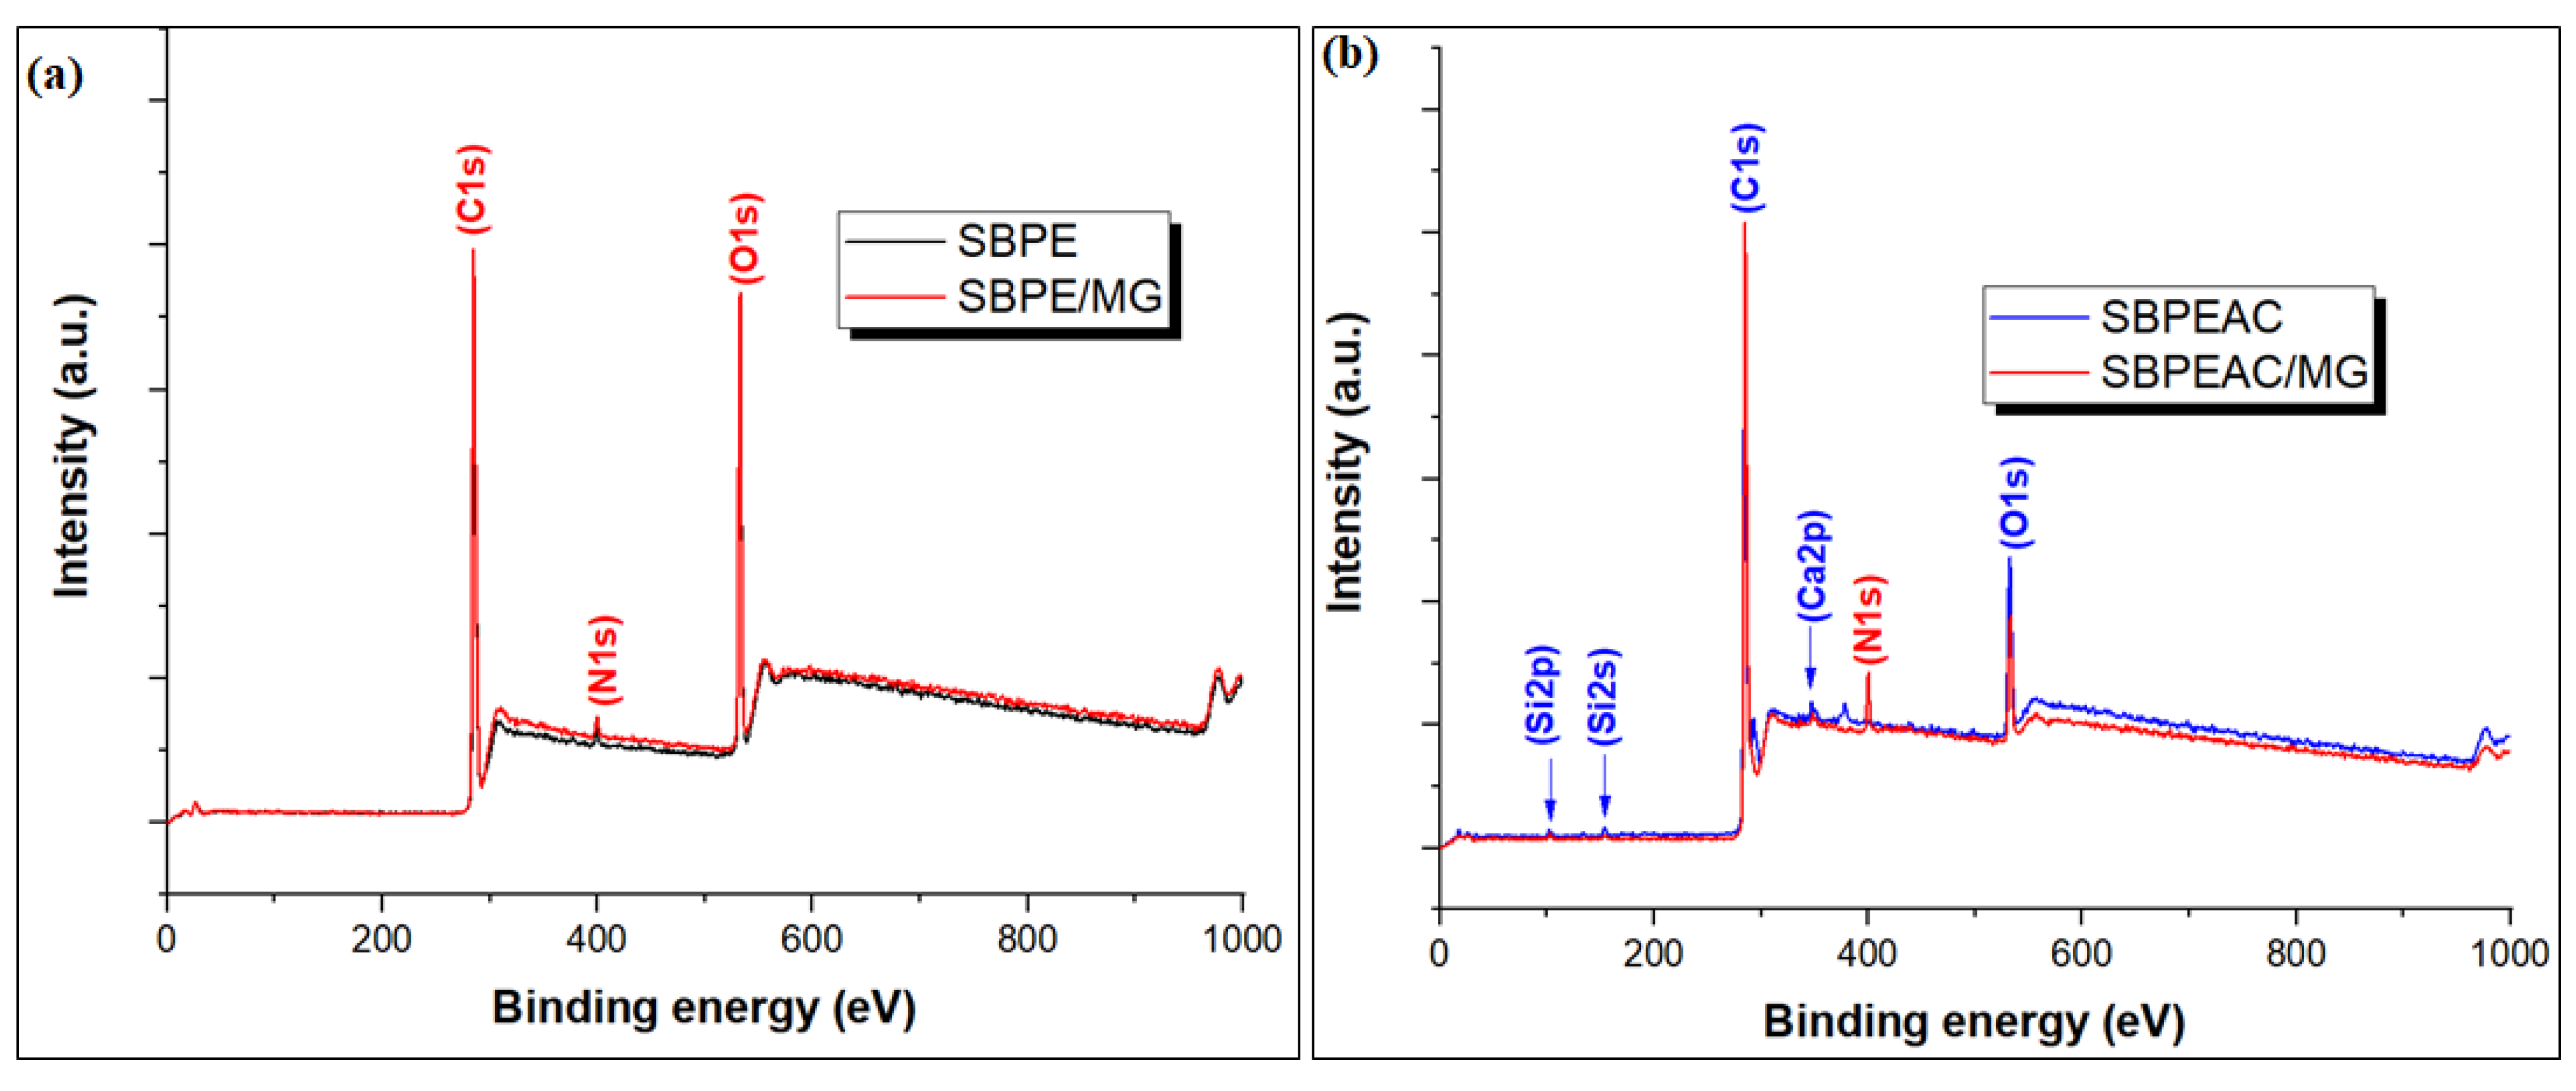
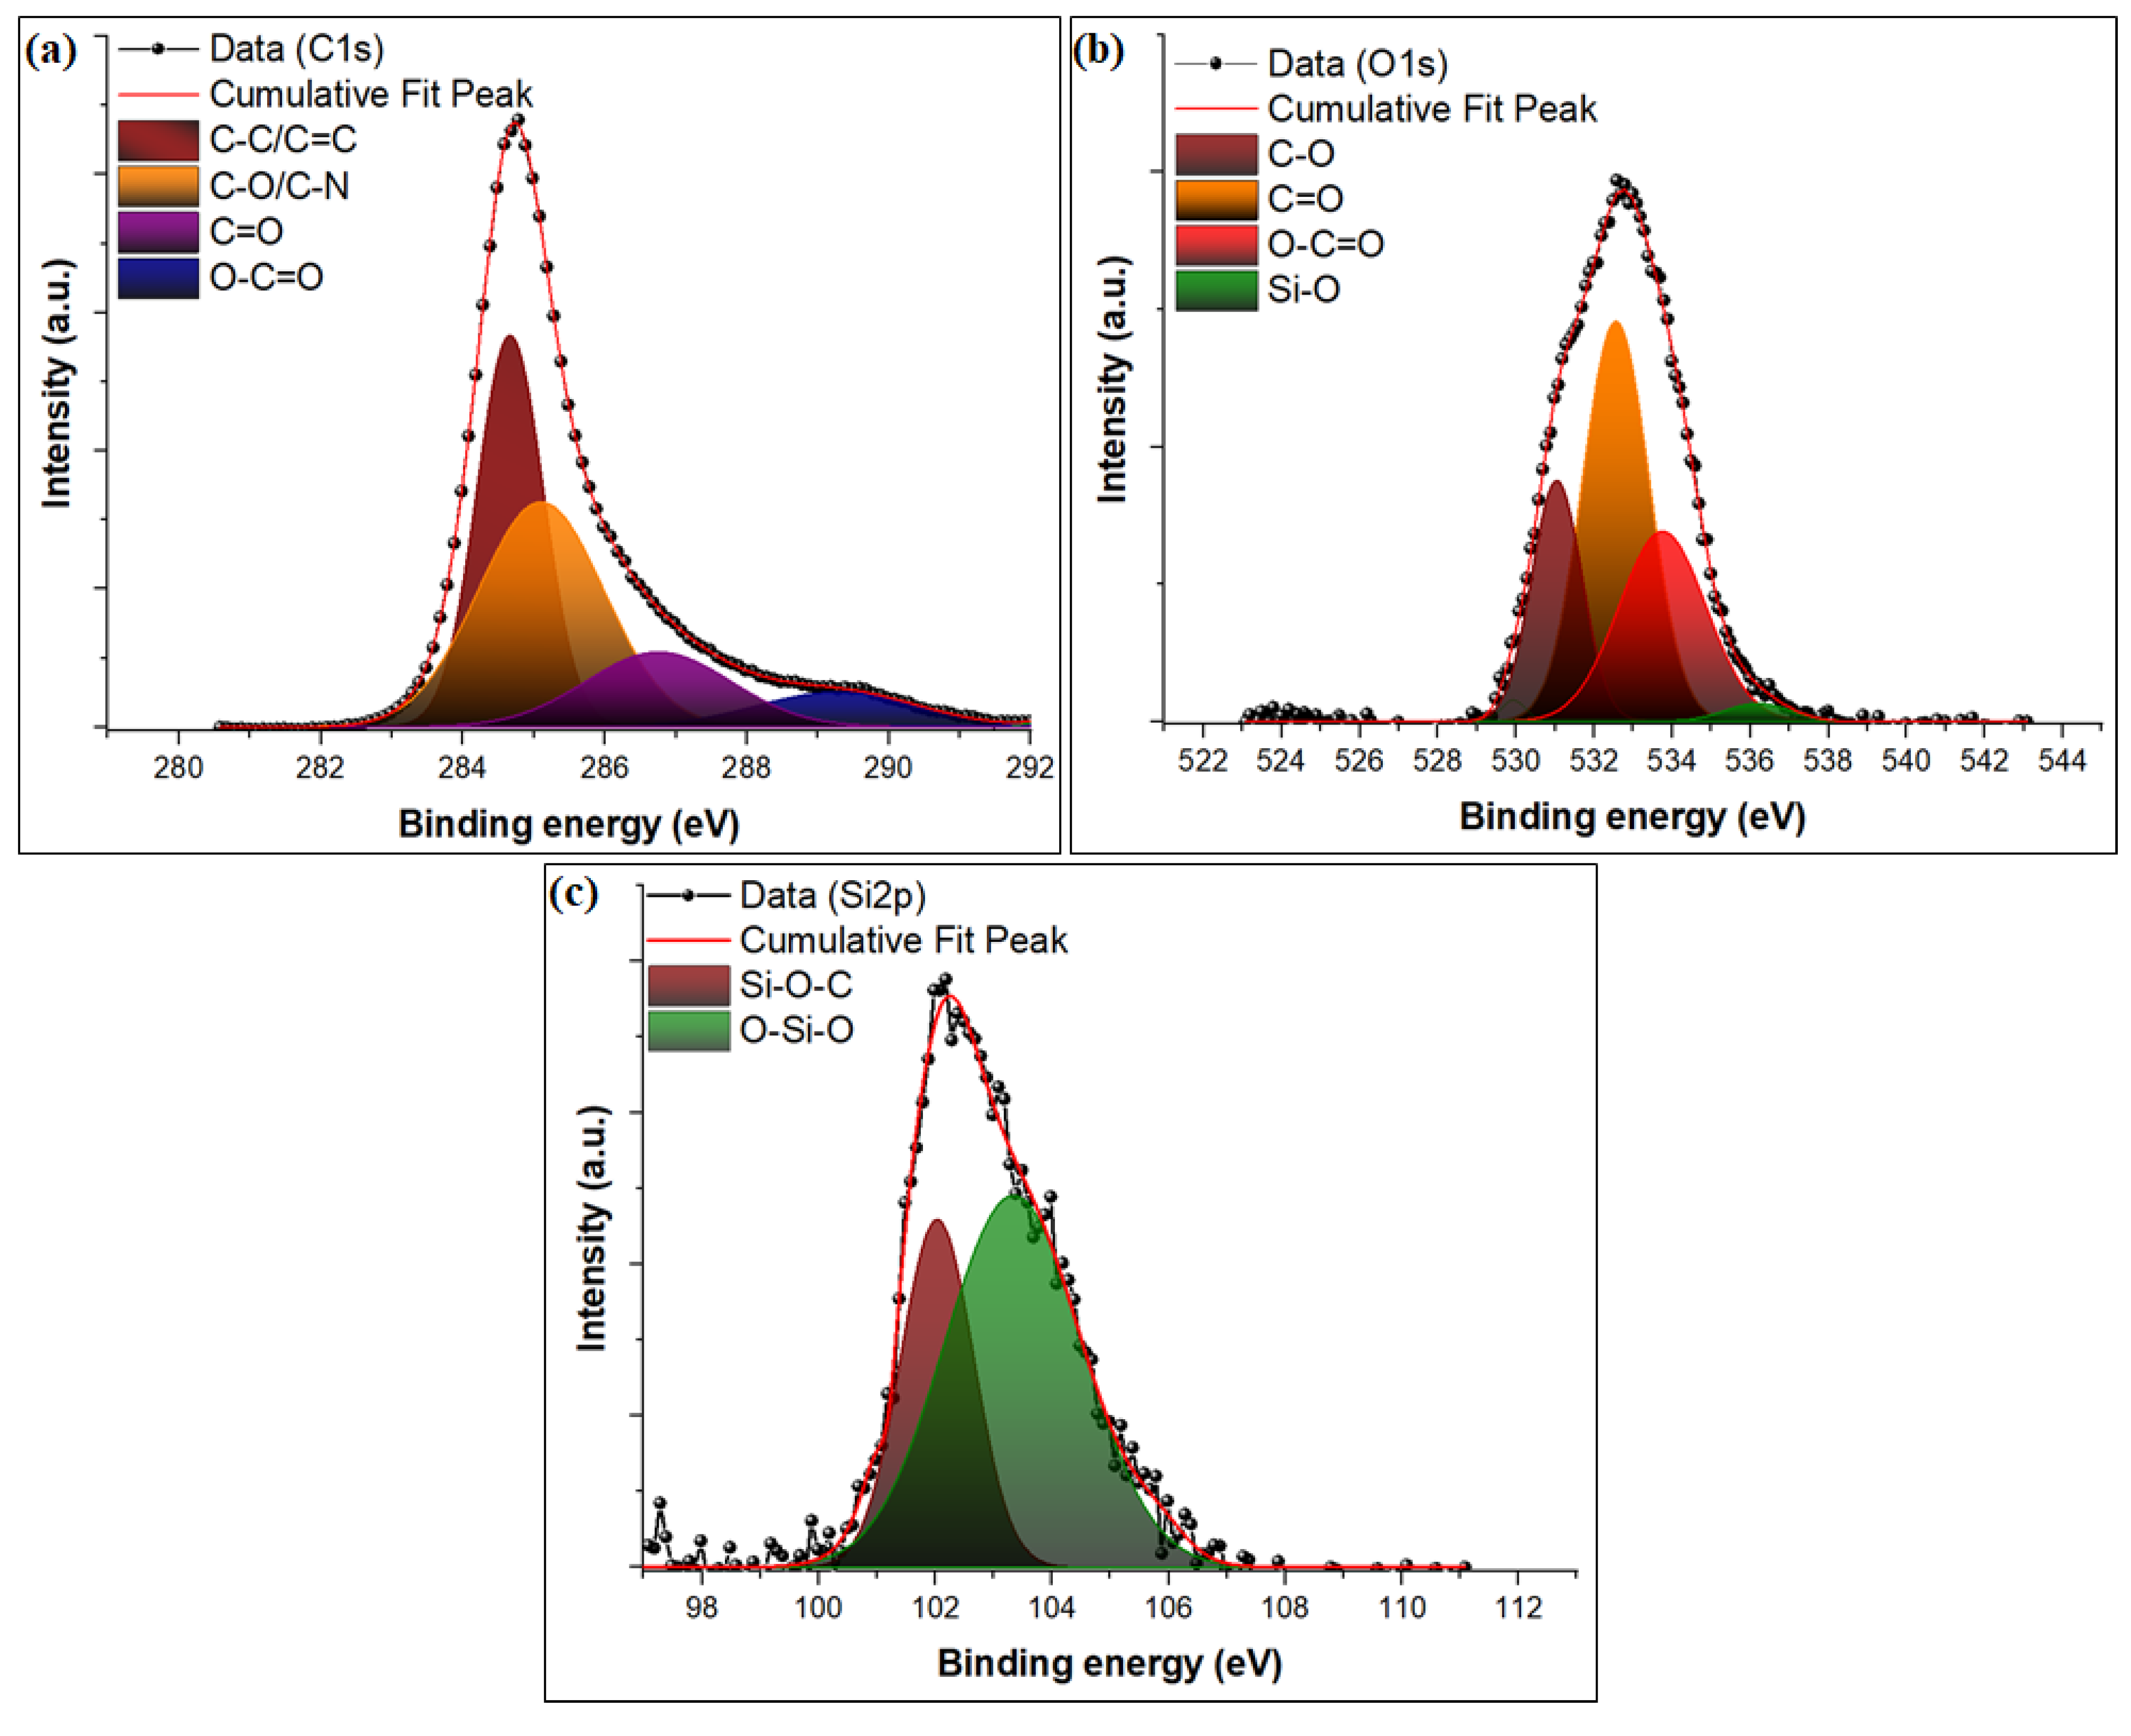
3.1. Characterization of Composites

The FT-IR spectrum of the SBPE composite displayed a broad peak at 3339 cm−1, which was attributed to stretching vibrations of the hydroxyl (-OH) group in different components of SB, such as lignin, hemicellulose and cellulose (Figure 1a) [26]. In addition, this broad peak can also refer to the N-H stretching of aromatic amine materials. After the co-carbonization of the SBPE composite to SBPEAC, a reduction in oxygen and hydrogen atoms containing functionalities was observed. This might be due to the occurrence of the dehydration and decarboxylation reaction at a higher temperature [27,28]. Therefore, the intensity peak associated with the -OH group was significantly reduced, affirming the decomposition of a large number of -OH groups during the pyrolysis [29]. The two strong peaks at 2917 and 2847 cm−1 were assigned to asymmetric and symmetric stretching vibrations of the CH2 group in PE, respectively [29,30]. The intensity of these two peaks was reduced on the SBPEAC composite spectrum. A peak at 1729 cm−1 was due to C=O stretching vibration for the carboxyl and acetyl groups in lignin and hemicellulose. This peak was significantly reduced and shifted to 1697 cm−1 in the SBPEAC composite spectrum. The two peaks at 1586 and 1521 cm−1 were assigned to C=C stretching aromatic rings present in lignin and cellulose [31,32,33]. These peaks were reduced and shifted to 1563 cm−1 in the SBPEAC composite. Peaks at 1460 and 1367 cm−1 were attributed to the bending deformation of CH2 and methylene deformation in PE [34]. The peaks at 1307 and 1247 cm−1 were attributed to the C-N stretching of the aromatic amine [35] and the stretching vibrations of C-OH due to the aryl group in lignin [36], respectively. A peak at 720 cm−1 was due to the rocking deformation of methylene groups of PE [34]. A strong peak at 1033 cm−1 described the stretching vibration of C-O-C bonds in hemicellulose, lignin, and cellulose [37]. A peak at 894 cm−1 was due to C-H deformation in cellulose [34]. The peaks at 1396, 1266, 1010, and 874 cm−1 were attributed to the bending deformation of CH2, C-N, C-O-C, and Si-O bonds, respectively [37,38]. After the co-carbonization of SBPE composite samples to SBPEAC. The peaks in MG saturated the SBPE composite spectrum and showed an increase in their respective intensities. This indicates that MG was successfully adsorbed onto the SBPE composite (Figure 1a), while MG saturated the SBPEAC spectrum and showed an increase and/or shift to lower wave numbers (Figure 1b). In addition, some new peaks also appeared after MG adsorption. In detail, the adsorption peaks around 3439 cm−1 and 1729 cm−1 for the O-H and COOH groups stretching vibration increased, respectively, indicating that electrostatic interactions were involved in the MG adsorption onto the SBPE composite. The peak related to the aromatic ring vibration at around 1586 and 1521 cm−1 increased, indicating that the π-π stacking effect was involved in MG adsorption onto the SBPE composite. The peak at 1307 cm−1 for the C-N stretching of aromatic amine increased in intensity and shifted to 1315 cm−1. The peak associated with the C=C group in the aromatic ring was increased in intensity and shifted from 1563 to 1516 cm−1, suggesting that π-π stacking was involved in MG adsorption onto the SBPEAC composite. Additionally, a new peak at 1613 cm−1 appeared due to the binding of cationic MG dye ion with C=C present on the SBPEAC composite surface. Peaks associated with the Si-O, C-N, and C-O-C groups were decreased in their intensity. Thus, it was concluded that the binding of cationic MG dye over SBPE and the SBPEAC composite surface was a multi-mechanism phenomenon.
The crystallinity of SBPE and SBPEAC composites was determined through XRD analysis, as illustrated in Figure 1c. A strong characteristic peak at 2θ = 21.55° referred to the reflection of the plane (110) for PE was observed in the SBPE pattern [39,40]. In addition, this peak also indicated the presence of cellulose in SB. Two diffraction peaks at 24.12° and 29.56° referred to as the reflection of the plane (200) and (020) for PE, respectively, in agreement with the previously reported results [41,42]. A weak peak at 36.31°, referred to the reflection of the plane (004), supports the presence of cellulose in SB. All these peaks support the formation of the SBPE composite. After co-carbonization, the strong peaks at 21.55° and 24.12° due to structural deformities in the SBPE composite become very weak. In addition, sharp peaks at 27.45° and 29.51° in the SBPEAC appeared at 600 °C indicating the presence of crystalline mineral forms of SiO2 and calcites in SB, which were generated during high-temperature pyrolysis [38,42,43]. These results agreed with the previously reported observations [43,44]. The presence of crystalline minerals forms of SiO2 and calcites in the SBPEAC composite was verified through the XPS analysis (details are provided later in this section). Finally, The XRD peaks confirmed that SBPEAC possesses a heterogeneous surface, which reflects the high performance of the SBPEAC composite toward MG adsorption compared to the SBPE composite.
Figure 1d displayed the N2 adsorption–desorption isotherm of the SBPEAC composite. Type I isotherm was observed, suggesting the presence of microspores over the SBPEAC composite surface. The Brunauer–Emmett–Teller (BET) surface area of the SBPEAC composite and pore volume was found to be 284.54 m2/g and 0.031701 cm3/g, respectively. Figure 1d (inset) presents the pore size distributions, which are determined through the BJH model. It was observed that the SBPEAC composite contains micropores with pore size distributions (~1.33 nm), suggesting the possible adsorption of MG molecule with molecular dimensions of 1.21 nm × 1.19 nm × 0.53 nm [45].
The morphology of SBPE and SBPEAC composites was analyzed through TEM, illustrated in Figure S1. It was observed that the SBPE composite does not have any pores, whereas, after the co-carbonized of SBPE through pyrolysis, the SBPEAC composite had a porous structure [46]. Similar results were reported by Hossain et al. [47] for mesoporous activated carbon developed from hemp bast fiber through hydrothermal processing.
The full scan XPS survey spectrum of the SBPE composite revealed the existence of three peaks at 284.72, 399.97, and 532.87 eV, which were attributed to C1s (72.1%), N1s (1.5%), and O1s (26.4%) (Figure 2a and Table 1). After the co-carbonization of SBPE to SBPEAC, the atomic concentration of C increased to 82.3%, while a drop in N and O atomic concentrations was observed in Figure 2b. This loss was attributed to the deterioration of functionalities during the pyrolysis of SBPE. In addition, two new peaks at 102.42 and 347.9 eV attributed to Si2p (1.1%) and Ca2p (0.7%) emerged in the SBPEAC spectrum. After MG adsorption on SBPE and SBPEAC, the atomic concentration of C increased from 72.1 to 74.3% and 82.3 to 85.2%, respectively, which might be due to the accumulation of MG ions over the SBPE and SBPEAC surface. The deconvoluted C1s spectrum of SBPEAC showed peaks at 284.61, 285.1, 286.7, and 289.46 eV attributed to C-C/C=C, C-O/C-N, C=O, and O-C=O, respectively (Figure 3a) [46,47]. The high-resolution deconvoluted O1s spectrum of SBPEAC showed four peaks at 531.12, 532.51, 533.80, and 536.01 eV, which were assigned to C-O, C=O, and O-C=O, respectively (Figure 3b) [48]. The deconvoluted Si 2p spectrum of SBPEAC resulted in three peaks located at 101.7, 102.6, and 103.5 eV, assigned to Si-C, Si-O-C, and O-Si-O, respectively (Figure 3c) [49,50]. After MG adsorption on SBPE and SBPEAC composites, the atomic concentration of N1s increased from 1.49 to 1.77% and 0.39 to 4.98%, respectively (Table 1). In addition, the atomic concentration of O1s was reduced from 26.42 to 23.88% and 14.23 to 9.34%, respectively. These results affirmed the successful binding of MG ions over the SBPE and SBPEAC composite surfaces.

3.2. Adsorption Studies

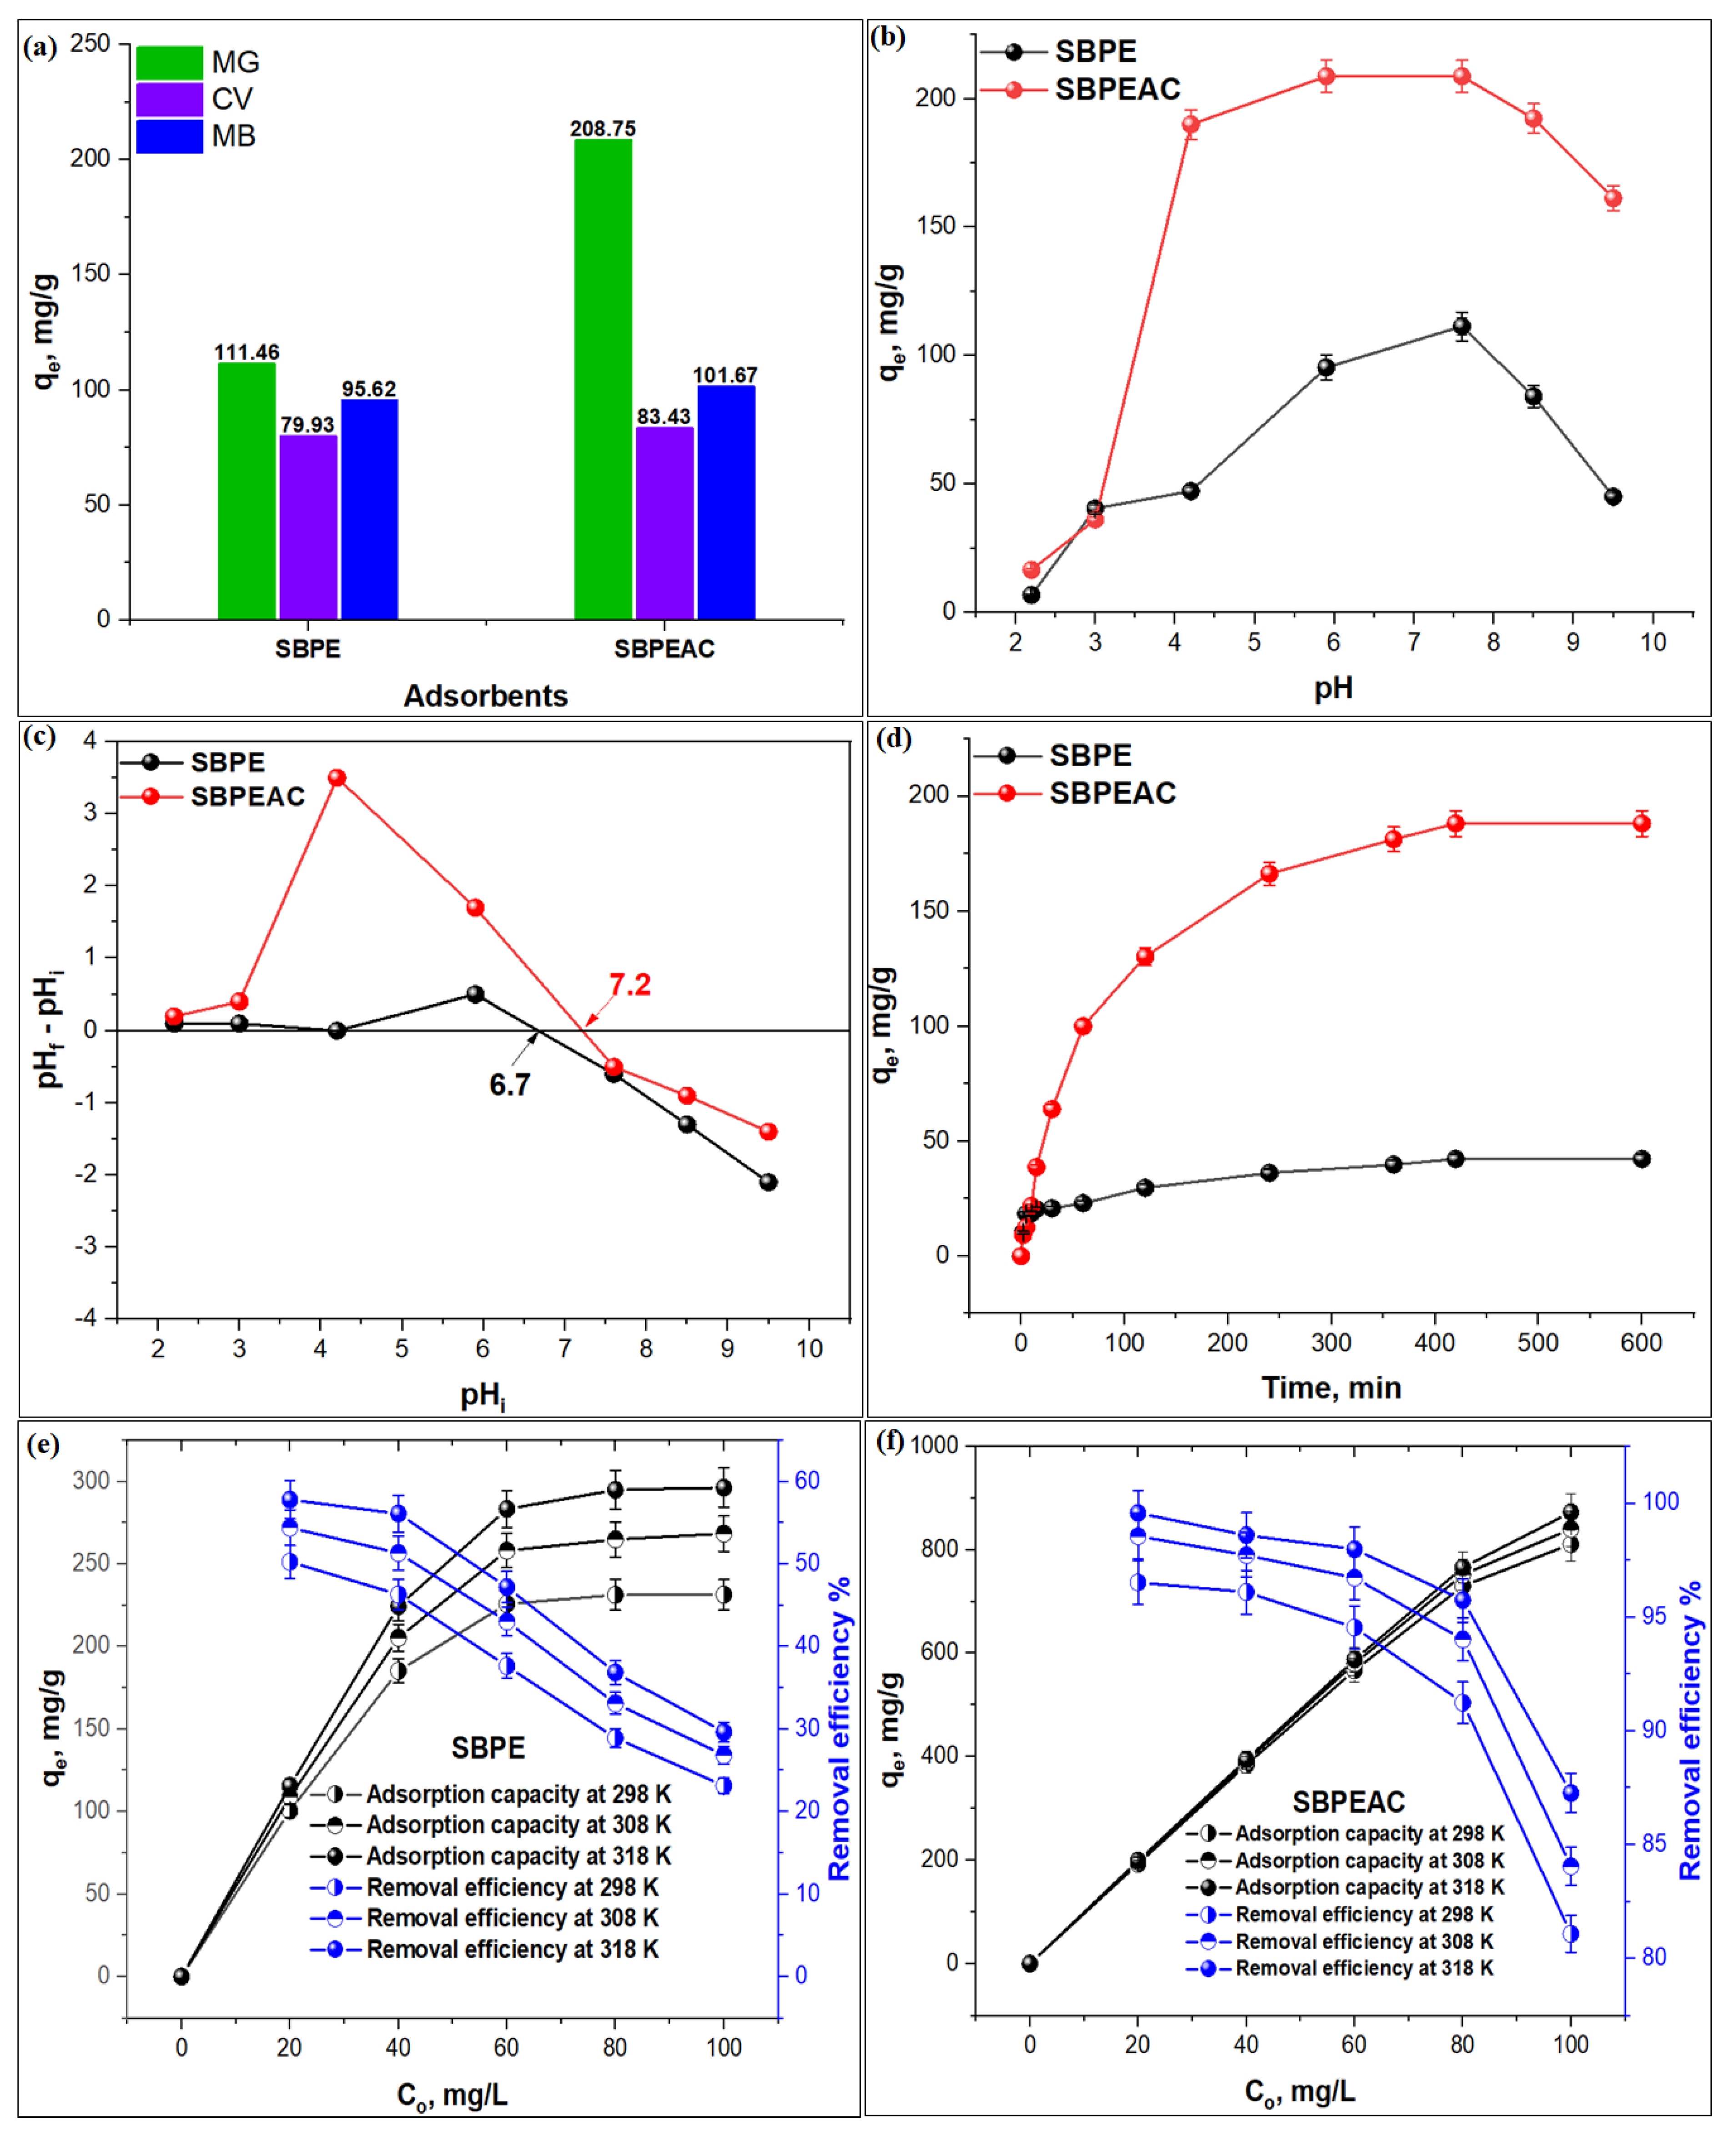
3.2.1. Selectivity Study

The adsorption of three cationic dyes viz. MG, MG, and CV on SBPE and SBPEAC composites under experimental conditions (at Co: 25 mg/L, m: 0.005 g, T: 298 K, and t: 24 h) were tested during the selectivity study. The results displayed in Figure 4a reveal that the maximum uptake capacities of MG, MB, and CV dyes on SBPE and SBPEAC composites were 111.5, 95.6 and 79.9 mg/g, and 208.9, 101.8, and 83.4 mg/g, respectively, owing to the difference in their chemical structure in terms of functional groups and molecular size. Among the dyes, the removal efficiencies of MG on SBPE and SBPEAC were 111.5 and 208.9 mg/g, respectively, which was the highest among the tested dyes. The spatial diameters of CV and MB dyes were larger than that of the MG dye as there are two -N(CH3)2 functional groups in CV and MB but only one -N(CH3)2 functional group in MG [51,52]. In addition, the large molecule of the CV dye might hinder its binding to the SBPE and SBPEAC surface [53]. MB contains a positively charged S atom, which can bind to negatively charged carbonyl, carboxyl, and hydroxyl groups present on SBPE and SBPEAC composite surfaces. Thus, MB molecules occupy larger areas on the SBPE and SBPEAC surface, hindering the binding of additional MB molecules and consequently reducing its MB removal efficiency [54]. Therefore, MG dye was selected to further understand the adsorption process on SBPE and SBPEAC composites.

3.2.2. Effect of pH

MG is a triphenylmethane-based dye with a pH-dependent molecular structure. The MG structure changes to a carbinol base, losing color under basic conditions due to a reaction that occurs between MG and OH. Therefore, the influence of solution pH on MG adsorption onto SBPE and SBPEAC composites was studied at various pH values, as illustrated in Figure 4b. It was observed that MG adsorption capacities on both SBPE and SBPEAC increased from 6.88 to 111.46 mg/g and 16.69 to 208.76 mg/g with an increasing solution pH from 2.2 to 7.6, respectively. The MG adsorption capacity on SBPEAC was greater than that on SBPE. This might be due to the activation of SBPE to SBPEAC, leading to an increase in oxygen-containing functional groups onto the surface of SBPEAC, resulting in an increase in MG removal at pH 7.6 [24]. On the contrary, in an acidic medium, the adsorption capacities of both the adsorbents were the lowest due to the protonation of both SBPE and SBPEAC surfaces by H+ ions. The protonated adsorbent surfaces hindered the binding of cationic MG through electrostatic repulsion. As the solution pH continued to increase, the functional groups on the adsorbent’s surfaces gained a negative charge, attracting cationic MG through electrostatic attraction forces. These results can be confirmed by a point of zero charges (pHPZC) plot (Figure 4c). The pHPZC of SBPE and SBPEAC composites were 6.7 and 7.2, respectively. This indicates that the surface of both SBPE and SBPEAC composites were positively charged when pH < pHPZC due to the reaction of H+ ions with surface active functional groups, which led to electrostatic repulsion between the positive charge of both SBPE and SBPEAC surfaces and cationic MG dye. This reduces the maximum adsorption of MG onto both SBPE and SBPEAC composites. When the pH > pHPZC, the number of negatively charged sites on the SBPE and SBPEAC composites increases. This increase in the adsorption of the cationic MG dye onto both SBPE and SBPEAC surfaces through electrostatic interaction led to an increase in the adsorption capacities of both SBPE and SBPEAC composites toward the MG dye. Similar results were reported for the adsorption of MG on the copper ferrite/drumstick pod biomass composite [55] and magnetite/coir pith-supported sodium alginate beads by Sarkar et al. [56]. Thus, pH 7.6 was selected for further studies.

3.2.3. Effect of Contact Time

The effect of contact time on MG adsorption onto SBPE and SBPEAC composites was studied by varying the contact time between 2 and 600 min under fixed experimental conditions (Co: 25 mg/L; pH; 7.6; m: 0.005 g; agitation speed: 100 rpm; and T: 298 K), as depicted in Figure 4d. It was observed that MG adsorption onto SBPE and SBPEAC composites was rapid during the initial stages (between 2 and 360 min). After 360 min, it slowed down, reaching an equilibrium in 420 min. The MG adsorption capacities on SBPE and SBPEAC at the equilibrium were 42.31 and 181.28 mg/g, respectively. The initial (first) adsorption stage indicated fast binding of MG to the external surfaces of both SBPE and SBPEAC due to the larger numbers of vacant active sites accessible for MG molecule adsorption. The second stage of adsorption was owed to the diffusion of MG into the pores of SBPE and SBPEAC. Both SBPE and SBPEAC composite saturates during the third and final stage could be explained by the exhaustion of the free adsorptive sites [57]. The adsorption capacity of SBPEAC was comparatively higher than SBPE owing to the larger specific surface area and porous structure of SBPEAC. In addition, the large number of oxygen-containing functionalities present on the SBPEAC surface played a critical role during MG adsorption. Slower adsorption kinetics were observed for the removal of MG using biochar from the spent fermentation sludge of coir wastes with 12.45 mg/g uptake at Co: 100 mg/L [58]. The observed equilibration time was 360 min for MG adsorption on Bacillus cereus M116 with 66 mg/g as an equilibrium adsorption capacity at Co: 50 mg/L and T: 303K [59]. Thus, 420 min was selected as the optimum contact time during the study.

3.2.4. Effect of Initial Concentration and Temperature

The impact of the initial concentration (Co) on MG adsorption efficiency onto SBPE and SBPEAC composites was studied for Co ranging from 20 to 100 mg/L at varied temperatures: 298, 308, and 318 K. The adsorption capacity of MG on SBPE and SBPEAC composites for the aforesaid Co range increased from 115.6 to 296.3 mg/g and 199.1 to 872.7 mg/g, respectively (Figure 4e,f), while a respective decrease in the removal efficiency from 57.8 to 29.6% and 99.6 to 87.3% at 318 K was observed. The increase in the adsorption capacity at a higher temperature was attributed to an enhancement in the collision energy between MG and the composite surface. Additionally, an increase in the initial MG concentration provided a driving force, which could accelerate the mass transfer of MG onto the surface of SBPE and SBPEAC composites, leading to its enhanced adsorption capacities. The maximum adsorption efficiency of MG on SBPEAC was 99.6%, which was significantly higher than SBPE (57.8%), reflecting the merits of SBPE co-carbonization on MG adsorption. The observed results were comparatively better for MG adsorption on sulfur-doped biochar derived from tapioca peel waste [60] and similar for MG adsorption on pyrolyzed rice husks [61]. Regarding the influence of temperature on the adsorption process, the experimental data revealed that the adsorption efficiency of MG onto SBPE and SBPEAC increased from 50.82 to 57.79% and from 96.51 to 99.57% with a rise in temperature from 298 to 318 K, respectively, reflecting the endothermic behavior of adsorption. This rise in temperature might lead to a reduction in the viscosity of an MG solution, which results in an increase in MG diffusion rate through the pores of the SBPE and SBPEAC composites [62]. These results are consistent with previous studies, which have reported the maximum removal of MG at a higher temperature using reduced graphene oxide [62] and magnetite/coir pith-supported sodium alginate beads [56].
Thus, the results of the influence parameters on the MG adsorption process onto SBPE and SBPEAC composites can be summarized as follows:
  • The solution pH significantly influences MG adsorption on both SBPE and SBPEAC composites with maximum uptake at pH 7.6.
  • The MG adsorption on both composites increases with time, attaining equilibrium at 420 min. The observed adsorption capacities at the equilibrium on SBPE and SBPEAC were 42.3 and 181.3 mg/g, respectively.
  • The adsorption process was endothermic, with maximum adsorption efficiencies of 57.8 and 99.6% on SBPE and SBPEAC at 318 K, respectively.
  • The results reveal that the SBPEAC composite has an excellent ability to remove MG at 80 and 100 mg/L with a 95.7 and 87.3% removal efficiency, respectively.

3.3. Adsorption Modeling

3.3.1. Adsorption Isotherm

The data for MG adsorption onto SBPE and SBPEAC composites were modeled by non-linear Langmuir [63], Freundlich [64], and Dubinin–Radushkevich (D-R) [65] isotherm models. Details are provided in the Supplementary Information, Text S1. Figure S2a–f) illustrates the MG adsorption isotherms and Table 2 summarizes the calculated isotherm parameters. Based on regression coefficient (R2) values, the adsorption of MG onto SBPE at varied temperatures was better described by the DR model, while MG adsorption on SBPEAC was better described by the Langmuir isotherm model in line with previous a study on MG adsorption on graphene quantum dots-vitamin B9-iron (III)-tannic acid [66]. The results confirmed that the adsorption of MG on SBPEAC was established by the monolayer adsorption process with maximum monolayer adsorption capacity (qm)—928.6 mg/g at 318 K. The qm for MG uptake over SBPE was 375.6 mg/g at 318 K. The magnitudes of the separation factor (RL) during the study were a range from 0 to 1. This affirms the favorable nature of MG adsorption processes onto both SBPE and SBPEAC composites. The increase in KL and KF constants with a rise in temperature confirmed that the MG adsorption on both adsorbents was endothermic [67]. From the DR model, the mean free energy (E) values for MG adsorption on SBPE and SBPEAC were found in the range 0.113–0.129 kJ/mol and 0.727–1.360 kJ/mol, respectively. These values were <8 kJ/mol, indicating the existence of hydrogen bonding forces during the adsorption process [68].

3.3.2. Adsorption Kinetic

The adsorption kinetic of MG on SBPE and SBPEAC composites was investigated to determine the adsorption mechanism of MG on both adsorbents. The non-linear kinetic models, namely, the pseudo-first-order [69], pseudo-second-order, and Elovich [70] models, were applied to kinetics data, and details are given in the Supplementary Information, Text S2. The non-linear kinetic plots for MG adsorption onto SBPE and SBPEAC composites are illustrated in Figure S3a,b), and Table 3 displays the calculated kinetic parameters. The experimental data for MG adsorption on SBPE was fitted to the Elovich model, while MG adsorption on SBPEAC was fitted to the pseudo-second-order kinetic model, supported by higher R2 values for Elovich and pseudo-second-order models, respectively (Table 3).
The magnitude of experimental adsorption capacity (qe,exp.) for MG adsorption on SBPE was very close to the pseudo-second-order model calculated for the adsorption capacity (qe2,cal.) value. This indicates that the MG adsorption on the SBPE composite may involve the chemisorption process through shared electrons between the MG and SBPE composite. According to the Elovich model, the high value of α (12.333) compared to β (0.17317) indicates that the adsorption of MG onto SBPE was feasible [68]. For MG adsorption on SBPEAC, the R2 values for the pseudo-first-order kinetic, pseudo-second-order kinetic, and Elovich models were >0.99. In addition, the qe,exp. was nearer to qe1,cal. and qe2,cal. values. This indicates that the MG adsorption on the SBPEAC adsorbent involved both chemisorption and physisorption processes.

3.3.3. Adsorption Thermodynamics

The thermodynamic parameters such as standard entropy change (ΔS°), Gibb’s free energy (ΔG°), and standard enthalpy change (ΔH°) were assessed for the adsorption of MG on SBPE and SBPEAC composites. These parameters were calculated as:
G ° = R T   l n K c
ln K c = q e C e
K c = S ° R H ° R T
where Kc is the equilibrium constant [71], R refers to the gas constant (8.314 J/mol-K), and Ce is the equilibrium concentration of MG dye. Figure S4a,b displays the Van’t Hoff plots for the adsorption of MG on SBPE and SBPEAC composites, and the magnitudes of thermodynamic parameters are summarized in Table 4. According to the negative ΔG° and positive ΔH° values, the adsorption of MG on SBPE and SBPEAC adsorbents was spontaneous and endothermic in nature, respectively. A decrease in the magnitude of ΔG° was observed with an increase in temperature from 298 to 318 K. This shows that MG adsorption onto both adsorbents was favorable at higher temperatures (318 K) at different MG concentrations, supported by an increase in the adsorption capacities of both adsorbents as the temperature increased. The positive ΔS° values revealed the affinity of SBPE and SBPEAC composites towards MG. In addition, it suggests the increased randomness at the solid–liquid interface during the MG adsorption onto both composites.

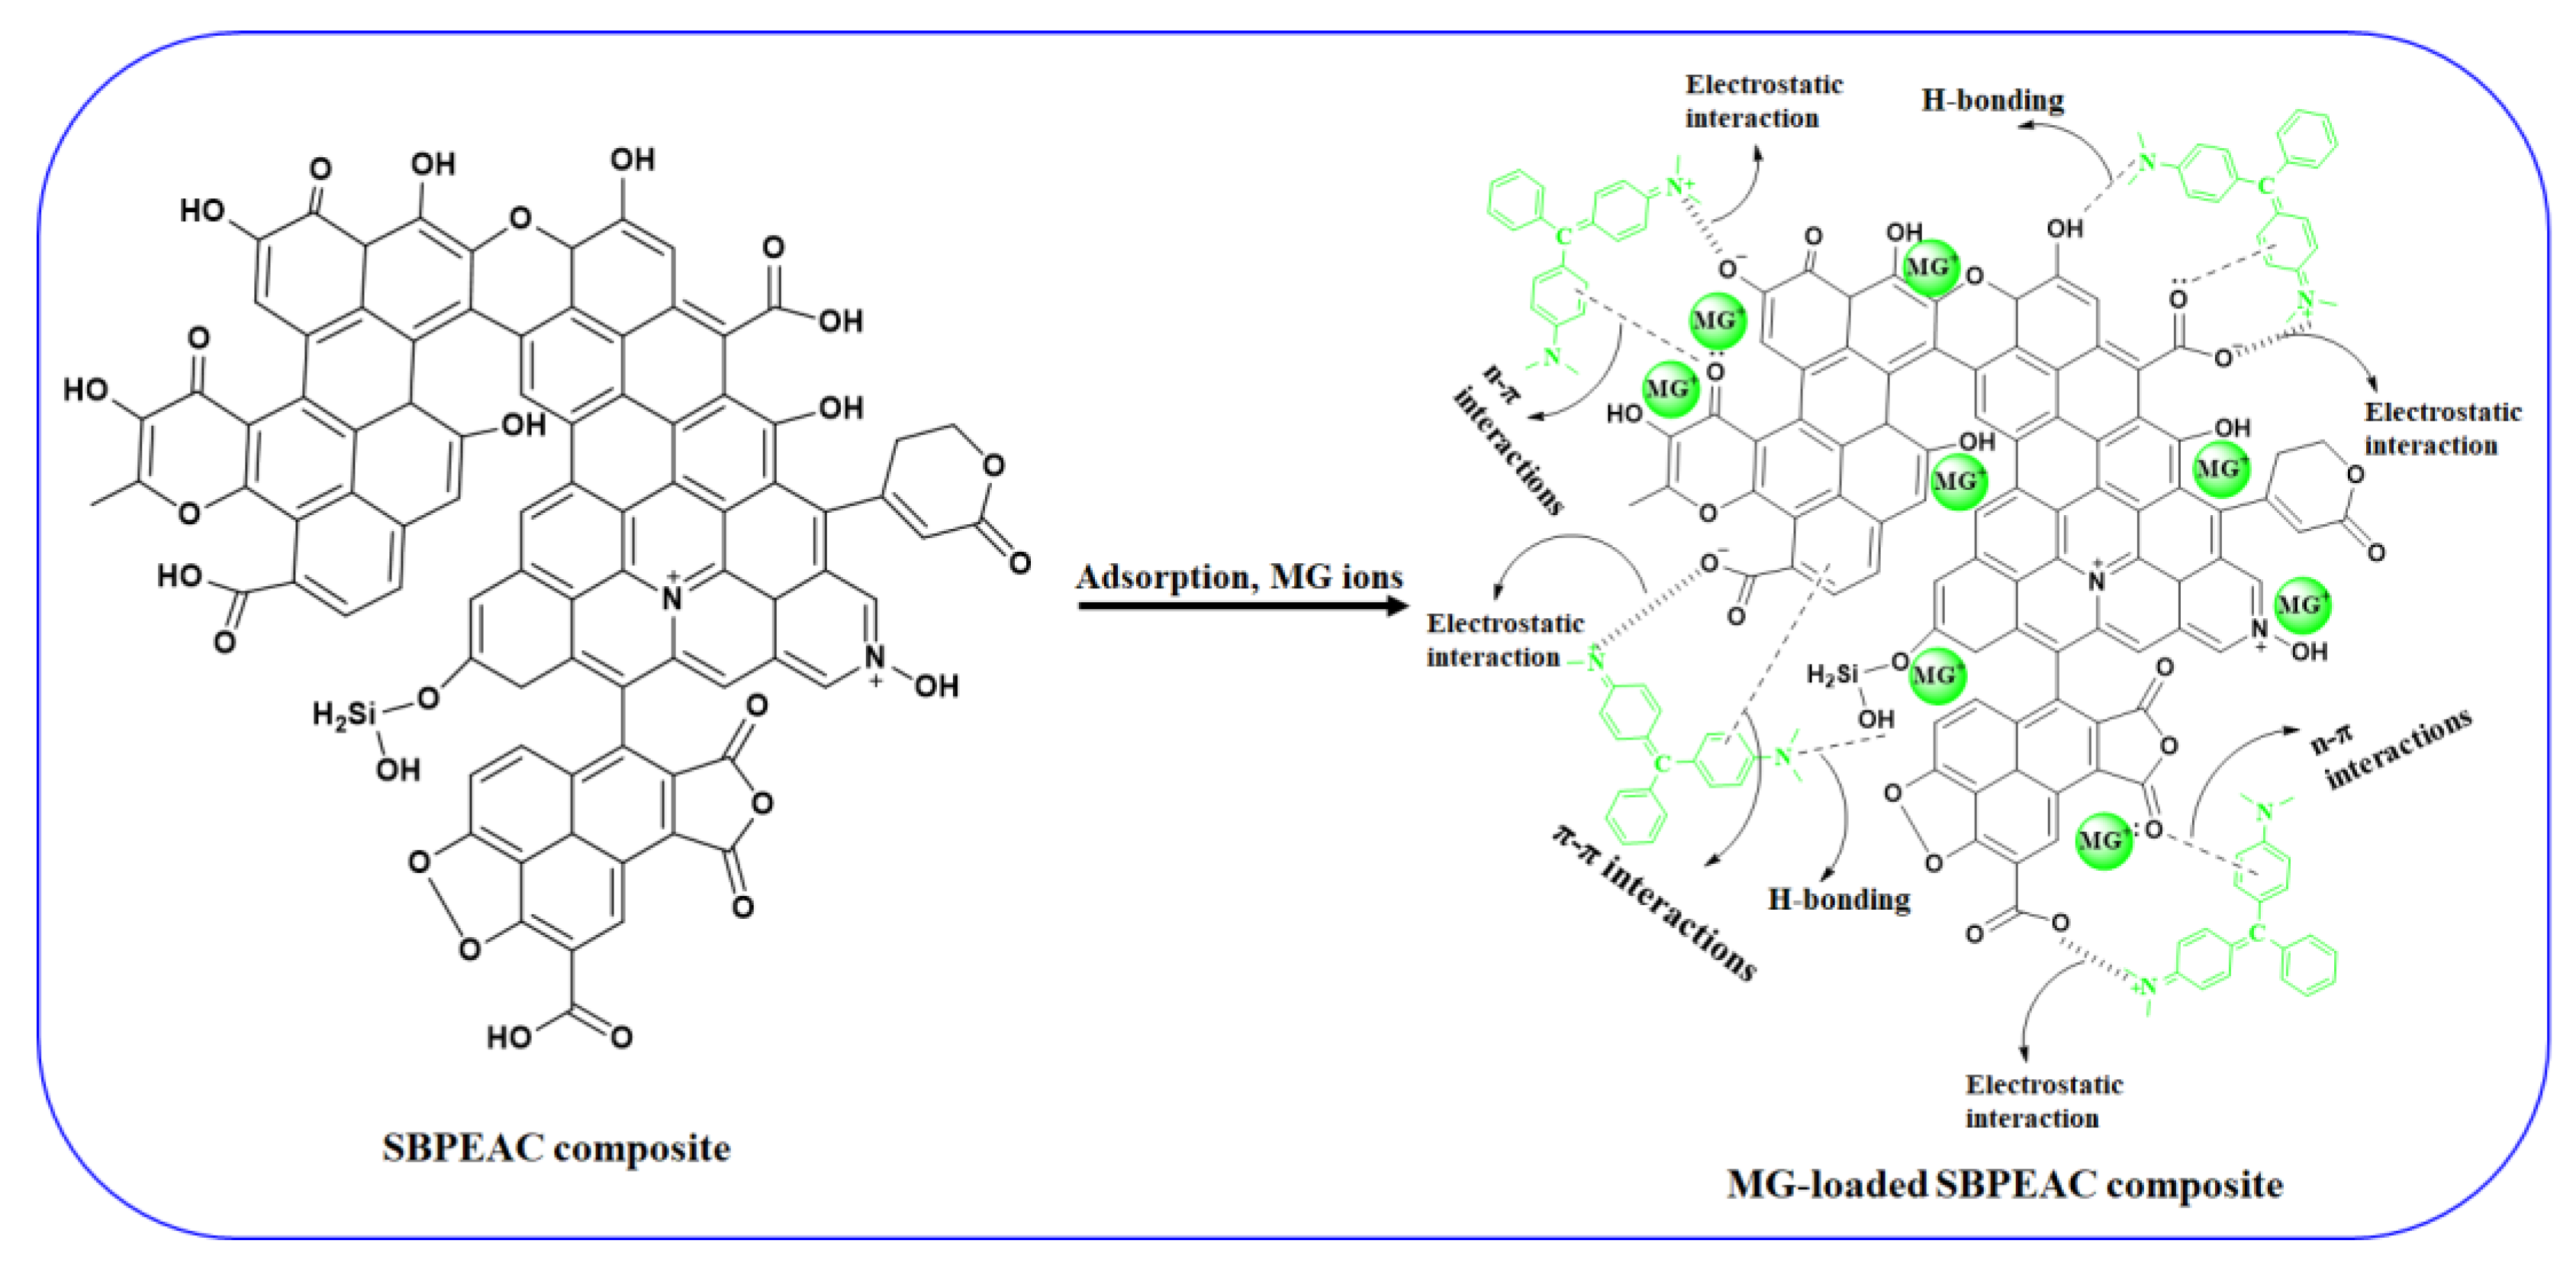
3.4. MG Adsorption Mechanism

Figure 5 displays the proposed adsorption mechanism of MG onto the SBPEAC composite. The FT-IR and XPS analyses affirmed that the SBPEAC adsorbent-bearing functional groups such as carboxyl, carbonyl, hydroxyl, and aromatic N groups was due to the presence of phenolic compounds, lignin, and cellulose. According to XPS analysis, after MG adsorption, the atomic concentration of nitrogen (N1s) on SBPE and SBPEAC composites increased from 1.49 to 1.77% and 0.39 to 4.98%, respectively (Table 1), while the atomic concentration of oxygen (O1s) was reduced from 26.42 to 23.88% and 14.23 to 9.34%, respectively, verifying that MG dye ions successfully adhered onto SBPE and the SBPEAC composite surface. In addition, the adsorption of MG dye ions on SBPE and SBPEAC composite surfaces was also confirmed by FT-IR analysis (Figure 1). After MG adsorption onto the SBPE and SBPEAC composites, the intensities of most of the peaks were increased and shifted to lower wavenumbers. In addition, many new peaks appeared. In detail, the absorption peaks around 3439 cm−1 and 1729 for the O-H and COOH groups stretching vibration increased, respectively, indicating that electrostatic interactions were involved in the MG adsorption onto the SBPE composite. The peak related to the aromatic ring vibration at around 1586 and 1521 cm−1 increased, indicating that the π-π stacking effect was involved in MG adsorption onto the SBPE composite. The peak at 1307 cm−1 for the C-N stretching of aromatic amine was increased in intensity and shifted to 1315 cm−1. The peak associated with the C=C group in the aromatic ring was increased in intensity and shifted from 1563 to 1516 cm−1, suggesting that the π-π stacking was involved in MG adsorption onto the SBPEAC composite. Additionally, a new peak at 1613 cm−1 appeared due to the binding of cationic MG dye ion with C=C present on the SBPEAC composite surface. The hydrogen bonding interaction between H atoms present on the SBPEAC surface and the N atom of the MG molecule was another possible mechanism for MG adsorption onto the SBPEAC composite, as illustrated in Figure 5. The n-π interaction between the oxygen atom of carbonyl groups (acts as an electron donor) took place on the surface of SBPEAC and the aromatic rings of MG (acts as electron acceptors). These types of interactions were observed during dye adsorption on pomelo fruit peel [72]. In addition, peaks associated with Si-O, C-N, and C-O-C groups were decreased in their intensity. Thus, it was concluded that the binding of cationic MG over SBPE and SBPEAC composite surfaces occurred by different mechanisms such as electrostatic interaction, hydrogen bonding, and π-π/n-π interactions.

4. Conclusions

Activated (SBPEAC) and non-activated (SBPE) composites were developed from SB and PE wastes. The characterization data revealed that the SBPEAC surface was microporous, with a high specific surface area and a large number of surface functionalities. These functionalities played an active role in MG adsorption on SBPEAC. Thus, among the developed composites, SBPEAC showed better MG adsorption (926.6 mg/g) performance under optimized conditions pH: 7.6, t: 420 min, Co: 100 mg/L, T: 318 K. Kinetic and isotherm modeling data for MG adsorption on the SBPEAC composite was fitted to pseudo-second-order kinetic and Langmuir isotherm models, while the data for MG adsorption on SBPE was fitted to Elovich kinetic and DR isotherm models.
The MG adsorption on the SBPEAC composite occurred through electrostatic, π–π and n–π interactions, and H-bonding. Thus, the SBPEAC composite, developed through co-pyrolysis of SB and PE wastes, could be considered a sustainable, economical, and eco-friendly adsorbent to effectively remove MG from water.

Supplementary Materials

The following supporting information can be downloaded at: https://www.mdpi.com/article/10.3390/nano13071193/s1, Figure S1: TEM images of SBPE (a), and SBPEAC (b) composites; Figure S2: Non-linear isotherm models for MG adsorption on SBPE at 298 K (a), 308 K (b), 318 K (c), and on SBPEAC at (d) 298 K, (e) 308 K, (f) 318 K; Figure S3: Non-linear kinetic models for MG adsorption on SBPE (a), and SBPEAC (b) composites; Figure S4: Van’t Hoff plots for MG adsorption on SBPE (a), and SBPEAC (b) composites; Text S1: Adsorption isotherm models used; Text S2: Adsorption kinetic models used.

Author Contributions

Conceptualization, M.A.K.; methodology, M.A.K. and S.M.W.; software, A.A.A.; validation, M.A.K., A.A.A. and S.M.W.; formal analysis, S.M.W.; investigation, M.A.K. and S.M.W.; resources, M.A.K.; data curation, M.A.K. and A.A.A.; writing—original draft preparation, M.A.K.; writing—review and editing, B.-H.J. and S.M.W.; visualization, B.-H.J.; supervision, B.-H.J.; project administration, M.A.K.; funding acquisition, M.A.K. All authors have read and agreed to the published version of the manuscript.

Funding

This research was funded through Researchers Supporting Project number (RSP2023R345), King Saud University, Riyadh, Saudi Arabia.

Data Availability Statement

Data is available from the corresponding author on reasonable request.

Acknowledgments

Moonis Ali Khan acknowledges the financial support through Researchers Supporting Project number (RSP2023R345), King Saud University, Riyadh, Saudi Arabia.

Conflicts of Interest

The authors declare no conflict of interest.

References

  1. Aruna; Bagotia, N.; Sharma, A.K.; Kumar, S. A review on modified sugarcane bagasse biosorbent for removal of dyes. Chemosphere 2021, 268, 129309. [Google Scholar] [CrossRef]
  2. Azzaz, A.A.; Jellali, S.; Akrout, H.; Assadi, A.A.; Bousselmi, L. Dynamic investigations on cationic dye desorption from chemically modified lignocellulosic material using a low-cost eluent: Dye recovery and anodic oxidation efficiencies of the desorbed solutions. J. Clean. Prod. 2018, 201, 28–38. [Google Scholar] [CrossRef]
  3. Chakraborty, S.; Mukherjee, A.; Das, S.; Maddela, N.R.; Iram, S.; Das, P. Study on isotherm, kinetics, and thermodynamics of adsorption of crystal violet dye by calcium oxide modified fly ash. Environ. Eng. Res. 2021, 26, 190372. [Google Scholar] [CrossRef]
  4. Du, F.; Sun, L.; Huang, Z.; Chen, Z.; Xu, Z.; Ruan, G.; Zhao, C. Electrospun reduced graphene oxide/TiO2/poly(acrylonitrile-co-maleic acid) composite nanofibers for efficient adsorption and photocatalytic removal of malachite green and leucomalachite green. Chemosphere 2020, 239, 124764. [Google Scholar] [CrossRef]
  5. Ahmad, A.A.; Ahmad, M.A.; Yahaya, N.K.E.; Karim, J. Adsorption of malachite green by activated carbon derived from gasified Hevea brasiliensis root. Arab. J. Chem. 2021, 14, 103104. [Google Scholar] [CrossRef]
  6. Gopinathan, R.; Kanhere, J.; Banerjee, J. Effect of malachite green toxicity on non target soil organisms. Chemosphere 2015, 120, 637–644. [Google Scholar] [CrossRef] [PubMed]
  7. Manyatshe, A.; Cele, Z.E.; Balogun, M.O.; Nkambule, T.T.; Msagati, T.A. Chitosan modified sugarcane bagasse biochar for the adsorption of inorganic phosphate ions from aqueous solution. J. Environ. Chem. Eng. 2022, 10, 108243. [Google Scholar] [CrossRef]
  8. Sogancioglu, M.; Yel, E.; Ahmetli, G. Pyrolysis of waste high density polyethylene (HDPE) and low density polyethylene (LDPE) plastics and production of epoxy composites with their pyrolysis chars. J. Clean. Prod. 2017, 165, 369–381. [Google Scholar] [CrossRef]
  9. Renita, A.A.; Vardhan, K.H.; Kumar, P.S.; Ngueagni, P.T.; Abilarasu, A.; Nath, S.; Kumari, P.; Saravanan, R. Effective removal of malachite green dye from aqueous solution in hybrid system utilizing agricultural waste as particle electrodes. Chemosphere 2021, 273, 129634. [Google Scholar] [CrossRef]
  10. Sonawane, G.; Shrivastava, V. Kinetics of decolourization of malachite green from aqueous medium by maize cob (Zea maize): An agricultural solid waste. Desalination 2009, 247, 430–441. [Google Scholar] [CrossRef]
  11. Mittal, A.; Krishnan, L.; Gupta, V. Removal and recovery of malachite green from wastewater using an agricultural waste material, de-oiled soya. Sep. Purif. Technol. 2005, 43, 125–133. [Google Scholar] [CrossRef]
  12. Deniz, F.; Kepekci, R.A. Bioremoval of Malachite green from water sample by forestry waste mixture as potential biosorbent. Microchem. J. 2017, 132, 172–178. [Google Scholar] [CrossRef]
  13. Hijab, M.; Parthasarathy, P.; Mackey, H.R.; Al-Ansari, T.; McKay, G. Minimizing adsorbent requirements using multi-stage batch adsorption for malachite green removal using microwave date-stone activated carbons. Chem. Eng. Process.-Process. Intensif. 2021, 167, 108318. [Google Scholar] [CrossRef]
  14. Ungureanu, N.; Vlăduț, V.; Biriș, S. Sustainable Valorization of Waste and By-Products from Sugarcane Processing. Sustainability 2022, 14, 11089. [Google Scholar] [CrossRef]
  15. Rocha, G.J.D.M.; Nascimento, V.M.; Gonçalves, A.R.; Silva, V.F.N.; Martín, C. Influence of mixed sugarcane bagasse samples evaluated by elemental and physical–chemical composition. Ind. Crop. Prod. 2015, 64, 52–58. [Google Scholar] [CrossRef]
  16. Di Bella, C.; Traina, A.; Giosuè, C.; Carpintieri, D.; Dico, G.M.L.; Bellante, A.; Del Core, M.; Falco, F.; Gherardi, S.; Uccello, M.M.; et al. Heavy Metals and PAHs in Meat, Milk, and Seafood from Augusta Area (Southern Italy): Contamination Levels, Dietary Intake, and Human Exposure Assessment. Front. Public Health 2020, 8, 273. [Google Scholar] [CrossRef]
  17. Praipipat, P.; Ngamsurach, P.; Sanghuayprai, A. Modification of sugarcane bagasse with iron(III) oxide-hydroxide to improve its adsorption property for removing lead(II) ions. Sci. Rep. 2023, 13, 1467. [Google Scholar] [CrossRef]
  18. Tahir, H.; Sultan, M.; Akhtar, N.; Hameed, U.; Abid, T. Application of natural and modified sugar cane bagasse for the removal of dye from aqueous solution. J. Saudi Chem. Soc. 2016, 20, S115–S121. [Google Scholar] [CrossRef] [Green Version]
  19. Yaqoob, L.; Noor, T.; Iqbal, N. Conversion of Plastic Waste to Carbon-Based Compounds and Application in Energy Storage Devices. ACS Omega 2022, 7, 13403–13435. [Google Scholar] [CrossRef]
  20. Hussin, F.; Aroua, M.K.; Kassim, M.A.; Ali, U.F.M. Transforming Plastic Waste into Porous Carbon for Capturing Carbon Dioxide: A Review. Energies 2021, 14, 8421. [Google Scholar] [CrossRef]
  21. Zein, S.H.; Grogan, C.T.; Yansaneh, O.Y.; Putranto, A. Pyrolysis of High-Density Polyethylene Waste Plastic to Liquid Fuels—Modelling and Economic Analysis. Processes 2022, 10, 1503. [Google Scholar] [CrossRef]
  22. Aguado, J.; Serrano, D. On Feedstock Recycling of Waste Plastic; RSC Clean Technology, Monographs; Clark, J.H., Ed.; Royal Society of Chemistry: Cambridge, UK, 1999. [Google Scholar]
  23. Lian, Y.-M.; Utetiwabo, W.; Zhou, Y.; Huang, Z.-H.; Zhou, L.; Faheem, M.; Chen, R.-J.; Yang, W. From upcycled waste polyethylene plastic to graphene/mesoporous carbon for high-voltage supercapacitors. J. Colloid Interface Sci. 2019, 557, 55–64. [Google Scholar] [CrossRef]
  24. Li, Z.; Chen, K.; Chen, Z.; Li, W.; Biney, B.W.; Guo, A.; Liu, D. Removal of malachite green dye from aqueous solution by adsorbents derived from polyurethane plastic waste. J. Environ. Chem. Eng. 2021, 9, 104704. [Google Scholar] [CrossRef]
  25. Wei, S.; Kamali, A.R. Waste plastic derived Co3Fe7/CoFe2O4@carbon magnetic nanostructures for efficient dye adsorption. J. Alloys Compd. 2021, 886, 161201. [Google Scholar] [CrossRef]
  26. Parra-Marfíl, A.; Ocampo-Pérez, R.; Collins-Martínez, V.H.; Flores-Vélez, L.M.; Gonzalez-Garcia, R.; Medellín-Castillo, N.A.; Labrada-Delgado, G.J. Synthesis and characterization of hydrochar from industrial Capsicum annuum seeds and its application for the adsorptive removal of methylene blue from water. Environ. Res. 2020, 184, 109334. [Google Scholar] [CrossRef]
  27. Noraini, M.; Abdullah, E.; Othman, R.; Mubarak, N. Single-route synthesis of magnetic biochar from sugarcane bagasse by microwave-assisted pyrolysis. Mater. Lett. 2016, 184, 315–319. [Google Scholar] [CrossRef]
  28. Vyavahare, G.D.; Gurav, R.G.; Jadhav, P.P.; Patil, R.R.; Aware, C.B.; Jadhav, J.P. Response surface methodology optimization for sorption of malachite green dye on sugarcane bagasse biochar and evaluating the residual dye for phyto and cytogenotoxicity. Chemosphere 2018, 194, 306–315. [Google Scholar] [CrossRef]
  29. Jonathan, M.K.; Osamong, G.A.; Butembu, S.; Kamweru, P.K.; Gichumbi, J.M.; Ndiritu, F.G. Structural properties of high density polyethylene matrix composites reinforced with open air and furnace rice husks ash. J. Chem. Eng. Mater. Sci. 2021, 12, 73–84. [Google Scholar]
  30. Dogan, O.M.; Kayacan, I. Pyrolysis of Low and High Density Polyethylene. Part II: Analysis of Liquid Products Using FTIR and NMR Spectroscopy. Energy Sources Part A Recover. Util. Environ. Eff. 2008, 30, 392–400. [Google Scholar] [CrossRef]
  31. Li, Y.; Meas, A.; Shan, S.; Yang, R.; Gai, X. Production and optimization of bamboo hydrochars for adsorption of Congo red and 2-naphthol. Bioresour. Technol. 2016, 207, 379–386. [Google Scholar] [CrossRef]
  32. Islam, A.; Ahmed, M.; Khanday, W.; Asif, M.; Hameed, B. Mesoporous activated carbon prepared from NaOH activation of rattan (Lacosperma secundiflorum) hydrochar for methylene blue removal. Ecotoxicol. Environ. Saf. 2017, 138, 279–285. [Google Scholar] [CrossRef]
  33. Li, F.; Zimmerman, A.R.; Hu, X.; Yu, Z.; Huang, J.; Gao, B. One-pot synthesis and characterization of engineered hydrochar by hydrothermal carbonization of biomass with ZnCl2. Chemosphere 2020, 254, 126866. [Google Scholar] [CrossRef] [PubMed]
  34. Maheswari, C.U.; Reddy, K.O.; Muzenda, E.; Shukla, M.; Rajulu, A.V. A Comparative Study of Modified and Unmodified High-Density Polyethylene/Borassus Fiber Composites. Int. J. Polym. Anal. Charact. 2013, 18, 439–450. [Google Scholar] [CrossRef]
  35. Murthy, T.K.; Gowrishankar, B.; Krishna, R.H.; Chandraprabha, M.; Mathew, B.B. Magnetic modification of coffee husk hydrochar for adsorptive removal of methylene blue: Isotherms, kinetics and thermodynamic studies. Environ. Chem. Ecotoxicol. 2020, 2, 205–212. [Google Scholar] [CrossRef]
  36. Liu, J.-L.; Qian, W.-C.; Guo, J.-Z.; Shen, Y.; Li, B. Selective removal of anionic and cationic dyes by magnetic Fe3O4-loaded amine-modified hydrochar. Bioresour. Technol. 2021, 320, 124374. [Google Scholar] [CrossRef]
  37. Saqib, N.U.; Baroutian, S.; Sarmah, A.K. Physicochemical, structural and combustion characterization of food waste hydrochar obtained by hydrothermal carbonization. Bioresour. Technol. 2018, 266, 357–363. [Google Scholar] [CrossRef] [PubMed]
  38. Bashir, S.; Rehman, M.; Yousaf, M.; Salam, A.; Gulshan, A.B.; Iqbal, J.; Aziz, I.; Azeem, M.; Rukh, S.; Asghar, R.M.A. Comparative efficiency of wheat straw and sugarcane bagasse biochar reduces the cadmium bioavailability to spinach and enhances the microbial activity in contaminated soil. Int. J. Phytoremediation 2019, 21, 1098–1103. [Google Scholar] [CrossRef]
  39. Liu, Y.; Zhao, X.; Li, J.; Ma, D.; Han, R. Characterization of bio-char from pyrolysis of wheat straw and its evaluation on methylene blue adsorption. Desalination Water Treat. 2012, 46, 115–123. [Google Scholar] [CrossRef]
  40. Alateyah, A.I. High-Density Polyethylene Based on Exfoliated Graphite Nanoplatelets/Nano-Magnesium Oxide: An Investigation of Thermal Properties and Morphology. Mater. Sci. Appl. 2019, 10, 159–169. [Google Scholar] [CrossRef] [Green Version]
  41. Irawan, C.; Putra, M.D.; Wijayanti, H.; Juwita, R.; Meliana, Y.; Nata, I.F. The Amine Functionalized Sugarcane Bagasse Biocomposites as Magnetically Adsorbent for Contaminants Removal in Aqueous Solution. Molecules 2021, 26, 5867. [Google Scholar] [CrossRef]
  42. Alsaygh, A.A.; Al-Hamidi, J.; Alsewailem, F.D.; Al-Najjar, I.M.; Kuznetsov, V.L. Characterization of polyethylene synthesized by zirconium single site catalysts. Appl. Petrochem. Res. 2014, 4, 79–84. [Google Scholar] [CrossRef] [Green Version]
  43. Saafie, N.; Samsudin, M.F.R.; Sufian, S.; Ramli, R.M. Enhancement of the activated carbon over methylene blue removal efficiency via alkali-acid treatment. AIP Conf. Proc. 2019, 2124, 020046. [Google Scholar] [CrossRef]
  44. Behazin, E.; Ogunsona, E.; Rodriguez-Uribe, A.; Mohanty, A.K.; Misra, M.; Anyia, A.O. Mechanical, Chemical, and Physical Properties of Wood and Perennial Grass Biochars for Possible Composite Application. Bioresources 2016, 11, 1334–1348. [Google Scholar] [CrossRef]
  45. Song, X.; Xu, R.; Wang, K. High capacity adsorption of malachite green in a mesoporous tyre-derived activated carbon. Asia-Pacific J. Chem. Eng. 2013, 8, 172–177. [Google Scholar] [CrossRef]
  46. Kaur, J.; Sarma, A.K.; Jha, M.K.; Gera, P. Rib shaped carbon catalyst derived from Zea mays L. cob for ketalization of glycerol. RSC Adv. 2020, 10, 43334–43342. [Google Scholar] [CrossRef]
  47. Hossain, Z.; Wu, W.; Xu, W.Z.; Chowdhury, M.B.I.; Jhawar, A.K.; Machin, D.; Charpentier, P.A. High-Surface-Area Mesoporous Activated Carbon from Hemp Bast Fiber Using Hydrothermal Processing. C 2018, 4, 38. [Google Scholar] [CrossRef] [Green Version]
  48. Li, Y.; Zimmerman, A.R.; He, F.; Chen, J.; Han, L.; Chen, H.; Hu, X.; Gao, B. Solvent-free synthesis of magnetic biochar and activated carbon through ball-mill extrusion with Fe3O4 nanoparticles for enhancing adsorption of methylene blue. Sci. Total. Environ. 2020, 722, 137972. [Google Scholar] [CrossRef]
  49. Liu, X.-J.; Li, M.-F.; Singh, S.K. Manganese-modified lignin biochar as adsorbent for removal of methylene blue. J. Mater. Res. Technol. 2021, 12, 1434–1445. [Google Scholar] [CrossRef]
  50. Cai, T.; Liu, X.; Zhang, J.; Tie, B.; Lei, M.; Wei, X.; Peng, O.; Du, H. Silicate-modified oiltea camellia shell-derived biochar: A novel and cost-effective sorbent for cadmium removal. J. Clean. Prod. 2021, 281, 125390. [Google Scholar] [CrossRef]
  51. Zeng, S.; Feng, W.; Peng, S.; Teng, Z.; Chen, C.; Zhang, H.; Peng, S. Dual-functional SiOC ceramics coating modified carbon fibers with enhanced microwave absorption performance. RSC Adv. 2019, 9, 30685–30692. [Google Scholar] [CrossRef] [PubMed] [Green Version]
  52. Meškinis, Š.; Vasiliauskas, A.; Andrulevičius, M.; Peckus, D.; Tamulevičius, S.; Viskontas, K. Diamond Like Carbon Films Containing Si: Structure and Nonlinear Optical Properties. Materials 2020, 13, 1003. [Google Scholar] [CrossRef] [PubMed] [Green Version]
  53. Ekmen, E.; Bilici, M.; Turan, E.; Tamer, U.; Zengin, A. Surface molecularly-imprinted magnetic nanoparticles coupled with SERS sensing platform for selective detection of malachite green. Sens. Actuators B Chem. 2020, 325, 128787. [Google Scholar] [CrossRef]
  54. Geçgel, Ü.; Üner, O.; Gökara, G.; Bayrak, Y. Adsorption of cationic dyes on activated carbon obtained from waste Elaeagnus stone. Adsorpt. Sci. Technol. 2016, 34, 512–525. [Google Scholar] [CrossRef] [Green Version]
  55. Chinthalapudi, N.; Kommaraju, V.V.D.; Kannan, M.K.; Nalluri, C.B.; Varanasi, S. Composites of cellulose nanofibers and silver nanoparticles for malachite green dye removal from water. Carbohydr. Polym. Technol. Appl. 2021, 2, 100098. [Google Scholar] [CrossRef]
  56. Sarkar, S.; Tiwari, N.; Basu, A.; Behera, M.; Das, B.; Chakrabortty, S.; Sanjay, K.; Suar, M.; Adhya, T.K.; Banerjee, S.; et al. Sorptive removal of malachite green from aqueous solution by magnetite/coir pith supported sodium alginate beads: Kinetics, isotherms, thermodynamics and parametric optimization. Environ. Technol. Innov. 2021, 24, 101818. [Google Scholar] [CrossRef]
  57. Sahraei, R.; Hemmati, K.; Ghaemy, M. Adsorptive removal of toxic metals and cationic dyes by magnetic adsorbent based on functionalized graphene oxide from water. RSC Adv. 2016, 6, 72487–72499. [Google Scholar] [CrossRef]
  58. Sudhakaran, A.; Rajan, R.; Ravindranath, A. Characterization and Application of Biochar from spent fermentation sludge of coir wastes in removing Malachite green from effluent water. Pollution 2022, 8, 1026–1037. [Google Scholar] [CrossRef]
  59. Nath, J.; Ray, L. Biosorption of Malachite green from aqueous solution by dry cells of Bacillus cereus M116 (MTCC 5521). J. Environ. Chem. Eng. 2015, 3, 386–394. [Google Scholar] [CrossRef]
  60. Vigneshwaran, S.; Sirajudheen, P.; Karthikeyan, P.; Meenakshi, S. Fabrication of sulfur-doped biochar derived from tapioca peel waste with superior adsorption performance for the removal of Malachite green and Rhodamine B dyes. Surf. Interfaces 2021, 23, 100920. [Google Scholar] [CrossRef]
  61. Ganguly, P.; Sarkhel, R.; Das, P. Synthesis of pyrolyzed biochar and its application for dye removal: Batch, kinetic and isotherm with linear and non-linear mathematical analysis. Surf. Interfaces 2020, 20, 100616. [Google Scholar] [CrossRef]
  62. Rout, D.R.; Jena, H.M. Removal of malachite green dye from aqueous solution using reduced graphene oxide as an adsorbent. Mater. Today Proc. 2021, 47, 1173–1182. [Google Scholar] [CrossRef]
  63. Wallis, A.; Dollard, M.F. Local and global factors in work stress—The Australian dairy farming exemplar. Scand. J. Work. Environ. Health Suppl. 2008, 34, 66–74. [Google Scholar]
  64. Freundlich, H. Über die Adsorption in Lösungen. Zeitschrift Phys. Chemie 1907, 57U, 385–470. [Google Scholar] [CrossRef]
  65. Dubinin, M.M. The Equation of the Characteristic Curve of Activated Charcoal. Proc. Acad. Sci. Phys. Chem. Sect. 1947, 55, 331. [Google Scholar]
  66. Mahmoud, M.E.; Fekry, N.A.; Abdelfattah, A.M. Novel supramolecular network of graphene quantum dots-vitamin B9-iron (III)-tannic acid complex for removal of chromium (VI) and malachite green. J. Mol. Liq. 2021, 341, 117312. [Google Scholar] [CrossRef]
  67. Jain, S.N.; Shaikh, Z.; Mane, V.S.; Vishnoi, S.; Mawal, V.N.; Patel, O.R.; Bhandari, P.S.; Gaikwad, M.S. Nonlinear regression approach for acid dye remediation using activated adsorbent: Kinetic, isotherm, thermodynamic and reusability studies. Microchem. J. 2019, 148, 605–615. [Google Scholar] [CrossRef]
  68. Ma, P.; Ma, M.; Wu, J.; Qian, Y.; Wu, D.; Zhang, X. The effect of plastic on performance of activated carbon and study on adsorption of methylene blue. J. Mater. Res. 2019, 34, 3040–3049. [Google Scholar] [CrossRef] [Green Version]
  69. Lagergren, S. About the theory of so-called adsorption of soluble substances. Handlingar 1898, 24, 1–39. [Google Scholar]
  70. Chien, S.H.; Clayton, W.R. The catalytic oxidation of carbon monoxide on manganese dioxide. Sci. Soc. Am. J. 1980, 44, 265–268. [Google Scholar] [CrossRef]
  71. Ayad, M.M.; Amer, W.A.; Zaghlol, S.; Minisy, I.M.; Bober, P.; Stejskal, J. Polypyrrole-coated cotton textile as adsorbent of methylene blue dye. Chem. Pap. 2018, 72, 1605–1618. [Google Scholar] [CrossRef]
  72. Dinh, V.-P.; Huynh, T.-D.; Le, H.M.; Nguyen, V.-D.; Dao, V.-A.; Hung, N.Q.; Tuyen, L.A.; Lee, S.; Yi, J.; Nguyen, T.D.; et al. Insight into the adsorption mechanisms of methylene blue and chromium(iii) from aqueous solution onto pomelo fruit peel. RSC Adv. 2019, 9, 25847–25860. [Google Scholar] [CrossRef] [PubMed] [Green Version]
Figure 1. FT-IR spectrum of pristine and MG saturated SBPE (a), and SBPEAC (b) composites, XRD pattern of composites (c), N2 adsorption/desorption isotherm of SBPEAC composite, Inset: Pore size distribution curve (d).
Nanomaterials 13 01193 g001
Figure 2. Full scan XPS survey spectra of pristine and MG saturated SBPE (a) and SBPEAC composites (b).
Nanomaterials 13 01193 g002
Figure 3. Deconvoluted high-resolution XPS spectra of C1s (a), O1s (b), and Si2p (c) for the SBPEAC composite.
Nanomaterials 13 01193 g003
Figure 4. Selectivity study plot of SBPE and SBPEAC composites (a), Effect of pH (b), Zeta potential (c), Contact time (d), Initial MG concentration on MG adsorption onto SBPE (e), and SBPEAC composites (f).
Nanomaterials 13 01193 g004
Figure 5. Adsorption mechanism of MG onto SBPEAC composite.
Nanomaterials 13 01193 g005
Table 1. Element contents of the pristine and MG-loaded adsorbent samples determined by XPS analysis.
SampleAtomic %
C1sN1sO1sS2pK2pCa2pSi2p
SBPE72.091.4926.420.15000
SBPEAC82.330.3914.230.211.220.731.11
SBPE/MG74.351.7723.880.09---
SBPEAC/MG85.244.989.340.07-0.44-
Table 2. Non-linear isotherm model parameters for MG adsorption on adsorbent samples at varied temperature.
SampleTemp.
(K)
qe,exp.
(mg/g)
Isotherm Models
LangmuirFreundlichDR
qm
(mg/g)
KL
(L/mg)
RLR2KF
(mg/g)(L/mg)1/n
nR2qs
(mmol/g)
KDR
(mol2/kJ2)
E
(kJ/mol)
R2
SBPE298231.5291.10.06880.4200.974862.073.100.93430.64739.740.1130.9970
308268.4339.60.06810.4230.974168.312.960.93120.744234.540.1200.9956
318296.3375.60.07180.4110.970676.662.960.92490.825130.150.1290.9969
SBPEAC298810.8905.60.45270.0990.9949340.673.110.92462.0630.9470.7270.9591
308840.5909.70.88980.0530.9983424.243.640.92722.1120.3871.1370.9380
318872.7928.61.59200.0300.9791500.664.080.94882.2570.2701.3600.9072
Table 3. Non-linear kinetic model parameters for MG adsorption on adsorbent samples.
Sampleqe,exp.
(mg/g)
Kinetic Models
Pseudo-First OrderPseudo-Second-OrderElovich
qe1, cal.
(mg/g)
K1
(1/min)
R2qe2, cal.
(mg/g)
K2
(g/mg-min)
R2α
(mg/g-min)
β
(mg/g)
R2
SBPE42.3143.170.01070.559441.950.001060.834712.330.17320.9584
SBPEAC188.17185.390.01160.9933215.760.000060.99834.450.01960.9905
Table 4. Thermodynamic parameters for MG adsorption on adsorbent samples.
SampleCo
(mg/L)
ΔH°
(kJ/mol)
ΔS°
(J/mol-K)
ΔG°
(kJ/mol)
298 K308 K318 K
SBPE2011.9459.34−5.73−6.35−6.92
4015.4969.91−5.34−6.03−6.74
6015.5167.03−4.45−5.18−5.79
SBPEAC2083.51326.48−13.94−16.70−20.49
4041.29184.40−13.64−15.52−17.33
6040.65179.29−12.77−14.57−16.36
Disclaimer/Publisher’s Note: The statements, opinions and data contained in all publications are solely those of the individual author(s) and contributor(s) and not of MDPI and/or the editor(s). MDPI and/or the editor(s) disclaim responsibility for any injury to people or property resulting from any ideas, methods, instructions or products referred to in the content.

