1. Introduction
Photochromic materials can change color and electrical properties when exposed to specific wavelengths of light, which is a reversible process [
1]. They have a wide range of applications in many fields, such as optical transistors, smart windows, optoelectronic sensors, optical storage, etc. [
2,
3,
4,
5]. Commonly used photochromic materials can be divided into organic and inorganic materials. Most photochromic materials are organic and exhibit narrow spectral absorption bands together with fast switching behavior. However, due to limited stability vs. oxygen, humidity, and heat, as well as ultra-violet (UV) irradiation-induced fatigue, complex processing is often required to tailor the photochromic response and enhance the product’s lifetime. In practical applications, considering the long-term strong light irradiation service weathering resistance and the stability of the preparation process, inorganic photochromic materials are considered to be more promising in this field and have become a new research hotspot.
As a new type of inorganic photochromic material, rare-earth oxyhydride (ReO
xH
y) films, based on their effective and reversible optical change characteristics and stable and repeatable preparation technique, have demonstrated tremendous potential for application. Using magnetron sputtering, Mongstad et al. 2011 prepared yttrium oxyhydride films. These films demonstrated noticeably reduced transmittance and resistance when exposed to UV lamp irradiation [
6]. There has been a great effort in recent times to study the structural [
7], compositional [
8], surface [
9], electrical [
10], and optical properties [
11,
12] of ReO
xH
y films. Nafezarefi et al. studied the lanthanide Gd, Dy, and Er and found that they had similar photochromic properties to yttrium oxyhydride films. While these ReO
xH
y films have similar cell structures, there are significant differences between the optical contrast and photochromic kinetics [
13]. Colombi et al. selected Sc, Y, and Gd, which have a large difference in ionic radius, for their study and found that as the cation radius increased, their lattice constants became larger, and the photochromic contrast was more pronounced, which may be due to the larger lattice reducing the activation barriers for site hopping [
14].
To analyze the role of anions in the films, Moldarev made a quantitative analysis of the relationship between the composition of the films and the photochromic properties using TOF-E ERDA, showing that oxidation causes hydrogen to be released [
15]. Moreover, as the O/H ratio increases, the photochromic properties decrease, and the bleaching rate increases [
10]. To precisely control the O/H ratio and achieve controlled doping of oxygen, Montero successively sputtered YO
xH
y films and Al films used as top protection [
16]. Other studies have also mostly used post-oxidation methods to prepare ReO
xH
y films. However, due to the limitations of film thickness and surface porosity, there will be some differences between the surface and internal composition of the samples, which affect the overall photochromic properties. This problem can be effectively avoided by directly preparing transparent ReO
xH
y films through the rational adjustment of argon and hydrogen ratios to achieve precise adjustment of O and H contents.
The suggestions for the chemical formula for the ReO
xH
y are still contradictory: Pishtshev suggested the formula YH
3−2xO
x for yttrium oxyhydride [
17]. Colombi has been extended for rare earth metal oxyhydrides as ReO
xH
3−2x [
14]. Based on neutron diffraction and synchrotron analysis, the yttrium oxyhydride films are suggested to fit best to YH
2−xO
x [
18].
Since oxygen is much more electronegative than hydrogen, with a dissociation energy of 7.4 eV for Y–O bonds and 3.5 eV for Y–H bonds [
17], the process of oxygen doping into the lattice is unstoppable. As Pishtshev showed by calculations that as the O/H ratio continues to increase, the enthalpy of YO
xH
y increases, thermodynamic stability decreases, and photochromic properties are lost [
19]. Chaykina. et al. enhanced the stability of NdO
xH
y by adding an alumina protective layer via ALD (atomic layer deposition), but the surface encapsulation layer enhanced the bleaching kinetics of the films [
20]. Lu et al. improved the generation energy of nanocrystals by doping Sr into CsPbI
3 nanocrystals, replacing Pb to cause a slight lattice shrinkage, and the environmental stability was enhanced [
21,
22,
23]. These give us an insight into the stability enhancement and advancing optical functionality of the oxyhydride films by partially substituting the cation with another one. The lattice constant can thus be adjusted, which might provide the key to improving the environmental stability of the films.
In the present study, we have attempted to improve the properties of ReOxHy films by modulating the lattice constant through rare earth cation alloying. Using Gd as the object of study, we prepare Re(Gd, Y) OxHy (the stoichiometric ratio is Gd1−zYzOxHy) thin films directly in one step by reactive magnetron sputtering without the need for a post-oxidation process. The trace oxygen is possibly from the gas sources, even though the nominal purity is 99.99%. Furthermore, we find that the photochromic properties of the films improve as the lattice constant increases, and the oxidation resistance improves as the lattice constant decreases while expanding the preparation window and improving the preparation stability. However, the lattice shrinkage has certain limitations, and when the Cr atoms are doped and the lattice is overly compressed, the band gap of the film is further reduced, and the photochromic properties are lost.
2. Materials and Methods
Gd
1−zY
zO
xH
y films were prepared on a quartz substrate with a direct current (DC) magnetron sputtering. Gd (purity 99.9%, 2-in. diameter), Y (purity 99.9%, 2-in. diameter), Ti (purity 99.9%, 2-in. diameter), Cr (purity 99.9%, 2-in. diameter) metal targets were set in the deposition chamber. The Gd
1−zY
zO
xH
y films were deposited using a DC magnetron sputtering at room temperature (RT) in an atmosphere of Ar (purity 4 N) and H
2 (4 N). The target discharge powers were varied in the range of P
Gd = (0–120) W and P
Y = (0–100) W ratio to maintain a constant total flux of metal atoms while changing the Y content in the films from z = 0 to 1. The Y/(Gd + Y) fraction, z, was calculated based on the Gd and Y discharge power. X-ray photoelectron spectra (XPS) were implemented to determine the actual ratio of Y doping. For the samples with Y/(Gd + Y) ratios of 0.15, 0.25, 0.35, 0.4, 0.5, and 0.7 used in the synthesis, the actual atomic ratios of Gd/Y in the films were estimated to be 0.18, 0.28, 0.33, 0.41, 0.46, and 0.67, respectively (
Figure S1). The power and content of Cr and Ti were derived from the Y-atomic ratio. The base pressure of the deposition chamber was less than 5.0 × 10
−4 Pa, and the working pressure during deposition was maintained at 0.46 Pa by controlling the mass flow of Ar/H
2 (4:1). Ar and H
2 are fed directly, the oxygen we believe comes from an impure argon source or chamber. By adjusting the deposition time, the thickness of all films was around 300 nm, which was determined using an SEM cross-section.
The optical transmittance spectra were measured at 350–2600 nm using an optical spectrophotometer (U-4100, Hitachi High Technologies, Tokyo, Japan). Illumination was performed with a Xe lamp (PLS-SXE 300(UV), PerfectLight, 50 W). Phase identification of films deposited on the quartz glass was performed using X-ray diffraction conducted on a Rigaku Ultima IV diffractometer with Cu Kα radiation (λ = 1.5418 Å) using a 2θ scanning model. The morphology and thickness of the films were measured with a scanning electron microscope (SEM, Hitachi SU8220, Tokyo, Japan) and an atomic force microscope (AFM, SII Nano Technology Ltd., Nanonavi P, Shanghai, China). XPS (ESCA Lab 250, Thermo Fisher Scientific Co. Inc., Waltham, MA, USA) was used to analyze the chemical states of the film. All binding energies were referenced to the C 1s peak (284.8 eV) of adventitious carbon.
3. Results
The ReO
xH
y films can respond to different light intensities and change the transmittance of different magnitudes. Physical photographs of the samples before and after the response are shown in
Figure S2c. The initial state is yellow and transparent due to inter-band excitation, while changes in optical density occur during the course of illumination, and no color change occurs [
6]. The crystal structure of the ReO
xH
y film is that the cations form an fcc skeleton, with the H ions exhibiting –1 valence and the O ions being −2 valence, occupying tetrahedral and octahedral positions in a disordered manner, and the mechanism of photochromism is thought to be related to anion migration [
24]. Using NMR, previous studies have demonstrated that the signal of the class of H ions with the highest mobility disappears under illumination, and Shao et al. have proposed a conjecture of “dihydrogen” through the real-time time-dependent density functional theory (RT-TDDFT) method [
25,
26]. We present a schematic diagram of the photochromic mechanism of ReO
xH
y in
Figure S2b, in which two hydrogen ions at different locations are excited using photon energy to form dihydrogen defects [
25], leading to a decrease in the transmittance of the film.
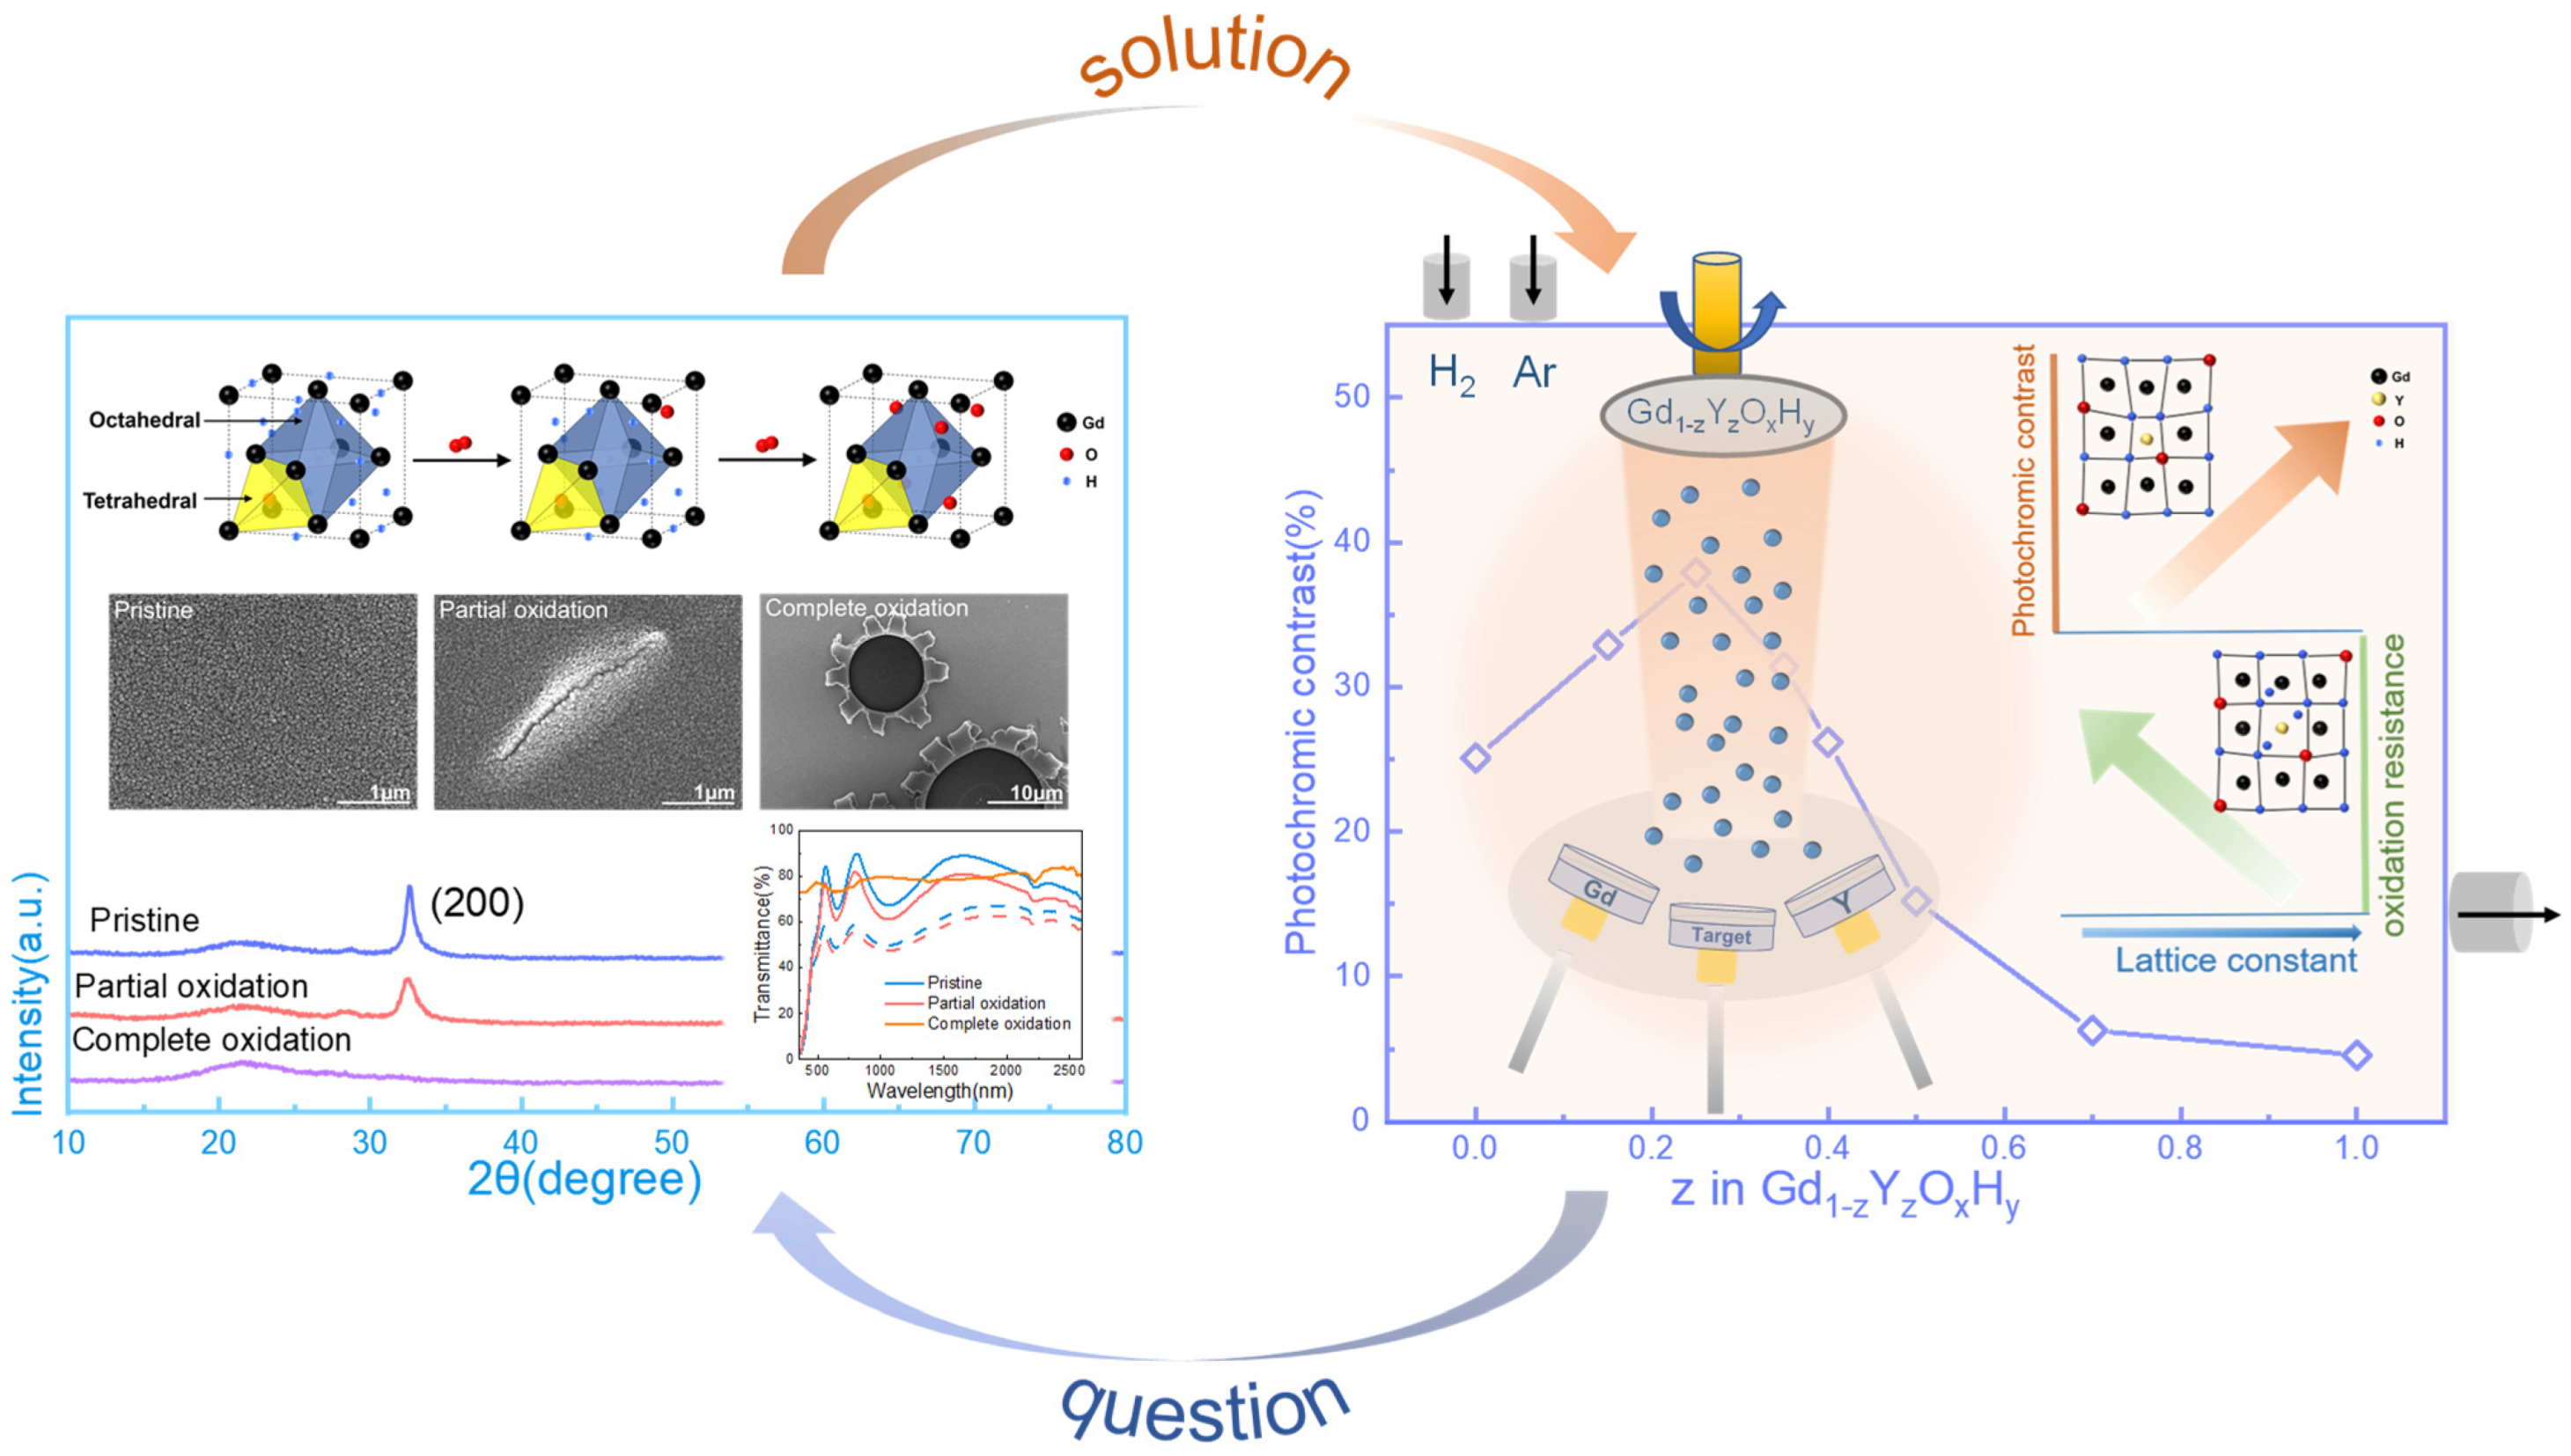
Oxidation processes inevitably occur when the films are left in air. In the report, it is mentioned that for YO
xH
y film, the stoichiometric ratio of the sample with better photochromic properties is Y
4H
10O, and in the schematic, we also refer to this stoichiometry [
19]. When the sample is prepared directly for storage in air, oxygen will continue to enter the lattice, displacing hydrogen into tetrahedral positions, and some of the hydrogen ions will move to octahedral positions or be released. Further, the light will aid this process. This can be found in the X-ray diffraction patterns in
Figure S2a, where the strongest diffraction peak of the film (200) is shifted towards a lower angle as the number of illuminations increases, and lattice expansion occurs, indicating the doping of oxygen.
Furthermore, as the tetrahedral positions continue to be occupied, the photochromic properties decrease. Eventually, the film becomes an amorphous oxide. This is also seen in the spectrum and XRD patterns of
Figure 1, where the maximum optical contrast decreases as the partial oxidation occurs and the intensity of the diffraction peaks of the film gradually decreases, and eventually, the diffraction peaks disappear. The SEM images in
Figure 1 show how the film’s surface changes after oxidation. We can see the degree of oxidation from the change in the film’s morphology. The method is shown in
Figure 1, right. By adjusting the argon and hydrogen atmosphere, the Re(Gd, Y)O
xH
y film is prepared in one step, and the sputtering power of Y and Gd is adjusted to achieve a gradient of Y and Gd content to achieve different lattice constants.
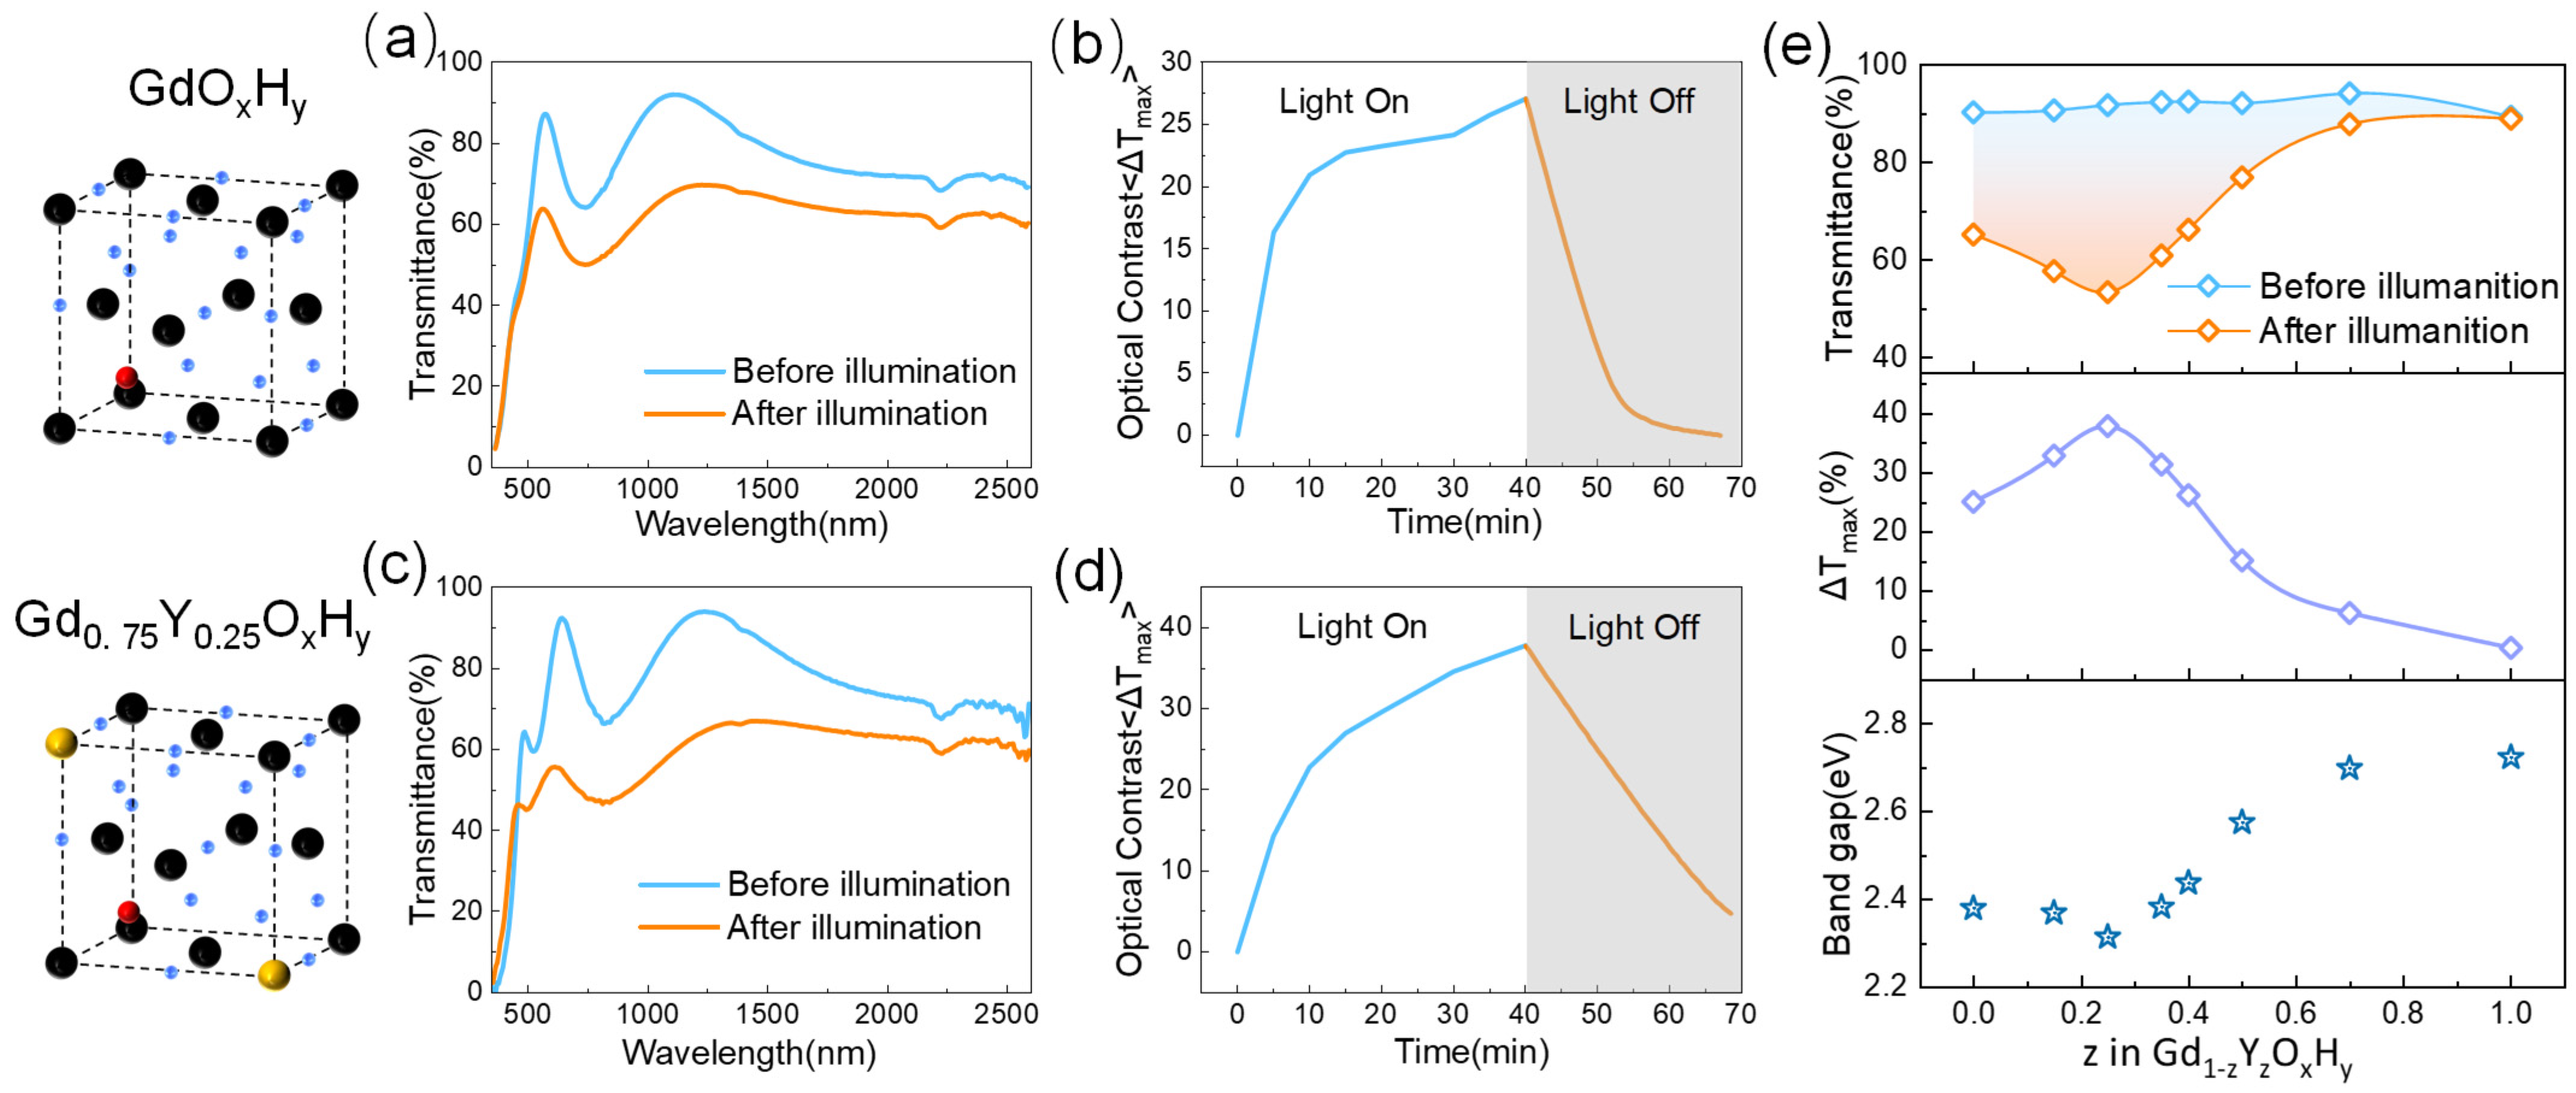
Figure 2 shows the cell structure spectra, time-based photodarkening, and bleaching curves of the GdO
xH
y and Gd
0.75Y
0.25O
xH
y obtained by co-sputtering. The EDS elemental mapping images in
Figure S3 show that the co-sputtering prepared a single phase of uniform composition. We define the maximum optical contrast ΔT as the initial transmittance minus the transmittance after illumination, ΔT = T
0 − T
t. For the GdO
xH
y films, the transmittance curves before and after illumination are shown in
Figure 2a. After illumination, a significant decrease in transmittance occurs from the visible to the NIR band, with a maximum decrease of up to 27%.
As can be seen in
Figure 2b, at 10 min of light, ΔT has reached 70% of the maximum rate of change, and the transmittance quickly returns to its initial state after cessation of illumination.
Figure 2d shows the transmittance spectra of Gd
0.75Y
0.25O
xH
y with 25% Y content after 30 min of light exposure, has a maximum optical contrast improvement of 37.1% (ΔT ≈ 37%), and has good response performance, returning over 80% within half an hour.
Figure S4 shows the maximum optical contrast and the corresponding wavelength transmittance changes after nine cycles for the Gd
0.75Y
0.25O
xH
y. Although the initial rate of change in the Gd
0.75Y
0.25O
xH
y is large, the photochromic properties of the films show a decreasing trend as the number of cycles increases.
Figure 2e shows the photochromic properties of the films with different Gd and Y contents. In the first row of
Figure 2e, we can see that the maximum transmittance of the films remains essentially constant as the amount of Y sputtered increases, and the color of the films changes somewhat, as can be seen in
Figure S5a, corresponding to the position of the absorption edge on the spectrum that gradually shifts with increasing amounts of Y sputtered. In the second row of
Figure 2e, we give the maximum optical contrast data taken from the wavelength with the highest photochromic contrast for the amount of Y sputtered, showing the best optical properties when the amount of Y sputtered is 25%, with the photochromic properties gradually decreasing as the Y content continues to increase. In the chemical formula YH
2-xO
x proposed by Moldarev, yttrium oxyhydride exhibits photochromic behavior in the range 0.45 < δ < 1.5. The strength of the photochromic response is found to decrease with increasing oxygen concentration in the film [
8]. The poor photochromic performance of YO
xH
y at a preparation pressure of Ar/H
2 (40:10) is probably due to the increased oxygen content in the sample at the higher pressure during the preparation process.
The XRD patterns In
Figure 3a show that at a sputtering pressure of 0.46 Pa, co-doping of Y gradually causes the (111) lattice plane to disappear and the intensity of the (200) lattice plane to decrease gradually. This change in peak level may be indicative of a progressively changing meritocratic orientation of the film, which has been mentioned in previous studies [
27].
Figure 3b shows that the lattice constant tends to increase and then decrease as the amount of Y content increases when the lattice constant is maximum, corresponding to the sample with the best optical contrast. Dam et al. compared three rare earth elements with different ionic radii, Gd, Y, and Sc, and found that the larger the ionic radius, the higher the photochromic contrast of the sample, presumably due to the larger lattice helping the anion leap. This interesting phenomenon is also found in our experiments, where the ionic radius of Gd
3+ is 93.5 pm and Y
3+ 90 pm. Thus, the tendency for the lattice constant to increase at a lower Y content may be explained by the small difference in the lattice constants of 5.43 Å and 5.32 Å near the critical pressure due to the co-doping of Y reducing the formation energy of the interstitial hydrogen. Moreover, lattice expansion is due to increased hydrogen ions in the interstitial space. We also observe a minimum from the band gap, which laterally accounts for the increase in hydrogen. Tian et al. [
28] doped SnS
2 with Ag and Cu of different ionic radii and found that after doping, significant cell expansion was produced, and the number of reactive sites increased, resulting in improved piezoelectric properties. In addition to lattice expansion favoring ion leap when the lattice constant is increased, more interstitial hydrogen atoms are doped into the cell during preparation, and the increased number of ions involved in the reaction may also be a reason for the better photochromic properties. The grain size graph in
Figure 3b shows a trend where the grain size increases as the Y content increases. During the growth of the film, an island growth pattern is generally adopted, and as the deposition time increases, these first formed islands continue to receive new deposited atoms, gradually forming a continuous film, allowing the surface energy to be minimized. For polycrystalline films, the free energy is reduced by reducing the grain boundary area. This creates an intrinsic drive to reduce the grain boundary area with grain growth, which in turn reduces defects at the grain boundaries [
29]. Hans et al. have observed the enrichment of oxygen at the grain boundaries with large residual stresses [
30]. Thus, the increase in Y content leads to grain growth and reduces grain boundaries to reduce the pathway of oxygen incorporation and enhance the oxidation resistance. This phenomenon may be due to the different deposited atomic mobility of Y and Gd. Additionally, the film growth is affected by substrate, defects, etc., resulting in a slight reduction in grain size for samples with a Y content of 0.15.
We analyze the XPS spectra of Y3d and Gd4d with different Y content (the four samples circled in
Figure 3). From top to bottom, the Y content gradually increases. It can be observed that the binding energy tends to decrease and then increase, which corresponds to an increase and then decrease in the lattice constant. The sample with the largest lattice constant in the second row shows a decrease in the Gd4d binding energy compared to the sample with a smaller lattice constant, and the difference in the Y3d binding energy is even more pronounced. This may be due to the lattice contraction caused by the introduction of smaller ionic radius elements by co-doping, resulting in a slight increase in the binding energy of Y and Gd, which contributes to the lattice stability [
22,
31].
The samples with the highest and lowest lattice constant are selected for the oxidation experiments.
Figure 4d–f shows the surface morphology of the GdO
xH
y, Gd
0.75Y
0.25O
xH
y, and Gd
0.3Y
0.7O
xH
y films after 100 days in air. The surface morphology of the Gd
0.3Y
0.7O
xH
y is found to be very good after 100 days, with no film deterioration and high oxidation resistance, while the GdO
xH
y and Gd
0.75Y
0.25O
xH
y films have severe surface deterioration and reduced densities over the same period. It indicates that the lattice shrinkage may have raised the potential barrier for oxygen doping and slowed down the oxygen doping process.
Figure 4a shows the photochromic properties of Gd
0.3Y
0.7O
xH
y films, with small variations, where the enhanced oxidation resistance is at the expense of photochromic properties.
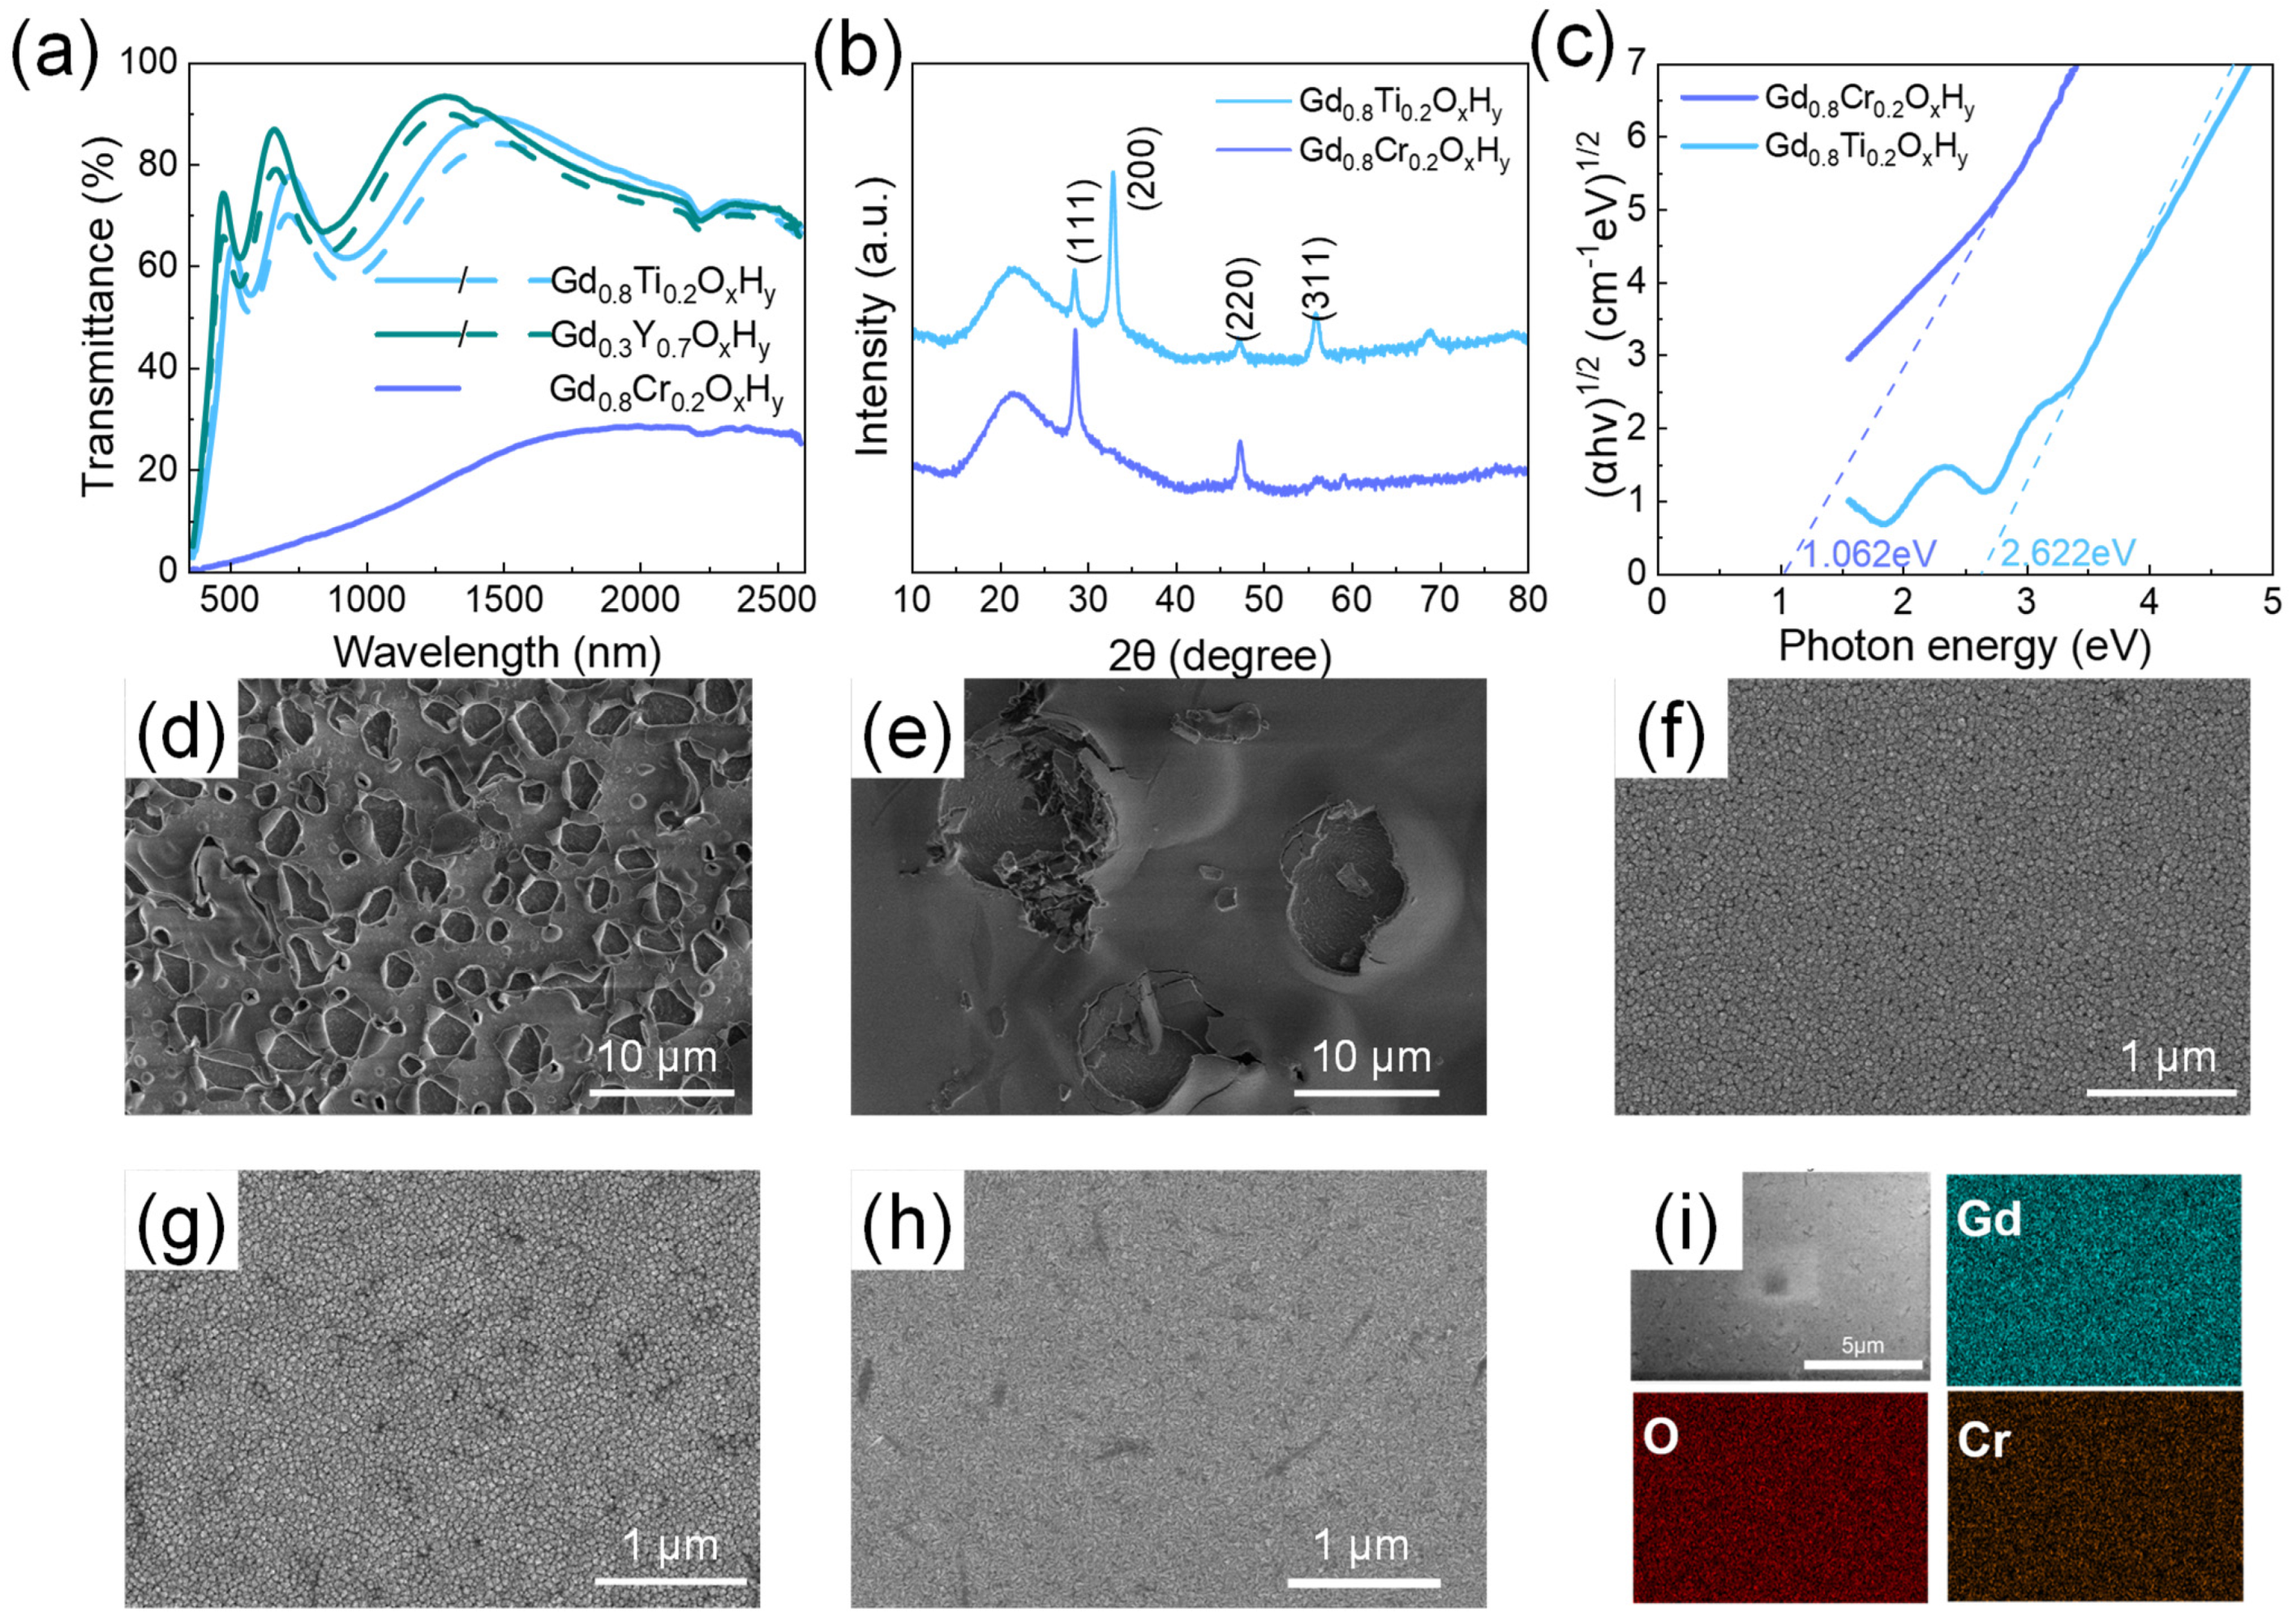
We also added the Ti and Cr; the ionic radius of each element is shown in
Table 1. The spectra of Gd
0.8Ti
0.2O
xH
y and Gd
0.8Cr
0.2O
xH
y are shown in
Figure 4a; the transmittance of Gd
0.8Ti
0.2O
xH
y in both visible and near-infrared regions is above 60%, with a small optical contrast. However, when Cr is doped to form the Gd
0.8Cr
0.2O
xH
y, the transmittance decreases significantly. Surface roughness calculations yielded 2.8 nm for the Gd
0.8Cr
0.2O
xH
y. The SEM images of its oxidation in air for 100 days are shown in
Figure 4g,h. There is no significant surface deterioration. These suggest that reducing the lattice constant has a role in reducing the oxidation of the sample, but there are limits to the choice of shrinkage lattice parameters. The XRD patterns in
Figure 4b show a significant increase in the intensity of the (111) lattice plane and the disappearance of the (200) lattice plane, which is more similar to the XRD patterns of GdH
2. The EDS elemental mapping images in
Figure 4i show that the films obtained with sputtering are homogeneous as a single phase, excluding the local presence of hydrides. The optical band gap in
Figure 4c shows a small band gap for the Gd
0.8Cr
0.2O
xH
y, which results in a transmittance of less than 20% in both the visible and NIR bands. This indicates that when the lattice shrinks excessively, the formation energy barrier for oxygen doping into the lattice is too high to form transparent ReO
xH
y films.
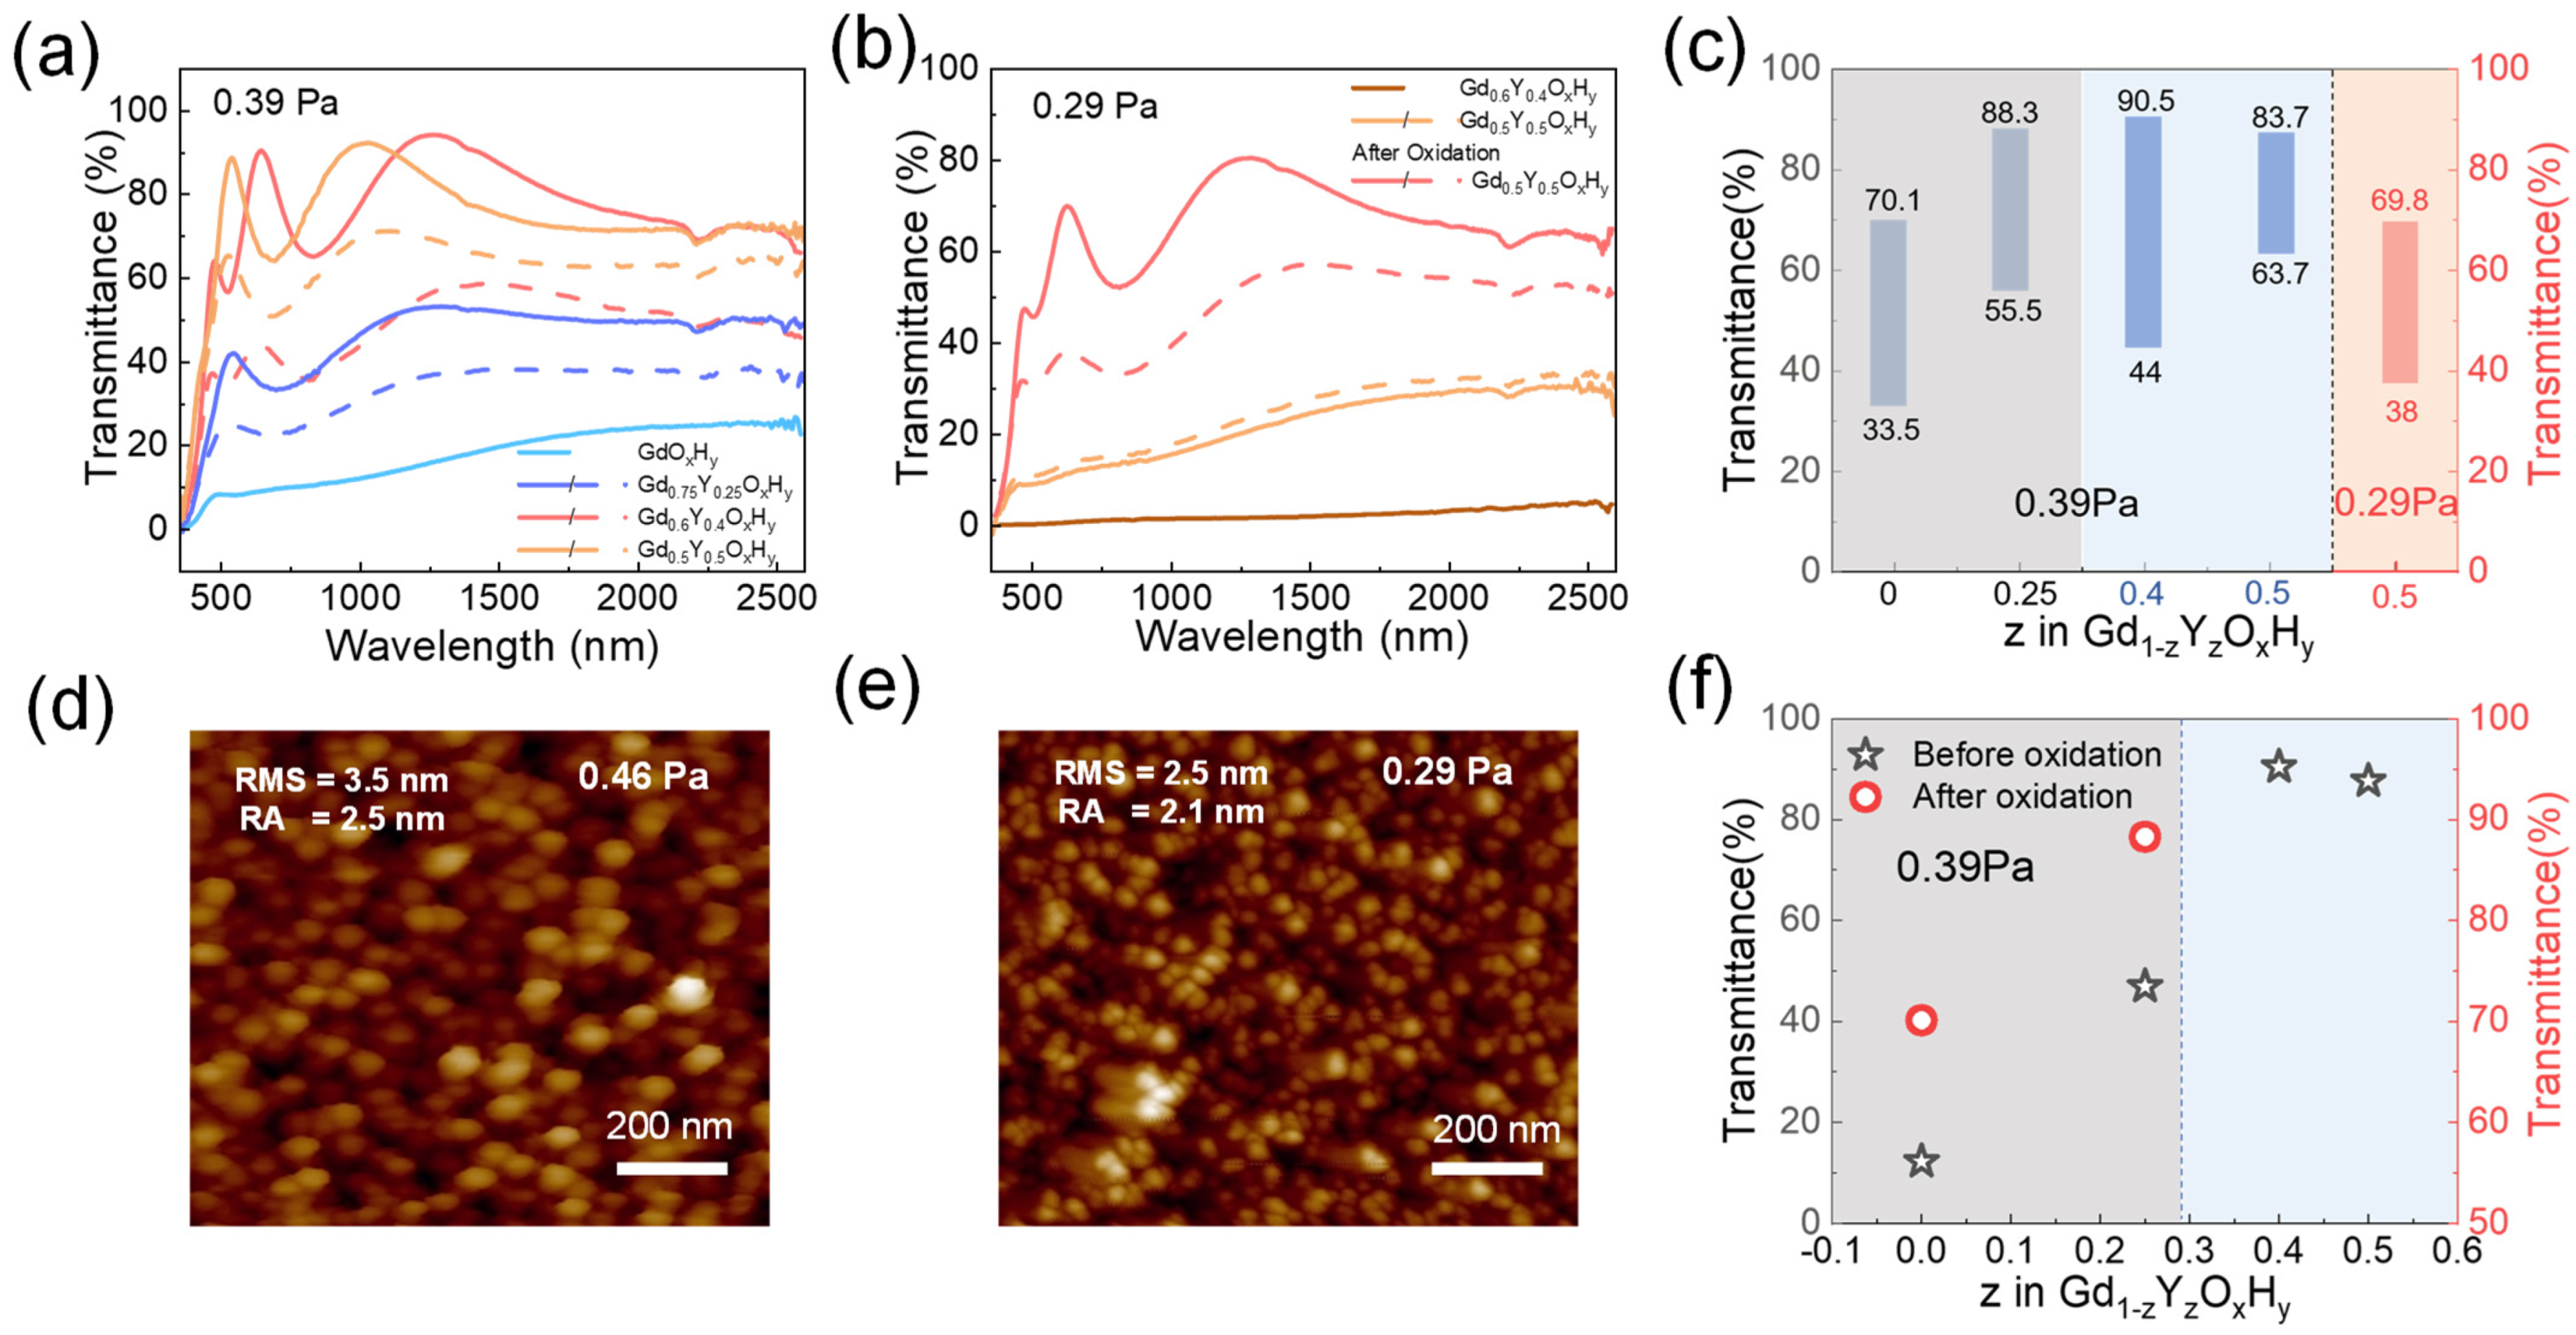
Figure 5 shows the critical preparation pressures p* (films deposited at
p <
p* remain metallic dihydrides) for samples with different co-doping parameters [
13]. At a preparation pressure of 0.39 Pa, the Gd
0.75Y
0.25O
xH
y and GdO
xH
y films have a low initial state transmittance, but Gd
0.75Y
0.25O
xH
y films can respond to light with a decrease in transmittance of about 16.9%. The Gd
0.6Y
0.4O
xH
y and Gd
0.5Y
0.5O
xH
y can be directly prepared in one step with yellow transparent oxygen-containing hydride films with optical contrast of 46% and 20%, respectively. These films are exposed to the same light hours and conditions.
Figure S7 shows the transmittance spectra of GdO
xH
y, and Gd
0.75Y
0.25O
xH
y films after oxidation. The transmittance of Gd
0.75Y
0.25O
xH
y films is higher than that of GdO
xH
y films.
Figure 5b shows the spectra of the Gd
0.6Y
0.4O
xH
y and Gd
0.5Y
0.5O
xH
y films when the pressure is reduced to 0.29 Pa. The Gd
0.6Y
0.4O
xH
y has a basic transmittance of 0, while the Gd
0.5Y
0.5O
xH
y, after oxidation in air, can achieve a transmittance of around 70% and an optical contrast of 31.8%.
Figure 5c lists the transmittance at the relevant pressure, and
Figure 5f lists the maximum transmittance of prepared samples at 0.39 Pa.
Figure 5d,e gives AFM images of Gd
0.5Y
0.5O
xH
y prepared at 0.46 Pa and 0.29 Pa. The RMS and RA values show that the surface roughness of the films prepared at lower pressures is relatively lower. It has also been suggested that higher preparation pressures lead to increased porosity on the surface of the films, aiding the entry of oxygen [
15]. So, preparing at lower pressures helps to improve the antioxidant capacity of the films. It can be found that as the Y content increases, the critical pressure decreases due to the elemental dependence of the pressure, which may be attributed to the important contribution of the reverse-reflected Ar neutral particles to the total energy flux of the grown film [
32]. A suitable amount of Y doping can effectively reduce the critical preparation pressure, expand the preparation window, achieve direct one-step preparation, reduce the lattice damage caused by oxygen doping during the post-oxidation process, and enhance its antioxidant capacity.


 ,
, 

