Article

Microstructural Characterization and Magnetic, Dielectric, and Transport Properties of Hydrothermal La2FeCrO6 Double Perovskites

National Laboratory of Solid State Microstructures, School of Physics, Nanjing University, Nanjing 210093, China
*
Author to whom correspondence should be addressed.
Nanomaterials 2023, 13(24), 3132; https://doi.org/10.3390/nano13243132
Submission received: 21 November 2023 / Revised: 7 December 2023 / Accepted: 12 December 2023 / Published: 13 December 2023
(This article belongs to the Section Synthesis, Interfaces and Nanostructures)

Abstract

:
Double perovskite La2FeCrO6 (LFCO) powders were synthesized via the hydrothermal method, which crystallized in an orthorhombic (Pnma) structure and exhibited a spherical morphology with an average particle size of 900 nm. Fourier transform infrared spectroscopy demonstrated the presence of fingerprints of vibrational modes of [FeO6] and [CrO6] octahedra in the powders. The XPS spectra revealed dual oxide states of Fe (Fe2+/Fe3+) and Cr (Cr3+/Cr4+) elements, and the oxygen element appeared as lattice oxygen and defect oxygen, respectively. The LFCO powders exhibited weak ferromagnetic behavior at 5 K with a Curie temperature of 200 K. Their saturation magnetization and coercive field were measured as 0.31 μB/f.u. and 8.0 kOe, respectively. The Griffiths phase was observed between 200 K and 223 K. A butterfly-like magnetoresistance (MR)–magnetic field (H) curve was observed in the LFCO ceramics at 5 K with an MR (5 K, 6 T) value of −4.07%. The temperature dependence of resistivity of the LFCO ceramics demonstrated their semiconducting nature. Electrical transport data were fitted by different conduction models. The dielectric behaviors of the LFCO ceramics exhibited a strong frequency dispersion, and a dielectric abnormality was observed around 260 K. That was ascribed to the jumping of electrons trapped at shallow levels created by oxygen vacancies. The dielectric loss showed relaxation behavior between 160 K and 260 K, which was attributed to the singly ionized oxygen vacancies.

1. Introduction

Perovskite transitional metal (TM) oxide nanostructures have gained a lot of attention due to their wide spectrum of intriguing properties [1,2,3] and promising technical applications [4]. Recently, nanostructures of double perovskites (DPs) A2B′B″O6 with hybrid 3d, 4d, or 5d TM ions at the B-site have attracted much attention because of their potential applications in the fields of microelectronic devices such as magnetic memories [5], magnetic tunnel junctions [6], and spin filtering devices [7]. In such a system, the interplay between the B′ (localized 3d-block TM ions) and B″ ions (delocalized 4d or 5d-block TM ions) provides more compositional flexibility to generate fascinating multifunctionalities [8,9]. Therefore, under the hybrid 3d- with 4d- or 5d-block TM ions at the B-site, highly spontaneous ordering can be achieved at the B-site because of their sizable differences in chemical valence states and the ionic radii between B′ and B″ TM ions. For example, structural ordered SrFeMoO6 [5], Sr2FeReO6 [10], and Sr2CrReO6 [11] bulk DP oxides have been successfully synthesized. However, in the special case of two 3d-block TM ions positioned at the B′ and B″ sites, the synthesis of the 3d (B′)–3d (B″) ordered DP oxides is much more difficult owing to their similar ionic radii [12,13].
As a representative 3d–3d DP oxide, La2FeCrO6 (LFCO) has drawn considerable attention since it provides a model system for testing the propensity for ferromagnetism, given this combination and configuration of Cr3+ and Fe3+ ions, and the general infallibility of the Goodenough–Kanamori (GK) rules [14,15]. In the past decade, several works have been conducted in the LFCO oxide system from theoretical and experimental aspects. Ueda et al. [16] first realized the ferromagnetic (FM) ordering in the artificial LaCrO3–LaFeO3 superlattices, which were fabricated by laser molecular beam epitaxy via alternative depositions of Cr3+ and Fe3+ ions on the (111) plane. The magnetic coupling between Cr3+ and Fe3+ ions was confirmed to be FM in terms of superexchange [14,15]. Unfortunately, the saturated magnetization, MS, was measured to be 3.0 μB/f.u., which is much lower than the theoretical one (MS~7.0 μB/f.u.). The Rietveld refinements on the neutron diffraction data indicated that the LFCO compound crystallized in an orthorhombic perovkite structure (Pbnm) with a random positioning of the Fe and Cr cations at the B-sited sublattices, displaying antiferromagnetic (AFM) behavior at 265 K [17]. That is in agreement with the AFM coupling expected from the linear d3(Cr3+)–d3(Cr3+) and d5(Fe3+)–d5(Fe3+) superexchange (SE) interactions [18]. According to the GK rules, the FM coupling between the Fe3+ and Cr3+ ions in the LFCO DP oxide with a rock-salt ordering is expected due to the SE interaction via the Fe(d5)–O–Cr(d3) magnetic path [14,15]. Recently, theoretical calculations have demonstrated a ferrimagnetic (FiM) ground state in an ordered LFCO DP oxide with Cr3+ and Fe3+ ions coupled antiferromagnetically [19]. This conclusion was experimentally verified in the well-ordered epitaxial LFCO thin films with a B-site ordering degree as high as 90% [20], and the film had an MS value of 2.0 μB/f.u. at 5 K, which was in accordance with the Pickett’s model [21], but the KG rules were broken. In the bulk LFCO samples, only the AFM behavior was observed, and the disappearance of the FM order was ascribed to the random positioning of the Fe3+ and Cr3+ ions at the B-sited sublattices [22]. As described above, different magnetic behaviors have been reported in the LFCO oxide artificial superlattice, thin films, and bulk counterparts, which are believed to be closely related to the diverse couplings of the Fe–O–Fe, Cr–O–Cr, and Fe–O–Cr bonds [16]. To date, although the structure and physical properties of the LFCO oxide system are widely studied, there is still much controversy in their magnetic behaviors because the magnetic properties of LFCO DP oxides are very susceptible to the formation of oxygen vacancies ( V O ¨ ) and anti-site defects (ASDs) and to the volatilization of La during their high-temperature synthesis, which favors the formation of different chemical oxide states of Fe and Cr TM ions. A competition between the AFM and FM interactions via the different magnetic paths can result in different magnetizations in the LFCO oxides [23]. Thus, in order to explore the physical mechanisms behind these anomalous magnetic behaviors in LFCO DP oxides, more systematic investigations are highly required. Recently, Sun et al. [24] theoretically investigated the structural and magnetic properties of R2CrFeO6 (R = rare earth elements) DP oxides. They found an antiparallel alignment of the spins of the Fe and Cr TM ions existing in the R2CrFeO6 oxides, and such AFM interaction resulted in Ferrimagnetism (FiM). Since the FiM state has the lowest energy in the monoclinic P21/n phase, it could be regarded as a ground state. They also found that by increasing the R radius, the energy difference between the P21/n and R-3 phases were reduced. The theoretical calculations indicate that the magnetic properties of R2CrFeO6 DP oxides are not only dependent upon the Cr–O–Fe bond angles and tilting angles but also upon the different constituents of the material [24]. An insulating ferrimagnet LFCO with antiparallelly aligned S = 3/2 (Cr3+) and S = 5/2 (Fe3+) ions is predicted through different first-principles approaches [19]. Similarly, the magnetic orders in the (LaFeO3)n–(LaCrO3)n superlattices (denoted as SL(n)) were investigated by Monte Carlo simulations, and the results were compared with those from the LaFe0.5Cr0.5O3 bulk counterpart [25]. It is also noticed that both FM and FiM behaviors appeared in the SL(1) and SL(3), whereas two different AFM orders occurred in the SL(2) and SL(4), respectively. The present results not only match well with the experimental data in the SL(1) but also demonstrate some novel ordered phases in the SLs constructed with other periods. However, the magnetic transport properties of the LFCO oxide system have not been reported yet despite the fact that they play important roles in the applications of spintronic devices.
In view of the above facts, in the present work, LFCO oxides were synthesized by the hydrothermal method. This process is characterized as a powerful method for the synthesis of perovskite oxide powders with controllable sizes and morphologies via the modifications of the hydrothermal processing parameters (e.g., precursor types, hydrothermal reaction temperature and time, pH value, and the type and concentration of the used mineralizers). The structural, magnetic, and dielectric properties of the hydrothermal LFCO DP oxides and their electrical and magnetic transport properties were comprehensively studied to better understand the relationships between the microstructure and physical properties of the LFCO oxides.

2. Materials and Methods

2.1. Synthesis of LFCO Powders

Hydrothermal process was used to synthesize the LFCO powders, which was carried out in a Teflon-lined stainless steel autoclave. The filling capacity of the autoclave was 80%. First, solutions of La(NO3)3·6H2O, Fe(NO3)3·9H2O, and Cr(NO3)3·9H2O were prepared with 0.5 M concentration, and the molar ratio of La:Fe:Cr was kept as 2:1:1. For a typical synthesis of the LFCO powders, 10 mL suspension with Cr(NO3)3·9H2O and Fe(NO3)3·9H2O was made with the addition of 2 g KOH. Then, 10 mL La(NO3)3 solution was put into the above suspension, followed by the addition of another 8 g KOH (used as a mineralizer) under continuous stirring for 30 min at room temperature (RT) to form a mixed solution. The above mixed solution was transferred into hydrothermal autoclaves, which were kept at 433 K for 4 h and then cooled naturally to RT in air. Deionized water was used to wash the resulting powders, which were filtered and dried at 353 K for 12 h in an oven. Finally, the obtained brown powders were further post-annealed at 1473 K for 12 h in air in a tube furnace.

2.2. Microstructural Characterization and Physical Properties

All of the post-annealed LFCO powders were characterized by X-ray diffraction (XRD) at RT by using a SIEMENS D5000 diffractometer (Simens, Berlin, Germany) under Cu Kα radiation (λ = 1.54056 Å). XRD data were collected in a step-scan mode with 2θ in the range of 20° to 80°. The step size was 0.02°/s, and the collecting time for each step was 10 s. Structural parameters of the LFCO powders were extracted from Rietveld refinements on the powder XRD data by using the general structure analysis system (GSAS) software (GSAS-II) [26]. Fourier transform infrared (FTIR) spectrum of the LFCO powders was recorded in the wavenumber range of 400 cm−1 to 1600 cm−1 by using a PerkinElmer FT-IR 65 spectrometer. The morphology and chemical compositions of the tested samples were examined using a scanning electron microscope (SEM, FEI QUANTA 650, Hillsboro, OR, USA) with attached energy-dispersive X-ray spectroscopy (EDS). The EDS data were acquired in a mapping mode. X-ray photoelectron spectroscopy (XPS) was utilized to determine the chemical binding energies (BEs) and oxide states of the constituent elements in the LFCO powders. The La 3d, Fe 2p, Cr 2p, and O 1s XPS spectra were collected by using a PHI 5000 spectrometer (Versa Probe, ULVAC-PHI, Kanagawa, Japan) under Al Kα radiation at 1486.60 eV as X-ray source. All of the collected XPS spectra were calibrated by C 1s core-level positioned at a BE value of 284.60 eV. Dielectric measurements of the LFCO ceramics were carried out by using an Agilent impedance analyzer (Model, Agilent 4192 A, Agilent technologies, Santa Clara, CA, USA) operated in a frequency range of 102 Hz to 106 Hz and a temperature range of 173–373 K controlled by a controller (DMS-2000, Partulab Technology, Wuhan, China). The D.C. magnetization (M) data were measured using a SQUID magnetometer (MPMS3, Quantum Design, San Diego, CA, USA). The M-T curves were recorded in the ZFC (zero-field cooling) and FC (field cooling) protocols under a magnetic field of 500 Oe over a temperature range of 2 K to 300 K. The M-H hysteresis loops were measured at 5 K and 300 K, respectively, within the magnetic field of ±6 T. All of the magnetic measurements were performed with the powder samples installed inside a Teflon capsule. A standard four-probe method was used to measure the resistivity (ρ) of the LFCO ceramics over a temperature range of 2 K to 800 K without applying a magnetic field. The magnetic field dependence of ρ for the LFCO ceramics was also measured from −6 to 6 T at 5 K and 300 K, respectively, from which the plot of magnetoresistance (MR) versus magnetic field (H) was extracted.

3. Results and Discussion

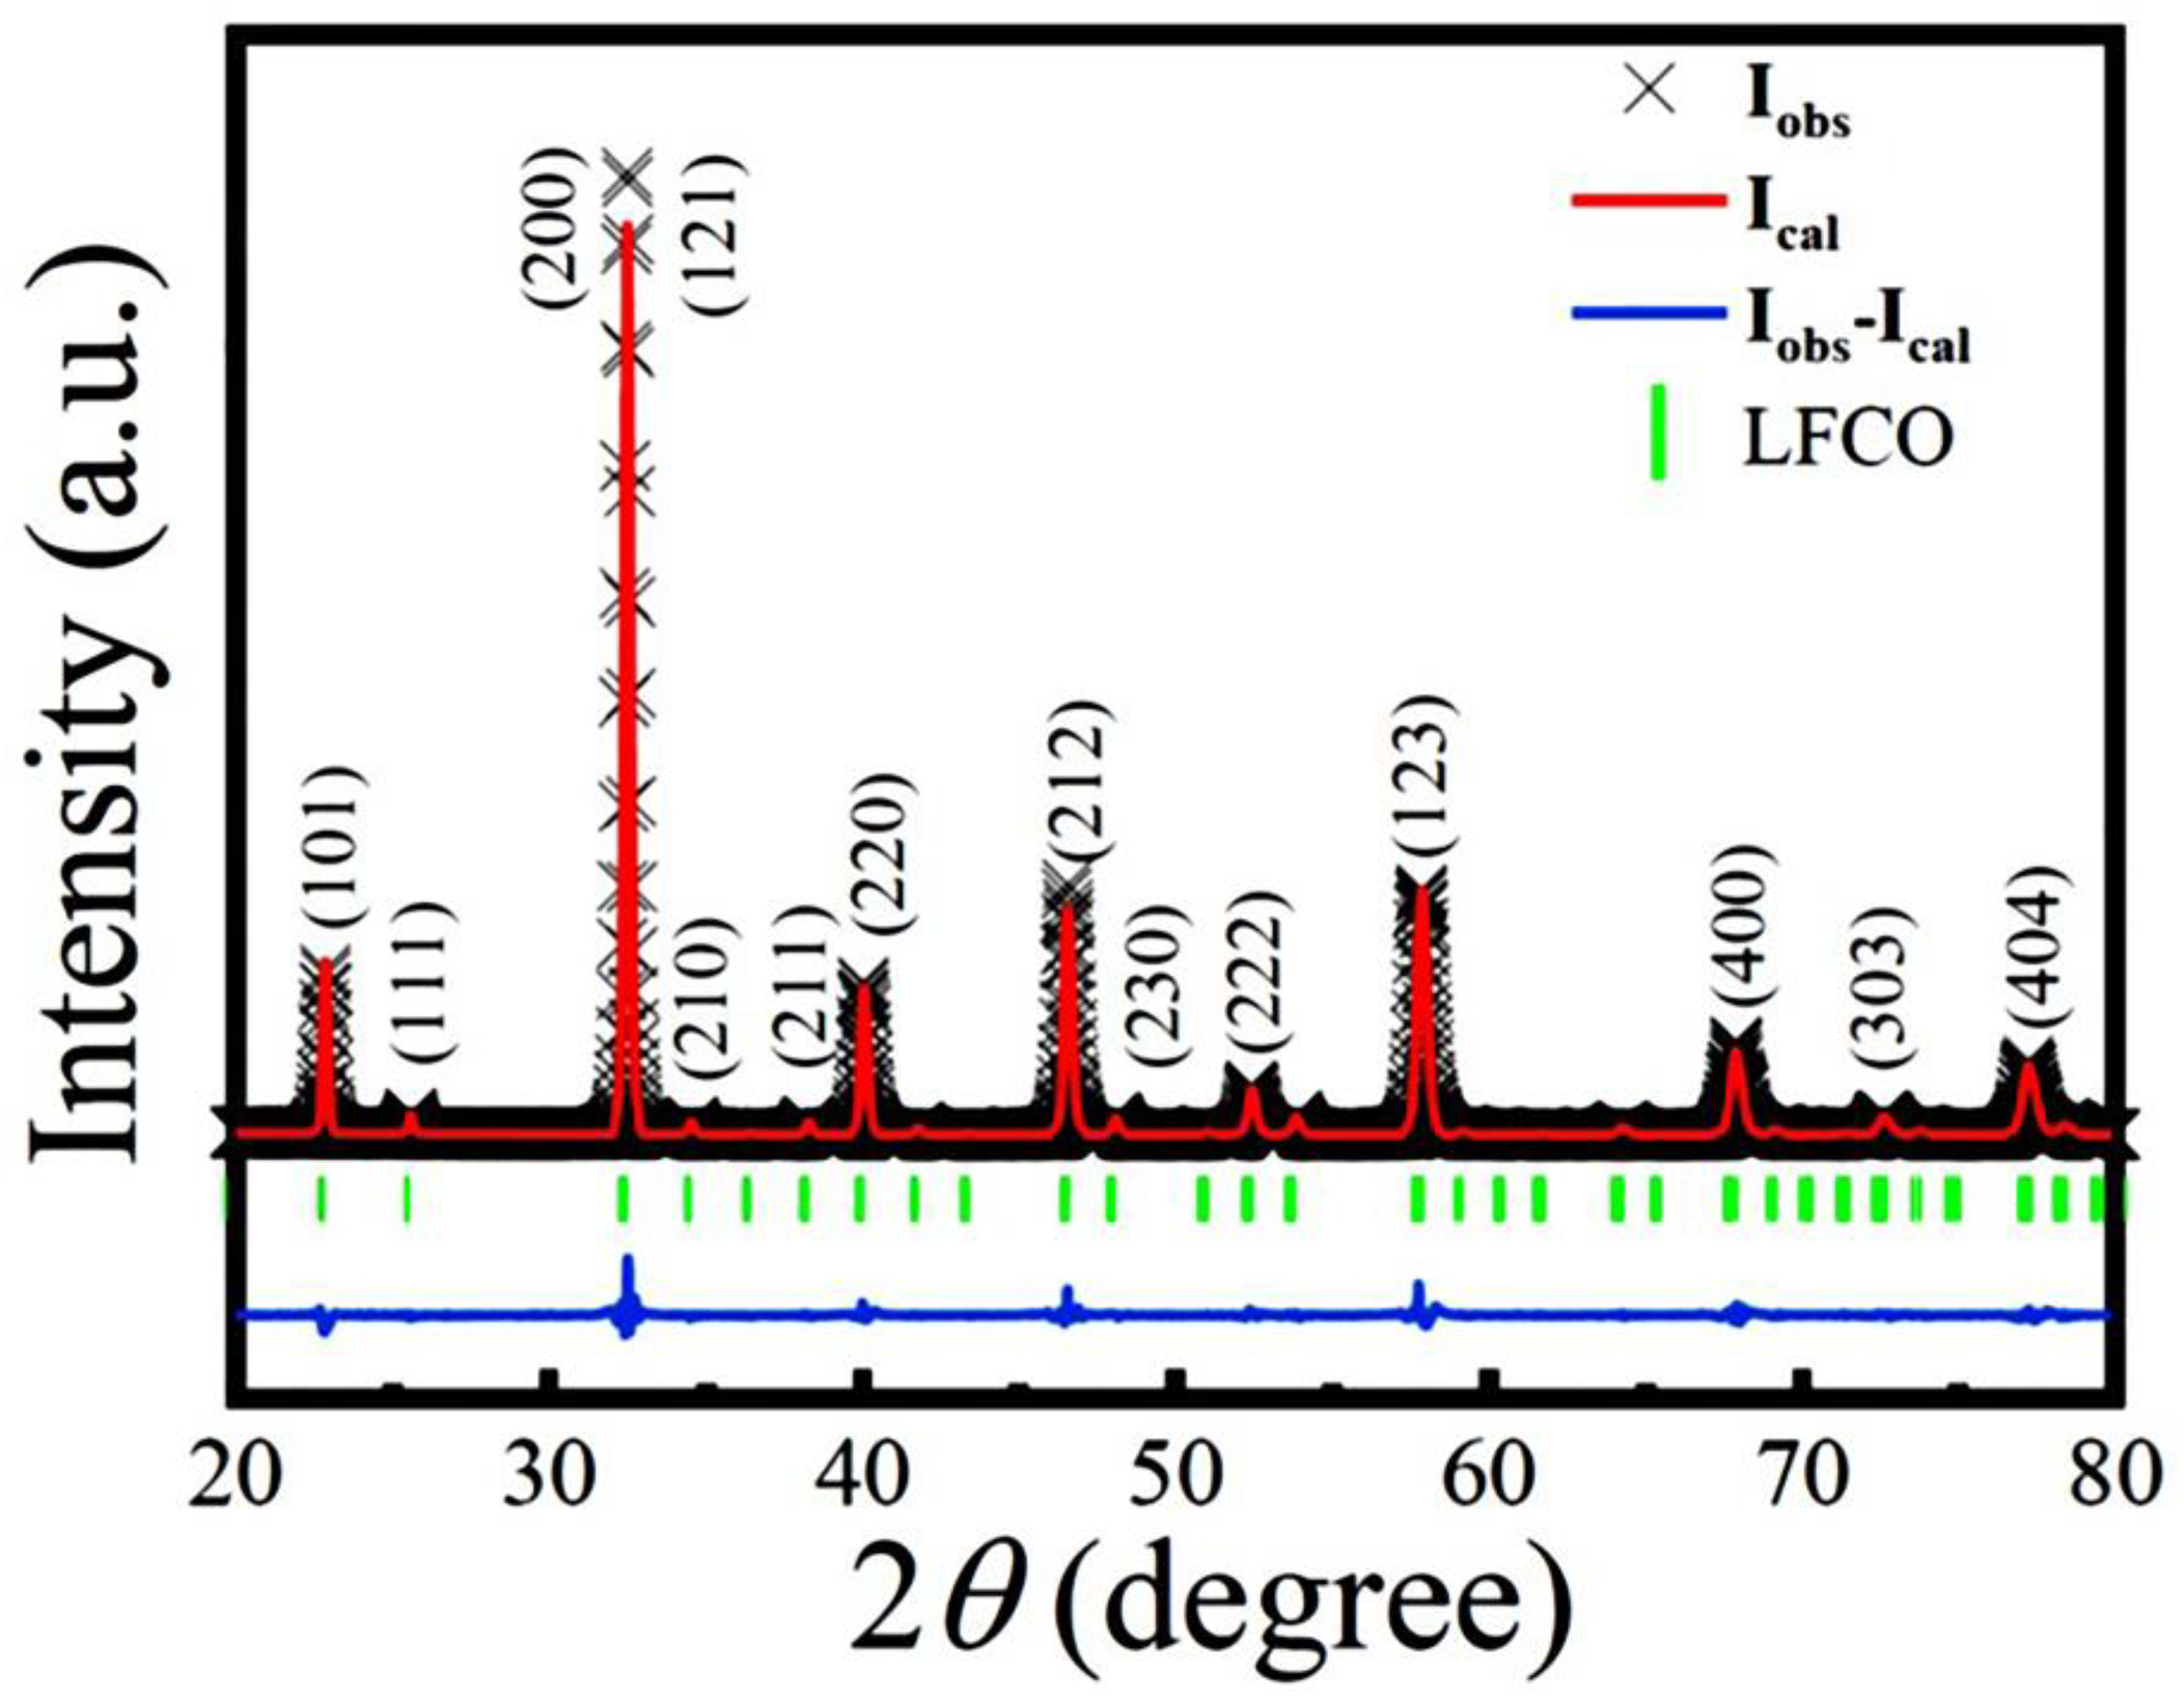
3.1. Microstructural Characterization

The XRD pattern of the LFCO powders measured at RT is shown in Figure 1. All of the XRD peaks can be indexed in an orthorhombic perovskite structure with a space group of Pnma (JCPDS file, No. 89-0478), indicating that the LFCO powders crystallize in an orthorhombic lattice symmetry. The profile of the Rietveld refinements on the powder XRD data and the allowed Bragg reflections are also demonstrated in Figure 1. Three reliability factors (Rp, Rwp, and χ2) were utilized to assess the fitting quality between the experimental XRD data and the theoretical ones, which were determined as Rwp = 6.03%, Rp = 5.98%, and χ2 = 2.32.
The small value of χ2 indicated a good fittingness. The refined structural parameters at RT are tabulated in Table S1, matching well with the data reported previously [27,28]. The Goldschmidt’s tolerance factor (t) of the LFCO powders was also calculated to be 0.961, indicating that an orthorhombic crystal structure was preferred for the present LFCO powder [29]. It is also noticed that any XRD peak representing the B-site cationic ordering does not appear in Figure 1, suggesting that the rock-salt type ordering of the Fe and Cr ions at B-sited sublattices is not realized due to their similar ionic radii and the same chemical valence states [30]. The Scherrer formula described by Equation (1) was used to determine the average crystallite size (D) of the LFCO powders [31]:
D = 0.9 λ β c o s θ B
where λ is the X-ray wavelength of the Cu Kα radiation (λ = 1.54056 Å), β is the full width at half maximum (HWHM) of the (200)/(121) diffraction peak (in radians), and θB is the Bragg diffraction angle. The average crystallite size, D, was determined to be 41.0 nm.
The typical low-magnification SEM image of the LFCO powders is displayed in Figure 2a, and Figure 2b presents the histogram of the LFCO particle size distribution. It was noticed that the LFCO particles had a spherical morphology and their average particle size was determined to be 0.90 μm by fitting the particle size distribution in Figure 2b. Figure 2c displays an EDS spectrum acquired from the LFCO powders in a mapping mode, illustrating the EDS signals of the constituent elements, as expected. There are no other elements in the LFCO powders. The atomic molar ratio of La:Fe:Cr was determined to be 2:0.94:0.93 from the quantitative EDS data, which approached the nominal chemical compositions of the powders.
FTIR spectroscopy was used to identify the local structures of the hydrothermal LFCO powders. Figure 3 shows the FTIR spectrum obtained from the powders, where two absorption bands positioned at 437 cm−1 and 603 cm−1 are clearly observed. The weak absorption band located at 437 cm−1 is attributed to the bending vibrations of the Fe–O bonds within the FeO6 octahedron [32], while the intense absorption band positioned at 603 cm−1 is a result of the stretching vibration of the Cr-O bonds within the CrO6 octahedra [33]. Thus, the octahedral coordination of Fe and Cr ions with oxygen ions (O2−) in the powders is confirmed by the FTIR spectrum.
The chemical valence states of the constituent elements (La, Fe, Cr, and O) in the LFCO powders were verified by the XPS spectra at RT. Figure 4a exhibits a wide scanning XPS spectrum for the LFCO powders over the scanning energy from 200 to 1000 eV, where the La 3d, Fe 2p, Cr 2p, and O 1s core-level XPS peaks are clearly observed. In addition, the C 1s core-level XPS peak is also observed at 284.60 eV, which is attributed to the conductive carbon tape employed in the XPS measurements. High-resolution XPS spectra of the La 3d, Fe 2p, Cr 2p, and O 1s core levels are demonstrated in Figure 4b–e, respectively. In Figure 4b, the La 3d core-level XPS spectrum is deconvoluted into two doublets positioned in the 831–840 eV and 850–858 eV regions, respectively. The former doublet corresponds to the La 3d5/2 level, and the latter one corresponds to the La 3d3/2 level. In addition, the satellite peaks of the La 3d5/2 and La 3d3/2 XPS peaks appeared at 838.43 eV and 855.32 eV, respectively. These two satellite peaks are ascribed to the electron transferring from the oxygen valence band to the empty La 4f level [34]. The difference (Δ) between the BE values of the La 3d5/2 (834.47 eV) and La 3d3/2 (851.35 eV) XPS peaks was measured to be 16.88 eV, which corresponds to the spin–orbit coupling (SOC) of the La element. The Δ value of the La element as well as the BE values of the La 3d5/2 and La 3d3/2 XPS peaks confirm the presence of La3+ ions in the LFCO powder sample [35]. Figure 4c depicts the Fe 2p3/2 core-level XPS spectrum over the scanning energy range of 706–715 eV, where two characteristic peaks are observed at 710.15 eV and 711.40 eV, respectively. They can be assigned to Fe2+ and Fe3+ ions, respectively [36]. The percentage molar ratio of Fe2+ to Fe3+ species was extracted from the peak fitting of the Fe 2p3/2 XPS spectrum, which was 18%:82%. Thus, the effective oxide state of the Fe ion was +2.82. Figure 4d displays the Cr 2p3/2 XPS spectrum over the energy region of 574–582 eV. Similarly, the Cr 2p3/2 XPS peak is also deconvoluted into two peaks located at BE values of 576.25 eV and 578.90 eV, respectively. They are assigned to the Cr3+ and Cr4+ species, respectively [37,38]. The percentage molar ratio of the Cr3+ to Cr4+ species was calculated as 74%:26%. Therefore, the effective oxide state of the Cr ions was +3.26. In Figure 4e, the O 1s XPS spectrum in the scanning energy region of 526–536 eV exhibits an asymmetric feature, indicating more than one kind of oxygen species in the powders. Previously, three kinds of oxygen species named as lattice oxygen (denoted as Oα), defect oxygen (represented as Oβ), and surface adsorbed oxygen (designated as Oγ) were reported to appear in the energy regions of 529–530 eV, 530–532 eV, and 533–534 eV, respectively [39,40]. Here, only two types of oxygen species appear in the present O 1s XPS spectrum, which are lattice oxygen (Oα) with a BE value of 529.42 eV and defect oxygen (Oβ) with a BE value of 531.70 eV, respectively. The percentage molar ratio of the Oα to Oβ species was estimated to be 46%:54%. This result indicates a higher molar ratio of oxygen defects in the LFCO powders. The species, peak positions, and percentage molar ratios obtained from the peak fittings of the Fe 2p3/2, Cr 2p3/2, and O 1s XPS spectra are summarized in Table S2, where the effective chemical oxidation states of the Fe and Cr ions are also presented.

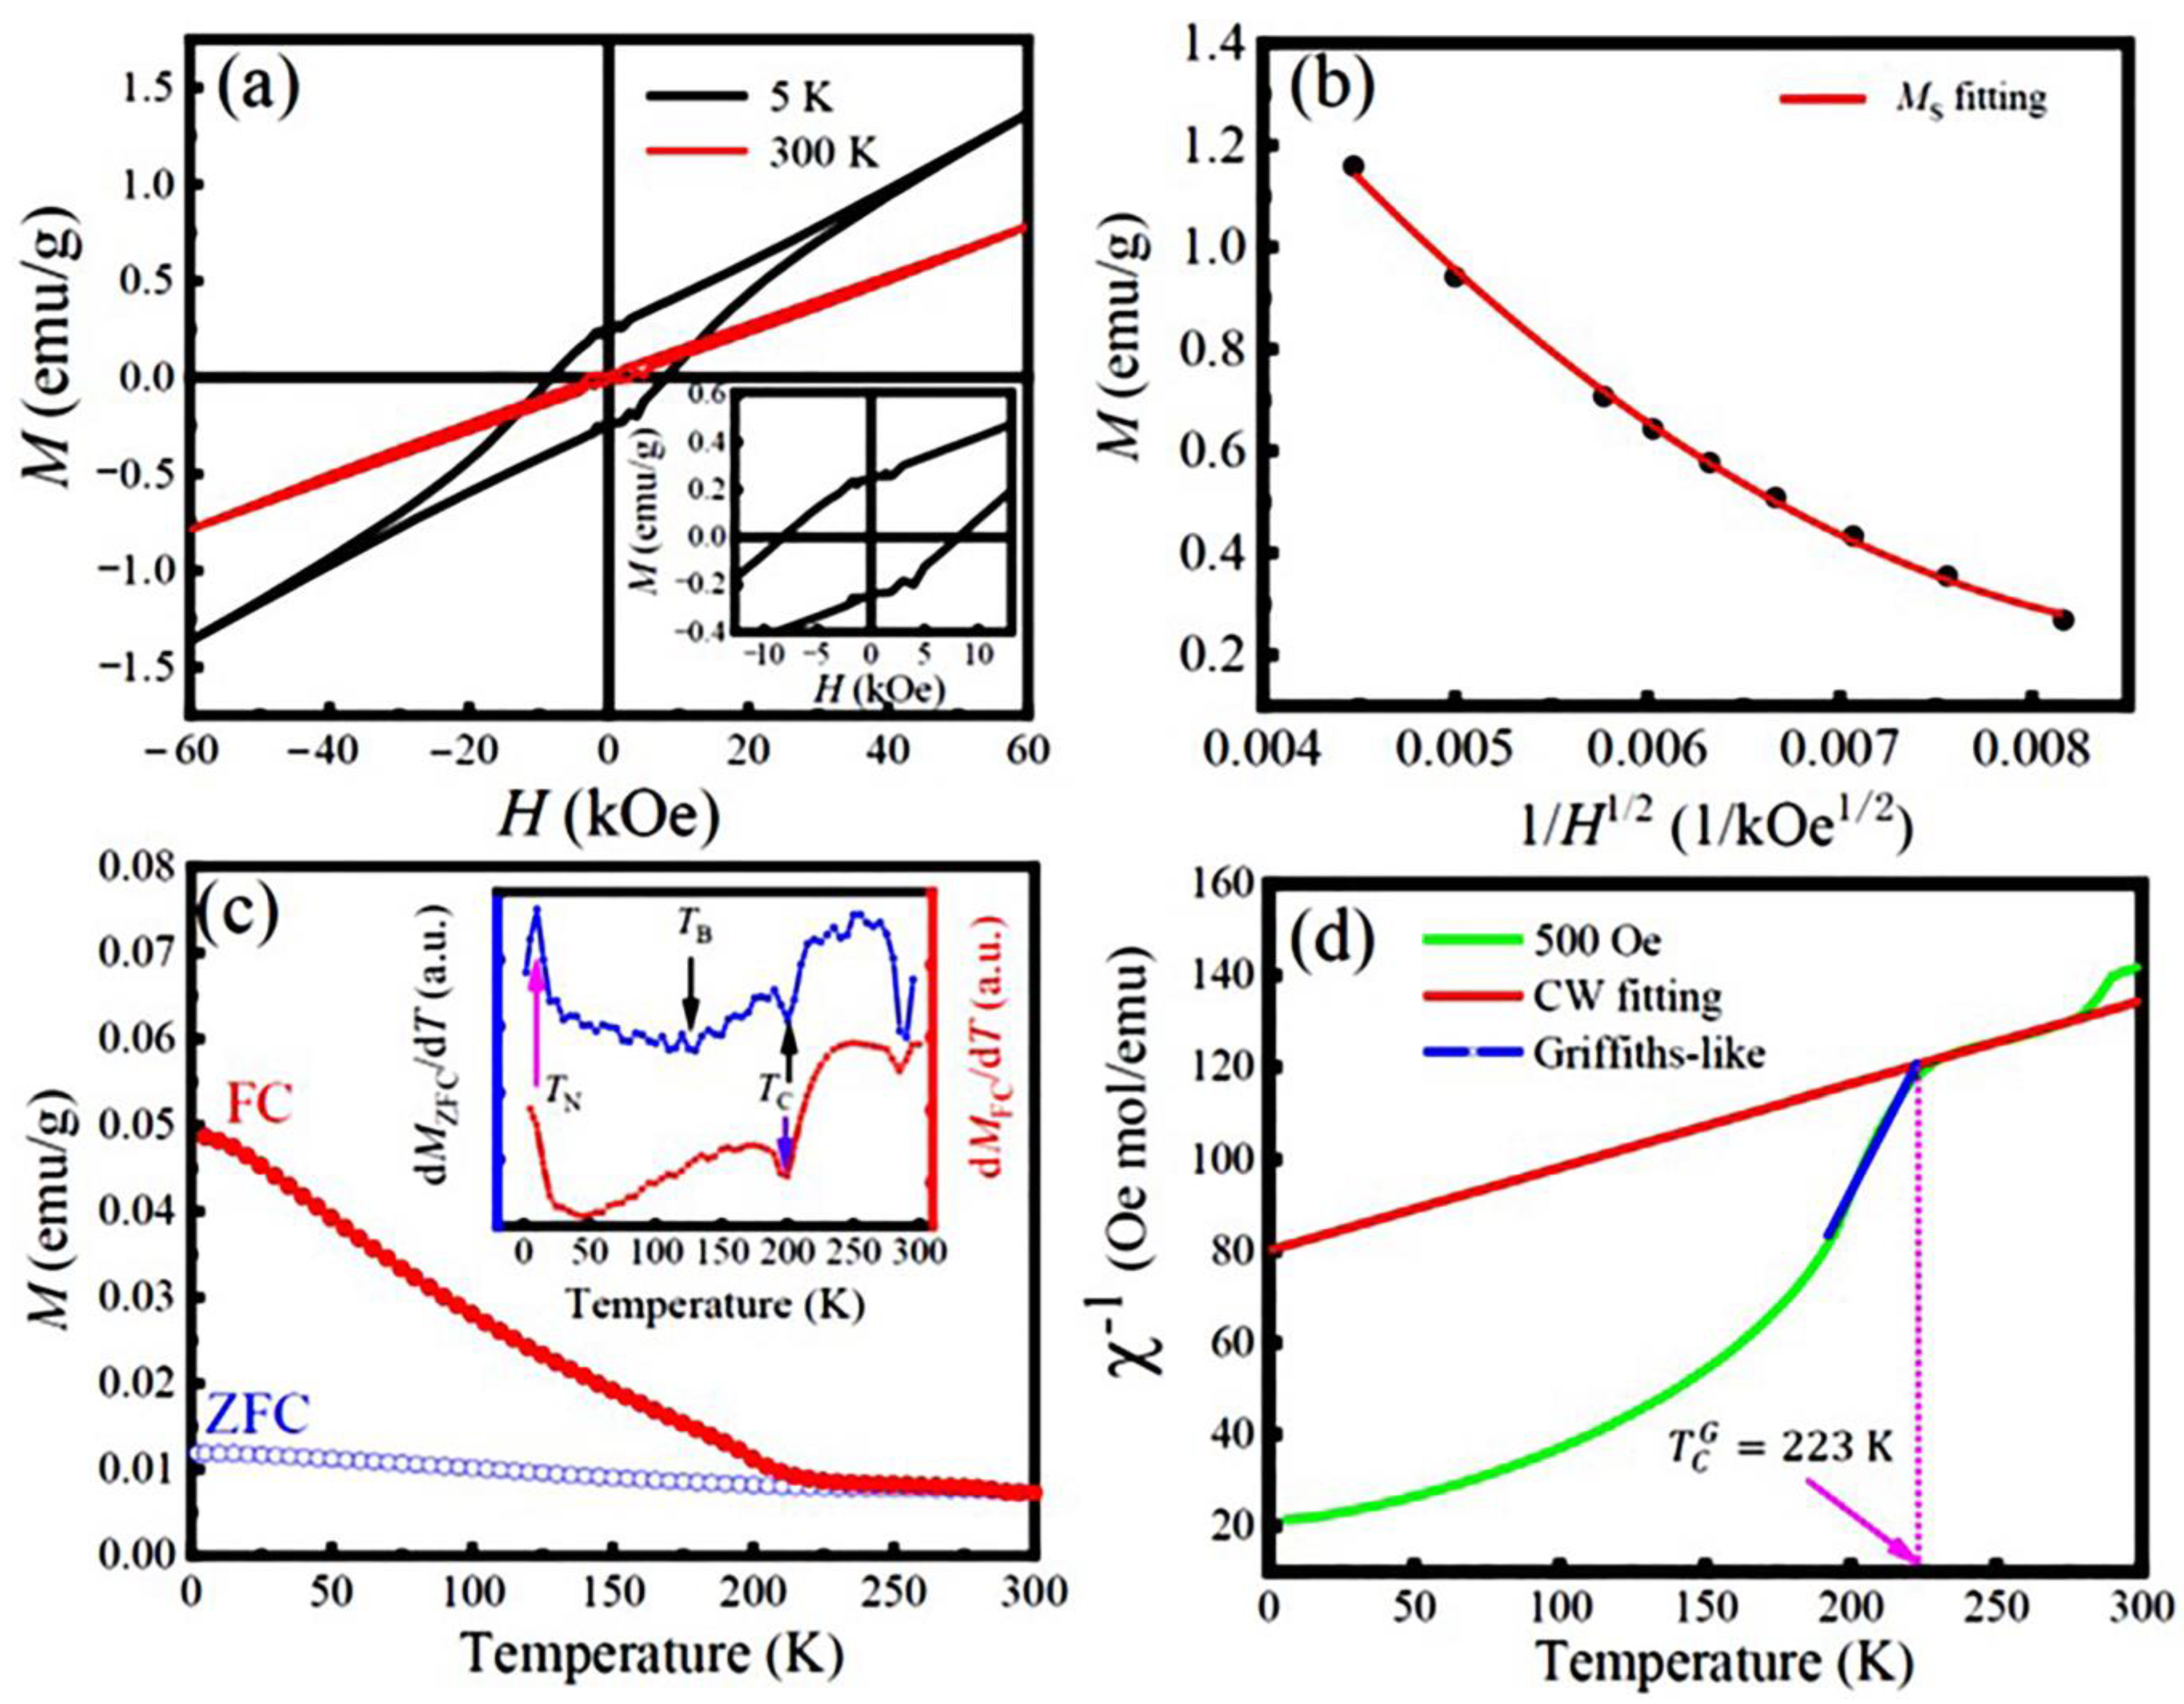
3.2. Magnetic Properties

Figure 5a displays the M-H hysteresis loops of the LFCO powders recorded at 5 K and 300 K, respectively. It is noticed that the M-H curve of the LFCO powders exhibits a linear-like behavior at 300 K with almost zero remnant magnetization and coercivity, indicating paramagnetic-like behavior, while at 5 K, an open hysteresis loop is clearly observed, which is saturated at a particular magnetic field, HF = 40 kOe. Beyond 40 kOe, the magnetization increases linearly with the magnetic field, indicating AFM behavior in the LFCO powders. That is ascribed to the SE interactions via the Fe3+–O–Fe3+ and Cr3+–O–Cr3+ magnetic paths. In addition, the observed small open hysteresis loop indicates a weak ferromagnetism, which is a result of the double-exchange interactions via the Fe3+–O–Cr3+, Fe3+–O–Cr4+, Fe2+–O–Cr3+, and Fe2+–O–Cr4+ magnetic paths. The magnetic parameters such as the remanent magnetization (Mr) and coercive field (Hc), could be obtained from the M-H hysteresis loop recorded at 5 K, which were Mr = 0.23 emu/g (or 0.02 μB/f.u.) and Hc = 8.0 kOe, respectively. It is noticed that beyond the HF, the M-H curve exhibits a linear relationship; thus, the measured M-H curve is composed of two parts: one is from the saturated hysteresis loop at HF, and another one is from the AFM magnetization following a linear relationship with the magnetic field. Therefore, the M(H) at the high-field region can be expressed by Equation (2) [41]:
M ( H ) = χ A F H + M S
where the χ A F H part is obtained from the AFM magnetization and MS is the saturation magnetization of the weak ferromagnetism. To evaluate the MS value of the samples, the law of approach to saturation is utilized, according to Equation (3) [42]:
M = M S 1 A H B H
where A and B are constants, which are related to the micro-stress and magneto-crystalline anisotropy of the samples, respectively. Figure 5b displays the M(H) plotted as a function of 1 H , from which the MS of the LFCO powders can be extracted as 1 H approaching zero (or H→∞). Thus, the extracted MS value of the LFCO powders from Equation (3) was 3.64 emu/g (or 0.31 μB/f.u.) at 5 K. This value was higher than the previously reported MS values for the hydrothermal LaFe0.5Cr0.5O3 powders (MS = 0.21 μB/f.u.) [43], LFCO nanoparticles (MS = 0.046 μB/f.u.) synthesized via the citrate auto-combustion technique [44], and LaFe0.5Cr0.5O3 ceramics (MS = 0.04 μB/f.u.) prepared by the solid-state reaction method [17]. However, the present MS value was still much smaller than the theoretical value (MS = 4.0 μB/f.u.) predicted for the LaFe0.5Cr0.5O3 compound with an atomic order of Fe3+(d5)-O-Cr3+(d3) under high-spin states [45] or the MS = 2.0 μB/f.u. reported for the LFCO thin films with a B-site ordering degree of ~90% [20]. Based on the theoretical calculations of the local spin density, Pickett et al. reported that the FiM ground state in the LCFO compound with an MS of 2 μB/f.u. exhibited much more stability than that in the FM ones with an MS of ∼7.0 μB/f.u. [21]. It is known that the magnetic properties of the LFCO samples are influenced not only by the magnetic coupling manners between the Fe3+ and Cr3+ ions at the B-sited sublattices (e.g., long range FM or AFM order), but also by the ordering degree of the Fe3+ and Cr3+ ions at B sublattices (e.g., fully ordering, partial ordering, or complete disordering) due to their different d-orbitals and occupied states (e.g., t2g or eg orbitals; empty, half-filled, or fully filled orbital states) and different magnetic moments. The present XRD data reveal the almost random positioning of the Fe3+ and Cr3+ ions at B-sited sublattices, which destroys the long-range alignments of magnetic moments. That is the reason why the experimental MS value is much smaller than the theoretical MS value (2.14 μB/f.u.) of the LFCO powders predicted based on an intuitive ionic model. The concentration of ASDs in the LFCO powders was evaluated to be 42.8%, and the corresponding B-site ordering degree ( η ) in the LFCO powders was determined to be 14.4%. The details for the calculations of the ASD concentration and B-site ordering degree are described in Supplementary Materials (Section S1). The temperature dependence of the MZFC and MFC curves is shown in Figure 5c. The two M-T curves demonstrate a typical ferrimagnetic (FiM) transition around 200 K, which is a field-independent magnetic phase transition at TC = 200 K, as confirmed by the derivative dM/dT curves for both the MZFC and MFC, and it is plotted as an inset of Figure 5c. Such a transition temperature is smaller than that reported for the bulk samples (TC = 265 K) [17]. The difference (ΔTC = 65 K) can be ascribed to the finite size effect and/or surface strain effect of nanopowders [46]. Upon cooling, the MZFC curve varied very smoothly, and the paramagnetic (PM)-to-FiM transition behavior was very weak, and a much broad phase transition peak appeared. The blocking temperature (TB) associated with this broad phase transition can be determined to be 113 K from the minimum position of the first derivative dMZFC/dT curve (see inset in Figure 5c). The low-temperature magnetic transition from the FiM to AFM phases appeared around TN = 10 K. A large irreversibility (ΔM, defined as (MFCMZFC)/MFC) was observed between the ZFC and FC curves, and the ΔM value reached ~71% at 50 K. That was ascribed to the fast increase in the predominant alignments of the spin orientations under 500 Oe. It was also noticed that the MZFC and MFC curves did not merge together at TC, and the irreversibility was still maintained well above TC. That indicated that the true paramagnetic behavior was not realized immediately above TC. It was noticed that the magnetic moments (M) of the LFCO powders were much smaller (in the range of 0.01–0.05 emu/g) within the investigated temperature range (2–300 K), which is attributed to the almost random positioning of the Fe3+ and Cr3+ ions at the B-sited sublattices and/or oxygen vacancies ( V O ¨ ). Figure 5d shows the temperature-dependent inverse of the susceptibility (χ−1), where χ−1 varies linearly with the temperature in the range of 225–280 K, indicating PM behavior. Thus, χ−1(T) follows the Curie–Weiss (CW) law, as expressed by Equation (4):
χ−1(T) = (Tθp)/C
where C denotes the CW parameter and θP represents the PM Curie temperature, which are tabulated in Table S1. The negative θP (θP = −441 K) suggests the predominant AFM interaction in the LFCO powders, which accords well with the AFM behavior reflected by the M-H loop at 5 K. As the temperature further decreases below 223 K, χ−1 decreases smoothly in a quasi-linear manner at an extended temperature range. From the CW parameter, C, the effective magnetic moments (μeff) in the PM phase can be calculated as 6.64 μB/f.u. (@500 Oe), and the theoretical magnetic moment, μcal (per formula unit), of the La2 F e 0.18 2 + F e 0.82 3 + C r 0.74 3 + C r 0.26 4 + O6 can be calculated as 6.80 μB/f.u. Details of the μeff and μcal calculations are described in Supplementary Materials (Section S2). It is noticed that the μcal of the LFCO powders is slightly larger than the μeff under a magnetic field of 500 Oe. This is attributed to the weak magnetic coupling between the Fe and Cr ions because of the high concentration of ASD content in the LFCO powders. The calculated μeff and μcal for the LFCO powders are tabulated in Table S1. In Figure 5d, the χ−1T curve exhibits a severe downturn deviation from the CW law below the temperature of 223 K (which is denoted as the Griffiths temperature, T C G = 223 K ), indicating the existence of a Griffiths phase (GP) in the LFCO powders. The GP phase lies between the magnetically ordered state and the completely disordered paramagnetic high-temperature regime [47]. In the GP region, χ−1T holds a power law described by Equation (5) [48,49]:
χ 1 ( T )     ( T T C R ) 1 γ
where γ is an exponent, indicating the strength of GP, and T C R is a random critical temperature. The T C R can be obtained from γ = 0 in the CW regime [50] and is equivalent to the θP. Thus, γ = 0 represents the PM state, and γ = 1 represents a GP phase. A nonlinear fitting curve of χ−1 in the temperature range between TC and T C G is presented in Figure 5d, from which the γ value is determined as 0.268, and the corresponding value of T C R is 146.2 K. The small γ value indicates the weak Griffiths singularity in the LFCO powders.

3.3. Dielectric Properties

At RT, the dielectric properties of the LFCO ceramics measured as a function of the frequency is illustrated in Figure 6a. It is observed that both the dielectric constant (εr) and dielectric loss (tanδ) fall continuously as the frequency increases, displaying a dielectric behavior with a strong frequency dispersion. Rapid decreases in εr and tanδ at low frequencies can be contributed to the onset of several polarization mechanisms (e.g., space charge and dipolar, ionic, and electronic polarizations). Under the applied electric field, electrons can hop across the grains and grain boundaries of the LFCO ceramics. Charge carriers can pile up at the grain boundaries due to their higher resistance, leading to a space charge polarization [50]. The dipolar polarization and interfacial polarization make significant contributions to the larger εr at low frequencies. In order to make these charge carriers move along grain boundaries, much energy is needed, leading to a high value of tanδ. At higher frequencies, only the electronic and ionic polarization mechanisms are capable of reacting to the applied electric field, leading to smaller values of εr and tanδ.
In addition, the charge carriers gathered at the grain boundaries are also reduced at higher frequencies. Thus, these confined charge carriers are scattered, resulting in smaller εr and tanδ values. Such dielectric dispersion can be well explained based on the Maxwell–Wagner relaxation model [51].
Under a series of frequencies, the εr and tanδ values of the LFCO ceramics were measured as a function of temperature, and the results are displayed in Figure 6b and Figure 6c, respectively. As shown in Figure 6b, the εr grows slowly in the low-temperature region below 200 K, whereas beyond 200 K, the εr value increases fast and reaches a maximum peak at a temperature of around 260 K, and then it decays following the CW law. In addition, a collapse of the εr peak value takes place as the frequency is increased, but the peak positions do not shift towards the high-temperature direction. That is much clearly observed in the εrT curves measured at low frequencies (1 kHz–40 kHz). This dielectric abnormality can be attributed to the jumping of electrons that are weakly bound to V O ¨     o r     V O · vacancies. These trapped electrons can be excited into the conduction band of the LFCO ceramics under thermal excitation at ~260 K. The thermal energy (E = kBT) at 260 K is 0.0224 eV, close to the activation energy (Ea = 0.02 eV) of the jumping electrons. As the applied electric field frequency increases, the trapped electrons are unable to catch up with the field, leading to a smaller contribution to the εr. Thus, a collapse of the εr value with an increasing frequency appears, as shown in Figure 6b. However, at higher frequencies (e.g., 400, 800, and 1000 kHz), the maximum peak of εr around 260 K disappeared; instead, a diffused phase transition occurred, which was mainly due to the almost random positioning of Fe and Cr cations at the B-sited sublattices in the LFCO ceramics with a high content of ASDs. The compositional fluctuations at the B-site can result in microscopic heterogeneity in the LFCO compound, leading to statistics of local Curie points around the average one. In addition, at higher frequencies, the contributions to the εr peak from the dipolar and interfacial polarizations become much less significant because the two polarization mechanisms are no longer operative to respond to the applied electric field. In Figure 6c, tanδ has a much smaller value in the low-temperature region below 260 K, and beyond 260 K, a fast increase in tanδ appears, especially for those measured at low frequencies. The tanδT curves in the local temperature between 180 K and 260 K is shown as an inset in Figure 6c, where the relaxation peaks for tanδ move towards q higher temperature with an increasing frequency from 1 kHz to 10 kHz, and the peak values also collapse simultaneously. This dielectric anomaly exhibiting the typical characteristics of dielectrics are associated with the oxygen vacancies ( V O ¨ ) and the related defect dipoles [52]. In the LFCO compound with a high content of ASDs, the ASDs can appear in the manner of the Fe-on-Cr site (FeCr) or Cr-on-Fe site (CrFe), respectively. Due to their different chemical oxide states, F e C r (Fe2+ on Cr3+ site or Fe3+ on Cr4+ site) and F e C r (Fe2+ on Cr4+ site) defects are readily formed at B-sites. The F e C r and F e C r   defects can attract the V O ¨ to form defect dipoles, namely ( F e C r V O ¨ ) ·   or F e C r V O ¨ . These defect dipoles can change their orientations with respect to the jumping of O2− into a vacant oxygen site of the oxygen octahedron or due to the hopping of electrons (among Fe2+/Fe3+ and/or Cr3+/Cr4+ pairs) that are weakly bound to V O ¨   o r   V O · . At a low temperature below 200 K, the V O ¨ defects, ( F e C r V O ¨ ) ¨   or F e C r V O ¨   defect dipoles, and the free electrons jumping between the Fe2+/Fe3+ and/or Cr3+/Cr4+ pairs, are bound at their respective defect sites. Thus, they make a small contribution to the εr and tanδ values at low temperatures [53]. However, a fast increase in the εr value appeared around 260 K at low frequencies, which was attributed to the V O ·   o r   V O ¨ defects in the LFCO ceramics, which were capable of moving across the whole sample, leading to the onsets of several polarization mechanisms (e.g., space charge and interfacial and/or defect dipolar polarizations) and affecting the dielectric relaxation behavior of the entire system [54]. In addition, the thermal excitation of electrons that are weakly bound to V O ¨   o r   V O ¨ vacancies and their hopping between Fe2+/Fe3+ and/or Cr3+/Cr4+ pairs also contribute to the rapid increase in the εr value around 260 K at low frequencies. Beyond 260 K, the εr value decays following the CW law. As shown in Figure 6c, the sharp increase in tanδ at temperatures beyond 260 K can be ascribed to the rapid increase in the electrical conduction of the LFCO ceramics. To determine the Ea value associated with the dielectric relaxation behavior exhibited by tanδ between 160 K and 260 K, a plot of Lnω versus 1000/T is used, as described by Equation (6):
ω = ω 0 exp E a k B T
where ω represents the angular frequency corresponding to the tanδ peak value, ω0 denotes the characteristic relaxation angular frequency at infinite temperature, and kB and T have their normal meanings, as described in the textbook. When fitting the Lnω vs. 1000/T curve with the Arrhenius law, a linear behavior between Lnω and 1/T was observed, as shown in Figure 6d, from which the Ea value was evaluated to be 0.586 eV. It was reported that the Ea value for the singly ionized V O · in perovskite oxides is about 0.3–0.5 eV, while the value is ~1.0 eV for the doubly ionized V O ¨ vacancies [55]. The present Ea value was 0.586 eV, close to that reported for the V O · , implying that this dielectric relaxation is associated with the movement of singly ionized V O · .

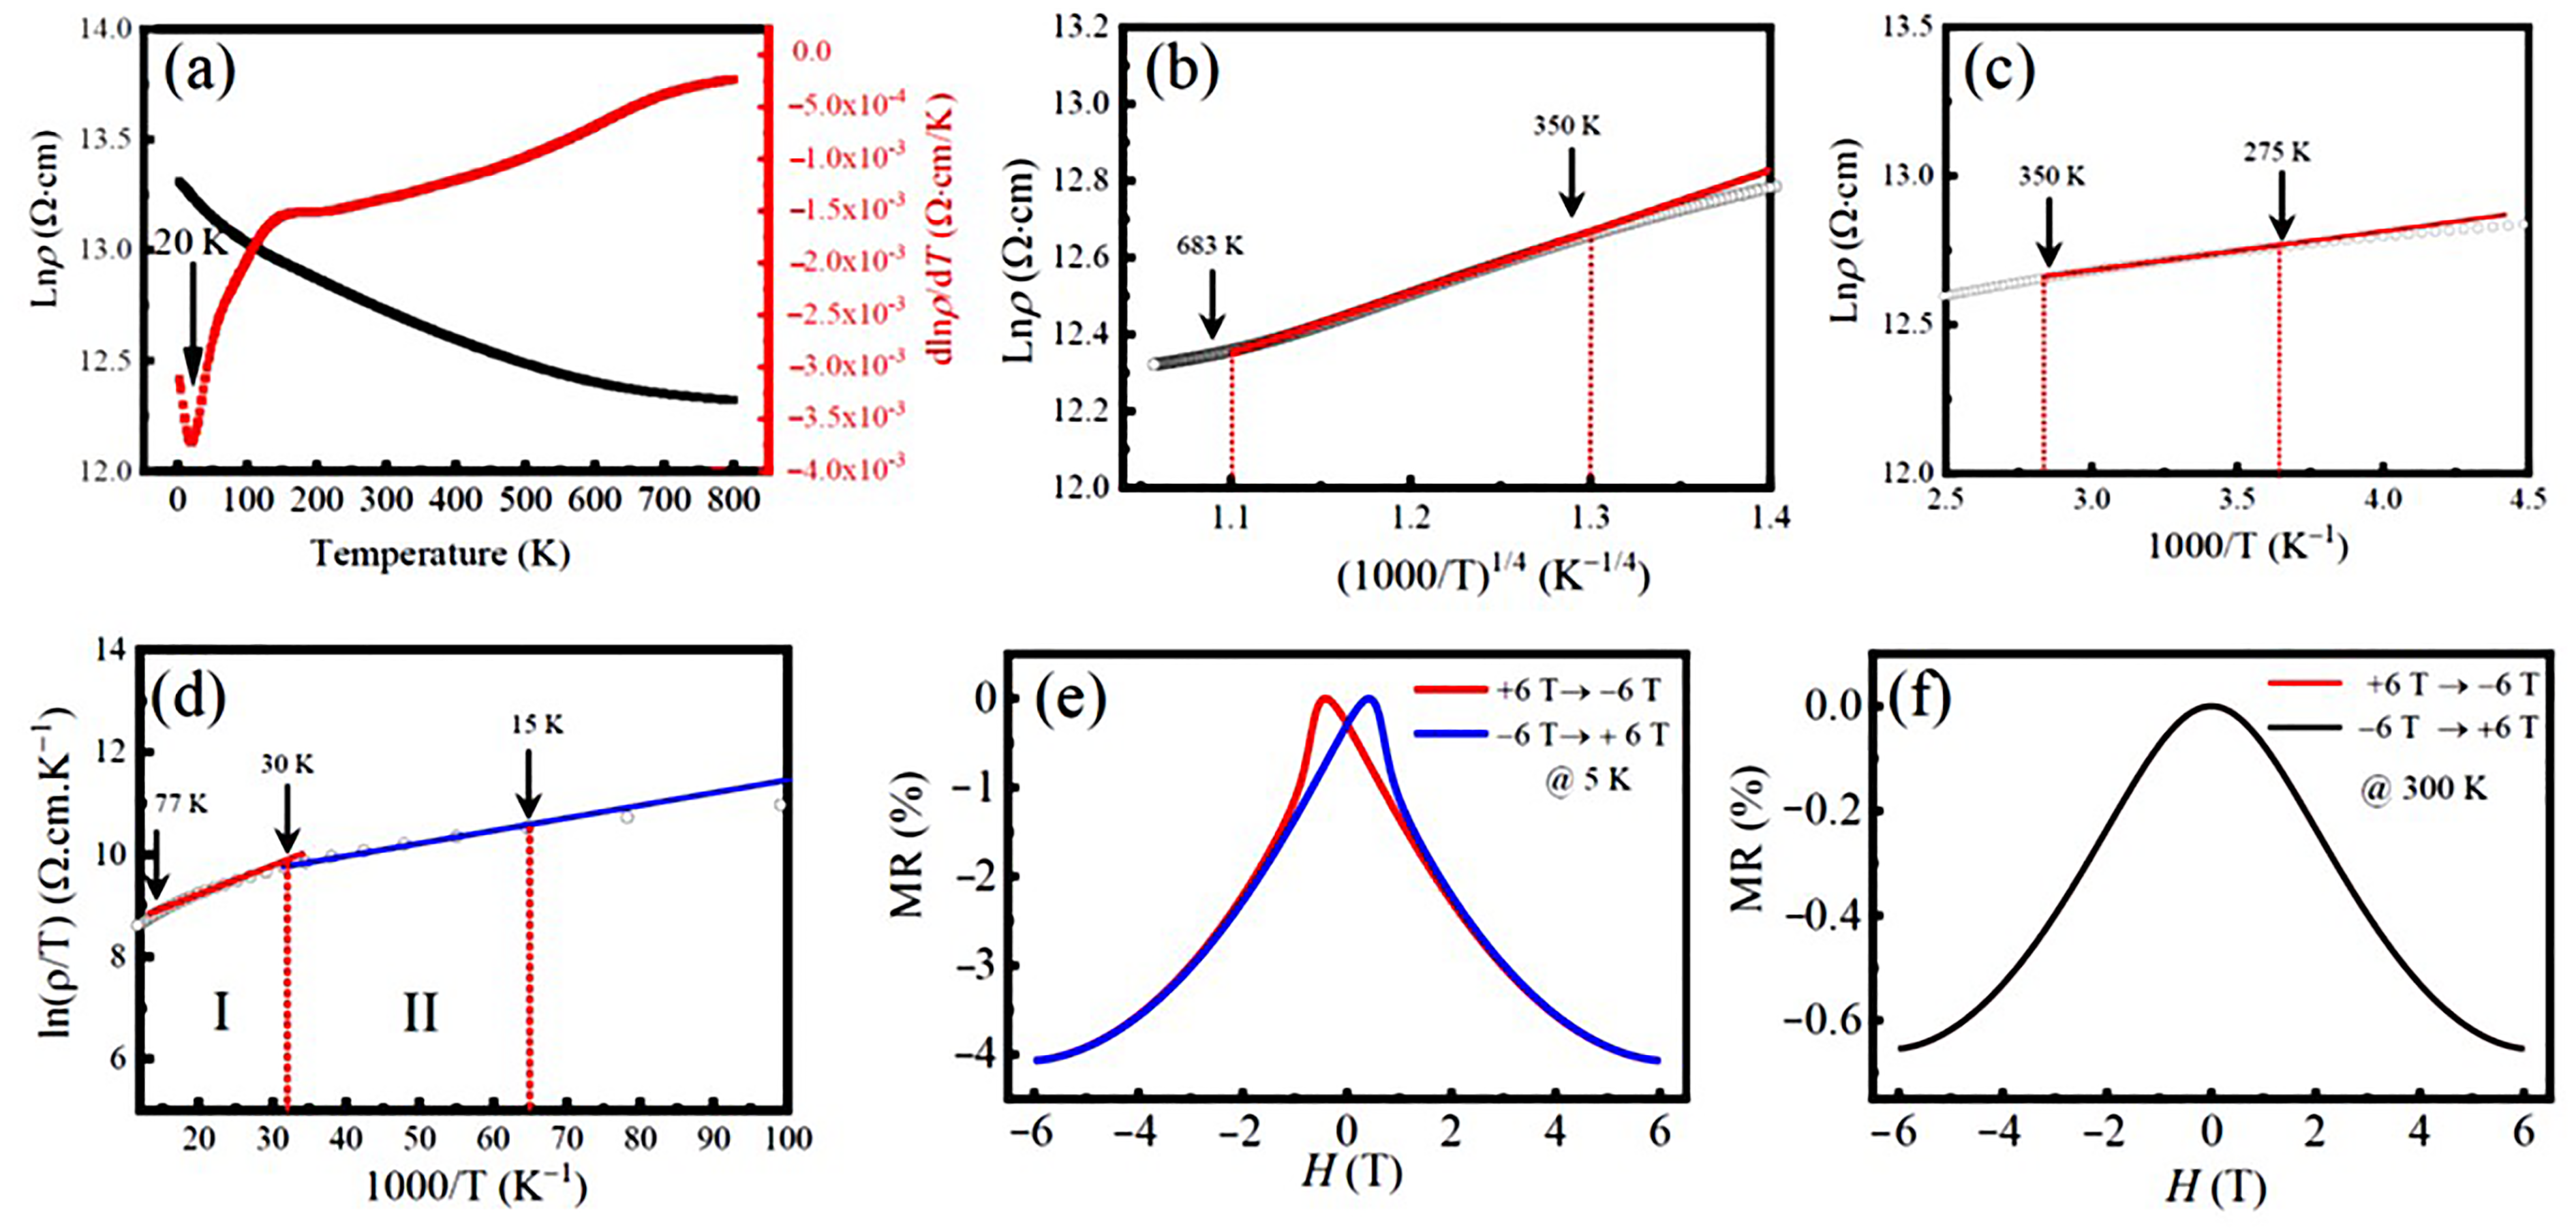
3.4. Electrical and Magnetic Transport Properties

Figure 7a shows the resistivity Lnρ(T) of the LFCO ceramics measured with respect to the temperature without applying magnetic fields, where a continuous decrease in Lnρ(T) within the investigated temperature range (2–800 K) is verified by the negative d L n ρ d T . That reveals the semiconducting nature of the LFCO ceramics. Notably, around 20 K, the plot of dLnρ/dT against T exhibits a valley, indicating a steep reduction in the resistivity Lnρ(T) taking place around 20 K. This phenomenon could be ascribed to the phase transition from antiferromagnetic to ferrimagnetic phases as the temperature is increased. Such a phase transition could make the spin states fluctuate around 20 K, leading to a sharp increase in the charge carrier concentrations. Correspondingly, a steep decrease in the resistivity Lnρ(T) appeared. To clarify the conduction mechanisms of the LFCO ceramic samples over 2–800 K, different conduction models such as Mott’s variable range hopping (VRH) model [56], the thermal activation model [57], and the small polaron hopping (SPH) model [58] are used to fit the resistivity data. In the high-temperature region of 350–683 K, the VRH model described by Equation (7) [56] was used to fit the resistivity data.
ρ = ρ 0 exp ( T o T ) 1 4
where ρ 0 is a resistivity pre-factor, and To = 18/kBN(EF)η3, denoting the Mott characteristic temperature. Here kB, N(EF), and η stand for the Boltzmann’s constant, the density of electronic states at the Fermi level (EF), and the electron localization length, respectively. Figure 7b shows a linear fitting of the plot of the lnρ(T) vs. (1000/T)1/4 curve in the temperature between 350 K and 683 K, which indicates that the electrical transport behavior of the LFCO ceramics in this temperature region is controlled by Mott’s VRH mechanism. The linear fitting of the lnρ(T) vs. (1000/T)1/4 curve yields a To value of 5989.7 K, and the corresponding N(EF) value of 4.42 × 1024 eV−1 cm−3, where the η value for the small polarons was chosen as 1.99 Å at the scale of the average bong length of the <Fe-O> or the <Cr-O> bond. The VRH transport is typically observed in a system with a random potential. Such random potential is provided by the random positioning of Fe and Cr ions at B-sited sublattices in the present samples, as confirmed by the above XRD patterns and magnetic data. A slight deviation from the linear curve below 350 K in Figure 7b may be related to the magnetic scattering from the localized moments of Fe/Cr ions. In the temperature region between 275 K and 350 K, the plot of Lnρ versus the inverse temperature (1000/T) shown in Figure 7c exhibits almost perfect linear behavior. Such kind of T-dependent resistivity is usually observed in semiconductors owing to thermal activation, which is described as by Equation (8) [57]:
ρ = ρ O exp ( E a k B T )
The linear fitting gives out the Ea value of 11.43 meV, which is comparable to the dopant levels in normal semiconductors. In the temperatures below 275 K, the plot of the lnρ vs. 1000/T curve becomes more deviated from a linear fitting. Instead, in the temperature between 15 K and 77 K, two linear fittings can be found for lnρ/T vs. (1000/T), as illustrated in Figure 7d. That indicates that the electrical conduction is governed by the SPH mechanism in this temperature range, as described by Equation (9) [58]:
ρ = ρ O T exp ( E a k B T )
The linear fitting of the ln(ρ/T) vs. (1000/T) curve shown in Figure 7d yields the Ea values for the small polarons hopping, which are 4.85 meV and 2.20 meV, respectively, in the two temperature regions, I (30–77 K) and II (15–30 K).
Magnetoresistance (MR) is described as a fractional change in the electrical resistance of the material when subjected to a magnetic field (H) at temperature (T), which is defined by Equation (10) [59]:
M R T , H = ρ T , H ρ T , H p e a k / ρ ( T , H peak )
where Hpeak is the magnetic field at which the resistivity ρ reaches the maximum value. The MR dependent upon the field for the LFCO ceramics was measured at 5 K and 300 K, which is demonstrated in Figure 7e and Figure 7f, respectively. Negative MR behavior was observed at 5 K and 300 K. It is noticed that in Figure 7e, the MR-H plot at 5 K exhibits a typical butterfly-like shape, and the MR (5 K, 6 T) is measured to be −4.07%. Such MR value is higher than that reported for the semiconducting DP oxides such as Sr2CrReO6 ceramics with MR (4.2 K, 7 T) = −3.0% [60], Sr2CrHfO6 ceramics with MR (2 K, 7 T) = −2.73% [61], and Sr2Fe0.5Hf1.5O6−δ ceramics with MR (2 K, 7 T) = −2.05% [62]. However, the butterfly-like MR-H curve disappeared at 300 K in Figure 7f, which was attributed to the absence of M-H hysteresis during the magnetic domain rotation under the excitation of the magnetic field. In addition, the MR value varied rapidly in a small magnetic field region but slowly in the high magnetic fields, exhibiting a similar response of the steep magnetization. That indicates that such negative MR behavior attributed to the magneto-tunneling effect in the LFCO ceramics.

4. Conclusions

In summary, we successfully synthesized the LFCO DP powders via the hydrothermal process and investigated their structural, magnetic, dielectric, and electrical/magnetic transport properties. The Rietveld refinement on the powder XRD pattern revealed that the LFCO powders crystallized in an orthorhombic distorted perovskite structure with the Pnma space group. The SEM images demonstrated the spherical morphology of the LFCO powders with an average particle size of 0.90 μm. The EDS data gave out the atomic ratio of La:Fe:Cr equal to 2:0.94:0.93. FTIR spectroscopy demonstrated the structural units of the [FeO6] and [CrO6] octahedra in the powders based on their fingerprints of vibrational modes. The XPS spectra verified the dual chemical valence states of the Fe (Fe2+/Fe3+) and Cr (Cr3+/Cr4+) elements as well as two kinds of oxygen species, namely lattice oxygen and defect oxygen. The LFCO powders exhibited weak ferromagnetic behavior at 5 K with MS = 0.31 μB/f.u. and Hc = 8.0 kOe, respectively. The TC was determined to be 200 K, and a strong irreversibility between the MZFC and MFC curves appeared around 295 K, which was attributed to the fast increase in the predominant alignments of the magnetic clusters under an external magnetic field. A Griffiths phase appeared in the temperature range between 200 K and 223 K. The LFCO ceramics exhibited butterfly-like MR-H behavior at 5 K, and the MR (5 K, 6 T) value was measured to be −4.07% due to the magneto-tunneling effect. The temperature-dependent resistivity data for the LFCO ceramics exhibited semiconducting behavior, and the resistivity data were well fitted by different conduction models in different temperature regions. The LFCO ceramics displayed dielectric behavior with a strong frequency dispersion, and the dielectric abnormality observed around 260 K was attributed to the jumping of electrons that were trapped in a shallow level created by oxygen vacancies. The activation energy associated with dielectric relaxation behavior, which was exhibited by the dielectric loss between 160 K and 260 K, was determined to be 0.586 eV, approaching the data reported for a singly ionized V O · . The movements of singly ionized V O ·   vacancies are responsible to such relaxor dielectric behavior.

Supplementary Materials

The following supporting information can be downloaded at https://www.mdpi.com/article/10.3390/nano13243132/s1, Section S1: Determination of the theoretical MS value of the LFCO powders and their ASD content; Section S2: Determination of the effective magnetic moments (μeff) and theoretical magnetic moment (μcal); Table S1: The refined crystal structural parameters (space group, unit cell parameters, average bond lengths, and bond angles), structural tolerance factor (t), reliability factors, and average crystallite size as well as the magnetic data (MS, Mr, HC, TN, irreversibility temperature Tirr, Curie–Weiss constant C and paramagnetic Curie–Weiss temperature θp, effective paramagnetic moment, μeff calculated from Curie–Weiss constant C, and theoretical magnetic moment μcal of the hydrothermal LFCO oxides); Table S2: Species, peak positions, and percentage molar ratios obtained from the peak fittings of Fe 2p3/2, Cr 2p3/2, and O 1s XPS spectra of the hydrothermal LFCO powders and the effective oxidation states of the Fe and Cr elements. Refs. [63,64,65,66,67] are cited in Supplementary Materials.

Author Contributions

K.Y.: Methodology, Synthesis, Software, Investigation, Data Analyses, and Writing—Original Draft. Z.W.: Validation, Software, and Visualization. Q.T.: Data Analyses and Visualization. J.G.: Software, Investigation, and Data Analyses. J.D.: Formal Analysis. L.C.: Formal Analysis. X.Z.: Conceptualization, Design, Resources, Writing—Review and Editing, Supervision, and Project Administration. All authors have read and agreed to the published version of the manuscript.

Funding

This work was supported by the National Natural Science Foundation of China (granted Nos. 11974170) and the Postgraduate Research & Practice Innovation Program of Jiangsu Province, China (grant Nos. KYCX22_0088, KYCX22_0091, and KYCX22_0093).

Data Availability Statement

Data will be made available upon request to the corresponding author.

Conflicts of Interest

The authors declare no conflict of interest.

References

  1. Xia, W.R.; Pei, Z.P.; Leng, K.; Zhu, X.H. Research progress in rare-earth doped perovskite manganite oxide nanostructures. Nanoscale Res. Lett. 2020, 15, 9. [Google Scholar] [CrossRef] [PubMed]
  2. Cui, Z.Y.; Xie, Z.S.; Wang, Y.J.; Yuan, G.L.; Liu, J.M. Research progress and prospects of photocatalytic devices with perovskite ferroelectric semiconductors. Acta Phys. Sin. 2020, 69, 127706. [Google Scholar] [CrossRef]
  3. Xue, P.J.; Wu, H.; Lu, Y.; Zhu, X.H. Recent progress in molten salt synthesis of low-dimensional perovskite oxide nanostructures, structural characterization, physical properties and applications. J. Mater. Sci. Technol. 2018, 34, 914. [Google Scholar] [CrossRef]
  4. Zuzic, A.; Ressler, A.; Macan, J. Perovskite oxides as active materials in novel alternatives to well-known technologies: A review. Ceram. Int. 2022, 48, 27240. [Google Scholar] [CrossRef]
  5. Jeng, H.-T.; Guo, G.Y. First-principles investigations of orbital magnetic moments and electronic structures of the double perovskites Sr2FeMoO6, Sr2FeReO6 and Sr2CrWO6. Phys. Rev. B 2003, 67, 094438. [Google Scholar] [CrossRef]
  6. Gray, B.; Ho, N.L.; Liu, J.; Chakhalian, J.; Freeland, J.W. Local electronic and magnetic studies of an artificial La2FeCrO6 double perovskite. Appl. Phys. Lett. 2010, 97, 013105. [Google Scholar] [CrossRef]
  7. Tang, Q.K.; Zhu, X.H. Half-metallic double perovskite oxides: Recent developments and future perspectives. J. Mater. Chem. C 2022, 10, 15301. [Google Scholar] [CrossRef]
  8. Vasal, S.; Karppinen, M. A2B′B″O6 perovskites: A review. Prog. Solid State Chem. 2015, 43, 1. [Google Scholar] [CrossRef]
  9. Anderson, M.T.; Greenwood, K.B.; Taylor, G.A.; Poeppelmeier, K.R. B-cation arrangements in double perovskites. Prog. Solid State Chem. 1993, 22, 197. [Google Scholar] [CrossRef]
  10. Leng, K.; Tang, Q.K.; Wu, Z.W.; Yi, K.; Zhu, X.H. Double perovskite Sr2FeReO6 oxides: Structural, dielectric, magnetic, electrical, and optical properties. J. Am. Ceram. Soc. 2022, 105, 4097. [Google Scholar] [CrossRef]
  11. Kato, H.; Okuda, T.; Okimoto, Y.; Tomioka, Y.; Takenoya, Y.; Ohkubo, A.; Kawasaki, M.; Tokura, Y. Metallic ordered double-perovskite Sr2CrReO6 with maximal Curie temperature of 635 K. Appl. Phys. Lett. 2002, 81, 328. [Google Scholar] [CrossRef]
  12. Ksoll, P.; Meyer, C.; Schueler, L.; Roddatis, V.; Moshnyaga, V. B-Site cation ordering in films, superlattices, and layer-by-layer-grown double perovskites. Crystals 2021, 11, 734. [Google Scholar] [CrossRef]
  13. Wang, Z.W.; Tang, Q.K.; Wu, Z.W.; Yi, K.; Gu, J.Y.; Zhu, X.H. B-site Fe/Re cation-ordering control and its influence on the magnetic properties of Sr2FeReO6 oxide powders. Nanomaterials 2022, 12, 3640. [Google Scholar] [CrossRef] [PubMed]
  14. Kanamori, J. Superexchange interaction and symmetry properties of electron orbitals. J. Phys. Chem. Solids 1959, 10, 87. [Google Scholar] [CrossRef]
  15. Goodenough, J.B. Theory of the role of covalence in the perovskite-type manganites [La, M(II)]MnO3. Phys. Rev. 1955, 100, 564. [Google Scholar] [CrossRef]
  16. Ueda, K.; Tabata, H.; Kawai, T. Ferromagnetism in LaFeO3-LaCrO3 superlattices. Science 1998, 280, 1064. [Google Scholar] [CrossRef] [PubMed]
  17. Azad, A.K.; Mellergard, A.; Eriksson, S.G.; Ivanov, S.A.; Yunus, S.M.; Lindberg, F.; Svensson, G.; Mathieu, R. Structural and magnetic properties of LaFe0.5Cr0.5O3 studied by neutron diffraction, electron diffraction and magnetometry. Mater. Res. Bull. 2005, 40, 1633. [Google Scholar] [CrossRef]
  18. Weiss, A.; Goodenough, J.B. Magnetism and the Chemical Bond; Krieger Publishing Company: New York, NY, USA, 1963. [Google Scholar]
  19. Lee, K.W.; Ahn, K.H. Evaluation of half-metallic antiferromagnetism in A2CrFeO6 (A = La, Sr). Phys. Rev. B 2012, 85, 224404. [Google Scholar] [CrossRef]
  20. Chakraverty, S.; Ohtomo, A.; Okuyama, D.; Saito, M.; Okude, M.; Kumai, R.; Arima, T.; Tokura, Y.; Tsukimoto, S.; Ikuhara, Y.; et al. Ferrimagnetism and spontaneous ordering of transition metals in double perovskite La2CrFeO6 films. Phys. Rev. B 2011, 84, 064436. [Google Scholar] [CrossRef]
  21. Pickett, W.E. Spin-density-functional-based search for half-metallic antiferromagnets. Phys. Rev. B 1998, 57, 10613. [Google Scholar] [CrossRef]
  22. Belayachi, A.; Nogues, M.; Dormann, J.L.; Taibi, M. Magnetic properties of LaFe1−xCrxO3 perovskites. Eur. J. Solid State Inorg. Chem. 1996, 33, 1039. [Google Scholar]
  23. Coutinho, P.V.; Barrozo, P. Influence of the heat treatment on magnetization reversal of orthorhombic perovskites LaFe0.5Cr0.5O3. Appl. Phys. A 2018, 124, 668. [Google Scholar] [CrossRef]
  24. Sun, M.; Xuan, Y.; Liu, G.Y.; Liu, Y.L.; Zhang, F.; Ren, J.F.; Chen, M.N. Anomalous magnetic behaviors of double perovskite R2CrFeO6 (R = rare earth elements) predicted by first-principles calculations. J. Magn. Magn. Mater. 2020, 504, 166670. [Google Scholar] [CrossRef]
  25. Zhu, Y.Y.; Dong, S.; Zhang, Q.F.; Yunoki, S.; Wang, Y.G.; Liu, J.M. Tailoring magnetic orders in (LaFeO3)n–(LaCrO3)n superlattices model. J. Appl. Phys. 2011, 110, 053916. [Google Scholar] [CrossRef]
  26. Larson, A.C.; Von Dreele, R.B. General Structure Analysis System (GSAS); Los Alamos National Laboratory Report LAUR; Los Alamos National Laboratory: Los Alamos, NM, USA, 2004; pp. 86–748.
  27. Boudad, L.; Taibi, M.; Belayachi, A.; Abd-lefdil, M. Elaboration, characterization, and giant dielectric permittivity in solid state synthesized Fe half-doped LaCrO3 perovskite. Mater. Today Proc. 2022, 58, 1108. [Google Scholar] [CrossRef]
  28. Bindu, G.H.; Kammara, V.; Prilekha, S.; Swetha, K.; Laxmi, Y.K.; Veerasomaiah, P.; Vithal, M. Preparation, characterization and photocatalytic studies of LaAl0.5Fe0.5O3, LaAl0.5Cr0.5O3 and LaCr0.5Fe0.5O3. J. Mol. Struct. 2023, 1273, 134220. [Google Scholar] [CrossRef]
  29. Lufaso, M.; Woodward, P. Prediction of the crystal structures of perovskites using the software program SPuDS. Acta Crystallogr. B 2002, 57, 725. [Google Scholar] [CrossRef] [PubMed]
  30. Coey, J.M.D.; Viret, M.; von Molnár, S. Mixed-Valence Manganite. Adv. Phys. 1999, 48, 167. [Google Scholar] [CrossRef]
  31. Klug, H.P.; Aleksander, L.E. X-ray Diffraction Procedures for Polycrystalline and Amorphous Materials; Willey: New York, NY, USA, 1974. [Google Scholar]
  32. Lakshmi, R.; Bera, P.; Hiremath, M.; Dubey, V.; Kundu, A.K. Barshilia, Structural, magnetic, and dielectric properties of solution combustion synthesized LaFeO3, LaFe0.9Mn0.1O3, and LaMnO3 perovskites. Phys. Chem. Chem. Phys. 2022, 24, 5462. [Google Scholar] [CrossRef]
  33. Zarrin, N.; Husain, S.; Khan, W.; Manzoor, S. Sol-gel derived cobalt doped LaCrO3: Structure and physical properties. J. Alloy Compd. 2019, 784, 541. [Google Scholar] [CrossRef]
  34. Lam, D.J.; Veal, B.W.; Ellis, D.E. Electronic structure of lanthanum perovskites with 3d transition elements. Phys. Rev. B 1980, 22, 5730. [Google Scholar] [CrossRef]
  35. Moulder, J.F.; Stickle, W.F.; Sobol, P.E.; Bomben, K.D. Handbook of X-ray Photoelectron Spectroscopy: A Reference Book of Standard Spectra for Identification and Interpretation of XPS Data; Chastain, J., Ed.; Physical Electronics Division, Perkin-Elmer Corporation: Eden Prairie, MN, USA, 1992; p. 140. [Google Scholar]
  36. Coutinho, P.V.; Moreno, N.O.; Ochoa, E.A.; da Costa, M.E.H.M.; Barrozo, P. Magnetization reversal in orthorhombic Sr-doped LaFe0.5Cr0.5O3−δ. J. Phys. Condens. Matter. 2018, 30, 235804. [Google Scholar] [CrossRef] [PubMed]
  37. Rida, K.; Benabbas, A.; Bouremmad, F.; Peña, M.A.; Sastre, E.; Martínez-Arias, A. Magnetization reversal in orthorhombic Sr-doped LaFe0.5Cr0.5O3−δ. Appl. Catal. A General. 2007, 327, 173. [Google Scholar] [CrossRef]
  38. Zhang, B.; Zhao, Q.; Chang, A.; Li, Y.; Liu, Y.; Wu, Y. Electrical conductivity anomaly and X-ray photoelectron spectroscopy investigation of YCr1−xMnxO3 negative temperature coefficient ceramics. Appl. Phys. Lett. 2014, 104, 102109. [Google Scholar] [CrossRef]
  39. He, H.; Lin, X.; Li, S.; Wu, Z.; Gao, J.; Wu, J.; Wen, W.; Ye, D.; Fu, M. The key surface species and oxygen vacancies in MnOx(0.4)-CeO2 toward repeated soot oxidation. Appl. Catal. B Environ. 2018, 223, 134. [Google Scholar] [CrossRef]
  40. Ji, D.X.; Fan, L.; Tao, L.; Sun, Y.J.; Li, M.G.; Yang, G.R.; Tran, T.Q.; Ramakrishna, S.; Guo, S.J. The Kirkendall effect for engineering oxygen vacancy of hollow Co3O4 nanoparticles toward high performance portable zinc-air batteries. Angew. Chem. Int. Ed. 2019, 131, 13978. [Google Scholar] [CrossRef]
  41. Doi, Y.; Hinatsu, Y. Crystal structures and magnetic properties of ordered perovskites Sr2LnRuO6 (Ln = Eu-Lu). J. Phys. Condens. Matter. 1999, 11, 4813. [Google Scholar] [CrossRef]
  42. Cullity, B.D.; Graham, C.D. Introduction to Magnetic Materials, 2nd ed.; IEEE Press: Piscataway, NJ, USA, 2009; pp. 325–326. [Google Scholar]
  43. Hu, W.W.; Chen, Y.; Yuan, H.M.; Zhang, G.H.; Li, G.H.; Pang, G.S.; Feng, S.H. Hydrothermal synthesis, characterization and composition-dependent magnetic properties of LaFe1−xCrxO3 system (0 ≤ x ≤ 1). J. Solid State Chem. 2010, 183, 1582. [Google Scholar] [CrossRef]
  44. Ateia, E.E.; Gawad, D.; Mosry, M.; Arman, M.M. Synthesis and functional properties of La2FeCrO6 based nanostructures. J. Inorg. Organomet. Polym. Mater. 2023, 33, 2698–2709. [Google Scholar] [CrossRef]
  45. Ederer, C.; Spaldin, N.A. Weak ferromagnetism and magnetoelectric coupling in bismuth ferrite. Phys. Rev. B 2005, 71, 060401. [Google Scholar] [CrossRef]
  46. Mao, Y.B.; Parsons, J.; McCloy, J.S. Magnetic properties of double perovskite La2BMnO6 (B = Ni or Co) nanoparticles. Nanoscale 2013, 5, 4720. [Google Scholar] [CrossRef] [PubMed]
  47. Griffiths, R.B. Nonanalytic behavior above the critical point in a random Ising ferromagnet. Phys. Rev. Lett. 1069, 23, 17. [Google Scholar] [CrossRef]
  48. Bray, A.J. Nature of the Griffiths phase. Phys. Rev. Lett. 1987, 59, 586. [Google Scholar] [CrossRef] [PubMed]
  49. Neto, A.H.C.; Castilla, G.; Jones, B.A. Non-fermi liquid behavior and Griffiths phase in f-electron compounds. Phys. Rev. Lett. 1998, 81, 353. [Google Scholar]
  50. Boudad, L.; Taibi, M.; Belayachi, W.; Sajieddine, M.; Abd-Lefdi, M. High temperature dielectric investigation, optical and conduction properties of GdFe0.5Cr0.5O3 perovskite. J. Appl. Phys. 2020, 127, 174103. [Google Scholar] [CrossRef]
  51. Castro-Couceiro, A.; Yáñez-Vilar, S.; Sánchez-Andújar, M.; Rivas-Murias, B.; Rivas, J.; Señarís-Rodríguez, M.A. Maxwell-Wagner relaxation in the CaMn7O12 perovskite. Prog. Solid State Chem. 2007, 35, 379. [Google Scholar] [CrossRef]
  52. Guiffard, B.; Boucher, E.; Eyraud, L.; Lebrun, L.; Guyomar, D. Influence of donor co-doping by niobium or fluorine on the conductivity of Mn doped and Mg doped PZT ceramics. J. Eur. Ceram. Soc. 2005, 25, 2487. [Google Scholar] [CrossRef]
  53. Pei, Z.P.; Leng, K.; Xia, W.R.; Lu, Y.; Wu, H.; Zhu, X.H. Structural characterization, dielectric, magnetic, and optical properties of double perovskite Bi2FeMnO6 ceramics. J. Magn. Magn. Mater. 2020, 508, 166891. [Google Scholar] [CrossRef]
  54. Viret, M.; Ranno, L.; Coey, J. Colossal magnetoresistance of the variable range hopping regime in the manganites. J. Appl. Phys. 1997, 81, 4964. [Google Scholar] [CrossRef]
  55. Huang, X.X.; Tang, X.G.; Xiong, X.M.; Jiang, Y.P.; Liu, Q.X.; Zhang, T.F. The dielectric anomaly and pyroelectric properties of sol-gel derived (Pb,Cd,La)TiO3 ceramics. J. Mater. Sci. Mater. Electron. 2015, 26, 3174. [Google Scholar] [CrossRef]
  56. Mott, N.F. Metal-Insulator Transitions, 2nd ed.; Taylor and Francis: New York, NY, USA, 1997. [Google Scholar]
  57. Qadir, I.; Sharma, S.; Manhas, U.; Atri, A.K.; Singh, S.; Singh, D. A new Ruddlesden-Popper oxide LaSr3Mn1.5Fe1.5O9.71 as photocatalyst for degrading highly toxic dyes in waste water: Structural, magnetic and transport properties. J. Solid State Chem. 2023, 2317, 123675. [Google Scholar] [CrossRef]
  58. Emin, D.; Holstein, T. Studies of small-polaron motion IV. Adiabatic theory of the Hall effect. Ann. Phys. 1969, 53, 439. [Google Scholar] [CrossRef]
  59. Kobayashi, K.I.; Kimura, T.; Tomioka, Y.; Sawada, H.; Terakura, K.; Tokura, Y. Intergrain tunneling magnetoresistance in polycrystals of the ordered double perovskite Sr2FeReO6. Phys. Rev. B 1999, 59, 11159. [Google Scholar] [CrossRef]
  60. Kato, H.; Okuda, T.; Okimoto, Y.; Tomioka, Y.; Oikawa, K.; Kamiyama, T.; Tokura, Y. Structural and electronic properties of the ordered double perovskites A2MReO6 (A = Sr, Ca; M = Mg, Sc, Cr, Mn, Fe, Co, Ni, Zn). Phys. Rev. B 2004, 69, 184412. [Google Scholar] [CrossRef]
  61. Tang, Q.K.; Zhu, X.H. Structural and physical properties of Sr-based 3d–5d double perovskites of Sr2Fe0.5Hf1.5O6−δ oxides. J. Am. Ceram. Soc. 2023, 106, 6801. [Google Scholar] [CrossRef]
  62. Tang, Q.K.; Zhu, X.H. Microstructure and physical properties of Sr2CrHfO6 ferrimagnetic double-perovskite oxides. J. Am. Ceram. Soc. 2024, 107, 968. [Google Scholar] [CrossRef]
  63. Pal, S.; Govinda, S.; Goyal, M.; Mukherjee, S.; Pal, B.; Saha, R.; Sundaresan, A.; Jana, S.; Karis, O.; Freeland, J.W.; et al. Effect of anti-site disorder on magnetism in La2NiMnO6. Phys. Rev. B 2018, 97, 165137. [Google Scholar] [CrossRef]
  64. Moritomo, Y.; Shimamoto, N.; Xu, S.; Machida, A.; Nishibori, E.; Takata, M.; Sakata, M.; Nakamura, A. Effects of B-site disorder in Sr2FeMoO6 with double perovskite structure. J. Appl. Phys. 2001, 40, L672–L674. [Google Scholar] [CrossRef]
  65. Rogado, N.S.; Li, J.; Sleight, A.W.; Subramanian, M.A. Magnetocapacitance and magnetoresistance near room temperature in a ferromagnetic semiconductor: La2NiMnO6. Adv. Mater. 2005, 17, 2225–2227. [Google Scholar] [CrossRef]
  66. Taguchi, H. Relationship between crystal structure and electrical properties of Nd(Cr1−xFex)O3. J. Solid State Chem. 1997, 131, 108–114. [Google Scholar] [CrossRef]
  67. Buschow, K.H.J.; Boer, F.R. Physics of Magnetism and Magnetic Materials; Springer: Berlin/Heidelberg, Germany, 2003. [Google Scholar]
Figure 1. Comparison between the experimental XRD pattern and Rietveld refined profile for the LFCO powders at RT. The experimental data are denoted by cross marks, and the Rietveld refined profile is represented by a red solid line. Vertical green sticks mark the positions of allowed Bragg reflections.
Nanomaterials 13 03132 g001
Figure 2. (a) Low-magnification SEM image of the LFCO powders. Inset is an enlarged SEM image. (b) Histogram of the LFCO particle size distribution. (c) EDS spectrum acquired in a mapping mode from the LFCO powders.
Nanomaterials 13 03132 g002
Figure 3. FTIR spectrum of the LFCO powders.
Nanomaterials 13 03132 g003
Figure 4. XPS spectra of (a) survey scan, and (be) high-resolution scan of La 3d, Fe 2p3/2, Cr 2p3/2, and O 1s for the LFCO powders.
Nanomaterials 13 03132 g004
Figure 5. (a) M-H hysteresis loops of the LFCO powders measured at temperatures of 5 K and 300 K. Inset is the local M-H hysteresis loop recorded at 5 K. (b) Plot of M(H) vs. 1/ H curve to extract the MS value of the powders by the law of approach to saturation. (c) Magnetizations (M) of the LFCO powders measured as a function of temperature measured in ZFC and FC protocols, and (d) magnetic inverse susceptibilities (χ−1) with respect to the temperature under a magnetic field of 500 Oe. Inset in (c) represents the plots of dMZFC/dT vs. T and dMFC/dT vs. T.
Nanomaterials 13 03132 g005
Figure 6. (a) Frequency dependence of dielectric constant (εr) and dielectric loss (tanδ) of the LFCO ceramics measured at RT. (b,c) Temperature-dependent εr and tanδ of the LFCO ceramics measured a series of frequencies. Arrows in (b,c) show the direction of the frequency increasing. Inset in (c) represents tanδT curves between 180 K and 280 K. (d) Plot of Lnω vs. 1000/T for the LFCO ceramics at low-temperature region.
Nanomaterials 13 03132 g006
Figure 7. (a) The resistivity, Lnρ(T), of the LFCO ceramics measured as a function of temperature from 2 K to 800 K without applying magnetic field, and the plot of dρ/dT as a function of the temperature. (b) Ln(ρ) as a function of (1000/T)1/4 between 350 and 683 K. (c) Ln(ρ) as a function of 1000/T between 275 K and 350 K. (d) Ln(ρ/T) as a function of 1000/T between 15 K and 77 K, displaying two linear fitting regions, I (30–77 K) and II (15–30 K), respectively. Solid lines denote the linear fittings to the experimental data. (e,f) MR-H curves of the LFCO ceramics recorded at 5 K and 300 K, respectively.
Nanomaterials 13 03132 g007
Disclaimer/Publisher’s Note: The statements, opinions and data contained in all publications are solely those of the individual author(s) and contributor(s) and not of MDPI and/or the editor(s). MDPI and/or the editor(s) disclaim responsibility for any injury to people or property resulting from any ideas, methods, instructions or products referred to in the content.

