Abstract
Highly microporous adsorbents have been under considerable scrutiny for efficient adsorptive storage of H2. Of specific interest are sustainable, chemically activated, microporous carbon adsorbents, especially from renewable and organic precursor materials. In this article, six peat-derived microporous carbon materials were synthesized by chemical activation with ZnCl2. N2 and CO2 gas adsorption data were measured and simultaneously fitted with the 2D-NLDFT-HS model. Thus, based on the obtained results, the use of a low ratio of ZnCl2 for chemical activation of peat-derived carbon yields highly ultramicroporous carbons which are able to adsorb up to 83% of the maximal adsorbed amount of adsorbed H2 already at 1 bar at 77 K. This is accompanied by the high ratio of micropores, 99%, even at high specific surface area of 1260 m2 g−1, exhibited by the peat-derived carbon activated at 973 K using a 1:2 ZnCl2 to peat mass ratio. These results show the potential of using low concentrations of ZnCl2 as an activating agent to synthesize highly ultramicroporous carbon materials with suitable pore characteristics for the efficient low-pressure adsorption of H2.
1. Introduction
Hydrogen is important for many industrial applications: it is needed as a precursor for synthesis of ammonia and fertilizers, in metal refinement, pharmaceuticals, and, in recent decades, it has been regarded as a possible replacement to traditional fossil fuels as a renewable energy-based energy carrier [1,2,3]. When compared to fossil fuels, it has a higher gravimetric energy density (120 MJ kg−1 for H2, ~45 MJ kg−1 for petrol), and, upon oxidization in a fuel cell, does not generate CO2, NOx, or SOx compounds into the atmosphere, which are serious greenhouse gases and/or toxic to humans and other living organisms. Owing to these reasons, methods for hydrogen storage are currently under considerable scrutiny [3,4]. While the traditional method of hydrogen storage in pressurized vessels is widely used, it does not come without problems. Hydrogen is not easily compressible, and the high leakage risk that comes with its small molecular size and H2 embrittlement of metals under high pressures both cause strict requirements for the storage vessels [4,5]. Even when pressurized to the current industry standard of 700 bar for mobile applications, H2 still retains a considerably lower volumetric energy density than gasoline (5.04 MJ dm−3 for H2 at 273 K vs. 31.68 MJ dm−3 for petrol).
For safe and highly efficient H2 storage, additional factors to energy density also need to be accounted for. The combination of operational temperature, pressure, and safety concerns due to physicochemical attributes of H2 create very specific storage needs for hydrogen. Currently, neither the technology for compressed or cryogenic storage is at a point where either could cost-effectively fill all probable use cases [4,6]. Cryo-adsorption hydrogen storage is a viable solution, utilizing both the benefits of cryogenic temperatures and pressurized storage with a porous adsorbent media for physical adsorption of H2 via van der Waals forces. Combined with a low density and high surface area adsorbent, there is potential for high gravimetric density hydrogen storage at relatively low costs. In the spotlight of this research for a viable adsorbent are carbon materials which are a versatile, low-cost candidate with highly tunable pore characteristics [7,8,9,10,11,12,13].
The synthesis of activated carbon materials and their potential applications have been studied extensively in the past by many research groups [9,11,12,13,14]. Activated carbon materials have a high specific surface area (SSA), which is critical for high hydrogen gravimetric densities [8,9,15]. In addition to the SSA, the exact size and geometry of pores play a significant role in the efficient adsorption of hydrogen [8,16,17,18,19,20,21,22]. Ultramicropores, more specifically pores in the width range of 0.6–0.7 nm, offer the highest hydrogen uptake per accessible surface area [8,9,16,19,23,24,25,26]. Pore geometry also plays an important role, as cylindrical and spherical mesopores are shown to help hydrogen confinement [16]. The effect of pore structure-impeding hydrogen diffusion is further advanced by corrugation of the pore walls [17]. Highly porous carbon materials with fine-tuned pore characteristics can be manufactured through several synthesis methods—e.g., by halogenation of carbides for preparation of carbide-derived carbons [8,16,18,27,28], templating inside ordered porous scaffold like a zeolite for zeolite-templated carbons [29,30,31,32], and pyrolysis of organic precursor materials with subsequent chemical and physical activation methods for activated carbons [11,12,13,14,33,34,35,36,37,38,39,40].
While many articles handling pyrolysis of different organic precursors into carbon materials [10,12,34,35,41,42,43,44,45] have been published, peat is a distinctly cheap and easily workable material that has been studied and shows good potential for pyrolysis into carbon materials with different characteristics [14,36,46,47,48,49,50,51]. ZnCl2 has been used for chemical activation previously by many groups [10,34,36,39,51,52,53], where both Varila et. al., [36] and Paalo et al. [51] showed that the ZnCl2-induced activation of peat precursor is able to yield high SSAs, of over 1200 m2 g−1, micro and mesoporous carbon materials. Here, we focus on low ZnCl2 concentrations to achieve a high ratio of microporosity and minimize the amount of activating compound used.
In this article, peat combined with ZnCl2 in six different mass ratios is used to synthesize activated carbon materials. The chemical composition of the resulting carbon materials is determined with X-ray fluorescence (XRF) and energy dispersive X-ray spectrometry (EDS), structure is determined scanning electron microscopy (SEM), crystalline impurity phases with X-ray diffraction (XRD), and porous structure properties are determined with N2 and CO2 adsorption method. The effectiveness of the used synthesis route for the production of a high SSA microporous carbon material with suitable H2 storage properties is investigated and verified by the beforementioned physical characterization methods. Peat is used as a precursor to add value to a relatively cheap and widely available natural resource in Estonia.
2. Materials and Methods
2.1. Synthesis
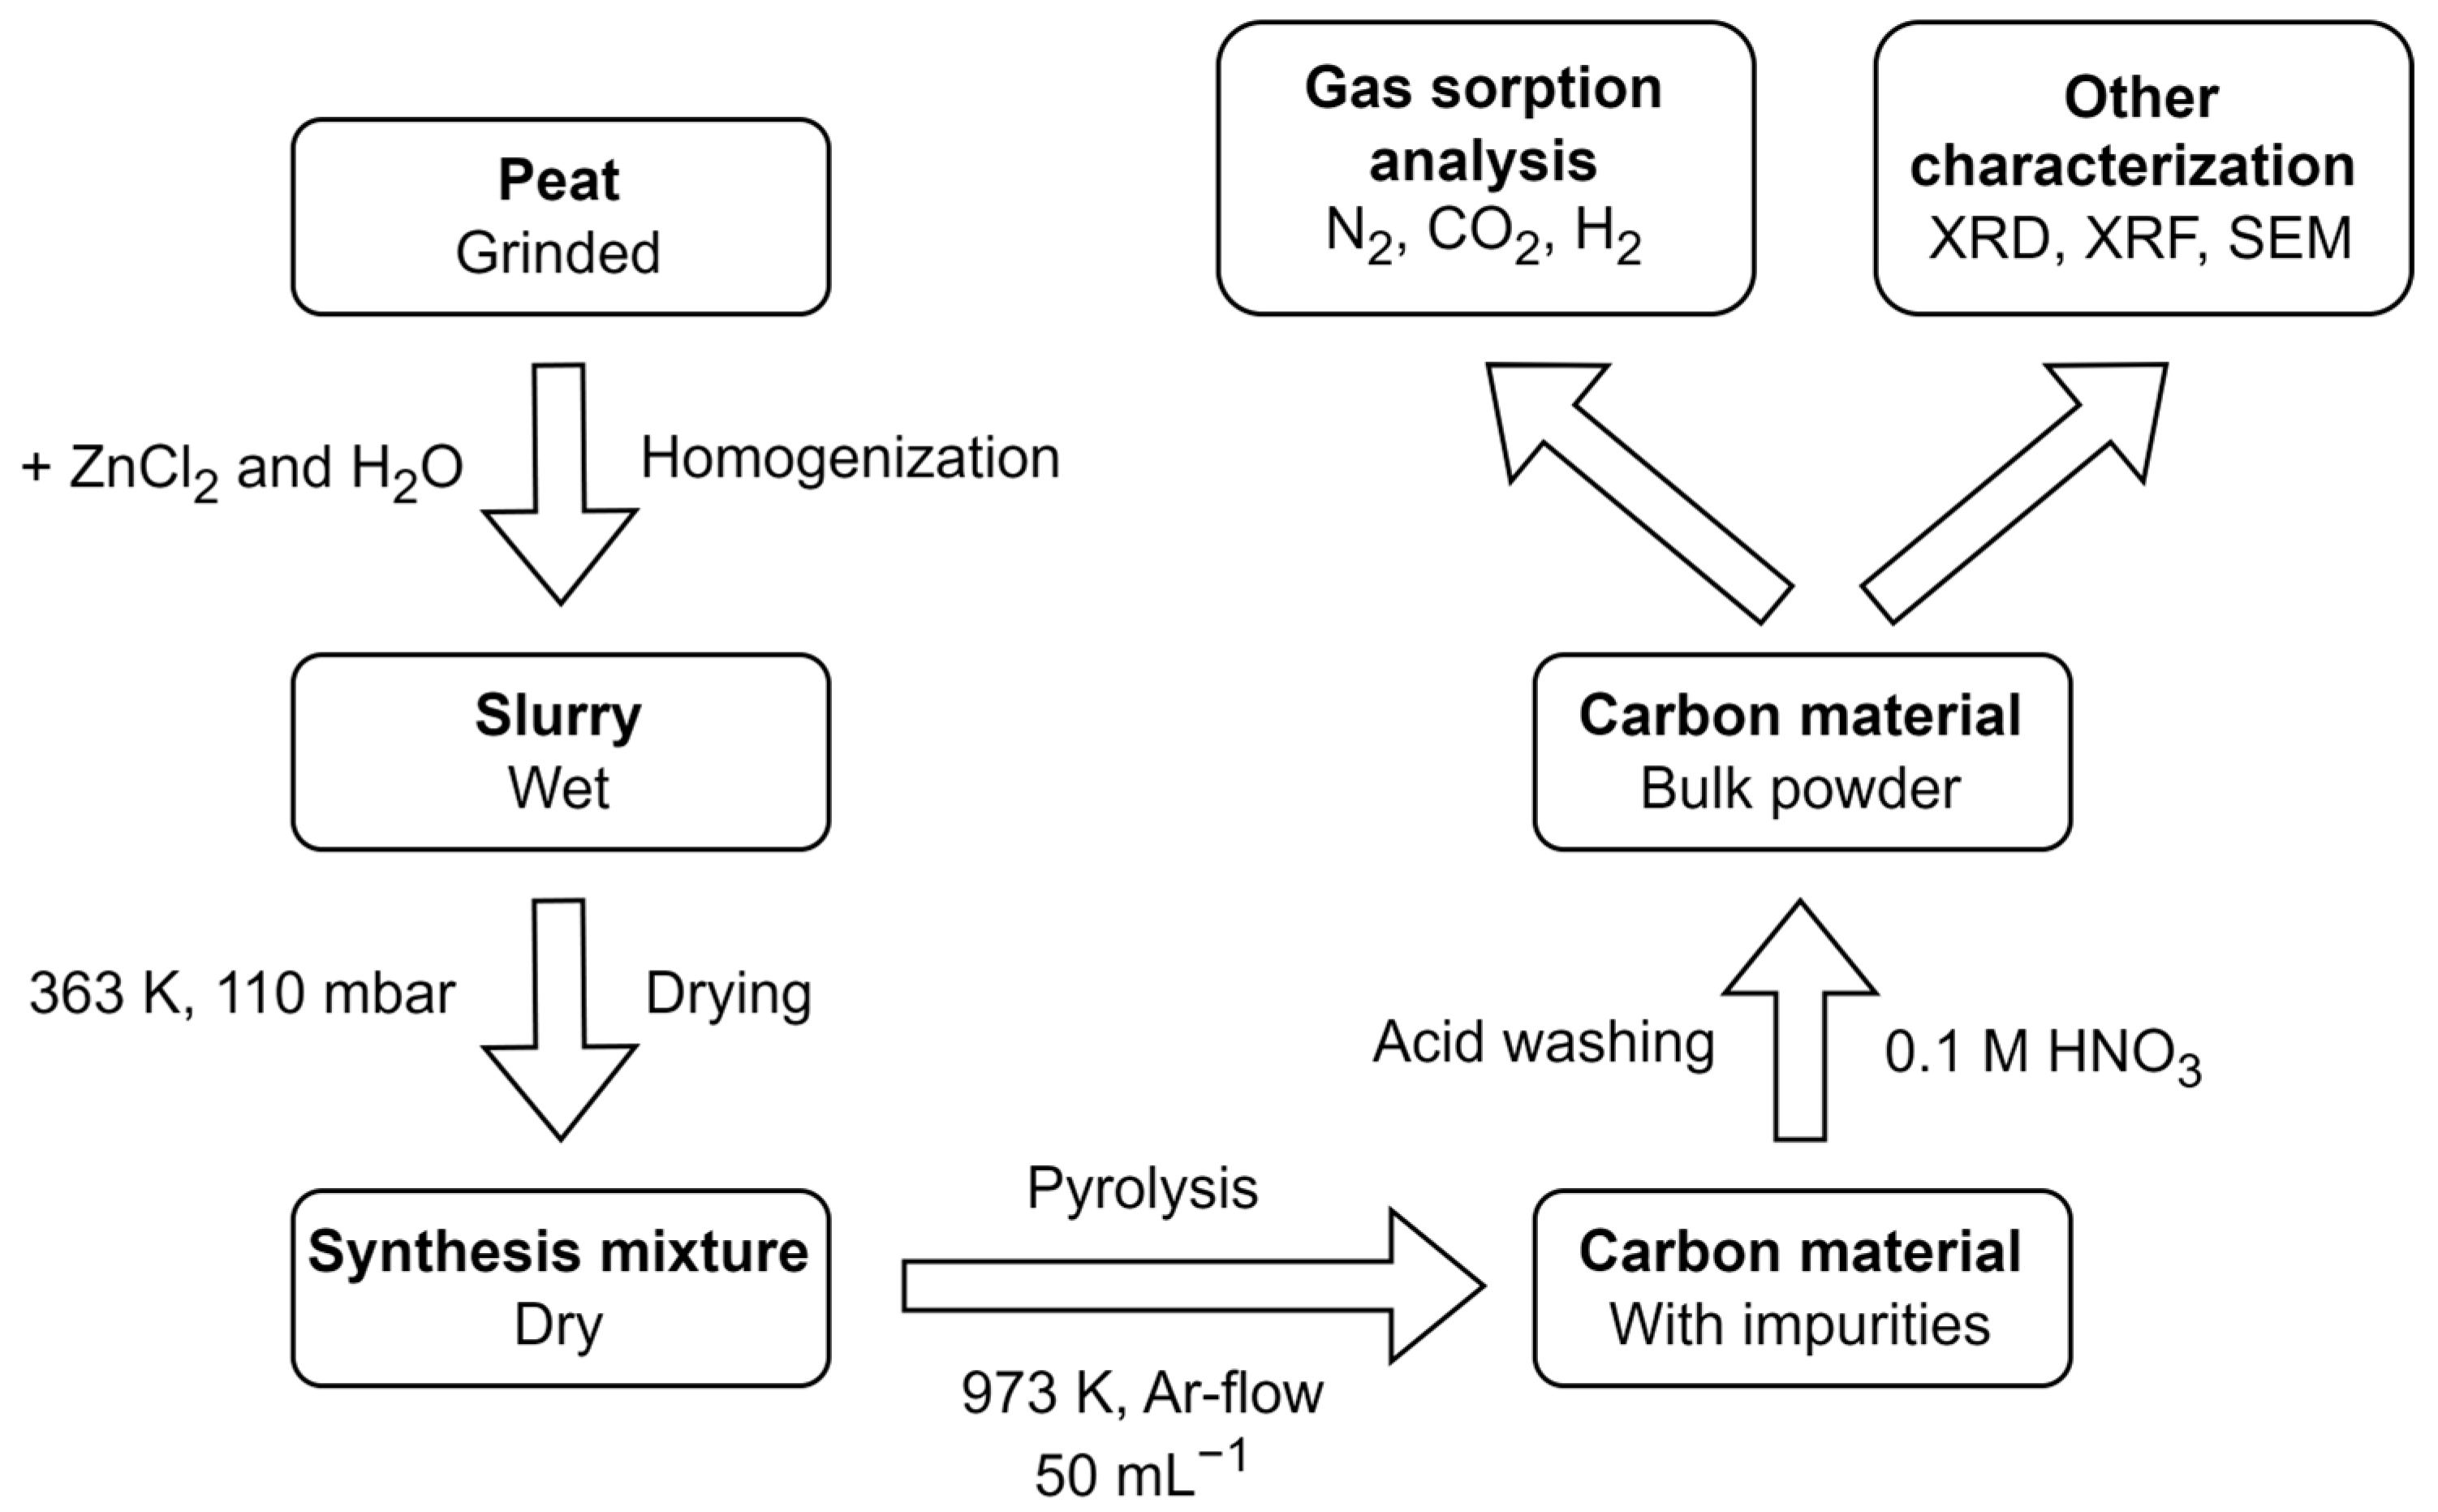
The main process steps for the synthesis and characterization of the peat derived activated carbon are shown in Figure 1. Peat from Möllatsi (Tartu County, Estonia) peat deposit and zinc chloride (ZnCl2, anhydrous, 99.7% purity, Sigma-Aldrich, Saint-Louis, MO, USA) were mixed in pre-determined mass ratios with ultrapure water (Milli-Q, 18.2 MΩ cm @ 298 K, Merck Millipore, Burlington, MA, USA) as the solvent, where around 7 mL of ultrapure water was added per g of combined peat and ZnCl2 mixture. The resulting slurry was stirred until homogenization. Milli-Q water was then evaporated on a hot plate at 360 K and additional drying of the slurry was performed overnight in a Vaciotem TV vacuum oven (J.P Selecta, Barcelona, Spain) at 100 mbar and 360 K. The dried synthesis mixture was transferred in a quartz crucible into a CTF 12/65/550 tube furnace (Carbolite, Derbyshire, UK). Temperature was ramped up 5 K min−1 to 973 K and held for 2 h, under a constant Ar gas flow (5.0, Linde, Dublin, Ireland). Synthesized carbon materials were put into a 250 mL flask with dilute 1 M solution of nitric acid (HNO3, ≥95%, Honeywell, Charlotte, NC, USA) and stirred on a hotplate for 24 h to remove inorganic impurities. Afterwards, the carbon materials were rinsed with Milli-Q water in the flask and strained through a Büchner funnel equipped with filter paper. The resulting carbon material was dried in a vacuum oven (100 mbar, 360 K) overnight, and weighed.
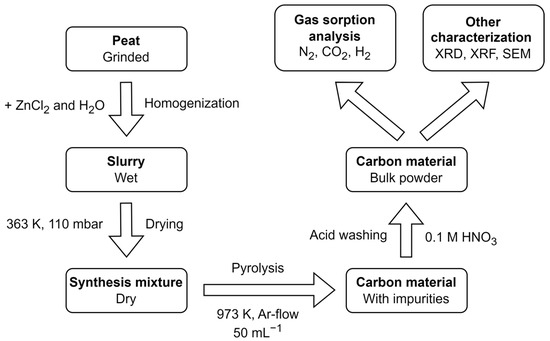
Figure 1.
Block scheme of the synthesis route.
2.2. Physical Characterisation
EVO MA 15 (Zeiss, Oberkochen, Germany) scanning electron microscope (SEM) with 20 kV of accelerating voltage was used to analyze the morphology of synthesized carbon materials. Oxford MAX80 (Oxford Instruments, Abingdon, UK) energy-dispersive X-ray spectrometer integrated into the SEM device was used to determine the presence of inorganic additives. X-ray diffraction (XRD) measurements were performed with a D8 Advance (Bruker, Billerica, MA, USA) X-ray diffractometer with LynxEye detector and with a Ni-filtered Cu Kα radiation source. XRDs of samples were measured in the 2θ range 10–90° with a step of 0.013° and a total step time of 172 s on a silicon monocrystal sample holder. For data analysis Diffrac Suite was used with the ICDD PDF4+ 2020 database [54]. Handheld X-ray fluorescence (XRF) spectrometer TRACER 5i (Bruker, Billerica, MA, USA) was used for semi-quantitative determination of select compounds and elements in the carbon material. Primary radiation from a Rh target with a counting time of 180 s was used for the XRF measurements.
2.3. Gas Adsorption and Porosity Characterisaion
Gas adsorption measurements with N2 (6.0, Linde, Dublin, Ireland) and CO2 (5.2, Linde, Dublin, Ireland) were performed with ASAP 2020 and 3Flex (Micromeritics, Norcross, GA, USA) gas sorption analyzers at 77 K and 273 K and up to p/p0 = 0.995 and p/p0 = 0.03, respectively. The samples were degassed before measurements at 573 K and under a vacuum of at least 8 μbar for at least 24 h. Brunauer–Emmett–Teller (BET) theory was used for calculation of SSA [55], and two-dimensional non-local density functional theory for heterogeneous surface (2D-NLDFT-HS) model for carbon materials was used to calculate the pore size distributions (PSD) from simultaneous fitting to N2 and CO2 isotherm data from which SSA, denoted as SDFT, and pore volumes, VDFT, for different pore sizes were obtained [56,57]. SSA of micropores, denoted as Smicro, is calculated as the cumulative surface area up to pore width w value of 2 nm. Volume of micropores, Vmicro, and volume of ultramicropores, V0.8nm, are calculated as the cumulative pore volume of pores with widths up to 2 nm and 0.8 nm, respectively.
H2 (5.0, Linde, Dublin, Ireland) adsorption measurements of all investigated samples were performed with ASAP 2020 (Micromeritics, Norcross, GA, USA) gas adsorption analyzer at 77 K and up to p = 1200 mbar. The samples were degassed before measurements at 573 K and under a vacuum of at least 8 μbar for at least 24 h. The Sips isotherm equation (Equation (1)) was used to fit the H2 adsorption data [58].
where np is the amount of adsorbed gas at pressure p, nmax is the maximum amount of adsorbed gas, b is the equilibrium constant, and x is a parameter describing the heterogeneity of the adsorbate–adsorbent system, where x = 1 characterizes an energetically homogenous adsorption system. All samples were degassed at 573 K and under a vacuum of 16 μbar for at least 12 h prior to gas adsorption measurements.
3. Results
A total of six peat-derived activated carbon (PDAC) materials were synthesized with different ZnCl2 to peat mass ratios in the initial synthesis mixture (Table 1).

Table 1.
Synthesized peat-derived carbons (PDAC) main primary characteristics for quick guidance. The x in PDAC-x is the ZnCl2 to peat mass ratio.
3.1. Physical Characterization
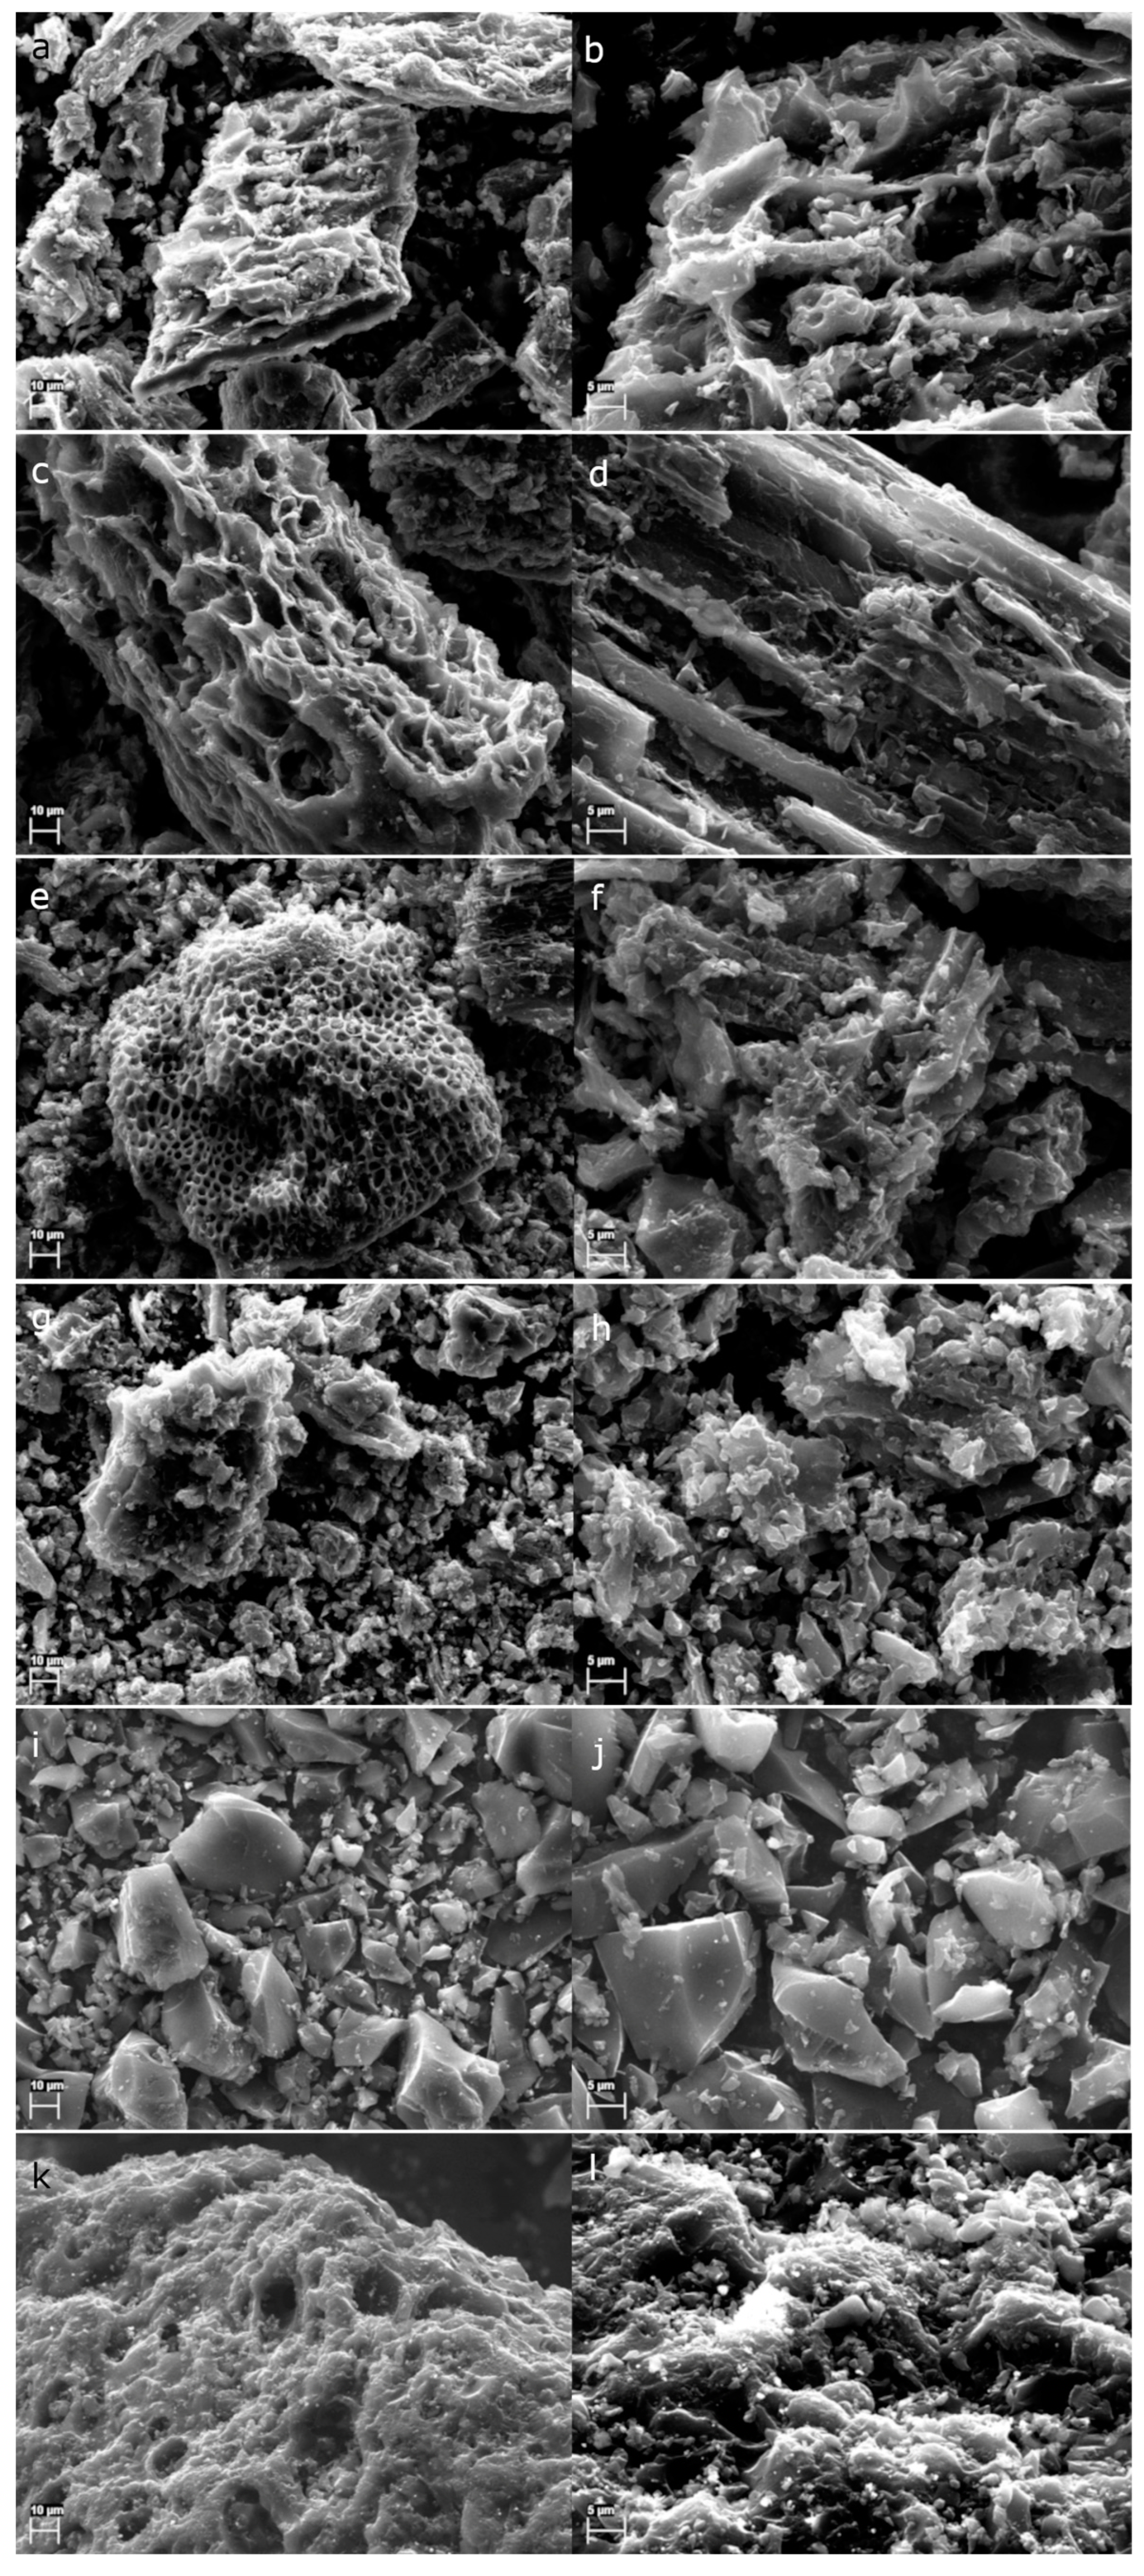
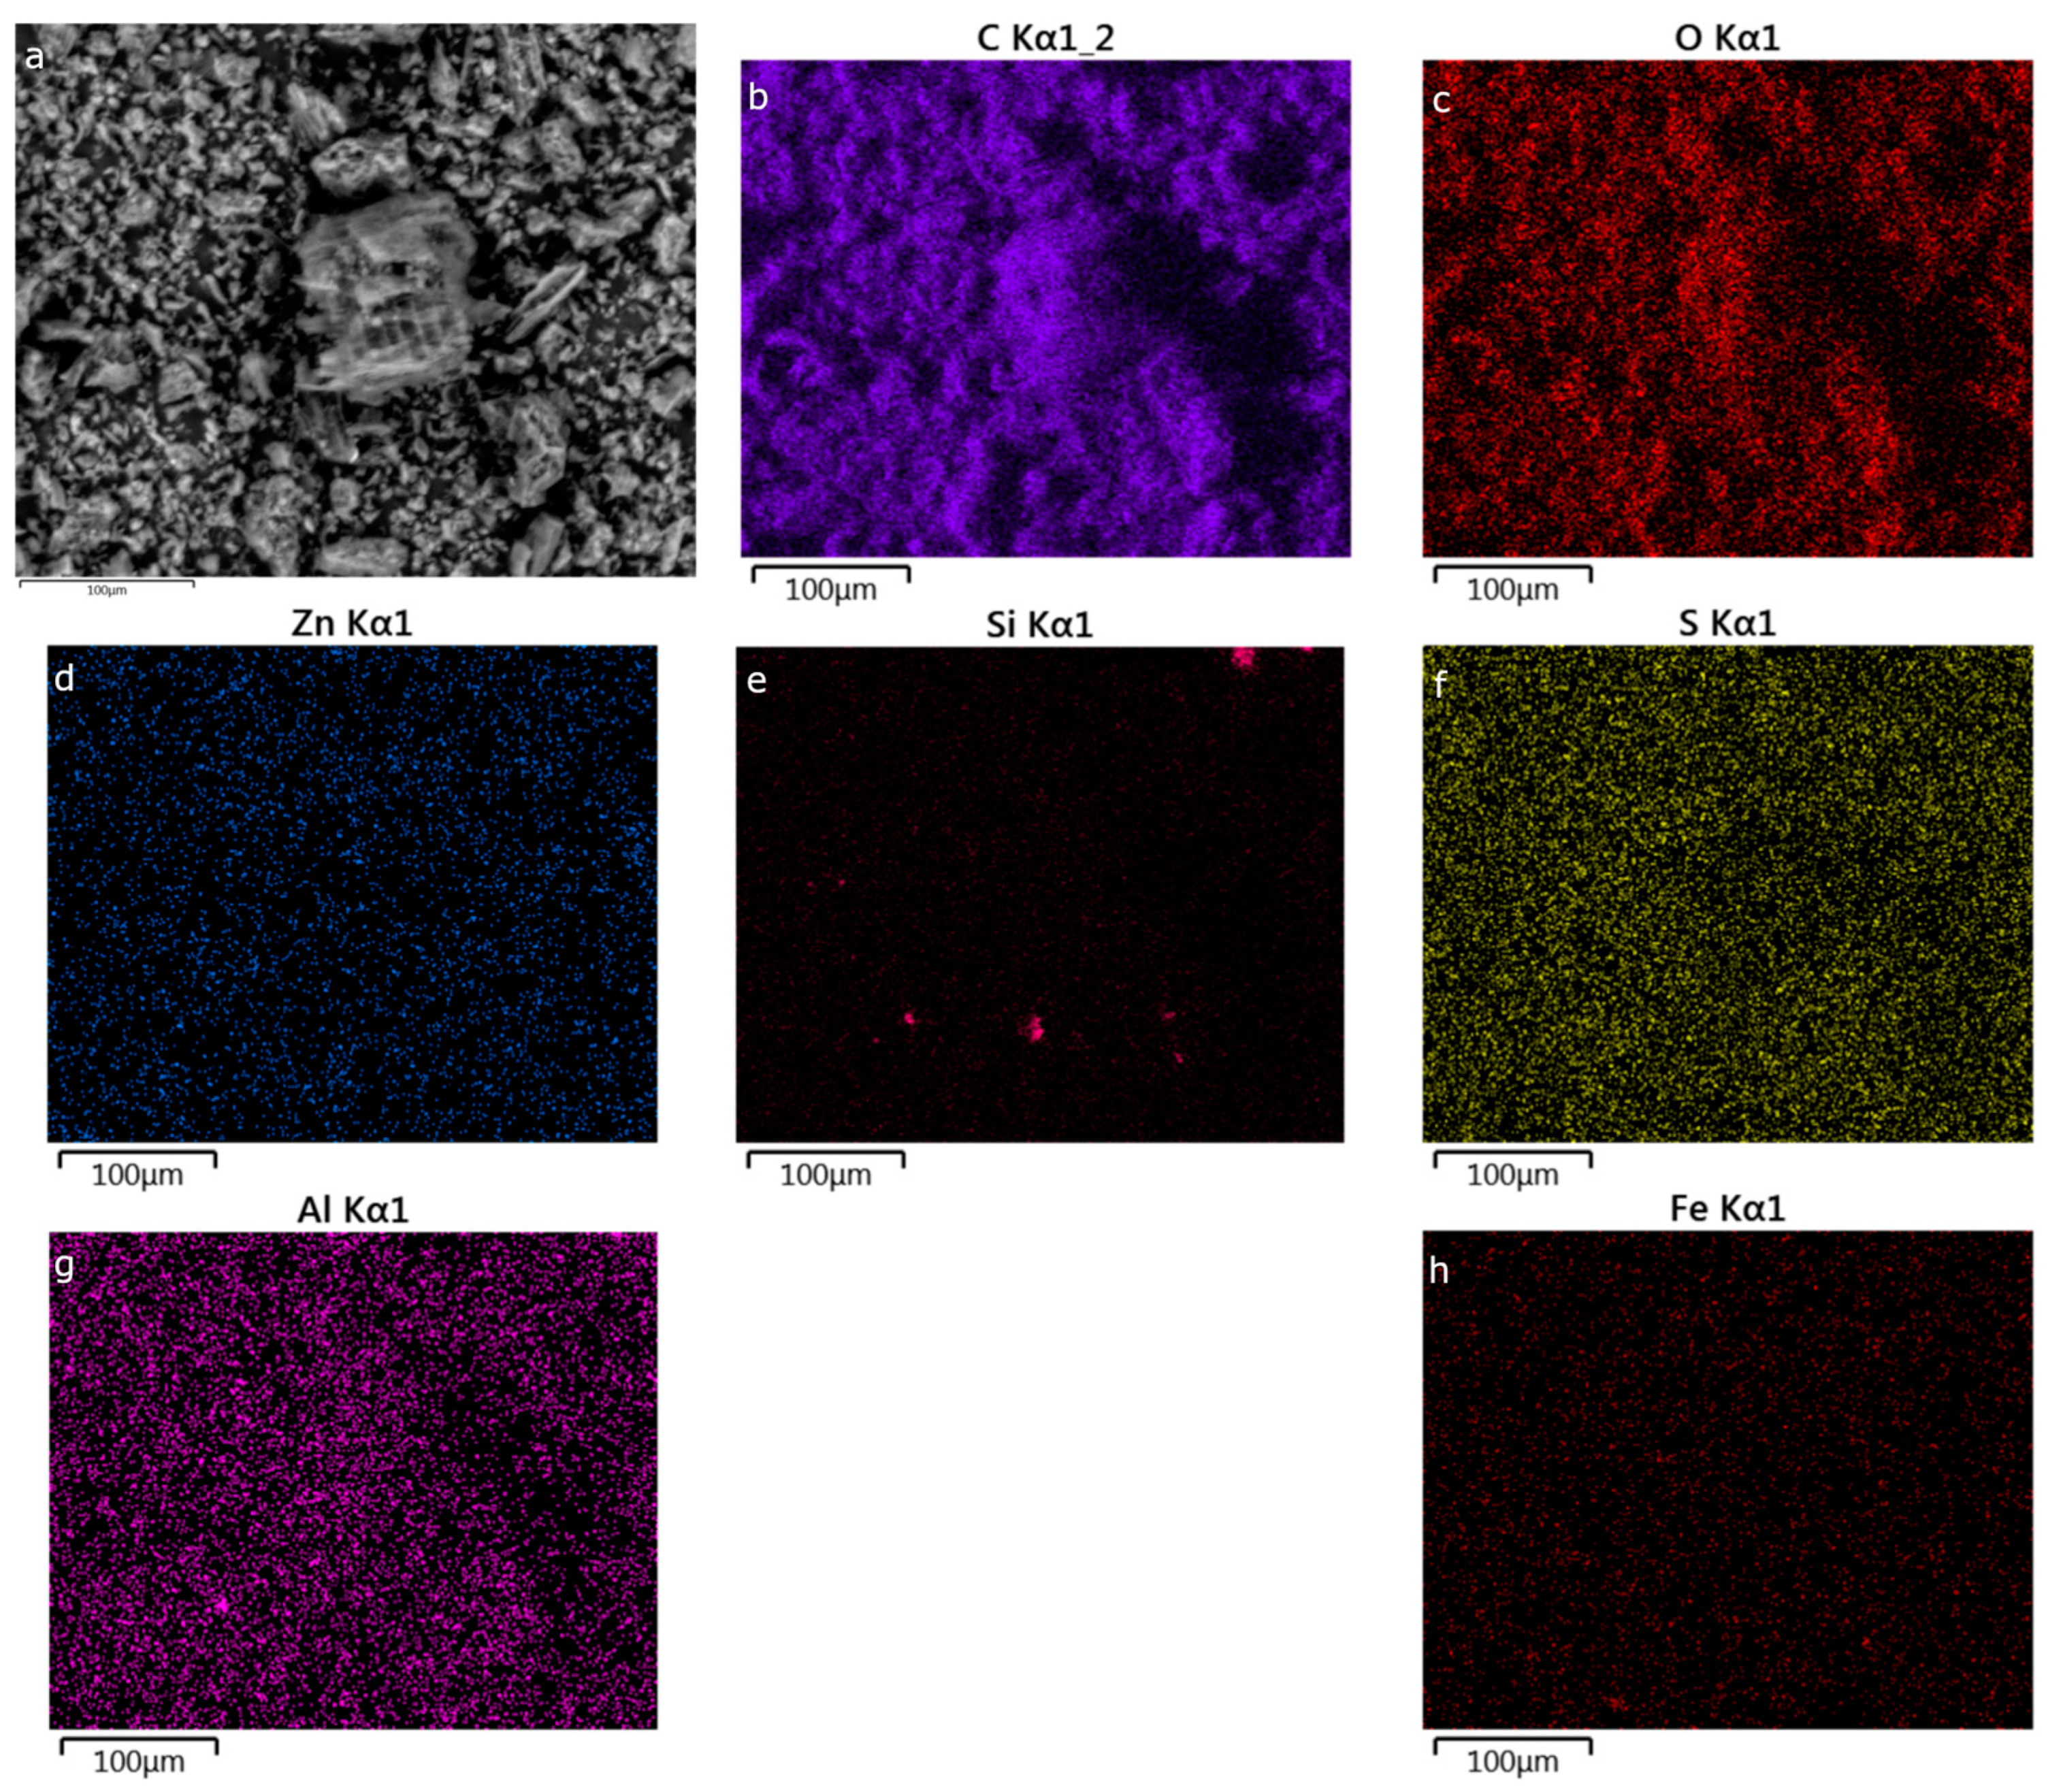
Scanning electron microscopy (SEM) revealed that all carbon materials had a heterogenous surface microstructure (Figure A1 in Appendix A). Some structures resembling plant matter were imaged (Figure A1a–d) as the original macroscopic intercellular plant structure is retained and which falls in line with other published SEM images of carbonized plant matter [59,60]. Carbon particles in the size range of 1–15 μm were predominant, with some outlying anomalies of structures sized up to 100 μm. Generally, a spatially uniform distribution of impurities (Figure 2, Figure A2, Figure A3, Figure A4, Figure A5 and Figure A6 in Appendix B) was shown with energy-dispersive X-ray spectroscopy (EDS). The main exception is Si, which is present in all samples as small particles with a width of a few tens of μm. PDAC-2 and PDAC-1 are also outliers, with more concentrated sites of Zn, Al, Si, and S corresponding to small particles (Figure A2 and Figure A3). EDS spectra of all PDACs are brought in Appendix C.
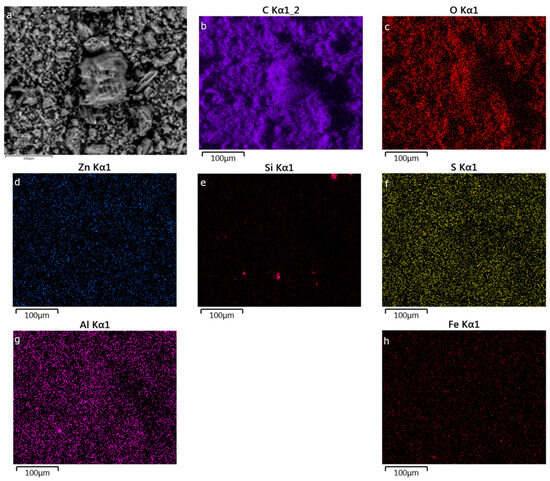
Figure 2.
SEM-EDS results of PDAC-0.1 depicting the original SEM image (a) and the elemental mapping results of the same location for C, O, Zn, Si, S, Al, and Fe (images (b–h), respectively).
XRF (Figure 3a) and XRD (Figure 3b) were used to further investigate the presence of non-carbon elements and crystalline phases considered as impurities. Several inorganic impurity phases were detected by XRD for all samples (Figure 3b). Diffraction peaks caused by ZnO were the most intense for PDAC with ZnCl2 to peat ratio ≤ 0.2. Most intense diffraction peaks corresponding to ZnO were measured in PDAC-0.1, PDAC-0.15, and PDAC-0.2, while other samples exhibited the same diffraction peaks at a much lower intensity. The diffraction peak intensity from ZnS was almost equivalent in all PDAC samples. Diffraction peaks characteristic to SiO2, Fe3O4, and MgO crystalline phases were determined in all samples (Figure 3b). No clear dependency between non-ZnO crystalline phases and the synthesis conditions was determined. PDAC-2 presented itself as an outlier in the series yielding more intense diffraction peaks than PDAC-1 and PDAC-0.5 for SiO2, Fe3O4, and MgO. XRF quantitative results show that PDAC-0.1, PDAC-0.15, and PDAC-0.2 contain relatively high amounts of impurities (Figure 3a, Table 1). PDAC-0.1 exhibits Zn, Fe, Cl, and Ca in amounts over 1 mass%. PDAC-0.15 and PDAC-0.2 yield similar results from XRF, with non-carbon elements making up around or in excess of 1 mass%. PDAC-0.5, PDAC-1, and PDAC-2 present a noticeably lower mass of different impurities, with only Fe content being around 1 mass%. Fe, Al, Si, and S compounds have been shown to be naturally occurring in peat soils [61], which correlates to the results derived from physical characterization of PDAC samples.
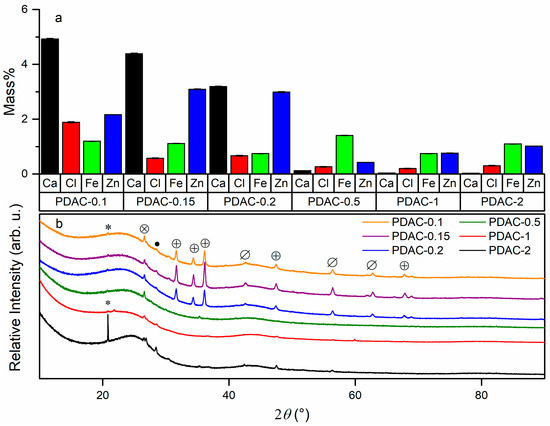
Figure 3.
X-ray fluorescence results for select elements (a) and diffractograms of all carbon samples (b). *, ● and Ø mark diffractogram peaks for SiO2, Fe3O4, and MgO, respectively. ⊗ and ⊕ represent peaks for ZnS and ZnO, respectively. The XRD patterns have been shifted up for better separation and visualization.
3.2. Specific Surface Area and Pore Size Distributions
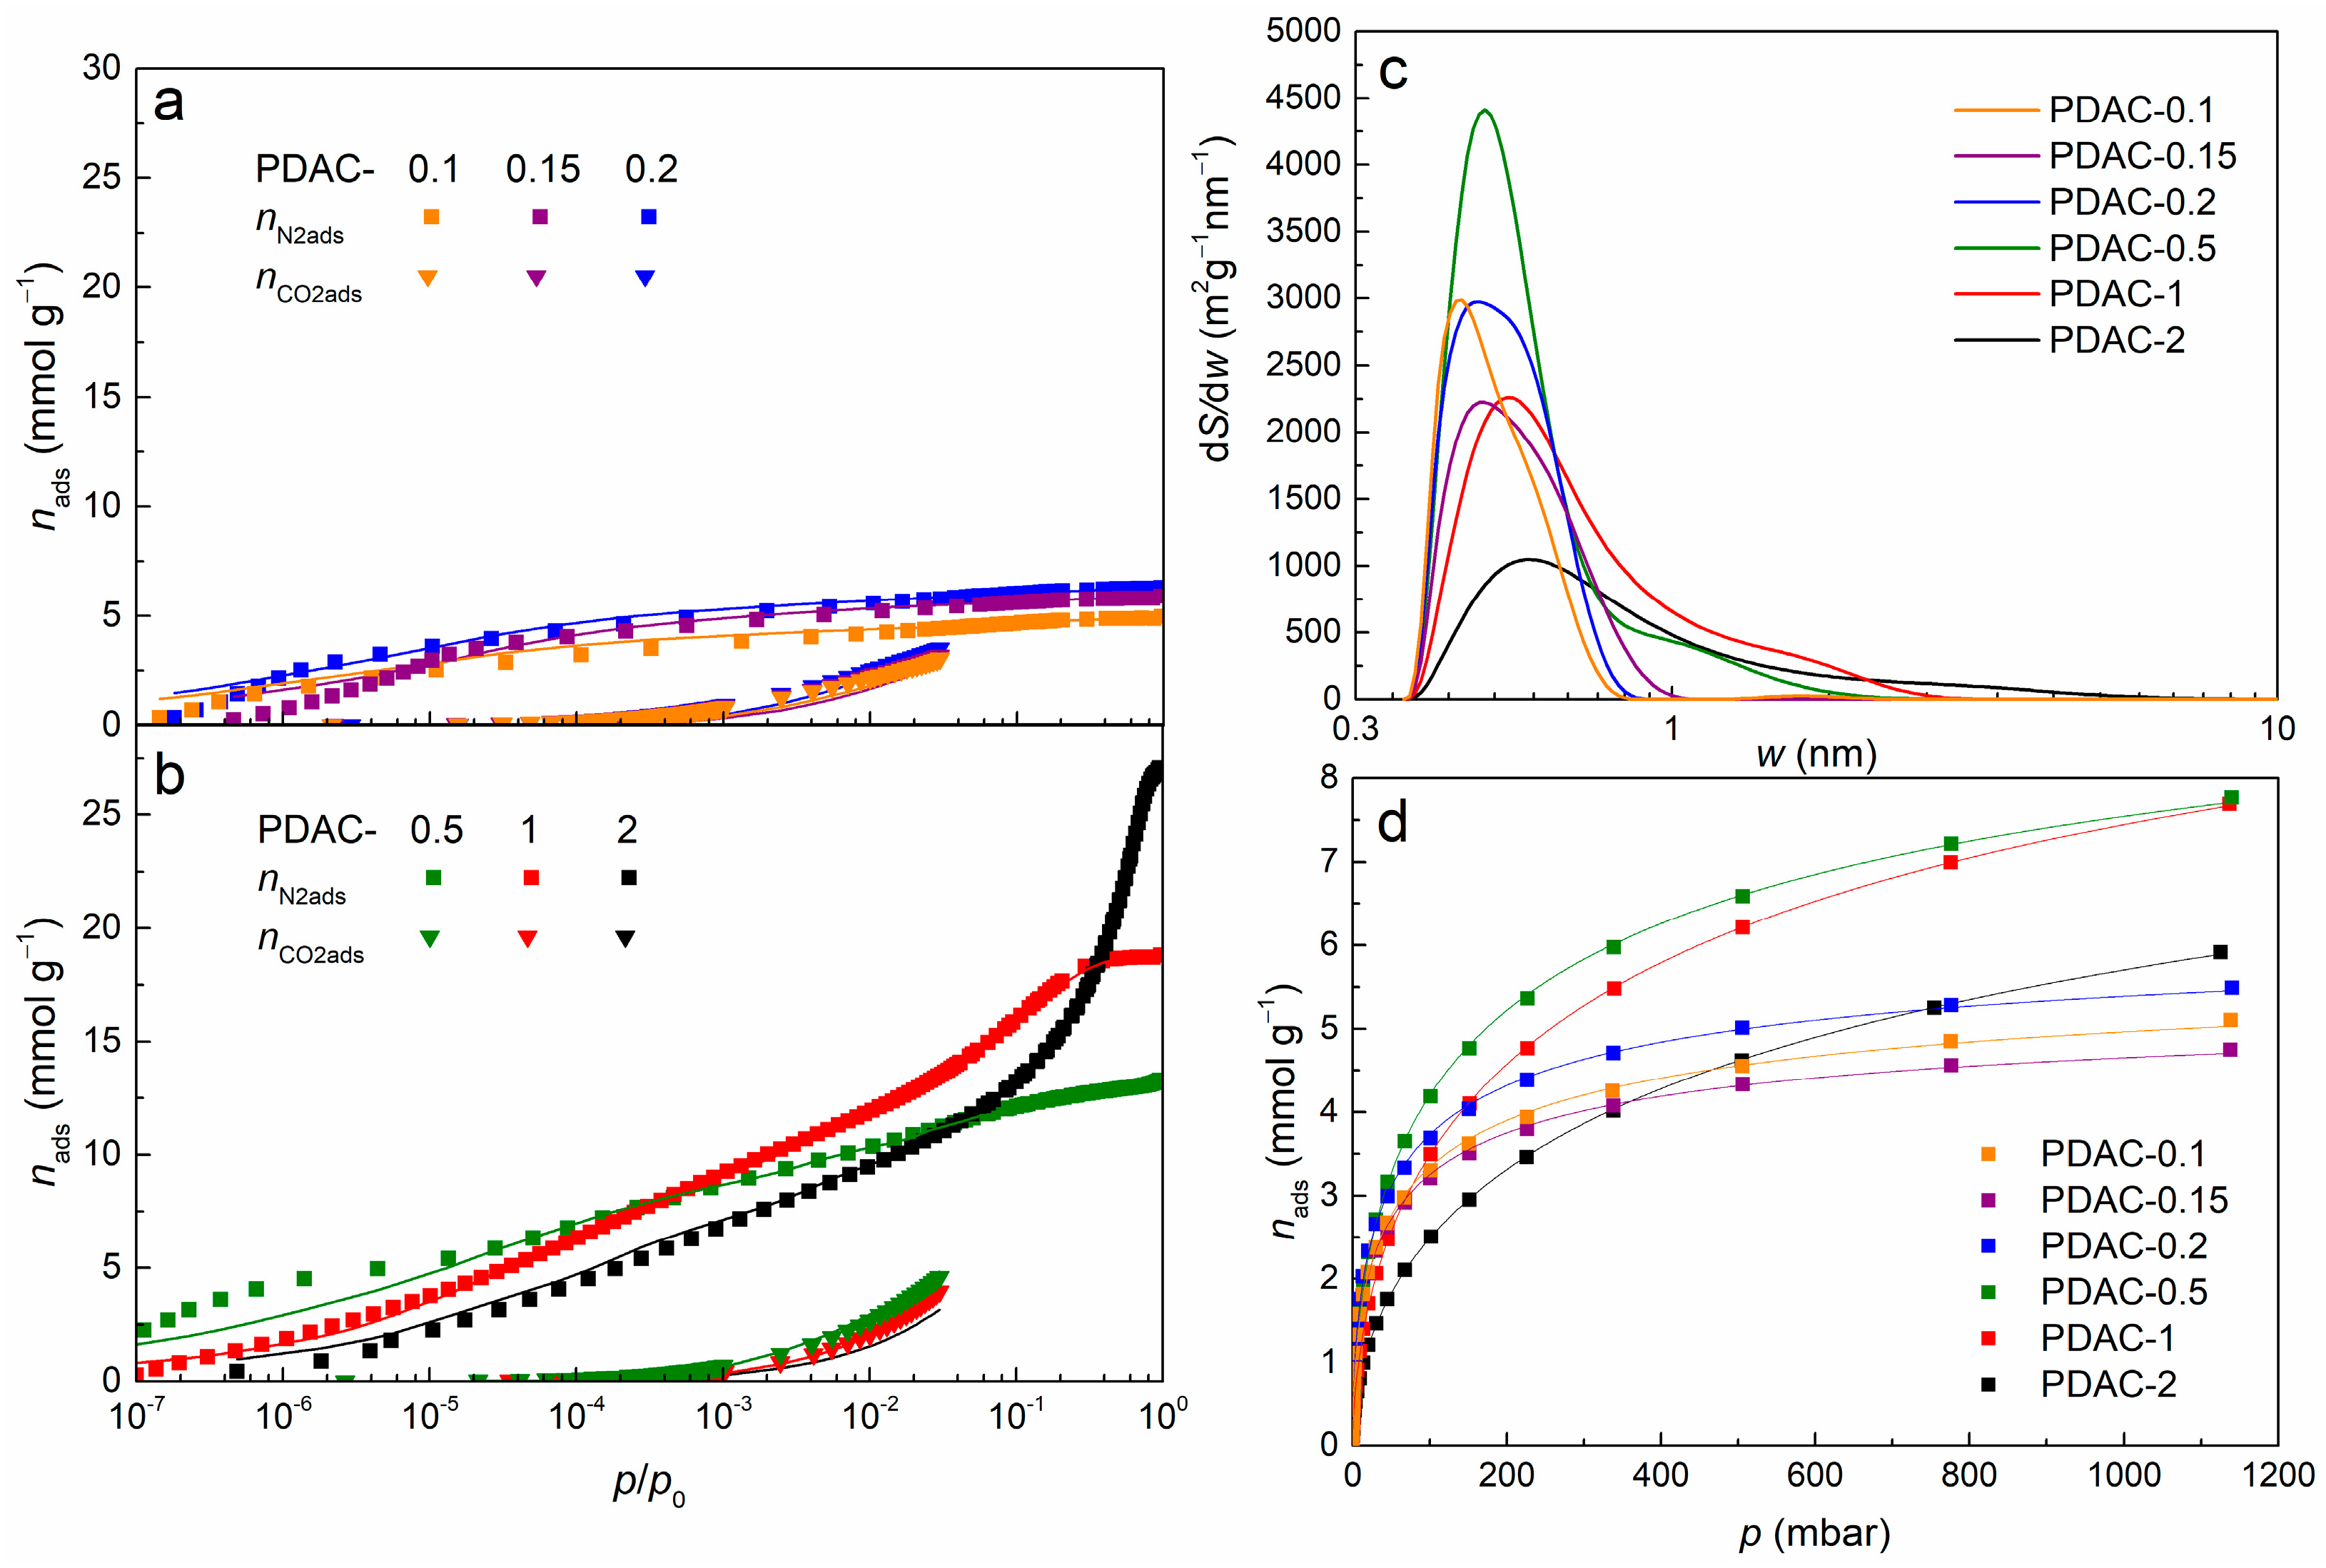
The highest 2D-NLDFT-HS SSA, SDFT, of 1280 m2 g−1 was exhibited by PDAC-1 (Table 2). With a higher concentration of ZnCl2 in the synthesis mixture, in case of PDAC-2, both the SSA and microporosity decreased—PDAC-2 exhibits a lower SDFT of 1020 m2 g−1 of which only 70% is made up of micropores. In case of a <0.5 ZnCl2 to peat ratio, the SSA decreases but the percentage of micropores of the total SSA increases (Table 2). PDAC-0.5 exhibited the largest micropore area, Smicro = 1250 m2 g−1, with almost all porosity made up of micropores, Smicro/SDFT = 0.99 (Table 2). A more extreme case was present with PDACs prepared at even lower ZnCl2 concentrations, where in the case of ZnCl2 to peat ratio of ≤0.2, almost all of the porosity is made up of ultramicropores, V0.8nm/VDFT ≥ 0.91 (Table 2). The high degree of ultramicroporosity in PDACs with ZnCl2 to peat ratios ≤ 0.2 is showcased in the pore size distributions (PSDs) obtained by fitting the N2 and CO2 adsorption data simultaneously with the 2D-NLDFT-HS model (Figure 4c). PDAC-2 is the only sample which shows marginal porosity for pores with w > 3 nm and the PSD peak describing microporosity shifts towards larger pores with the increase in ratio of ZnCl2 to peat used for activation (Figure 4c). Thus, lower quantities of ZnCl2 for activation cause the formation of smaller pores and possibly limit the formation of larger pores, giving way to ultramicroporosity.
Table 2.
Porous structure characteristics of synthesized carbon materials from gas adsorption data.

Figure 4.
N2 and CO2 adsorption isotherms (symbols) with accompanying fits (lines) to the 2D-NLDFT-HS model [56,57] for carbon materials simultaneously applied to both N2 and CO2 adsorption data for PDAC-0.1, PDAC-0.15, PDAC-0.2 (a) and PDAC-0.5, PDAC-1, PDAC-2 (b). Pore size distributions by differential specific surface area of all carbon materials calculated with SAIEUS software by applying the 2D-NLDFT-HS model [56,57] simultaneously to the N2 and CO2 isotherm data (c). Hydrogen adsorption isotherms (symbols) of all PDAC samples and fits (lines) to the Sips isotherm [58] equation (Equation (1)) (d).
3.3. Hydrogen Adsorption
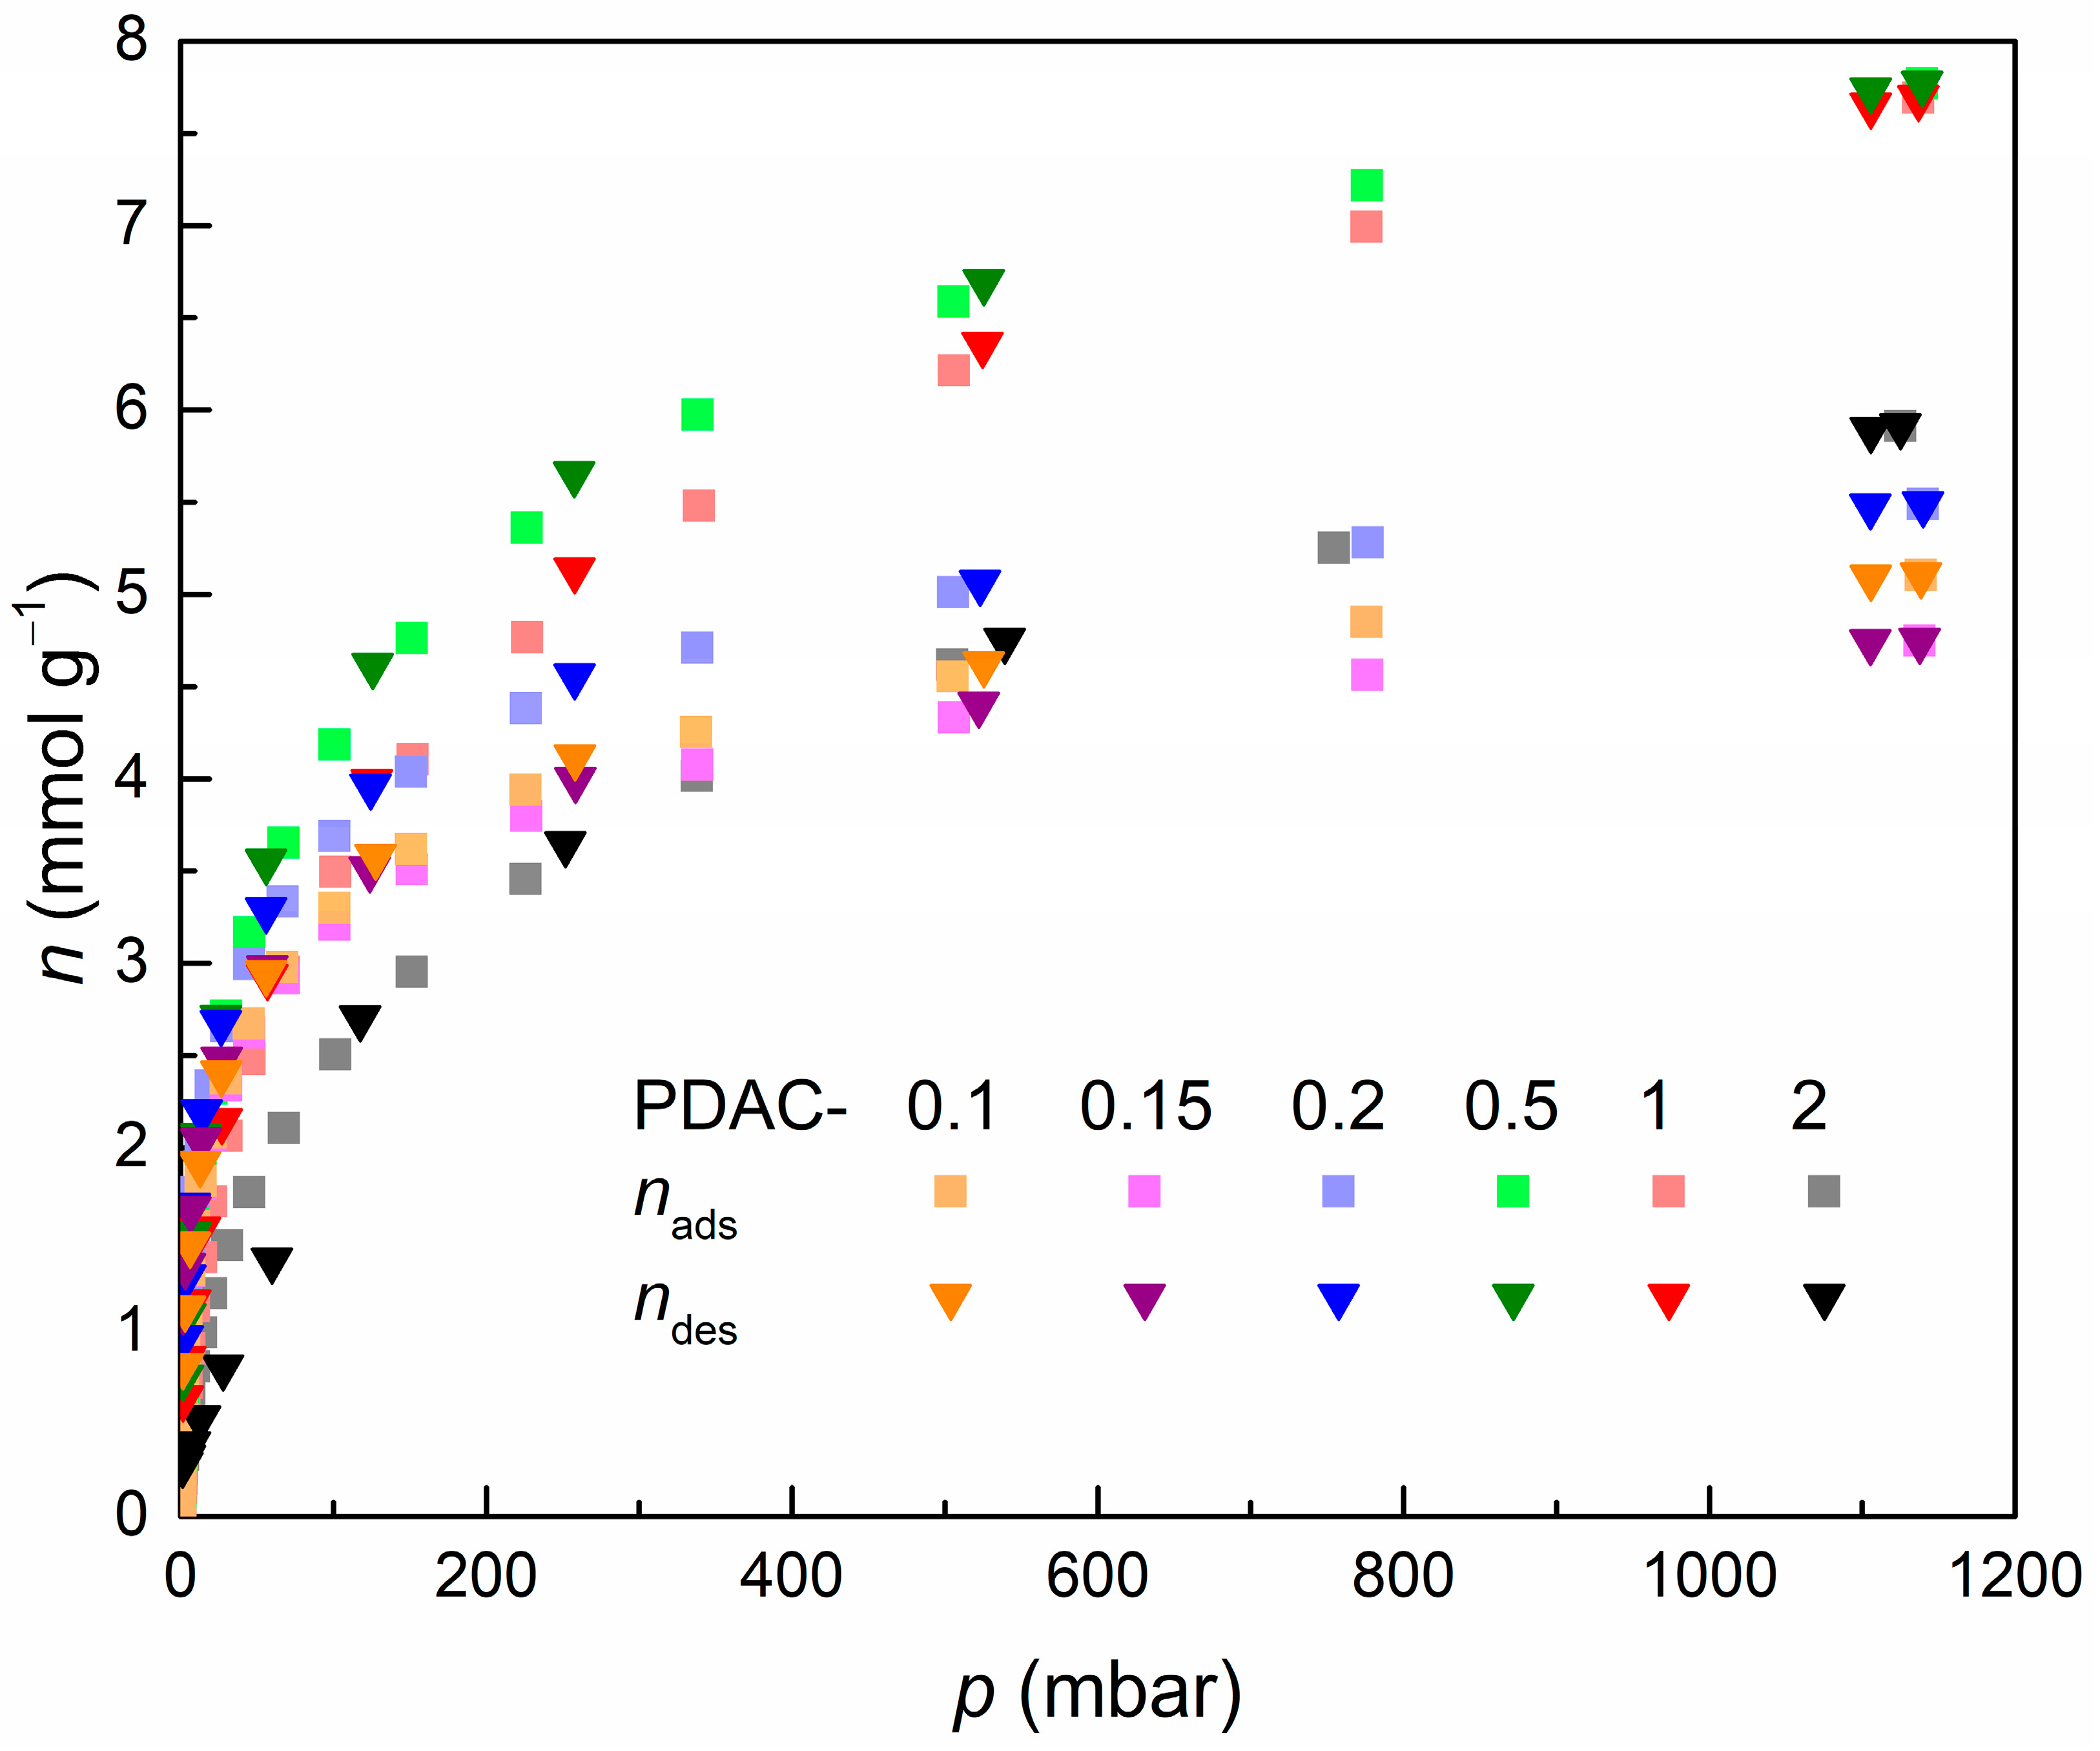
All PDACs exhibited reversible H2 adsorption isotherms without any hysteresis (Figure A13 in Appendix D) at 77 K and, when measured up to 1 bar, where the adsorption and desorption branches of the sorption isotherms match almost perfectly. PDAC-0.5 adsorbed the most H2 at 77 K and 1 bar, nH2,1bar = 7.54 mmol g−1 (Table 3, Figure 4d), while the theoretical maximum according to the Sips isotherm equation (Equation (1)) is achieved by PDAC-1, of nH2,max = 12.63 mmol g−1. For further analysis, the widely accepted Chahine’s rule can be used as a benchmark, where Chahine’s rule predicts the maximum adsorption excess from the BET SSA values of a material [62]. According to Chahine’s rule a maximum of 1 mass% of H2 is adsorbed at 77 K per 500 m2 g−1 of BET SSA. In case of PDAC-0.1, 1.68 mass% of H2 uptake is achieved per SBET = 500 m2 g−1 while a much lower 0.94 mass% is adsorbed for PDAC-2 at the opposite, high ZnCl2 concentration end of the series (Table 3). This means PDAC-2 roughly falls into Chahine’s rule while PDAC-0.1 exceeds it by a large margin. Doing the same comparison using SDFT instead of SBET, where the SDFT values is considered to be more reliable in case of highly microporous and ultramicroporous carbons [63], the situation is reversed. PDAC-0.1 falls nearly perfectly into Chahine’s rule at 0.99 mass% per 500 m2 g−1 while PDAC-2 exceeds it somewhat with a value of 1.15 mass% per 500 m2 g−1 (Table 3). This is due to fact that BET theory underestimates the presence of (ultra)micropores and 2D-NLDFT-HS is a more accurate model for gauging the SSA of (ultra)microporous materials [63]. The adsorption equilibrium constant, b, value increases from b = 9.38 10−4 for PDAC-2 to b = 1.83 10−2 for PDAC-0.15 (Table 3). The higher b value means that a majority of pores are filled with adsorbed H2 already at low pressures, i.e., the rate of adsorption is comparatively quick in comparison to that of desorption at 77 K. Whereas the lower b value for PDACs with ZnCl2 to peat ratio > 0.5 means that desorption rate is higher and higher pressures are required for full surface coverage and pore filling with adsorbed H2. This is exemplified by the ratios of nH2,1bar to nH2,max—the ratio of amount of H2 adsorbed at 1 bar to the theoretical maximum amount of adsorbed H2. This nH2,1bar/nH2,max ratio is highest for PDAC-0.15, at nH2,1bar/nH2,max = 0.833, whereas for PDAC-2 nH2,1bar/nH2,max is only 0.491 (Table 3). This strong H2 adsorption and confinement effect is most likely brought forth by the favorable ultramicroporosity present in peat-derived carbon activated with low ratios of ZnCl2.
Table 3.
Hydrogen adsorption characteristics of synthesized carbon materials along with Sips isotherm [58] equation (Equation (1)) parameters.
4. Discussion
The successful synthesis of microporous carbon materials by pyrolysis from peat and activation with ZnCl2 was confirmed based on XRD, SEM, and gas adsorption methods. The obtained carbon materials had similar microstructures and identical impurity compositions of non-carbon elements. The quantity of impurity elements, however, partially depended on the amount of ZnCl2 used in the precursor mixture. The compositional analysis results are corroborated by the gas adsorption data, based on which a lower ratio of ZnCl2 resulted in a smaller chemical activation effect but a larger ratio of micropores.
Based on the results, ZnCl2 as an activating compound initially forms many small (w < 1 nm) pores inside the organic precursor matrix and, with an increased ratio of ZnCl2 used, with respect to the organic precursor, the formation of wider pores is brought forth. In earlier research conducted by other groups micro-mesoporous activated carbon materials have been successfully synthesized using similar synthesis routes [11,36,51] and ZnCl2-to-peat ratios between 2 and 0.5, but the use of ZnCl2-to-peat ratios of ≤0.2 have not been published before to the knowledge of the authors. Based on our results and the mesoporous nature of carbon materials synthesized by other groups, it can be theorized that two main mechanisms are at work during ZnCl2 activation. Firstly, a higher ZnCl2 content acts as a pore former through templating and sterically filling pore-forming spaces and, thus, the initial pores are larger for materials with a higher ZnCl2 ratio. Secondly, when larger amounts of ZnCl2 are added into the synthesis mixture, the initial smaller pores are fused together during the activation process during which the thermal degradation of ZnCl2 removes parts of the underlying carbon microstructure, widening the smaller end of micropores initially present in the porous carbon structure. These two mechanisms help to explain the limited formation of porous structures, where porosity is almost completely made up of micropores (with substantial ultramicroporosity) in case of lower ZnCl2 to peat ratios for activation. In addition, they help to explain the formation of an expected high SSA and decrease in microporosity when the ZnCl2 to organic material ratio is increased.
The differences in the non-carbon impurity compounds and elements, present after the acid washing process, are also associated with the structural changes sustained in the pyrolysis and chemical activation process. With low ZnCl2 ratio, many impurities are encapsulated inside the carbon structure and narrow-necked ultramicropores where they are rendered inaccessible to the acid washing. This applies mainly to Zn-based compounds which are introduced to the forming carbon structure during the chemical activation process—as can be seen from the drastic difference of ZnO present in PDACs with lowest and highest used ZnCl2 to peat ratios. With a higher ratio of ZnCl2, a much more porous and accessible carbon structure is obtained, thus, leading to a larger accessible surface area, lower microporosity, and lower amounts of non-carbon elements in the chemical composition.
With the increased ratio of ultramicropores to total porosity at low ZnCl2 ratios, the H2 adsorption equilibrium constant b increases rapidly as the additional ultramicropores are able to confine H2 very well, especially at low pressures. This is showcased by the high nH2,1bar/nH2,max ratio of 0.833 for PDAC-0.15 (Table 3). At the same time, PDAC-1 which has the highest nH2,max = 12.63 mmol g−1, has a nH2,1bar/nH2,max ratio of only 0.589, meaning that higher pressures are required for the utilization of the higher H2 uptake potential. In addition, the high nH2,1bar/nH2,max ratio of PDACs obtained with low ZnCl2 ratios show potential for H2 storage at higher temperatures as the high b value should be able to support the confinement of H2 also in the presence of additional thermal energy. The strong confinement of H2 in ultramicropores has been modelled [22,64,65,66] and shown before by different methods [16,25,67,68,69]. The strong confinement of H2 in ultramicropores and hydrogen uptakes of up to 10.7 mmol g−1 [22] and up to 18 mmol g−1 [26] at 77 K and at 1 bar of H2 pressure have been shown for activated carbon fiber ACF-15 and for carbons derived from semi-cycloaliphatic polyimide, respectively. Even as the gravimetric amount of adsorbed H2 at 1 bar and at 77 K is considerably higher than that exhibited by PDACs, 7.54 mmol g−1 for PDAC-0.5, the beforementioned ultramicroporous adsorbents [22,26] do not present a H2 isotherm reaching a plateau near 1 bar of pressure and, thus, they do not exhibit as high nH2,1bar/nH2,max ratio as PDAC-s with low ZnCl2 ratios. In addition, the gravimetric amount of adsorbed H2 is decreased in the case of PDACs by the addition of dead mass from the impurities. Thus, the synthesis of highly ultramicroporous biomass-derived carbons is presented for the strong confinement of H2 at low H2 pressures. This is enhanced by the reversible H2 uptake and desorption, where no hysteresis was determined from the H2 adsorption isotherms, meaning that this strong confinement of H2 a physical adsorption process. The possibility to adsorb H2 at low pressures is of specific interest for the development of cryo-adsorptive storage systems able to operate at increased temperatures. Thus, in future, the low-pressure adsorption of H2 at elevated Ts will be investigated to determine the adsorption enthalpy of H2 in investigated ultramicropores and determine the viability of such systems for technical H2 storage solutions.
In this work we showcase the use of low ratios of ZnCl2 as an activating agent for the synthesis of highly ultramicroporous peat-derived carbon materials and the strong H2 confining capability of these ultramicroporous adsorbents, especially at lower pressures. The overall lower cost and subsequent environmental impact of using lower amounts of activating agents, e.g., ZnCl2, combined with high ultramicroporosity for H2 adsorption is a fruitful combination for further research into H2 storage materials and systems.
Author Contributions
Conceptualization, E.M. and R.P.; methodology, R.P. and M.H.; validation, E.M., R.P. and M.K. (Miriam Koppel); formal analysis, J.A. and M.K. (Marian Külaviir); investigation, E.M.; resources, R.P. and M.H.; data curation, E.M., J.A. and M.K. (Marian Külaviir); writing—original draft preparation, E.M.; writing—review and editing, E.M., R.P., K.T., M.H., M.K. (Miriam Koppel) and E.L.; visualization, E.M.; supervision, R.P., M.H. and K.T.; project administration, R.P. and E.L.; funding acquisition, R.P. and E.L. All authors have read and agreed to the published version of the manuscript.
Funding
This research was supported by the EU through the European Regional Development Fund (Centers of Excellence, TK141 “Advanced materials and high-technology devices for energy recuperation systems”), by the Estonian Research Council Grants, grant numbers PUTJD957 and PRG676. R.P. was funded by a postdoctoral scholarship awarded by Dr. Ragnar Holm’s Foundation at KTH, Sweden.
Data Availability Statement
The data presented in this study are available on request from the corresponding author.
Acknowledgments
The authors would like to extend their gratitude towards Kalle Kirsimäe from the Institute of Ecology and Earth Sciences at the University of Tartu for giving access to the XRD, XRF, and SEM-EDS measurements. An honorable mention also goes out to Thomas Thomberg from the Institute of Chemistry at the University of Tartu for providing valuable support and insightful discussions during the PDAC synthesis.
Conflicts of Interest
The authors declare no conflict of interest.
Appendix A

Figure A1.
Scanning electron microscope images of synthesized carbon materials. PDAC-0.1 (a,b); PDAC-0.15 (c,d); PDAC-0.2 (e,f); PDAC-0.5 (g,h); PDAC-1 (i,j); PDAC-2 (k,l).
Figure A1.
Scanning electron microscope images of synthesized carbon materials. PDAC-0.1 (a,b); PDAC-0.15 (c,d); PDAC-0.2 (e,f); PDAC-0.5 (g,h); PDAC-1 (i,j); PDAC-2 (k,l).
Appendix B

Figure A2.
SEM-EDS results of PDAC-2 depicting the original SEM image (a) and the elemental mapping results of the same location for C, O, Zn, Si, S, Al, and Fe (images (b–h), respectively).
Figure A2.
SEM-EDS results of PDAC-2 depicting the original SEM image (a) and the elemental mapping results of the same location for C, O, Zn, Si, S, Al, and Fe (images (b–h), respectively).
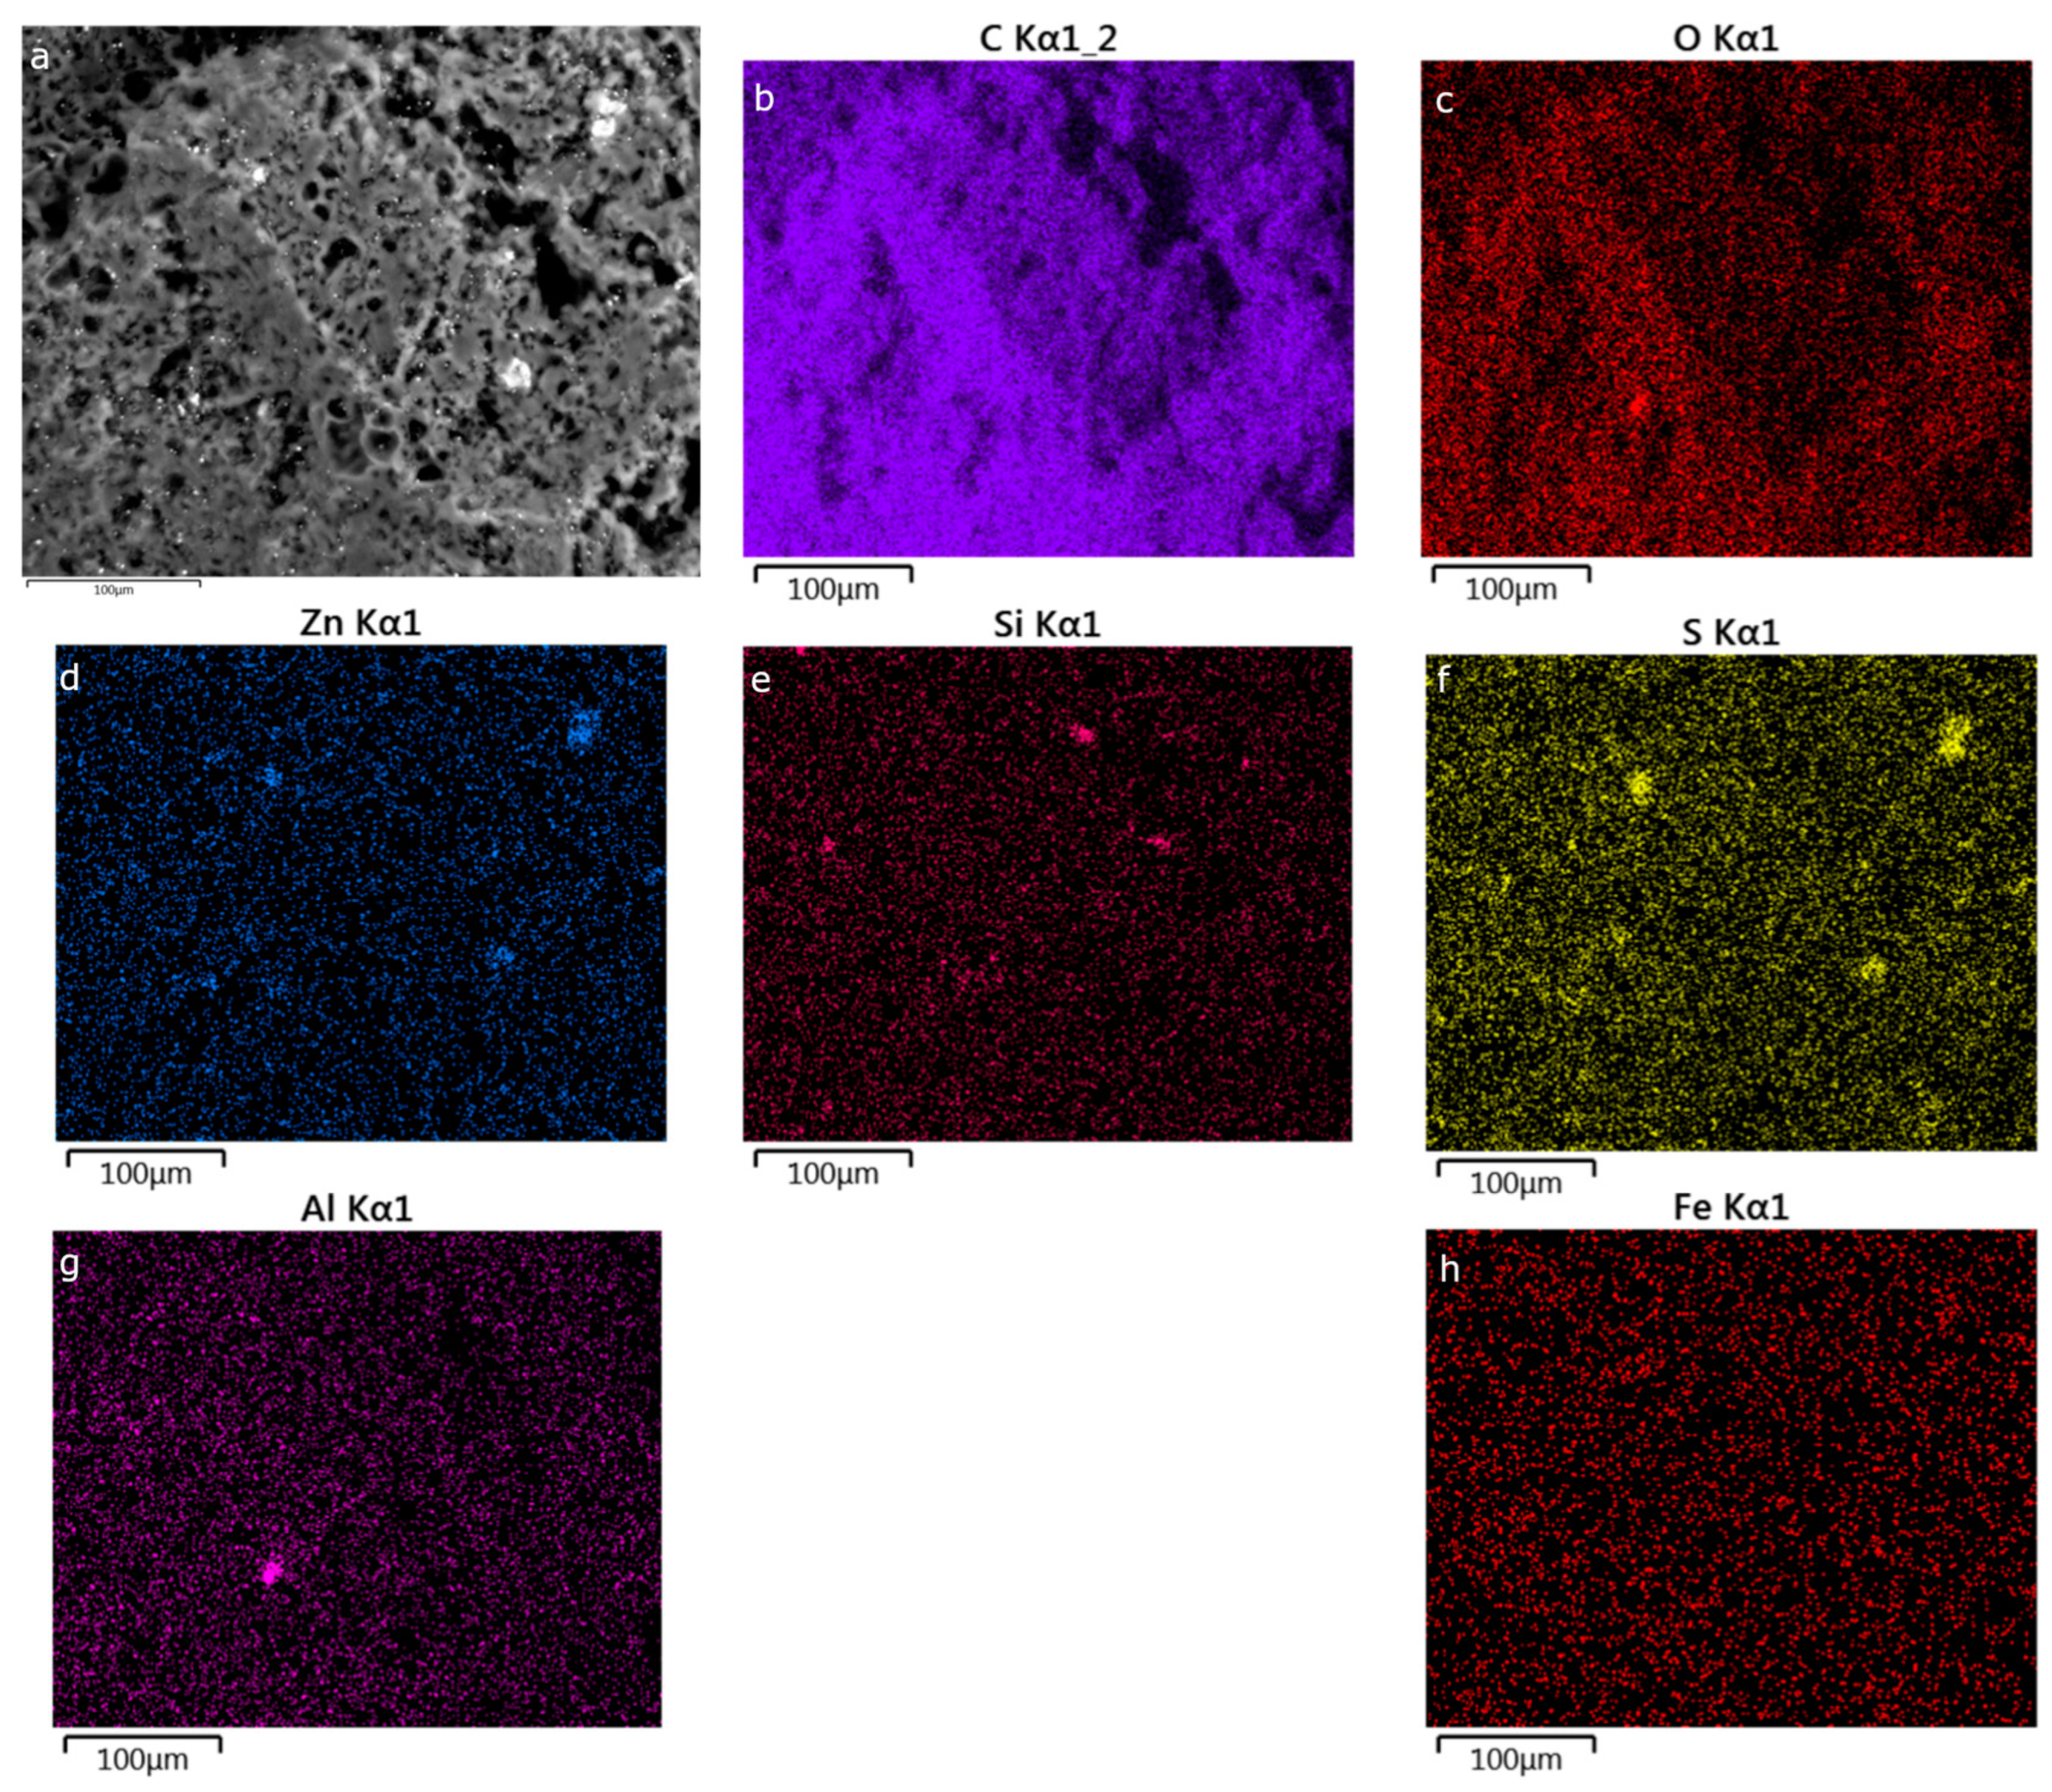

Figure A3.
SEM-EDS results of PDAC-1 depicting the original SEM image (a) and the elemental mapping results of the same location for C, O, Zn, Si, S, Al, and Fe (images (b–h), respectively).
Figure A3.
SEM-EDS results of PDAC-1 depicting the original SEM image (a) and the elemental mapping results of the same location for C, O, Zn, Si, S, Al, and Fe (images (b–h), respectively).
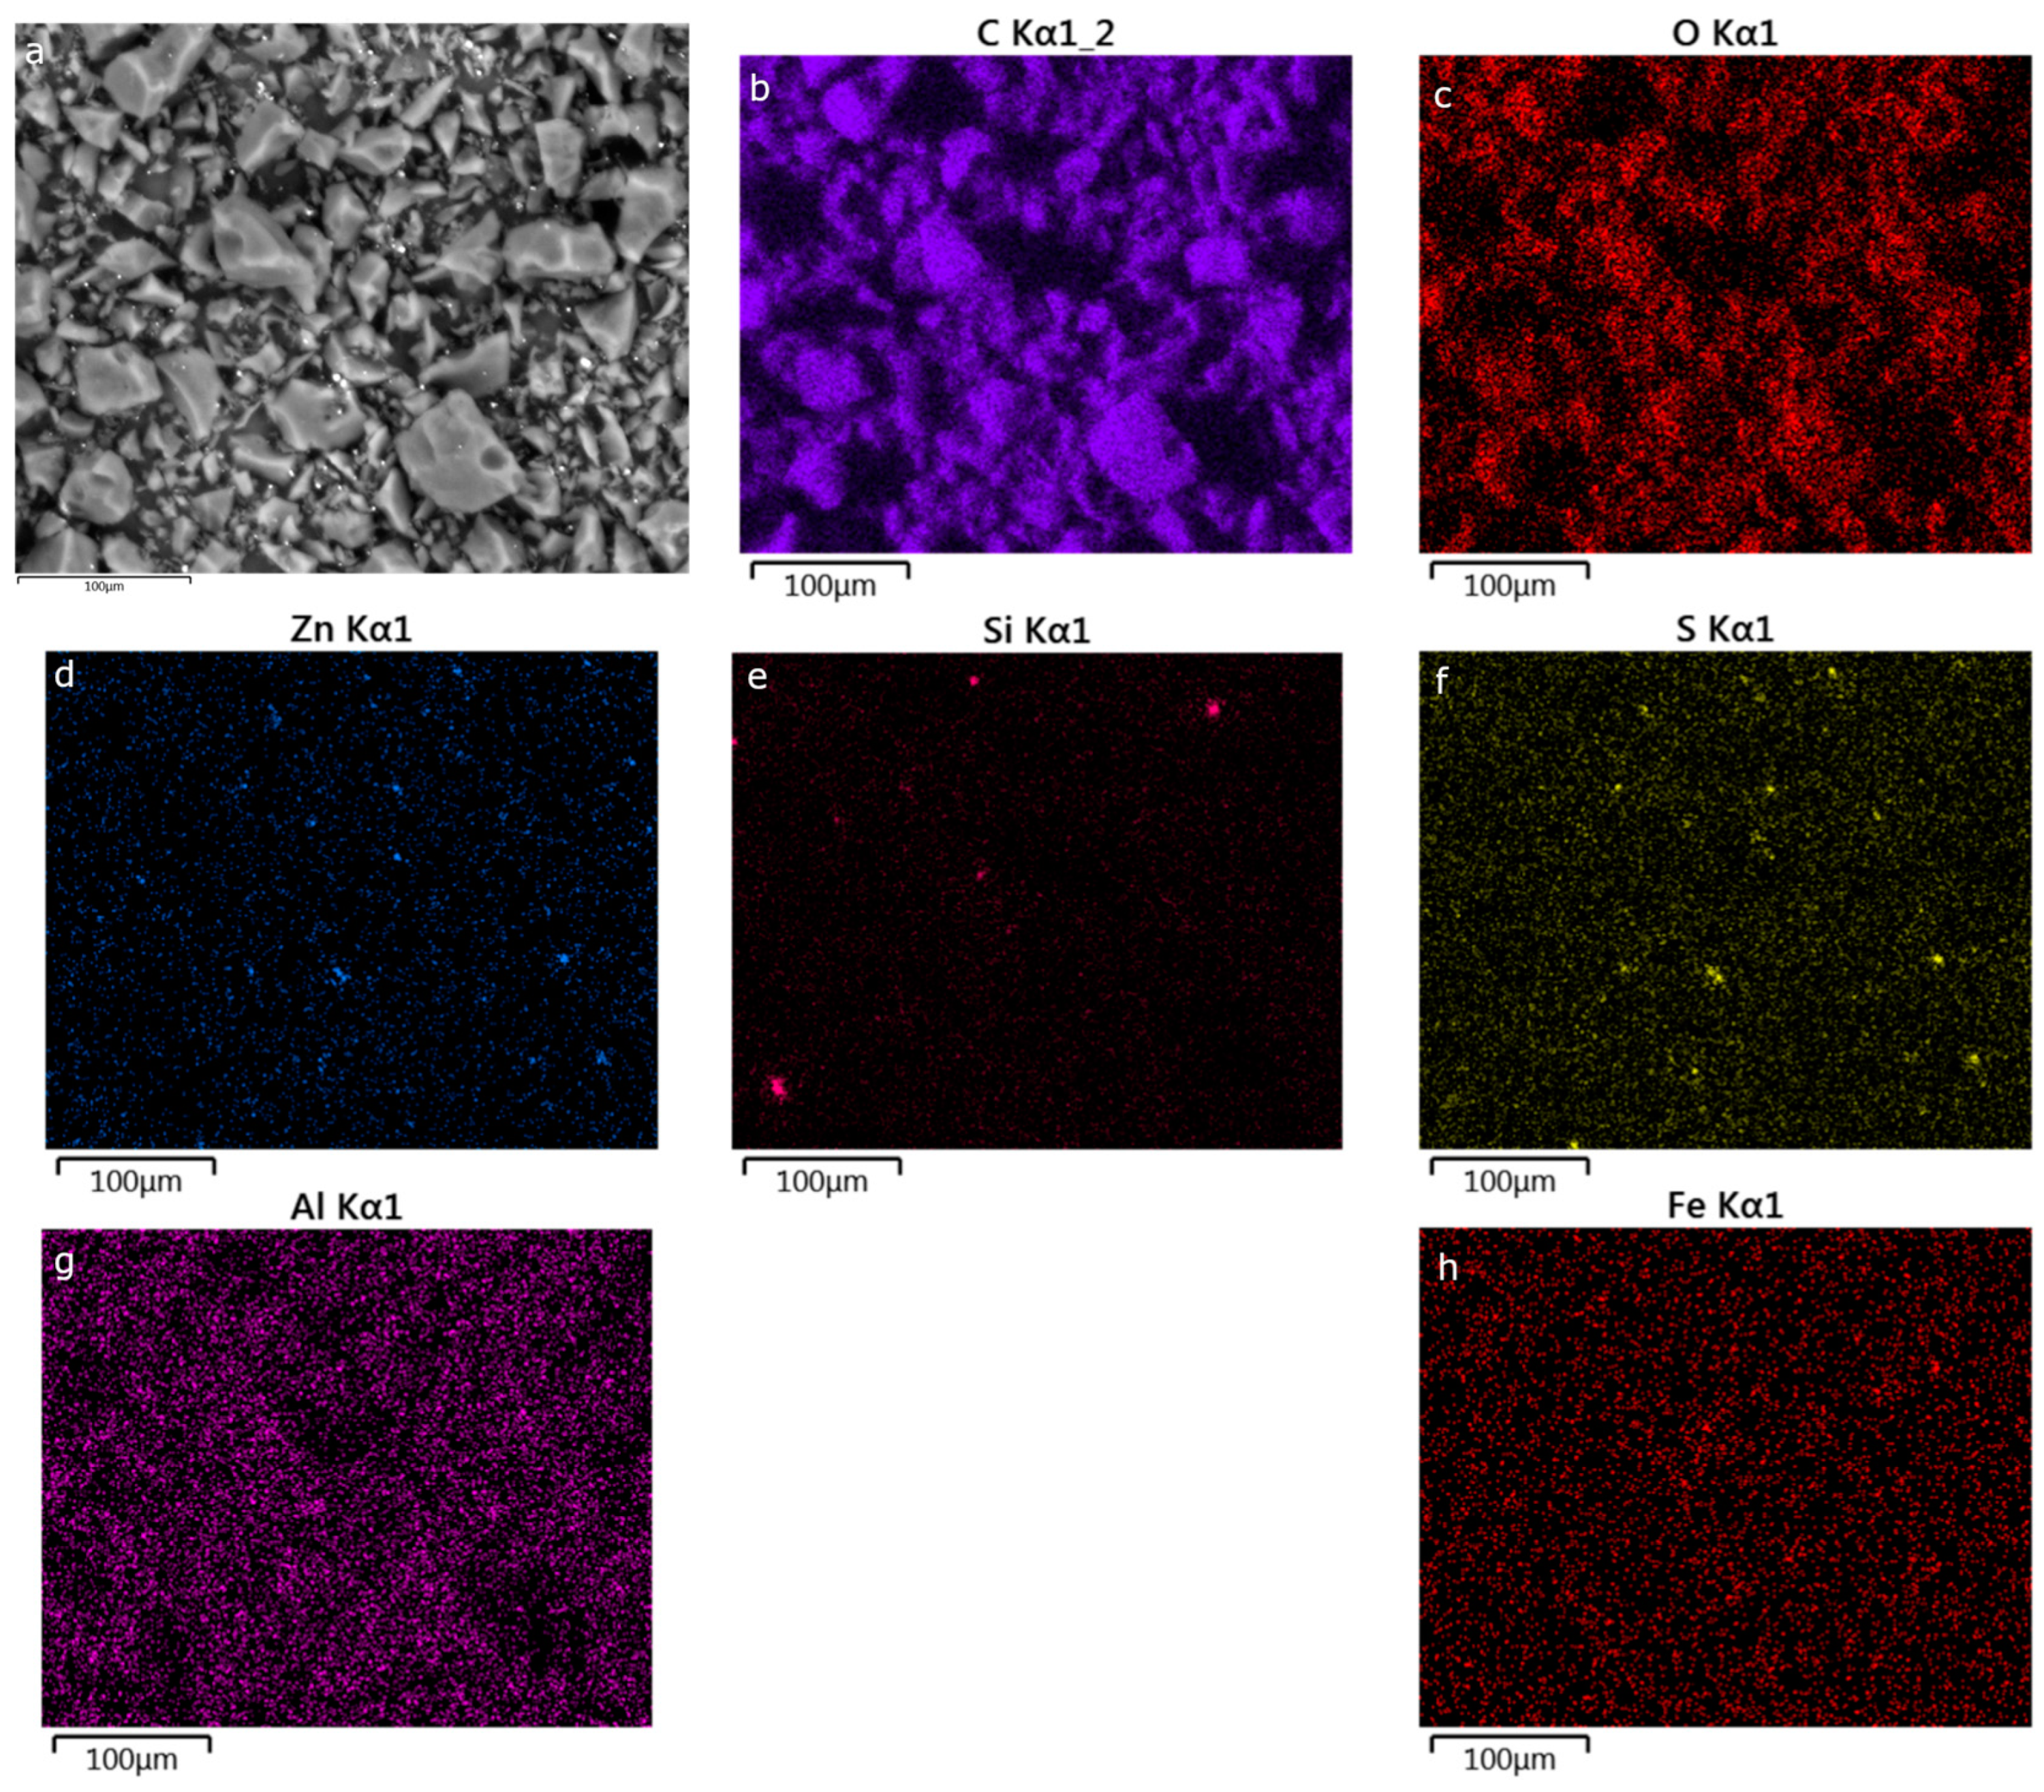
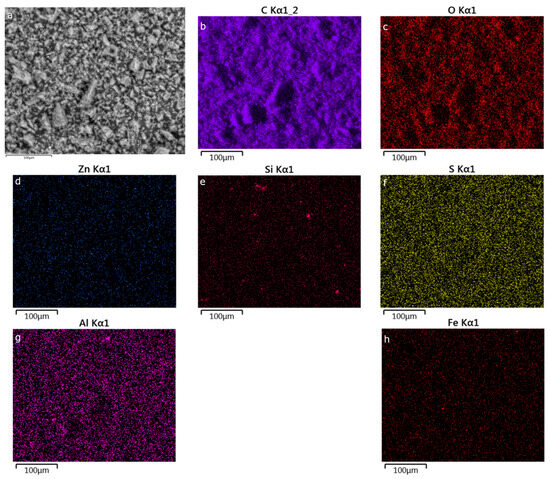
Figure A4.
SEM-EDS results of PDAC-0.5 depicting the original SEM image (a) and the elemental mapping results of the same location for C, O, Zn, Si, S, Al, and Fe (images (b–h), respectively).
Figure A4.
SEM-EDS results of PDAC-0.5 depicting the original SEM image (a) and the elemental mapping results of the same location for C, O, Zn, Si, S, Al, and Fe (images (b–h), respectively).
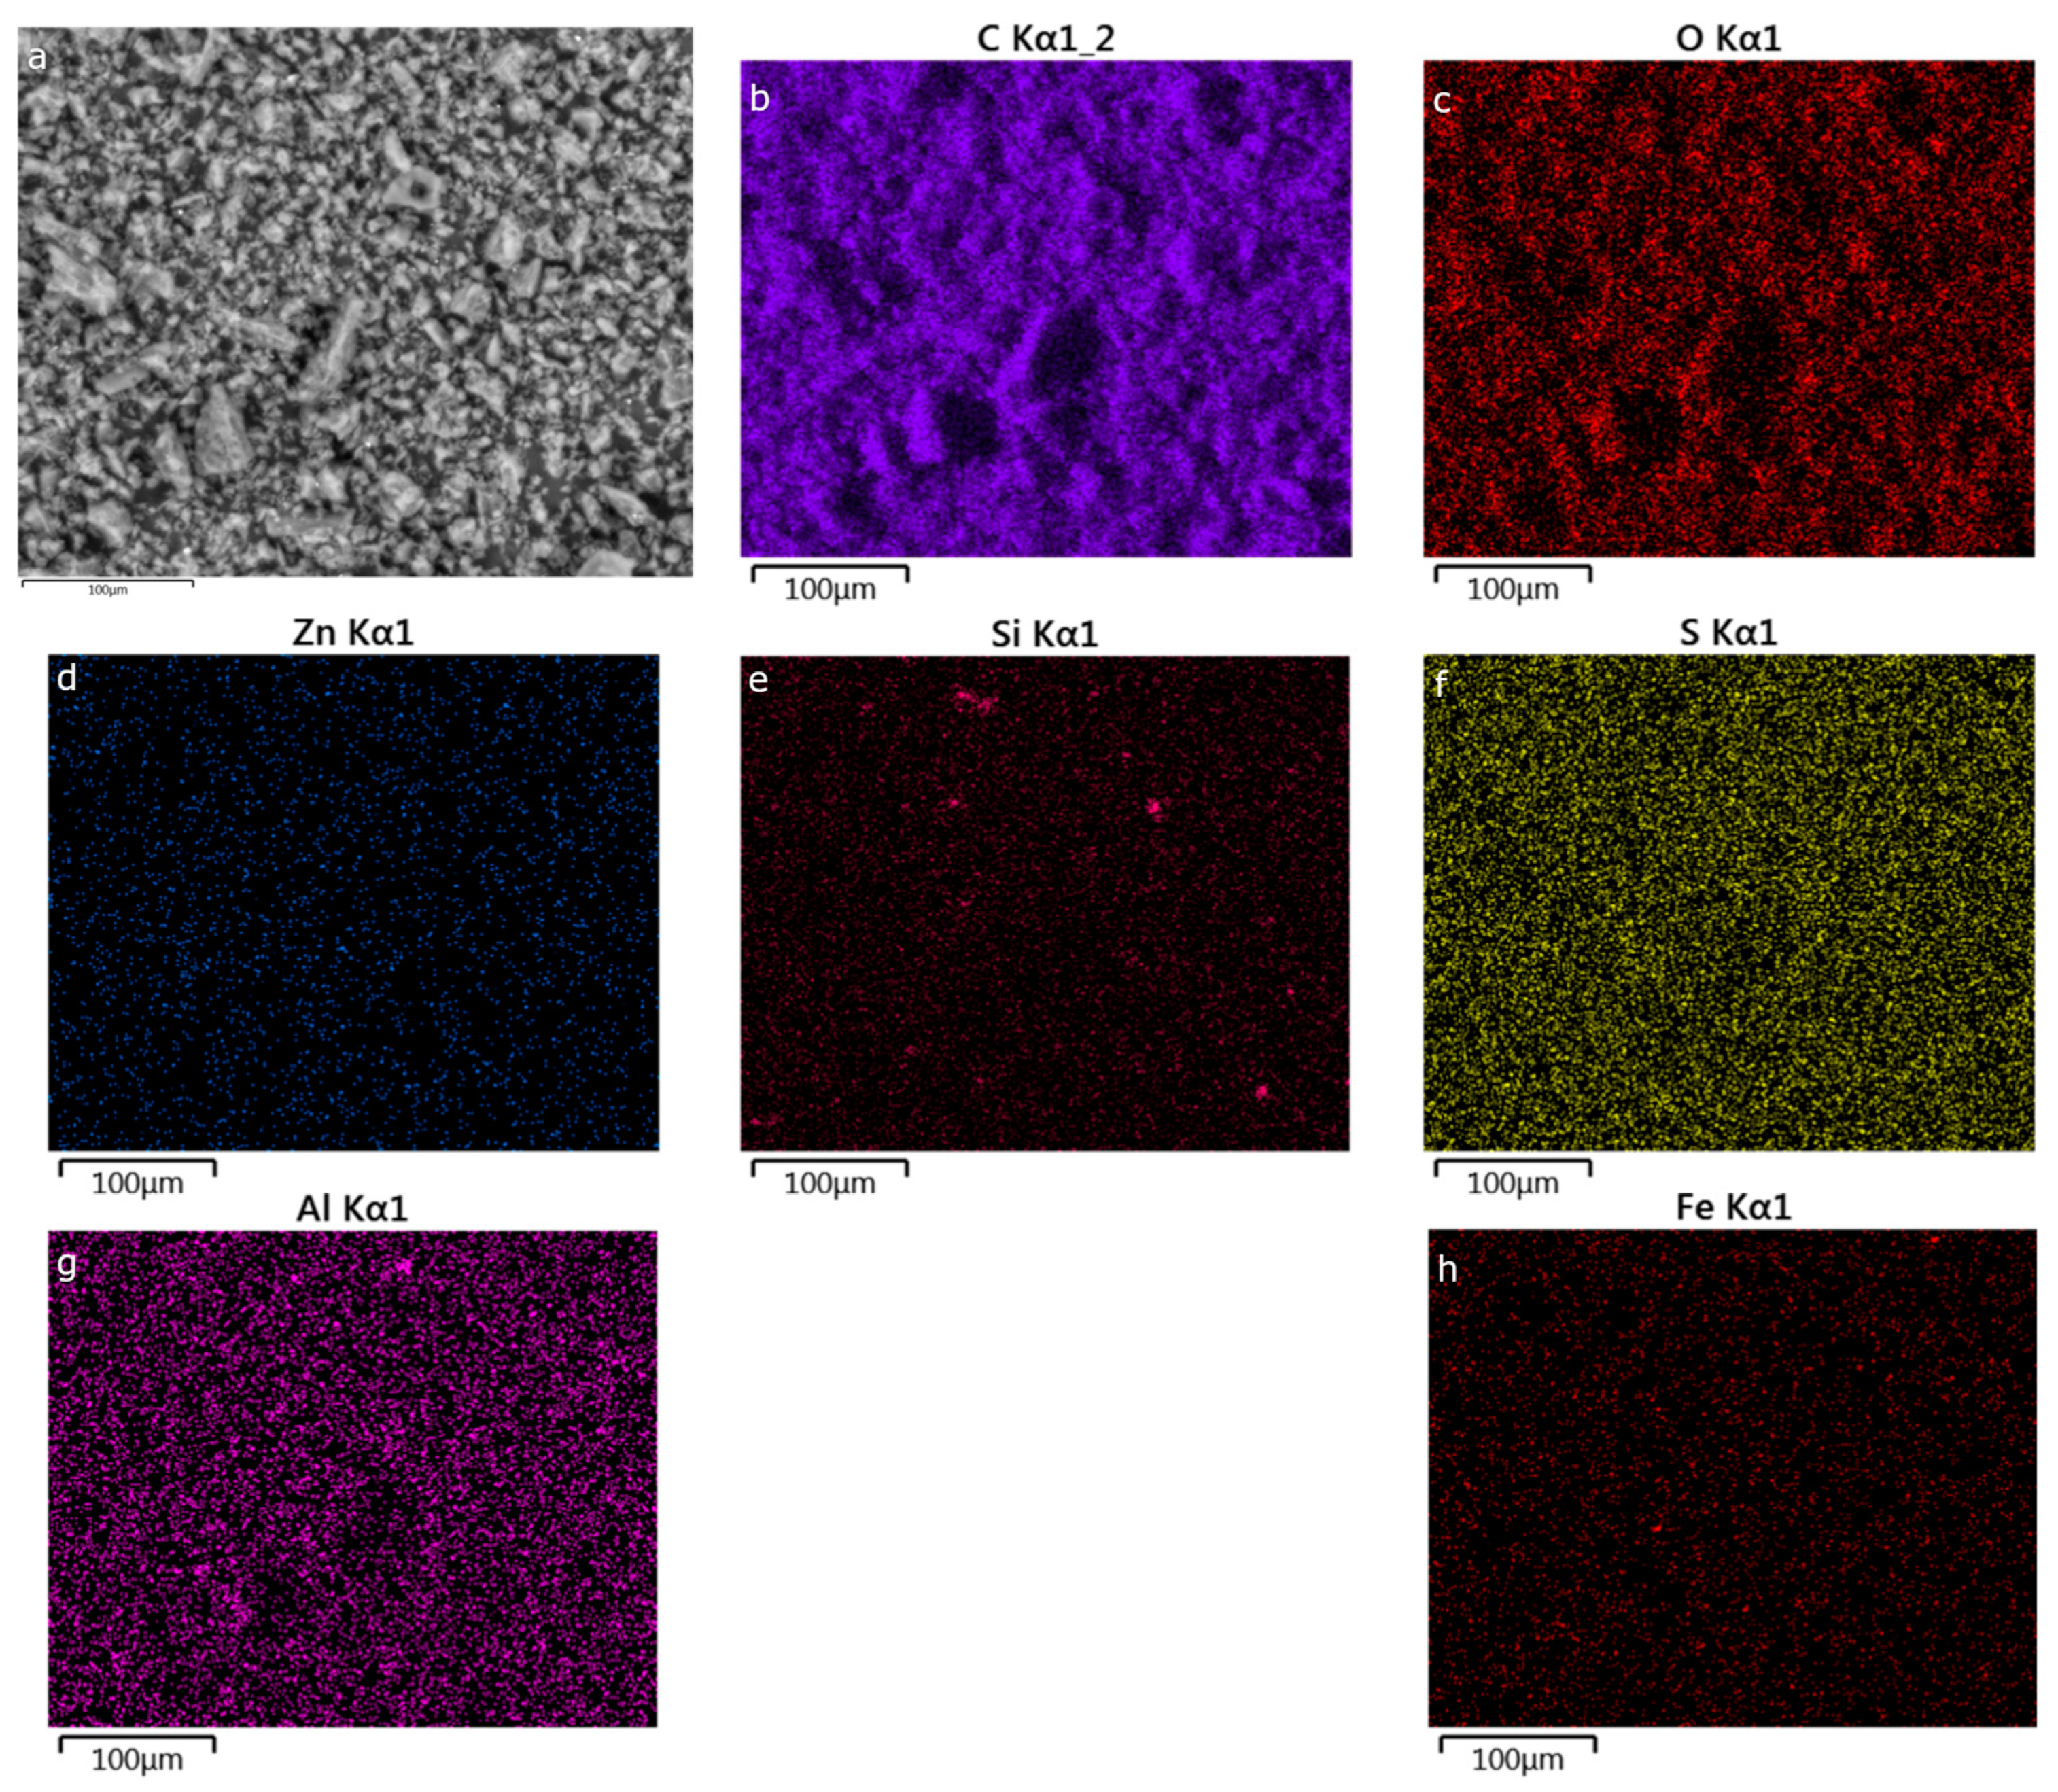
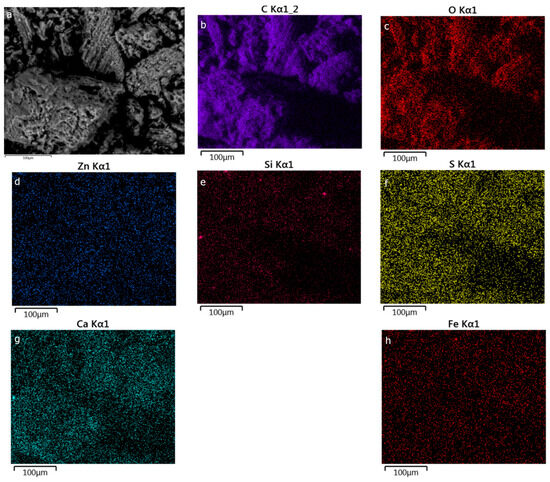
Figure A5.
SEM-EDS results of PDAC-0.2 depicting the original SEM image (a) and the elemental mapping results of the same location for C, O, Zn, Si, S, Ca, and Fe (images (b–h), respectively).
Figure A5.
SEM-EDS results of PDAC-0.2 depicting the original SEM image (a) and the elemental mapping results of the same location for C, O, Zn, Si, S, Ca, and Fe (images (b–h), respectively).

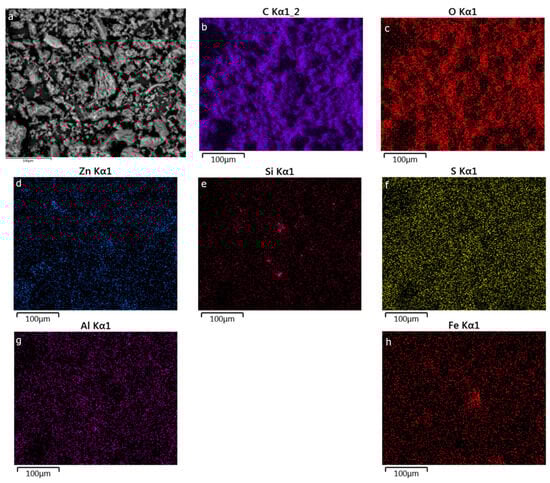
Figure A6.
SEM-EDS results of PDAC-0.15 depicting the original SEM image (a) and the elemental mapping results of the same location for C, O, Zn, Si, S, Al, and Fe (images (b–h), respectively).
Figure A6.
SEM-EDS results of PDAC-0.15 depicting the original SEM image (a) and the elemental mapping results of the same location for C, O, Zn, Si, S, Al, and Fe (images (b–h), respectively).

Appendix C
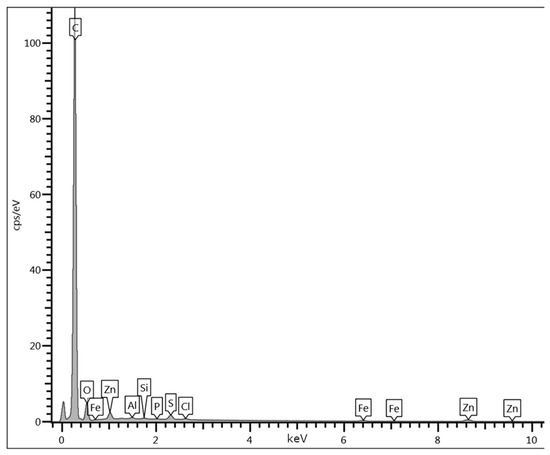
Figure A7.
Energy specter derived from SEM-EDS of PDAC-2.
Figure A7.
Energy specter derived from SEM-EDS of PDAC-2.

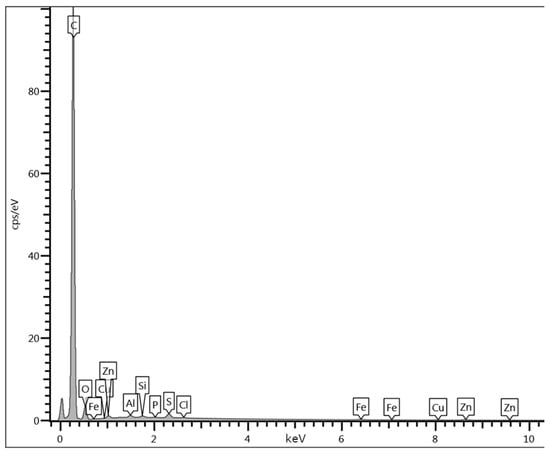
Figure A8.
Energy specter derived from SEM-EDS of PDAC-1.
Figure A8.
Energy specter derived from SEM-EDS of PDAC-1.
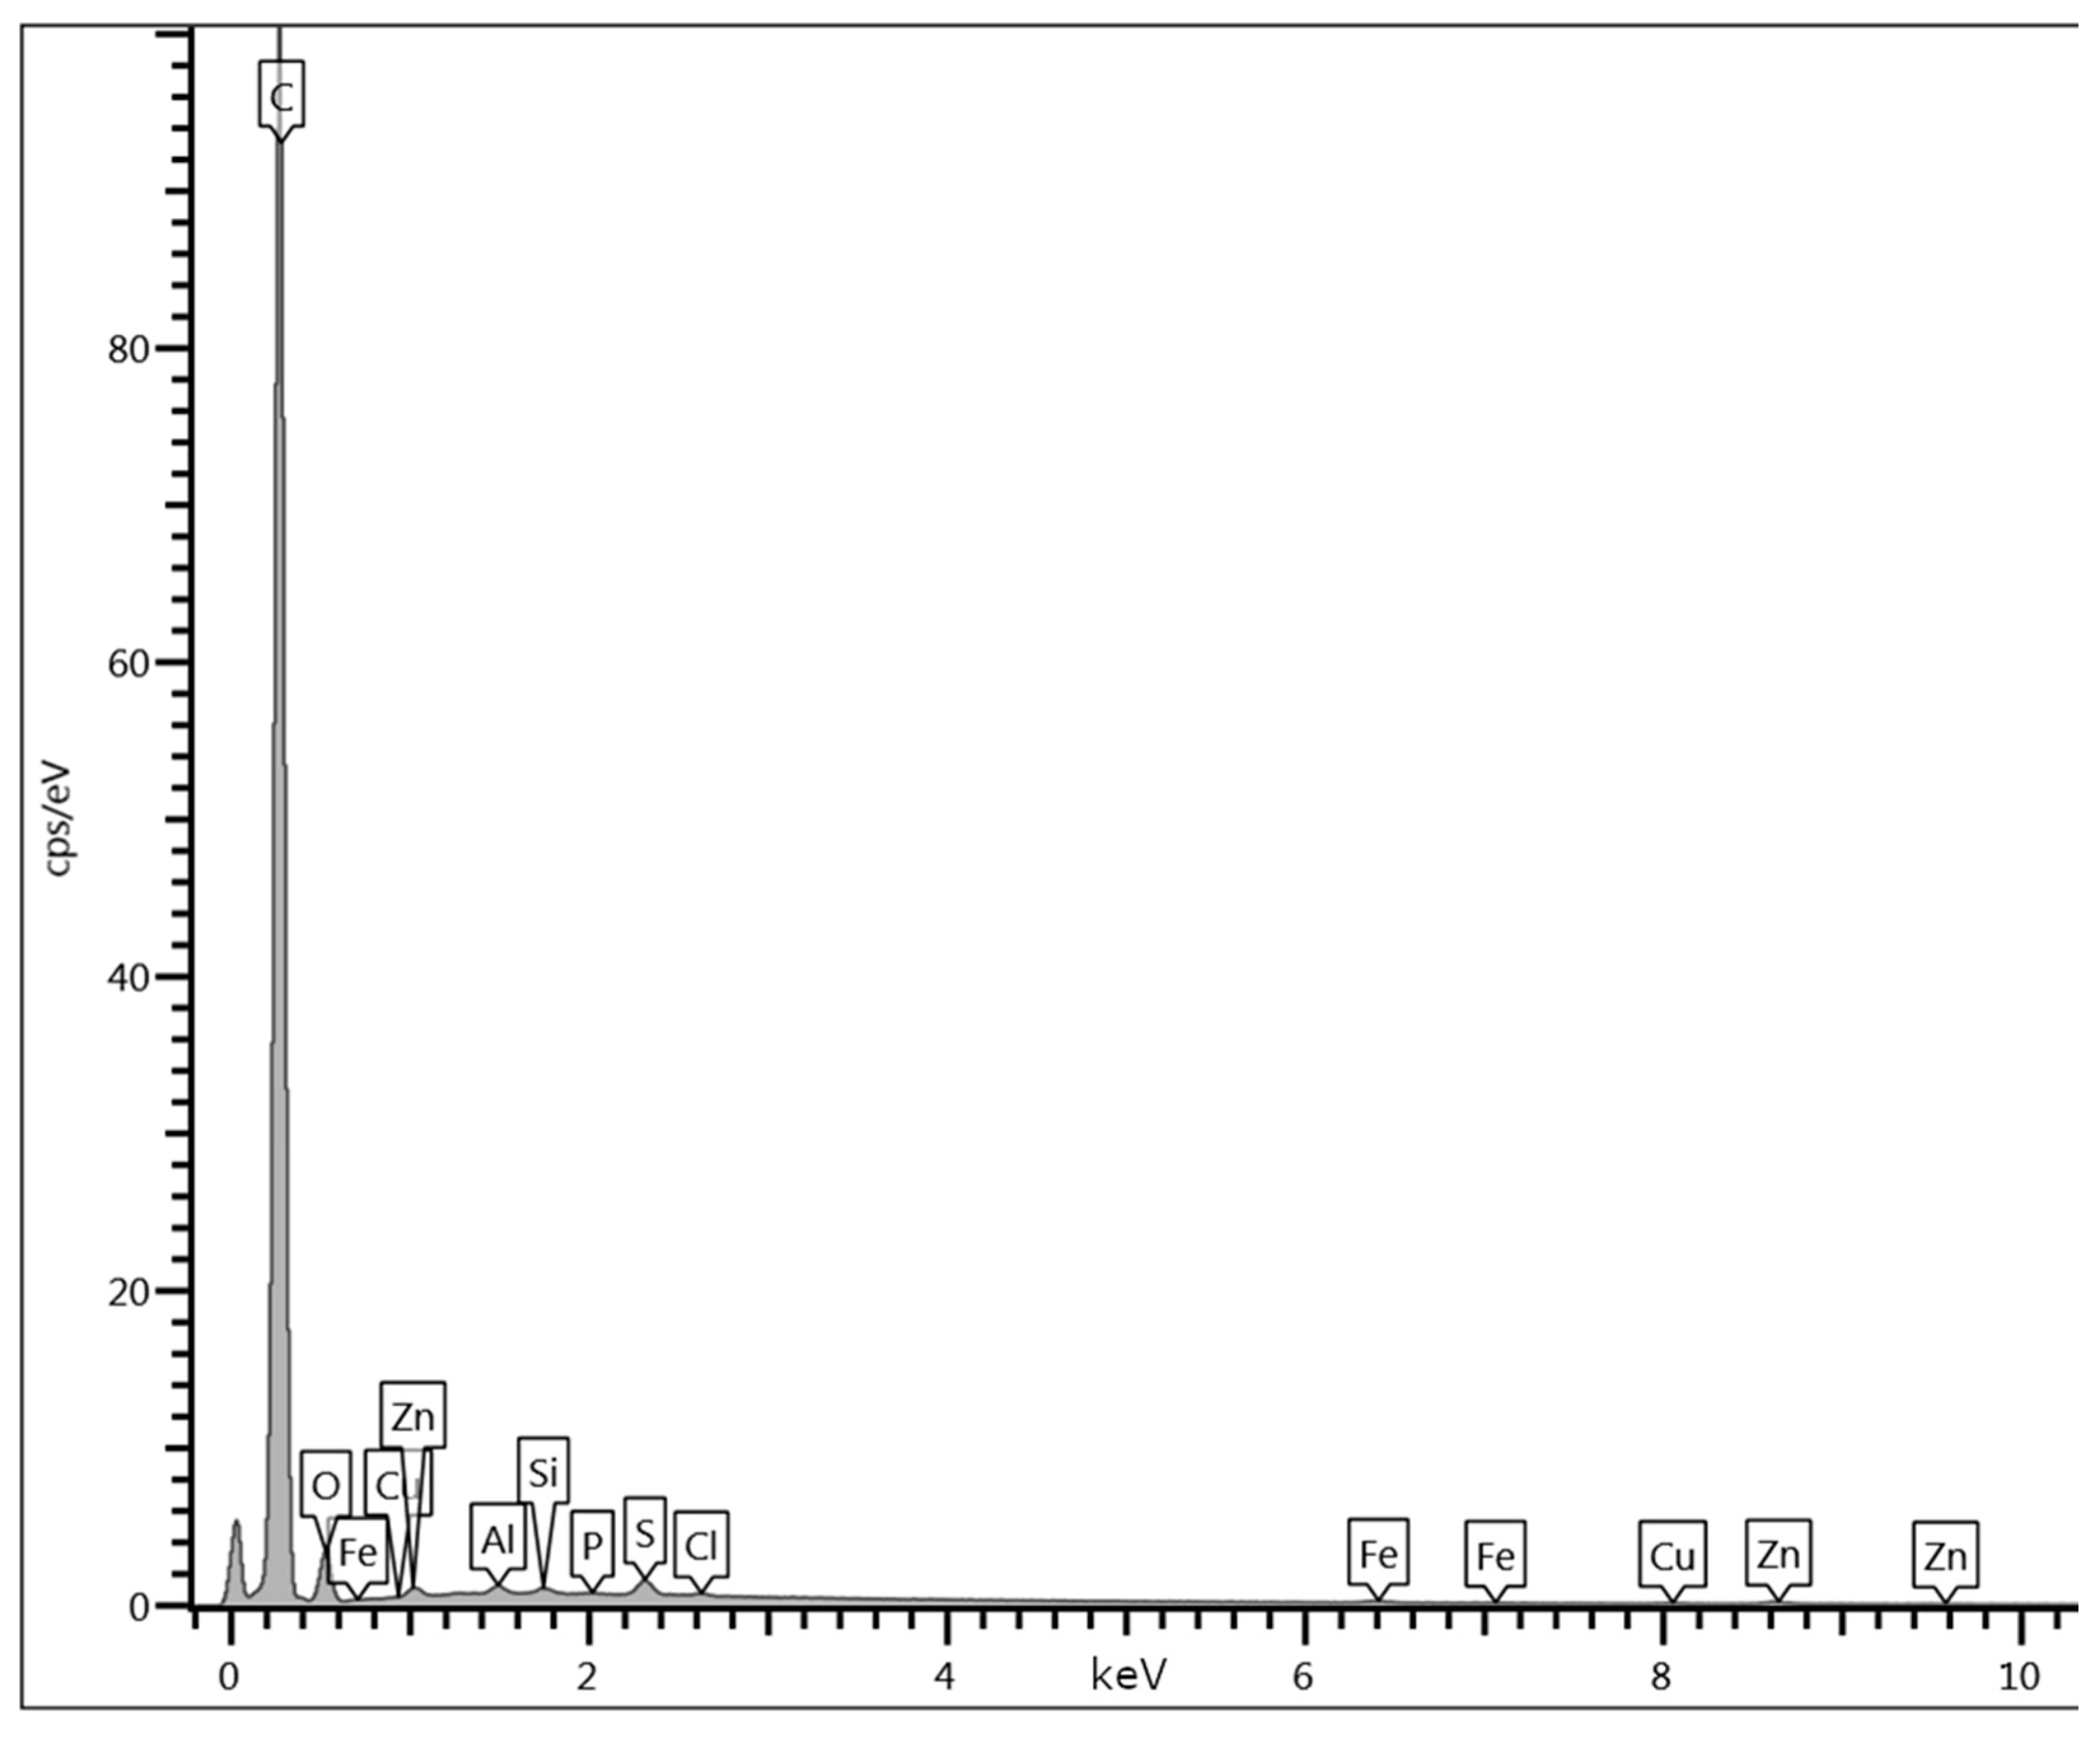
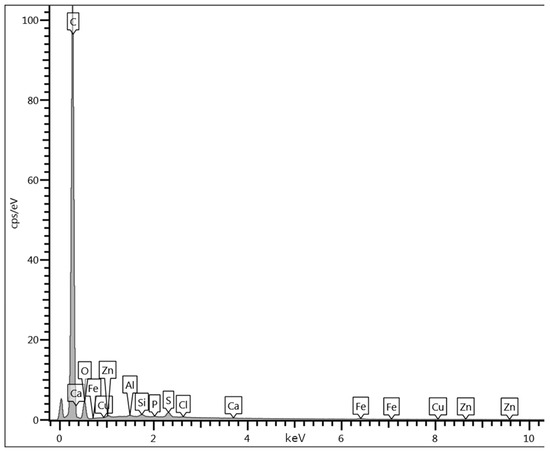
Figure A9.
Energy specter derived from SEM-EDS of PDAC-0.5.
Figure A9.
Energy specter derived from SEM-EDS of PDAC-0.5.
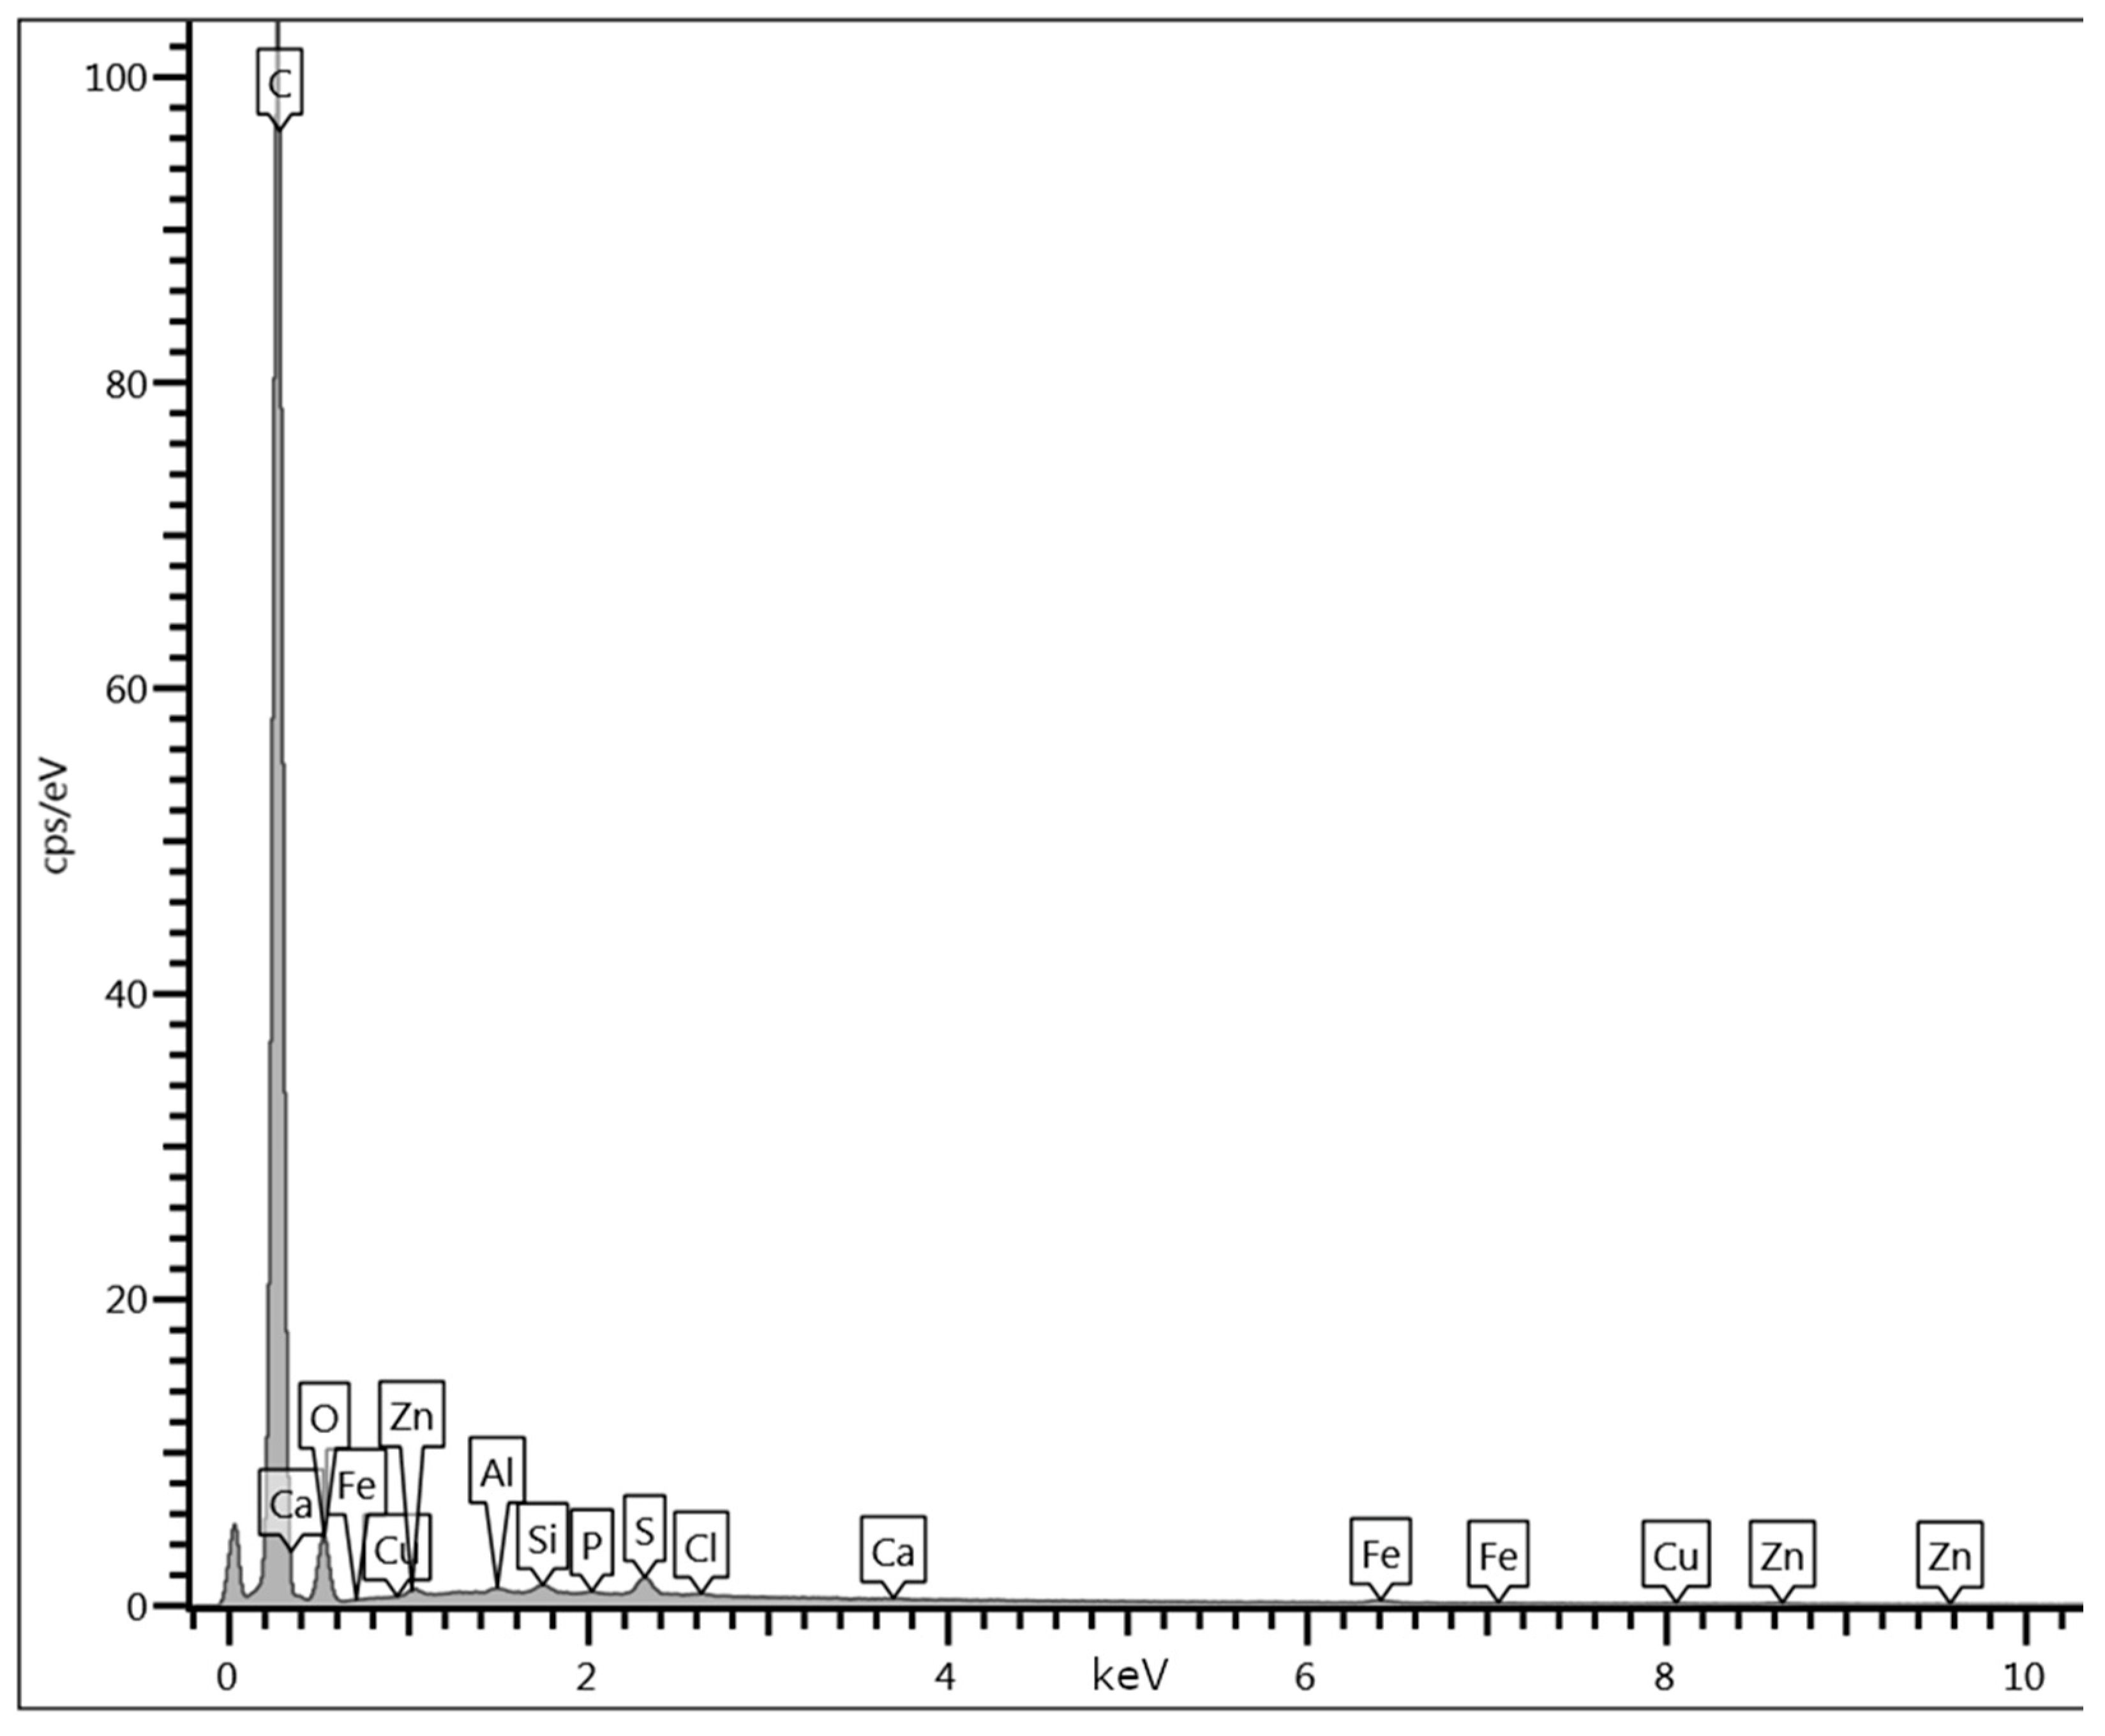

Figure A10.
Energy specter derived from SEM-EDS of PDAC-0.2.
Figure A10.
Energy specter derived from SEM-EDS of PDAC-0.2.


Figure A11.
Energy specter derived from SEM-EDS of PDAC-0.15.
Figure A11.
Energy specter derived from SEM-EDS of PDAC-0.15.
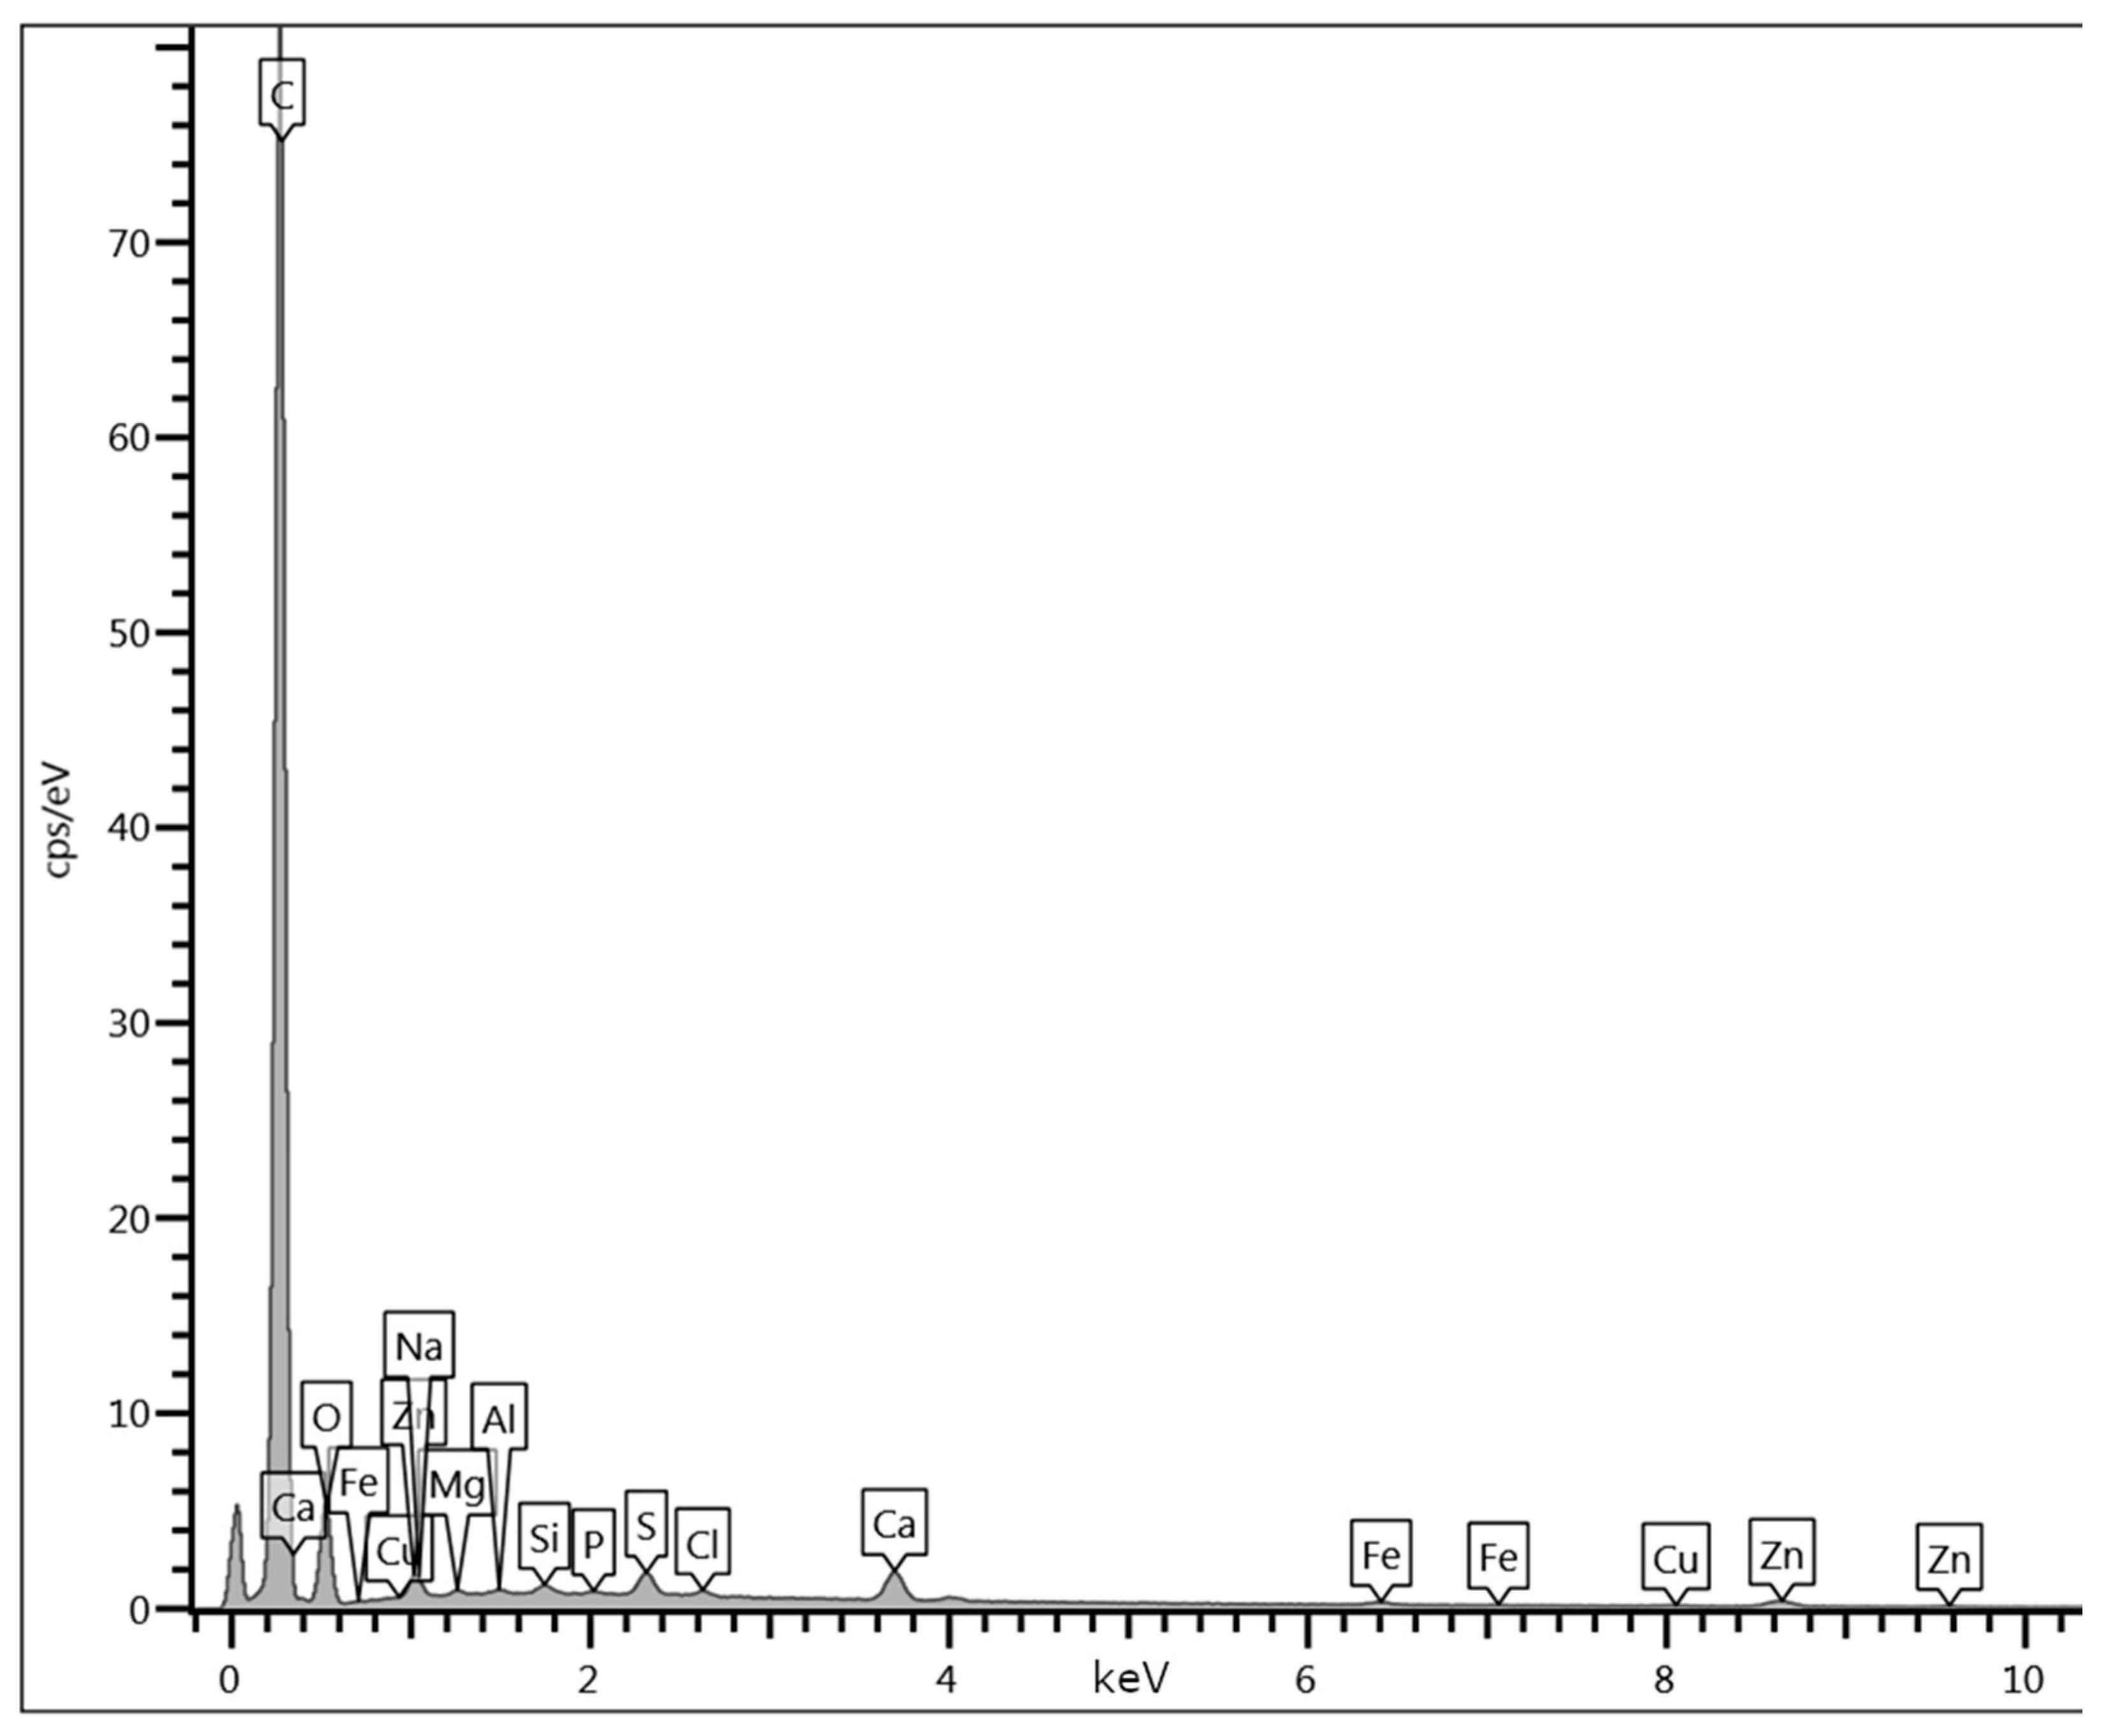

Figure A12.
Energy specter derived from SEM-EDS of PDAC-0.1.
Figure A12.
Energy specter derived from SEM-EDS of PDAC-0.1.

Appendix D

Figure A13.
H2 adsorption (squares) and desorption (triangles) isotherms for all PDACs.
Figure A13.
H2 adsorption (squares) and desorption (triangles) isotherms for all PDACs.
References
- Staffell, I.; Scamman, D.; Velazquez Abad, A.; Balcombe, P.; Dodds, P.E.; Ekins, P.; Shah, N.; Ward, K.R. The Role of Hydrogen and Fuel Cells in the Global Energy System. Energy Environ. Sci. 2019, 12, 463–491. [Google Scholar] [CrossRef]
- Ramachandran, R. An Overview of Industrial Uses of Hydrogen. Int. J. Hydrogen Energy 1998, 23, 593–598. [Google Scholar] [CrossRef]
- Dawood, F.; Anda, M.; Shafiullah, G.M. Hydrogen Production for Energy: An Overview. Int. J. Hydrogen Energy 2020, 45, 3847–3869. [Google Scholar] [CrossRef]
- Nachtane, M.; Tarfaoui, M.; Abichou, M.A.; Vetcher, A.; Rouway, M.; Aâmir, A.; Mouadili, H.; Laaouidi, H.; Naanani, H. An Overview of the Recent Advances in Composite Materials and Artificial Intelligence for Hydrogen Storage Vessels Design. J. Compos. Sci. 2023, 7, 119. [Google Scholar] [CrossRef]
- Zheng, J.; Liu, X.; Xu, P.; Liu, P.; Zhao, Y.; Yang, J. Development of High Pressure Gaseous Hydrogen Storage Technologies. Int. J. Hydrogen Energy 2012, 37, 1048–1057. [Google Scholar] [CrossRef]
- Abohamzeh, E.; Salehi, F.; Sheikholeslami, M.; Abbassi, R.; Khan, F. Review of Hydrogen Safety during Storage, Transmission, and Applications Processes. J. Loss Prev. Process Ind. 2021, 72, 104569. [Google Scholar] [CrossRef]
- Palm, R.; Kurig, H.; Aruväli, J.; Lust, E. NaAlH4/Microporous Carbon Composite Materials for Reversible Hydrogen Storage. Microporous Mesoporous Mater. 2018, 264, 8–12. [Google Scholar] [CrossRef]
- Yushin, G.; Dash, R.; Jagiello, J.; Fischer, J.E.; Gogotsi, Y. Carbide-Derived Carbons: Effect of Pore Size on Hydrogen Uptake and Heat of Adsorption. Adv. Funct. Mater. 2006, 16, 2288–2293. [Google Scholar] [CrossRef]
- Zubizarreta, L.; Arenillas, A.; Pis, J.J. Carbon Materials for H2 Storage. Int. J. Hydrogen Energy 2009, 34, 4575–4581. [Google Scholar] [CrossRef]
- Demiral, İ.; Aydın Şamdan, C.; Demiral, H. Production and Characterization of Activated Carbons from Pumpkin Seed Shell by Chemical Activation with ZnCl2. Desalination Water Treat. 2016, 57, 2446–2454. [Google Scholar] [CrossRef]
- Thomberg, T.; Härmas, M.; Romann, T.; Jänes, A.; Lust, E. Synthesis of Porous Carbon By Hydrothermal Carbonization and Zinc Chloride Activation of Granulated White Sugar for Supercapacitor Application. Meet. Abstr. 2018, MA2018-02, 132. [Google Scholar] [CrossRef]
- Deng, J.; Li, M.; Wang, Y. Biomass-Derived Carbon: Synthesis and Applications in Energy Storage and Conversion. Green Chem. 2016, 18, 4824–4854. [Google Scholar] [CrossRef]
- Tadda, M.A.; Ahsan, A.; Shitu, A.; Elsergany, M.; Thirugnanasambantham, A.; Jose, B.; Razzaque, M.; Norsyahariati, N. A Review on Activated Carbon: Process, Application and Prospects. J. Adv. Civ. Eng. Pract. Res. 2016, 2, 7–13. [Google Scholar]
- Teppor, P.; Jäger, R.; Paalo, M.; Adamson, A.; Härmas, M.; Volobujeva, O.; Aruväli, J.; Palm, R.; Lust, E. Peat as a Carbon Source for Non-Platinum Group Metal Oxygen Electrocatalysts and AEMFC Cathodes. Int. J. Hydrogen Energy 2022, 47, 16908–16920. [Google Scholar] [CrossRef]
- Bénard, P.; Chahine, R. Determination of the Adsorption Isotherms of Hydrogen on Activated Carbons above the Critical Temperature of the Adsorbate over Wide Temperature and Pressure Ranges. Langmuir 2001, 17, 1950–1955. [Google Scholar] [CrossRef]
- Härmas, R.; Palm, R.; Russina, M.; Kurig, H.; Grzimek, V.; Härk, E.; Koppel, M.; Tallo, I.; Paalo, M.; Oll, O.; et al. Transport Properties of H2 Confined in Carbide-Derived Carbons with Different Pore Shapes and Sizes. Carbon 2019, 155, 122–128. [Google Scholar] [CrossRef]
- Koppel, M.; Palm, R.; Härmas, R.; Russina, M.; Grzimek, V.; Jagiello, J.; Paalo, M.; Kurig, H.; Månsson, M.; Oll, O.; et al. Pore Wall Corrugation Effect on the Dynamics of Adsorbed H2 Studied by in Situ Quasi-Elastic Neutron Scattering: Observation of Two Timescaled Diffusion. Carbon 2022, 197, 359–367. [Google Scholar] [CrossRef]
- Koppel, M.; Palm, R.; Härmas, R.; Russina, M.; Matsubara, N.; Månsson, M.; Grzimek, V.; Paalo, M.; Aruväli, J.; Romann, T.; et al. In Situ Observation of Pressure Modulated Reversible Structural Changes in the Graphitic Domains of Carbide-Derived Carbons. Carbon 2021, 174, 190–200. [Google Scholar] [CrossRef]
- Palm, R.; Tallo, I.; Romann, T.; Kurig, H. Methane Adsorption on Specially Designed TiC and Mo2C Derived Carbons with Different Pore Size and Surface Morphology. Microporous Mesoporous Mater. 2015, 218, 167–173. [Google Scholar] [CrossRef]
- Ma, Z.; Yang, Z.; Zhang, H.; Liu, Z. Nitrogen-Doped Microporous Carbon Materials with Uniform Pore Diameters: Design and Applications in CO2 and H2 Adsorption. Microporous Mesoporous Mater. 2020, 296, 109992. [Google Scholar] [CrossRef]
- Tian, M.; Lennox, M.J.; O’Malley, A.J.; Porter, A.J.; Krüner, B.; Rudić, S.; Mays, T.J.; Düren, T.; Presser, V.; Terry, L.R.; et al. Effect of Pore Geometry on Ultra-Densified Hydrogen in Microporous Carbons. Carbon 2021, 173, 968–979. [Google Scholar] [CrossRef]
- Nguyen, T.X.; Bae, J.-S.; Wang, Y.; Bhatia, S.K. On the Strength of the Hydrogen−Carbon Interaction as Deduced from Physisorption. Langmuir 2009, 25, 4314–4319. [Google Scholar] [CrossRef] [PubMed]
- Gogotsi, Y.; Portet, C.; Osswald, S.; Simmons, J.M.; Yildirim, T.; Laudisio, G.; Fischer, J.E. Importance of Pore Size in High-Pressure Hydrogen Storage by Porous Carbons. Int. J. Hydrogen Energy 2009, 34, 6314–6319. [Google Scholar] [CrossRef]
- Yurduşen, A.; Yürüm, A.; Yürüm, Y. A Remarkable Increase in the Adsorbed H2 Amount: Influence of Pore Size Distribution on the H2 Adsorption Capacity of Fe-BTC. Int. J. Hydrogen Energy 2020, 45, 12394–12407. [Google Scholar] [CrossRef]
- Yan, T.; Yang, J.; Lu, J.; Zhou, L.; Zhang, Y.; He, G. Facile Synthesis of Ultra-Microporous Pillar-Layered Metal–Organic Framework Membranes for Highly H2 -Selective Separation. ACS Appl. Mater. Interfaces 2023, 15, 20571–20582. [Google Scholar] [CrossRef]
- Yan, J.; Zhang, B.; Wang, Z. Ultramicroporous Carbons Derived from Semi-Cycloaliphatic Polyimide with Outstanding Adsorption Properties for H2, CO2, and Organic Vapors. J. Phys. Chem. C 2017, 121, 22753–22761. [Google Scholar] [CrossRef]
- Almanassra, I.W.; Kochkodan, V.; Ponnusamy, G.; Mckay, G.; Ali Atieh, M.; Al-Ansari, T. Carbide Derived Carbon (CDC) as Novel Adsorbent for Ibuprofen Removal from Synthetic Water and Treated Sewage Effluent. J. Environ. Health Sci. Eng. 2020, 18, 1375–1390. [Google Scholar] [CrossRef] [PubMed]
- Wu, J.; Zhang, X.; Li, Z.; Yang, C.; Zhong, W.; Li, W.; Zhang, C.; Yang, N.; Zhang, Q.; Li, X. Toward High-Performance Capacitive Potassium-Ion Storage: A Superior Anode Material from Silicon Carbide-Derived Carbon with a Well-Developed Pore Structure. Adv. Funct. Mater. 2020, 30, 2004348. [Google Scholar] [CrossRef]
- Nishihara, H.; Hou, P.-X.; Li, L.-X.; Ito, M.; Uchiyama, M.; Kaburagi, T.; Ikura, A.; Katamura, J.; Kawarada, T.; Mizuuchi, K.; et al. High-Pressure Hydrogen Storage in Zeolite-Templated Carbon. J. Phys. Chem. C 2009, 113, 3189–3196. [Google Scholar] [CrossRef]
- Sevilla, M.; Alam, N.; Mokaya, R. Enhancement of Hydrogen Storage Capacity of Zeolite-Templated Carbons by Chemical Activation. J. Phys. Chem. C 2010, 114, 11314–11319. [Google Scholar] [CrossRef]
- Stadie, N.P.; Vajo, J.J.; Cumberland, R.W.; Wilson, A.A.; Ahn, C.C.; Fultz, B. Zeolite-Templated Carbon Materials for High-Pressure Hydrogen Storage. Langmuir 2012, 28, 10057–10063. [Google Scholar] [CrossRef] [PubMed]
- Zhao, H.; Li, L.; Liu, Y.; Geng, X.; Yang, H.; Sun, C.; An, B. Synthesis and ORR Performance of Nitrogen-Doped Ordered Microporous Carbon by CVD of Acetonitrile Vapor Using Silanized Zeolite as Template. Appl. Surf. Sci. 2020, 504, 144438. [Google Scholar] [CrossRef]
- Sdanghi, G.; Canevesi, R.L.S.; Celzard, A.; Thommes, M.; Fierro, V. Characterization of Carbon Materials for Hydrogen Storage and Compression. C 2020, 6, 46. [Google Scholar] [CrossRef]
- Heidarinejad, Z.; Dehghani, M.H.; Heidari, M.; Javedan, G.; Ali, I.; Sillanpää, M. Methods for Preparation and Activation of Activated Carbon: A Review. Environ. Chem. Lett. 2020, 18, 393–415. [Google Scholar] [CrossRef]
- Härmas, M.; Thomberg, T.; Kurig, H.; Romann, T.; Jänes, A.; Lust, E. Microporous–Mesoporous Carbons for Energy Storage Synthesized by Activation of Carbonaceous Material by Zinc Chloride, Potassium Hydroxide or Mixture of Them. J. Power Sources 2016, 326, 624–634. [Google Scholar] [CrossRef]
- Varila, T.; Bergna, D.; Lahti, R.; Romar, H.; Hu, T.; Lassi, U. Activated Carbon Production from Peat Using ZnCl2: Characterization and Applications. BioResources 2017, 12, 8078–8092. [Google Scholar] [CrossRef]
- Saramas, D.; Ekgasit, S. Nano-Zinc Oxide-Doped Activated Carbon from Popped Rice and Its Application for Feed Additive. Eng. J. 2021, 25, 41–50. [Google Scholar] [CrossRef]
- Liou, T.-H. Development of Mesoporous Structure and High Adsorption Capacity of Biomass-Based Activated Carbon by Phosphoric Acid and Zinc Chloride Activation. Chem. Eng. J. 2010, 158, 129–142. [Google Scholar] [CrossRef]
- Yorgun, S.; Vural, N.; Demiral, H. Preparation of High-Surface Area Activated Carbons from Paulownia Wood by ZnCl2 Activation. Microporous Mesoporous Mater. 2009, 122, 189–194. [Google Scholar] [CrossRef]
- Agbozu, I.E.; Wategire, O.P. Comparative Carbon Synthesis of Peat Using ZnCl2 and H3PO4 for Heavy Metal Adsorption in Oilfield Produced Water. Int. Res. J. Pure Appl. Chem. 2023, 24, 81–94. [Google Scholar] [CrossRef]
- Azwar, E.; Wan Mahari, W.A.; Chuah, J.H.; Vo, D.-V.N.; Ma, N.L.; Lam, W.H.; Lam, S.S. Transformation of Biomass into Carbon Nanofiber for Supercapacitor Application–A Review. Int. J. Hydrogen Energy 2018, 43, 20811–20821. [Google Scholar] [CrossRef]
- Contescu, C.; Adhikari, S.; Gallego, N.; Evans, N.; Biss, B. Activated Carbons Derived from High-Temperature Pyrolysis of Lignocellulosic Biomass. C 2018, 4, 51. [Google Scholar] [CrossRef]
- Kosheleva, R.I.; Mitropoulos, A.C.; Kyzas, G.Z. Synthesis of Activated Carbon from Food Waste. Environ. Chem. Lett. 2019, 17, 429–438. [Google Scholar] [CrossRef]
- Juárez-Galán, J.M.; Silvestre-Albero, A.; Silvestre-Albero, J.; Rodríguez-Reinoso, F. Synthesis of Activated Carbon with Highly Developed “Mesoporosity”. Microporous Mesoporous Mater. 2009, 117, 519–521. [Google Scholar] [CrossRef]
- Ogungbenro, A.E.; Quang, D.V.; Al-Ali, K.A.; Vega, L.F.; Abu-Zahra, M.R.M. Synthesis and Characterization of Activated Carbon from Biomass Date Seeds for Carbon Dioxide Adsorption. J. Environ. Chem. Eng. 2020, 8, 104257. [Google Scholar] [CrossRef]
- Ren, Z.; Romar, H.; Varila, T.; Xu, X.; Wang, Z.; Sillanpää, M.; Leiviskä, T. Ibuprofen Degradation Using a Co-Doped Carbon Matrix Derived from Peat as a Peroxymonosulphate Activator. Environ. Res. 2021, 193, 110564. [Google Scholar] [CrossRef]
- Varghese, S.M.; Chowdhury, A.R.; Arnepalli, D.N.; Ranga Rao, G. Delineating the Effects of Pore Structure and N-Doping on CO2 Adsorption Using Coco Peat Derived Carbon. Carbon Trends 2023, 10, 100250. [Google Scholar] [CrossRef]
- Shkolin, A.V.; Strizhenov, E.M.; Chugaev, S.S.; Men’shchikov, I.E.; Gaidamavichute, V.V.; Grinchenko, A.E.; Zherdev, A.A. Natural Gas Storage Filled with Peat-Derived Carbon Adsorbent: Influence of Nonisothermal Effects and Ethane Impurities on the Storage Cycle. Nanomaterials 2022, 12, 4066. [Google Scholar] [CrossRef]
- Men’shchikov, I.; Shkolin, A.; Khozina, E.; Fomkin, A. Thermodynamics of Adsorbed Methane Storage Systems Based on Peat-Derived Activated Carbons. Nanomaterials 2020, 10, 1379. [Google Scholar] [CrossRef]
- Adamson, A.; Väli, R.; Paalo, M.; Aruväli, J.; Koppel, M.; Palm, R.; Härk, E.; Nerut, J.; Romann, T.; Lust, E.; et al. Peat-Derived Hard Carbon Electrodes with Superior Capacity for Sodium-Ion Batteries. RSC Adv. 2020, 10, 20145–20154. [Google Scholar] [CrossRef]
- Paalo, M.; Härmas, M.; Romann, T.; Jänes, A.; Lust, E. Modification of Micro/Mesoporous Carbon Synthesis Method from Well Decomposed Peat Using ZnCl2 Additional Activation Step. Electrochem. Commun. 2023, 153, 107543. [Google Scholar] [CrossRef]
- Ma, Y. Comparison of Activated Carbons Prepared from Wheat Straw via ZnCl2 and KOH Activation. Waste Biomass Valor. 2017, 8, 549–559. [Google Scholar] [CrossRef]
- Nguyen, T.-B.; Truong, Q.-M.; Chen, C.-W.; Doong, R.; Chen, W.-H.; Dong, C.-D. Mesoporous and Adsorption Behavior of Algal Biochar Prepared via Sequential Hydrothermal Carbonization and ZnCl2 Activation. Bioresour. Technol. 2022, 346, 126351. [Google Scholar] [CrossRef]
- Gates-Rector, S.; Blanton, T. The Powder Diffraction File: A Quality Materials Characterization Database. Powder Diffr. 2019, 34, 352–360. [Google Scholar] [CrossRef]
- Brunauer, S.; Emmett, P.H.; Teller, E. Adsorption of Gases in Multimolecular Layers. J. Am. Chem. Soc. 1938, 60, 309–319. [Google Scholar] [CrossRef]
- Jagiello, J.; Ania, C.; Parra, J.B.; Cook, C. Dual Gas Analysis of Microporous Carbons Using 2D-NLDFT Heterogeneous Surface Model and Combined Adsorption Data of N2 and CO2. Carbon 2015, 91, 330–337. [Google Scholar] [CrossRef]
- Jagiello, J.; Olivier, J.P. Carbon Slit Pore Model Incorporating Surface Energetical Heterogeneity and Geometrical Corrugation. Adsorption 2013, 19, 777–783. [Google Scholar] [CrossRef]
- Do, D.D. Adsorption Analysis: Equilibria and Kinetics; Series on chemical engineering; Imperial College Press: London, UK, 1998; ISBN 978-1-86094-130-6. [Google Scholar]
- Karthikeyan, R.; Wang, B.; Xuan, J.; Wong, J.W.C.; Lee, P.K.H.; Leung, M.K.H. Interfacial Electron Transfer and Bioelectrocatalysis of Carbonized Plant Material as Effective Anode of Microbial Fuel Cell. Electrochim. Acta 2015, 157, 314–323. [Google Scholar] [CrossRef]
- Brodowski, S.; Amelung, W.; Haumaier, L.; Abetz, C.; Zech, W. Morphological and Chemical Properties of Black Carbon in Physical Soil Fractions as Revealed by Scanning Electron Microscopy and Energy-Dispersive X-Ray Spectroscopy. Geoderma 2005, 128, 116–129. [Google Scholar] [CrossRef]
- Steinmann, P.; Shotyk, W. Chemical Composition, pH, and Redox State of Sulfur and Iron in Complete Vertical Porewater Profiles from Two Sphagnum Peat Bogs, Jura Mountains, Switzerland. Geochim. Cosmochim. Acta 1997, 61, 1143–1163. [Google Scholar] [CrossRef]
- Zhang, X.; Lin, R.; Wang, J.; Wang, B.; Liang, B.; Yildirim, T.; Zhang, J.; Zhou, W.; Chen, B. Optimization of the Pore Structures of MOFs for Record High Hydrogen Volumetric Working Capacity. Adv. Mater. 2020, 32, 1907995. [Google Scholar] [CrossRef] [PubMed]
- Thommes, M.; Kaneko, K.; Neimark, A.V.; Olivier, J.P.; Rodriguez-Reinoso, F.; Rouquerol, J.; Sing, K.S.W. Physisorption of Gases, with Special Reference to the Evaluation of Surface Area and Pore Size Distribution (IUPAC Technical Report). Pure Appl. Chem. 2015, 87, 1051–1069. [Google Scholar] [CrossRef]
- Rogacka, J.; Firlej, L.; Kuchta, B. Modeling of Low Temperature Adsorption of Hydrogen in Carbon Nanopores. J. Mol. Model. 2017, 23, 20. [Google Scholar] [CrossRef] [PubMed]
- Beenakker, J.J.M.; Borman, V.D.; Krylov, S.Y. Molecular Transport in Subnanometer Pores: Zero-Point Energy, Reduced Dimensionality and Quantum Sieving. Chem. Phys. Lett. 1995, 232, 379–382. [Google Scholar] [CrossRef]
- Jagiello, J.; Kenvin, J.; Ania, C.O.; Parra, J.B.; Celzard, A.; Fierro, V. Exploiting the Adsorption of Simple Gases O2 and H2 with Minimal Quadrupole Moments for the Dual Gas Characterization of Nanoporous Carbons Using 2D-NLDFT Models. Carbon 2020, 160, 164–175. [Google Scholar] [CrossRef]
- Contescu, C.I.; Saha, D.; Gallego, N.C.; Mamontov, E.; Kolesnikov, A.I.; Bhat, V.V. Restricted Dynamics of Molecular Hydrogen Confined in Activated Carbon Nanopores. Carbon 2012, 50, 1071–1082. [Google Scholar] [CrossRef]
- Ting, V.P.; Ramirez-Cuesta, A.J.; Bimbo, N.; Sharpe, J.E.; Noguera-Diaz, A.; Presser, V.; Rudic, S.; Mays, T.J. Direct Evidence for Solid-like Hydrogen in a Nanoporous Carbon Hydrogen Storage Material at Supercritical Temperatures. ACS Nano 2015, 9, 8249–8254. [Google Scholar] [CrossRef]
- Gallego, N.C.; He, L.; Saha, D.; Contescu, C.I.; Melnichenko, Y.B. Hydrogen Confinement in Carbon Nanopores: Extreme Densification at Ambient Temperature. J. Am. Chem. Soc. 2011, 133, 13794–13797. [Google Scholar] [CrossRef]

Disclaimer/Publisher’s Note: The statements, opinions and data contained in all publications are solely those of the individual author(s) and contributor(s) and not of MDPI and/or the editor(s). MDPI and/or the editor(s) disclaim responsibility for any injury to people or property resulting from any ideas, methods, instructions or products referred to in the content. |
© 2023 by the authors. Licensee MDPI, Basel, Switzerland. This article is an open access article distributed under the terms and conditions of the Creative Commons Attribution (CC BY) license (https://creativecommons.org/licenses/by/4.0/).