
Effect of Heat Treatment Parameters on the Modification of Nano Residual Austenite of Low-Carbon Medium-Chromium Steel


Abstract
:1. Introduction
2. Experiments
2.1. Materials
2.2. Microstructure Investigation and Properties Test
3. Results and Discussion
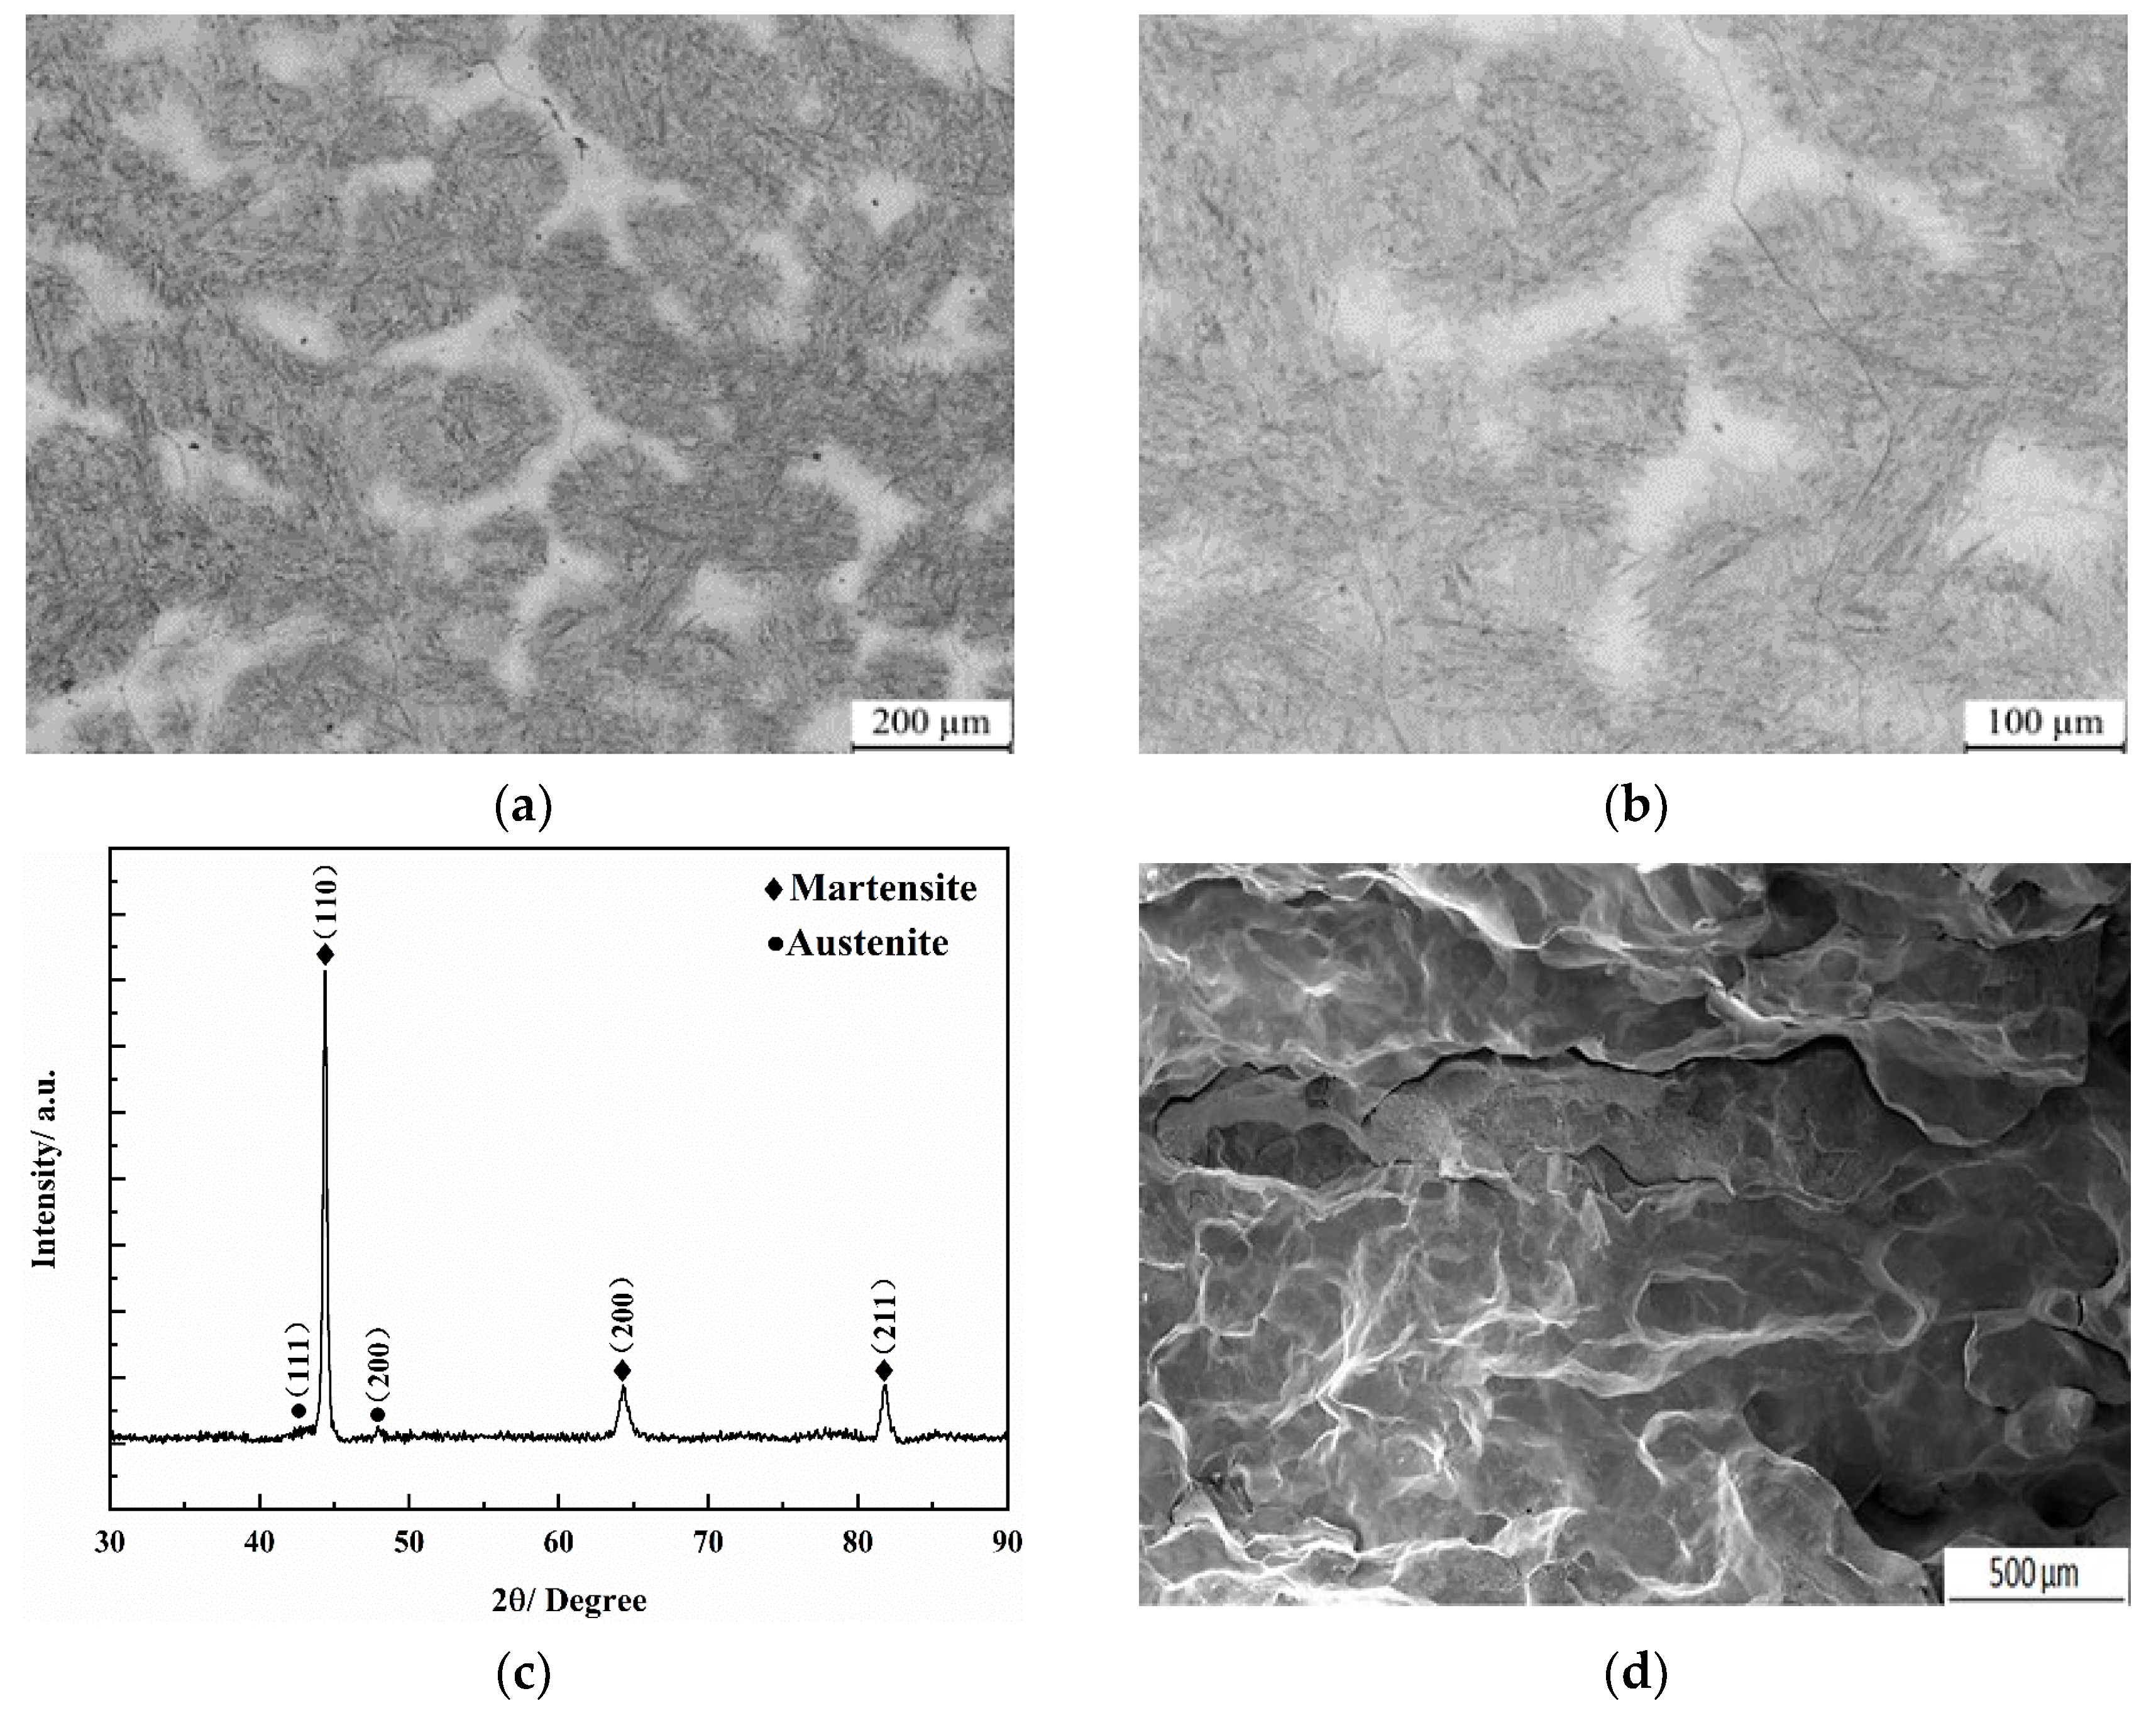
3.1. As-Cast
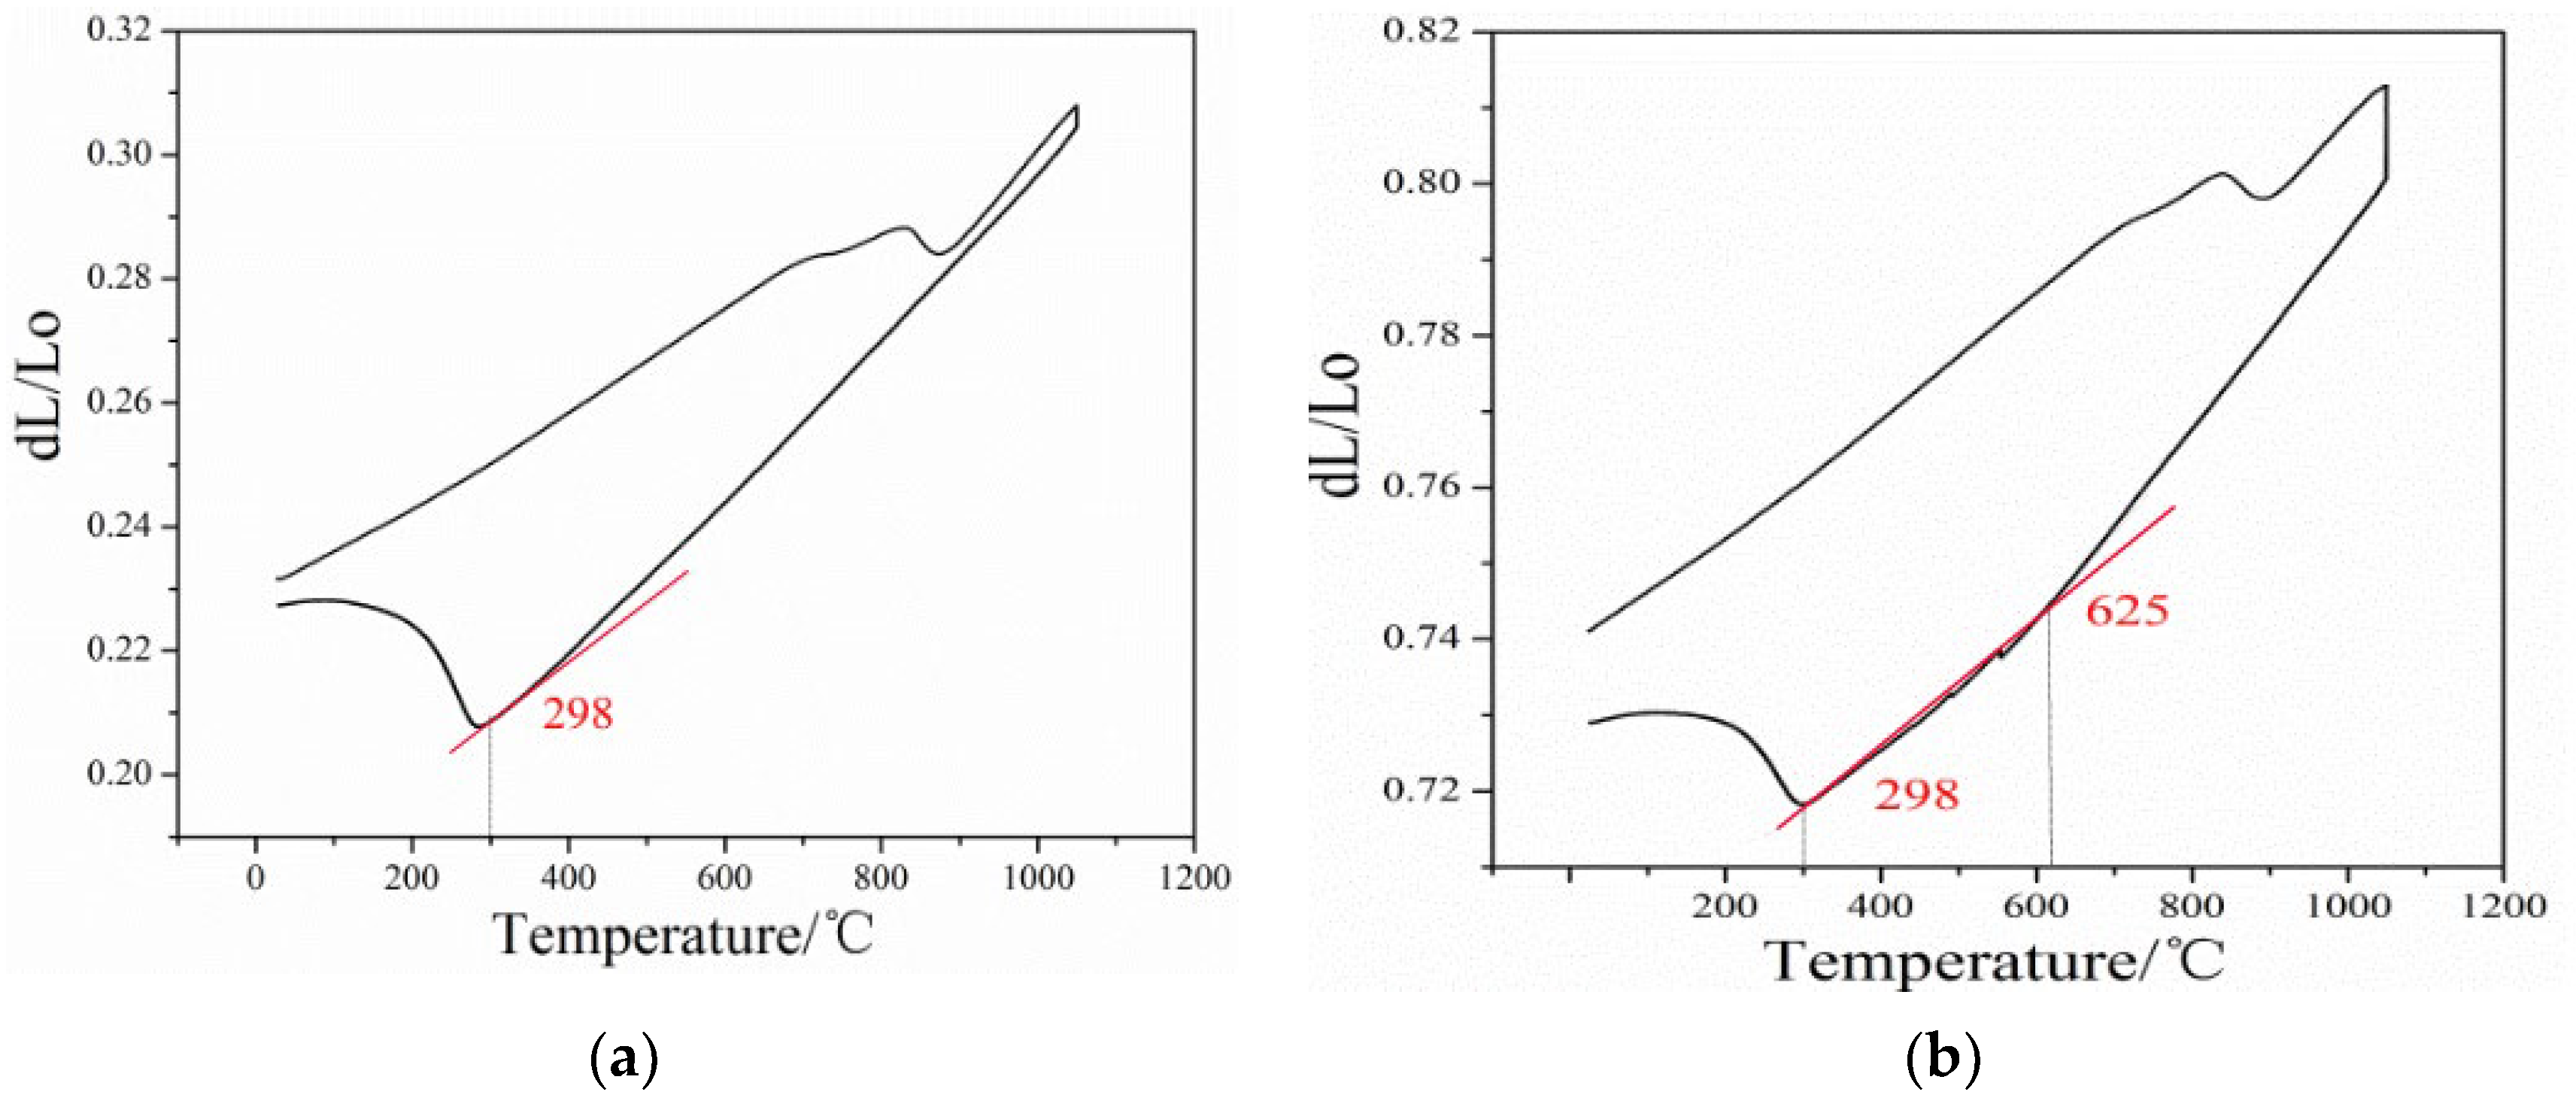
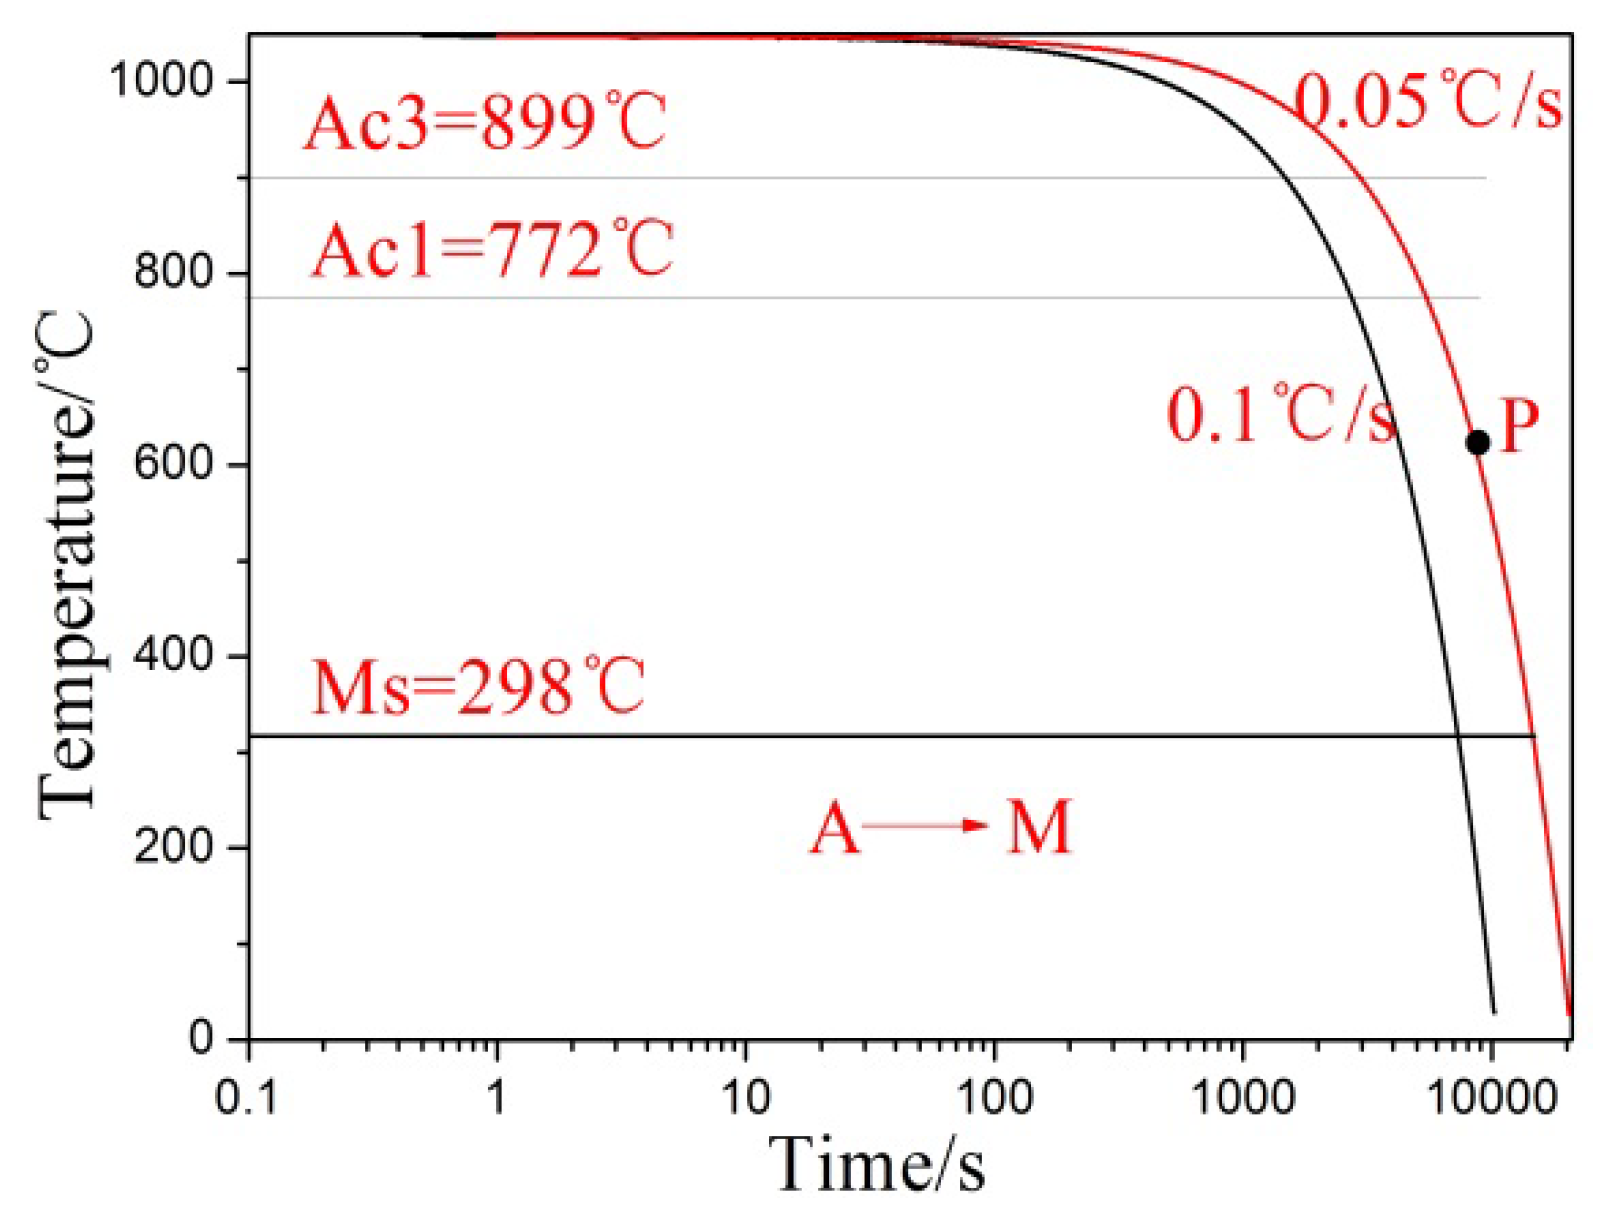
3.2. Cooling Transformation Curve and Critical Cooling Rate
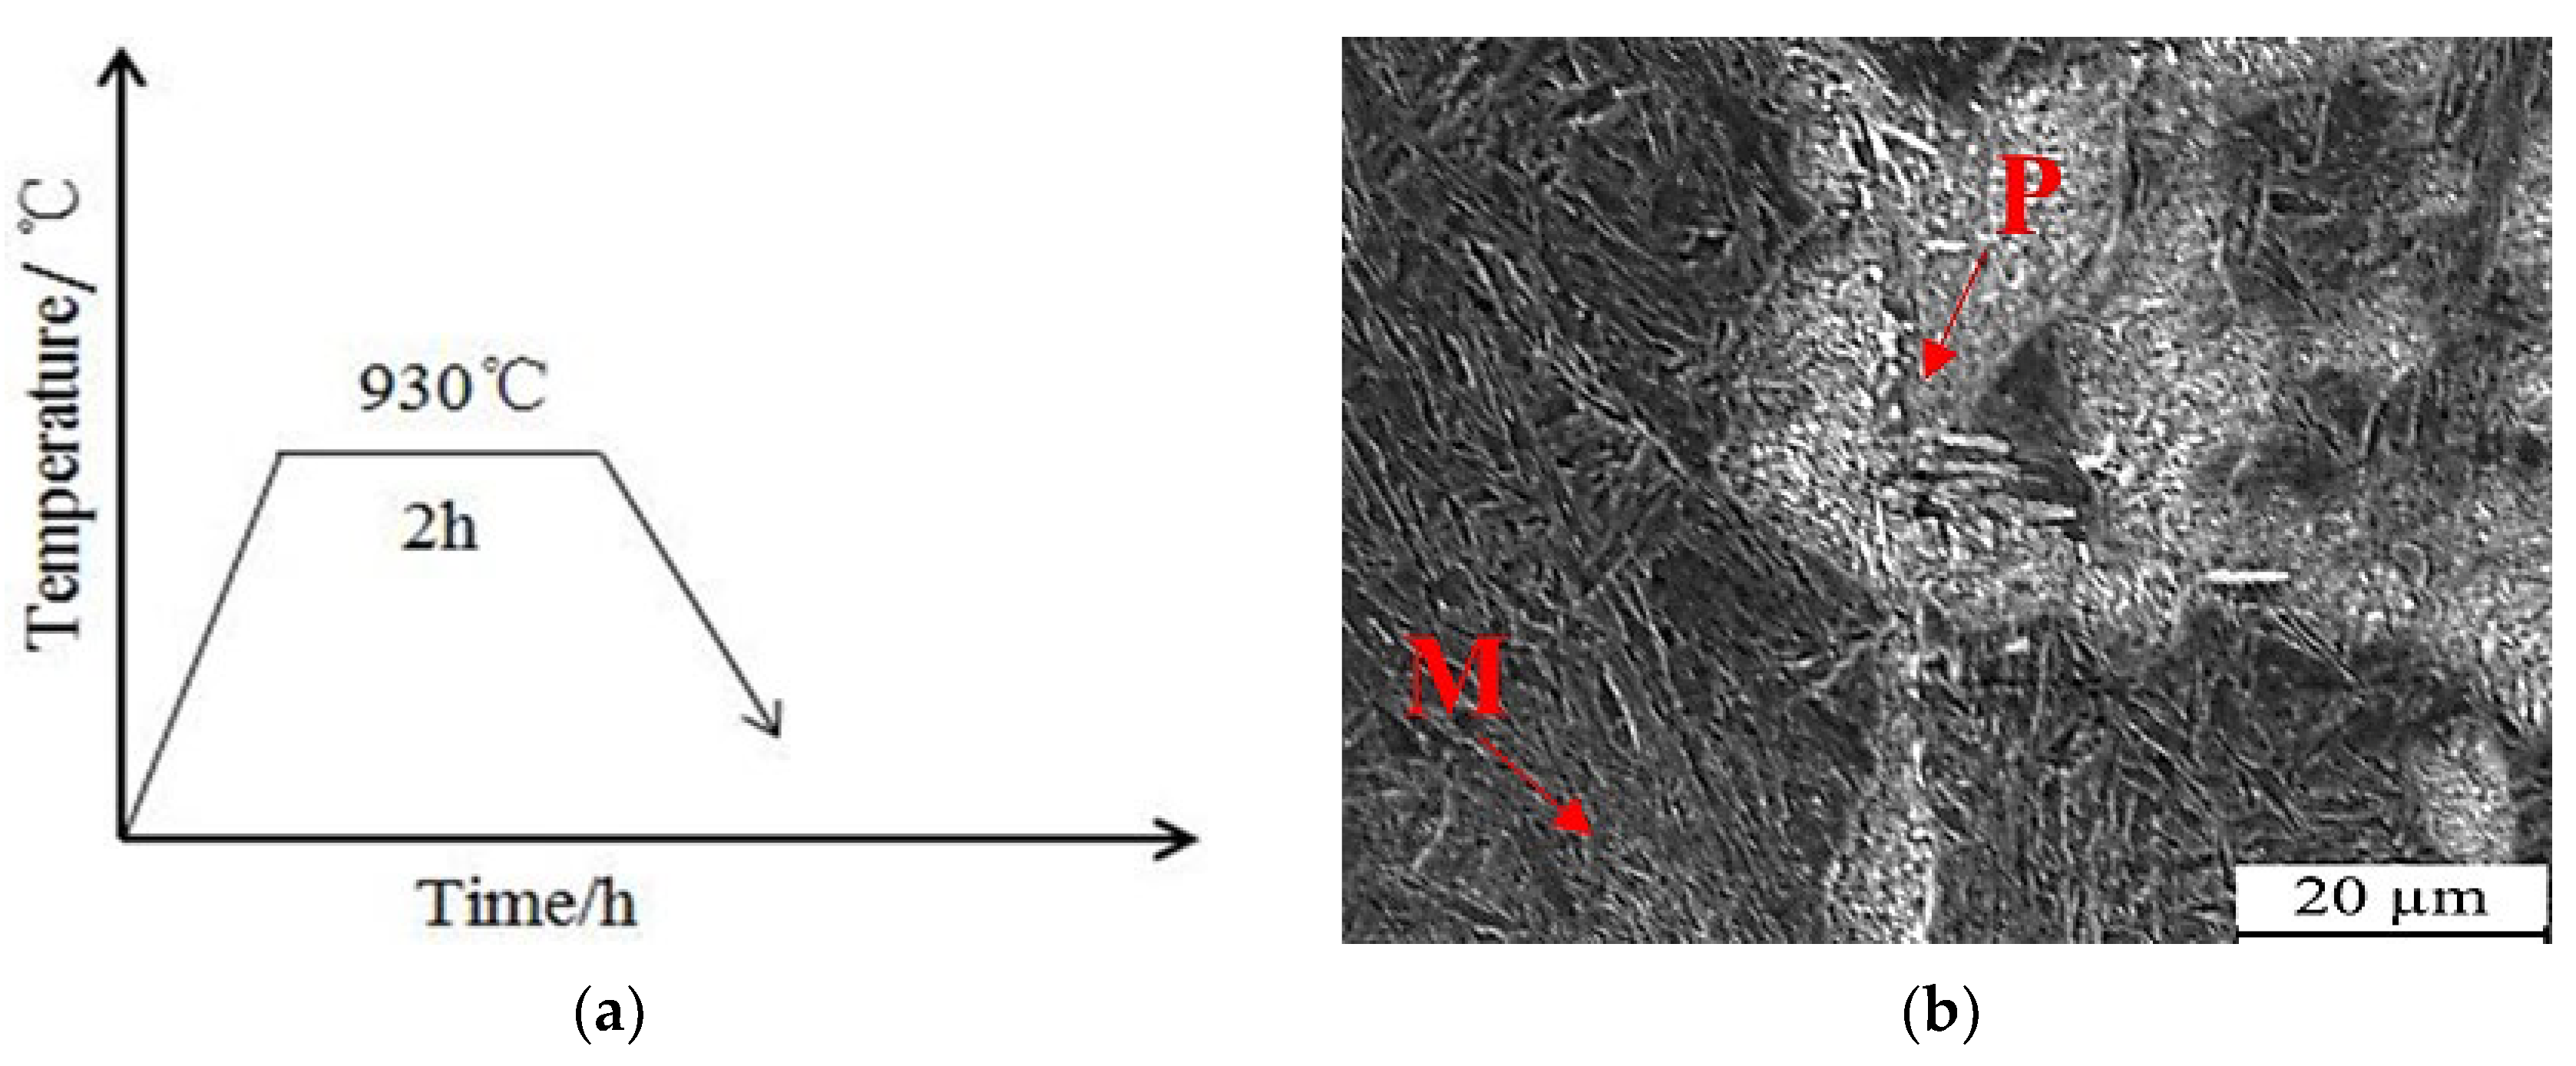
3.3. Annealing Process
3.4. Quenching Process
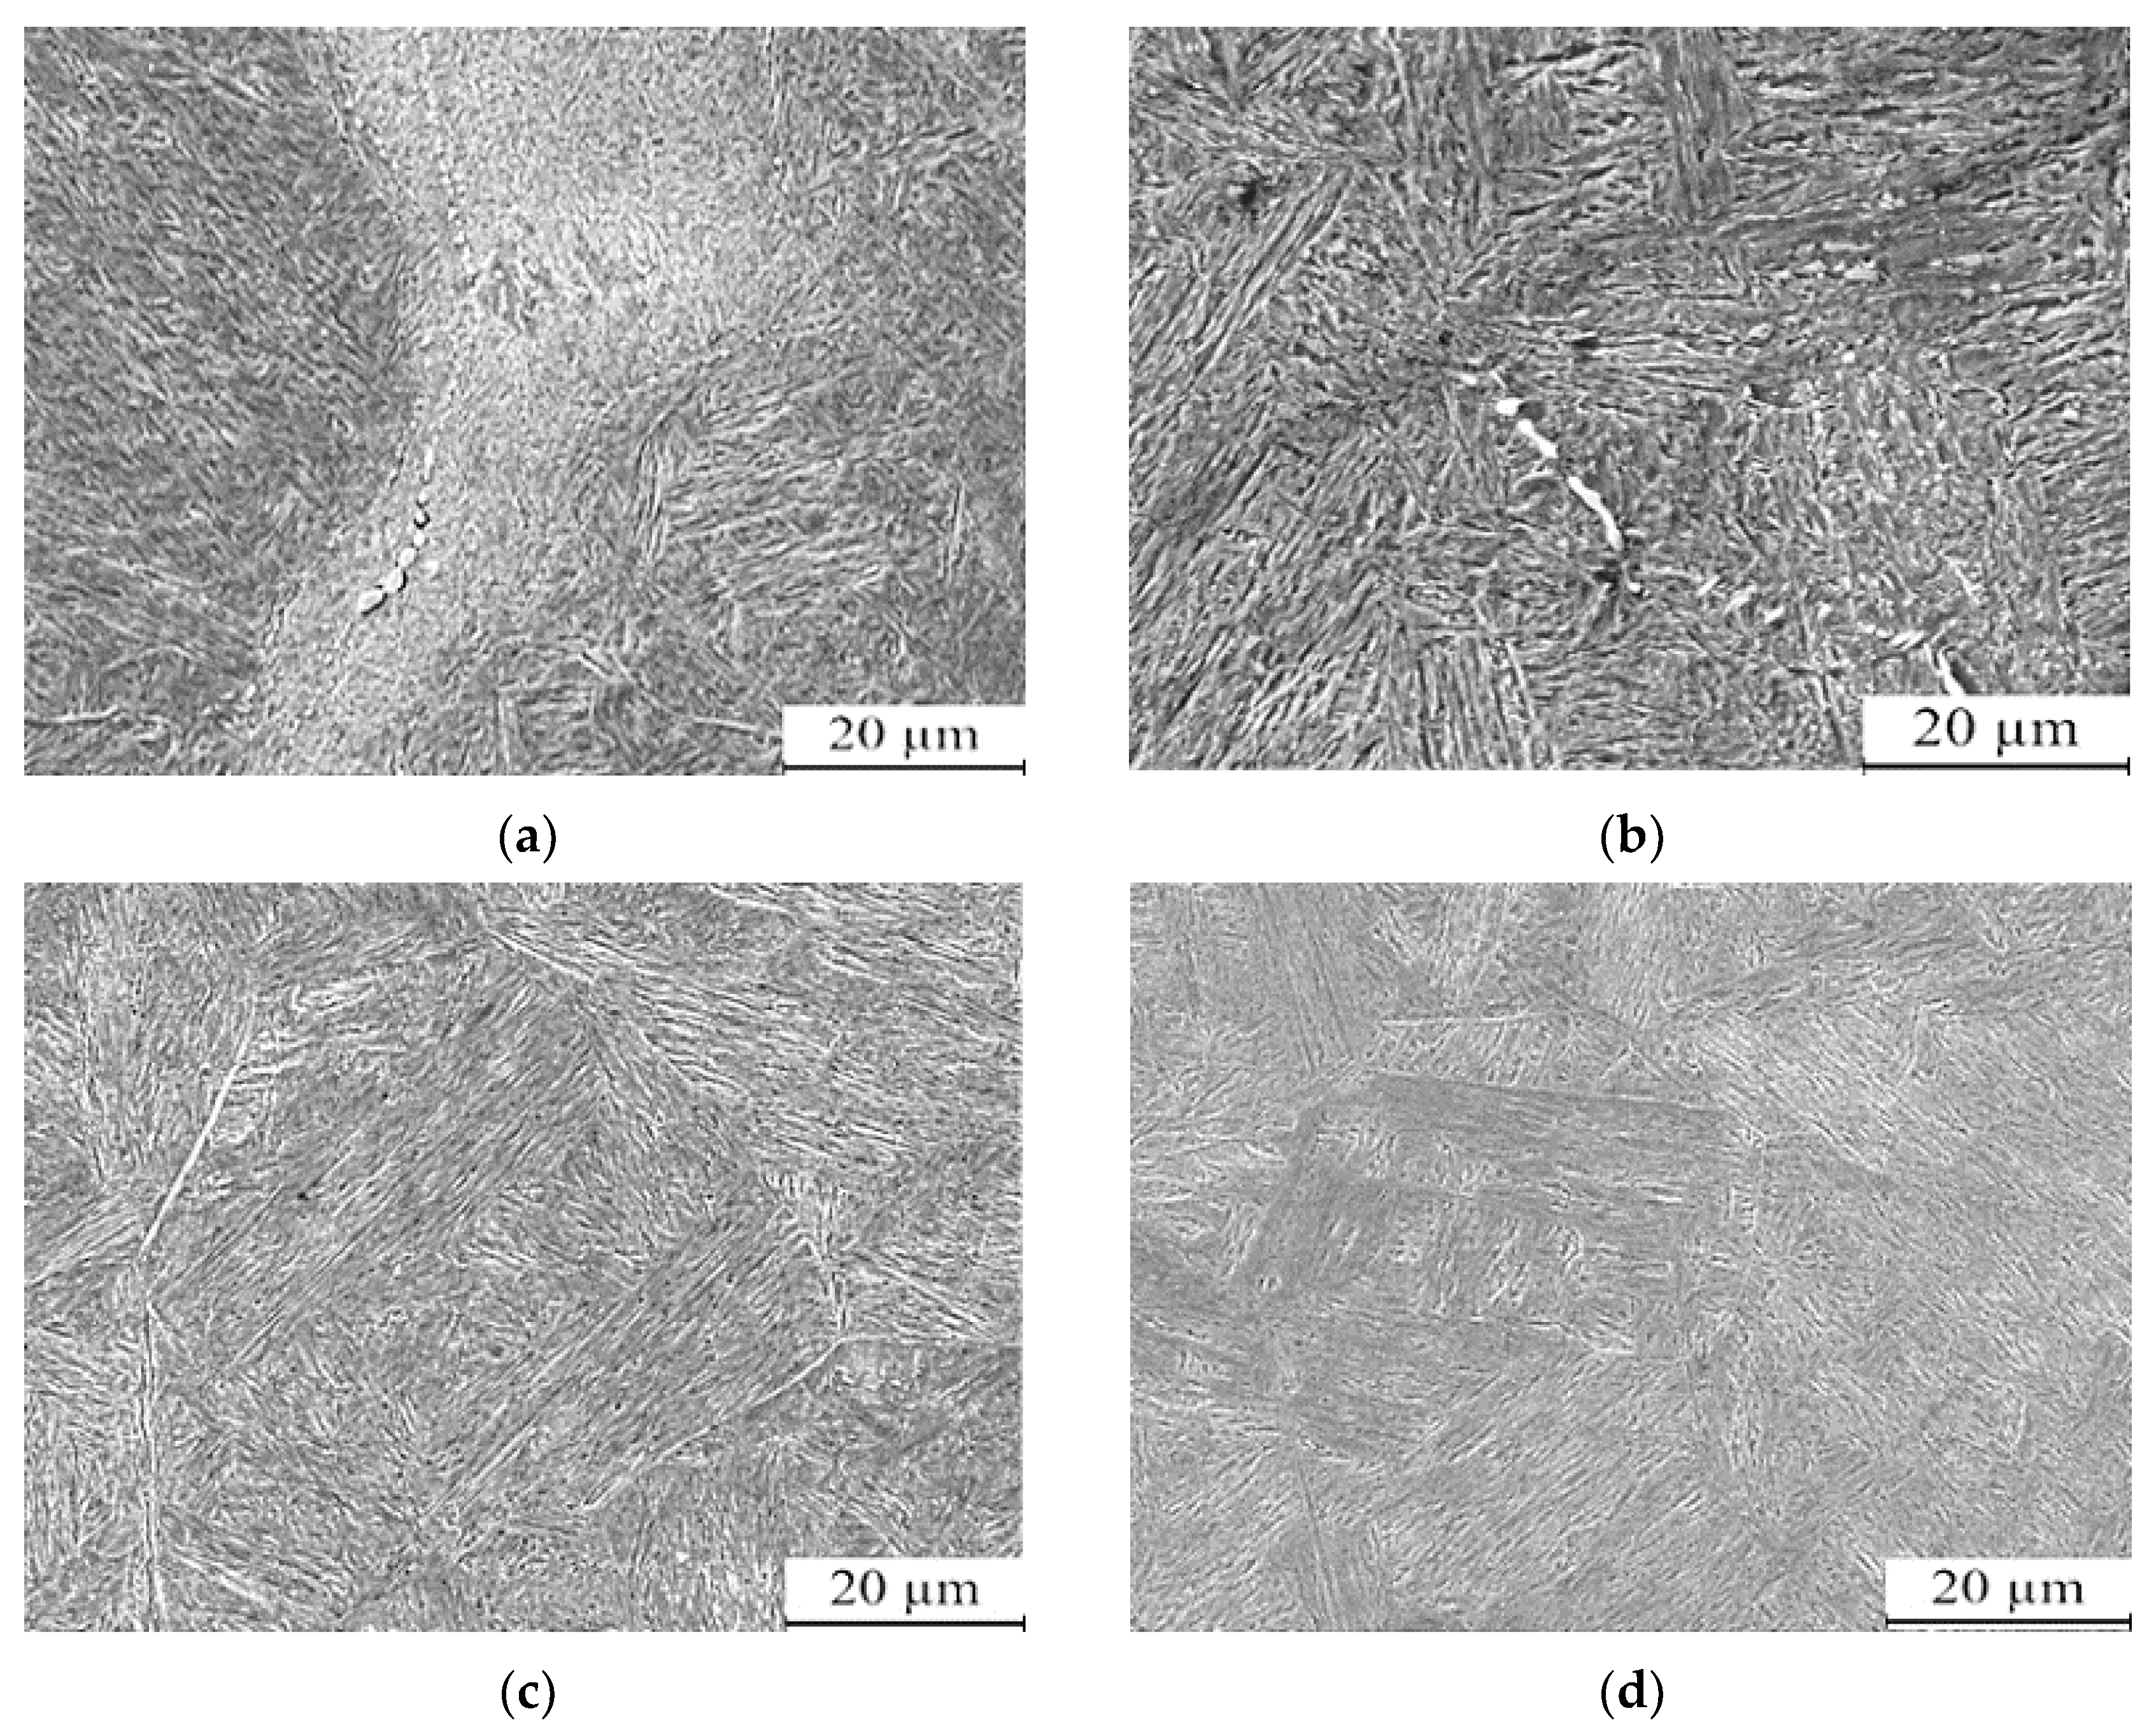
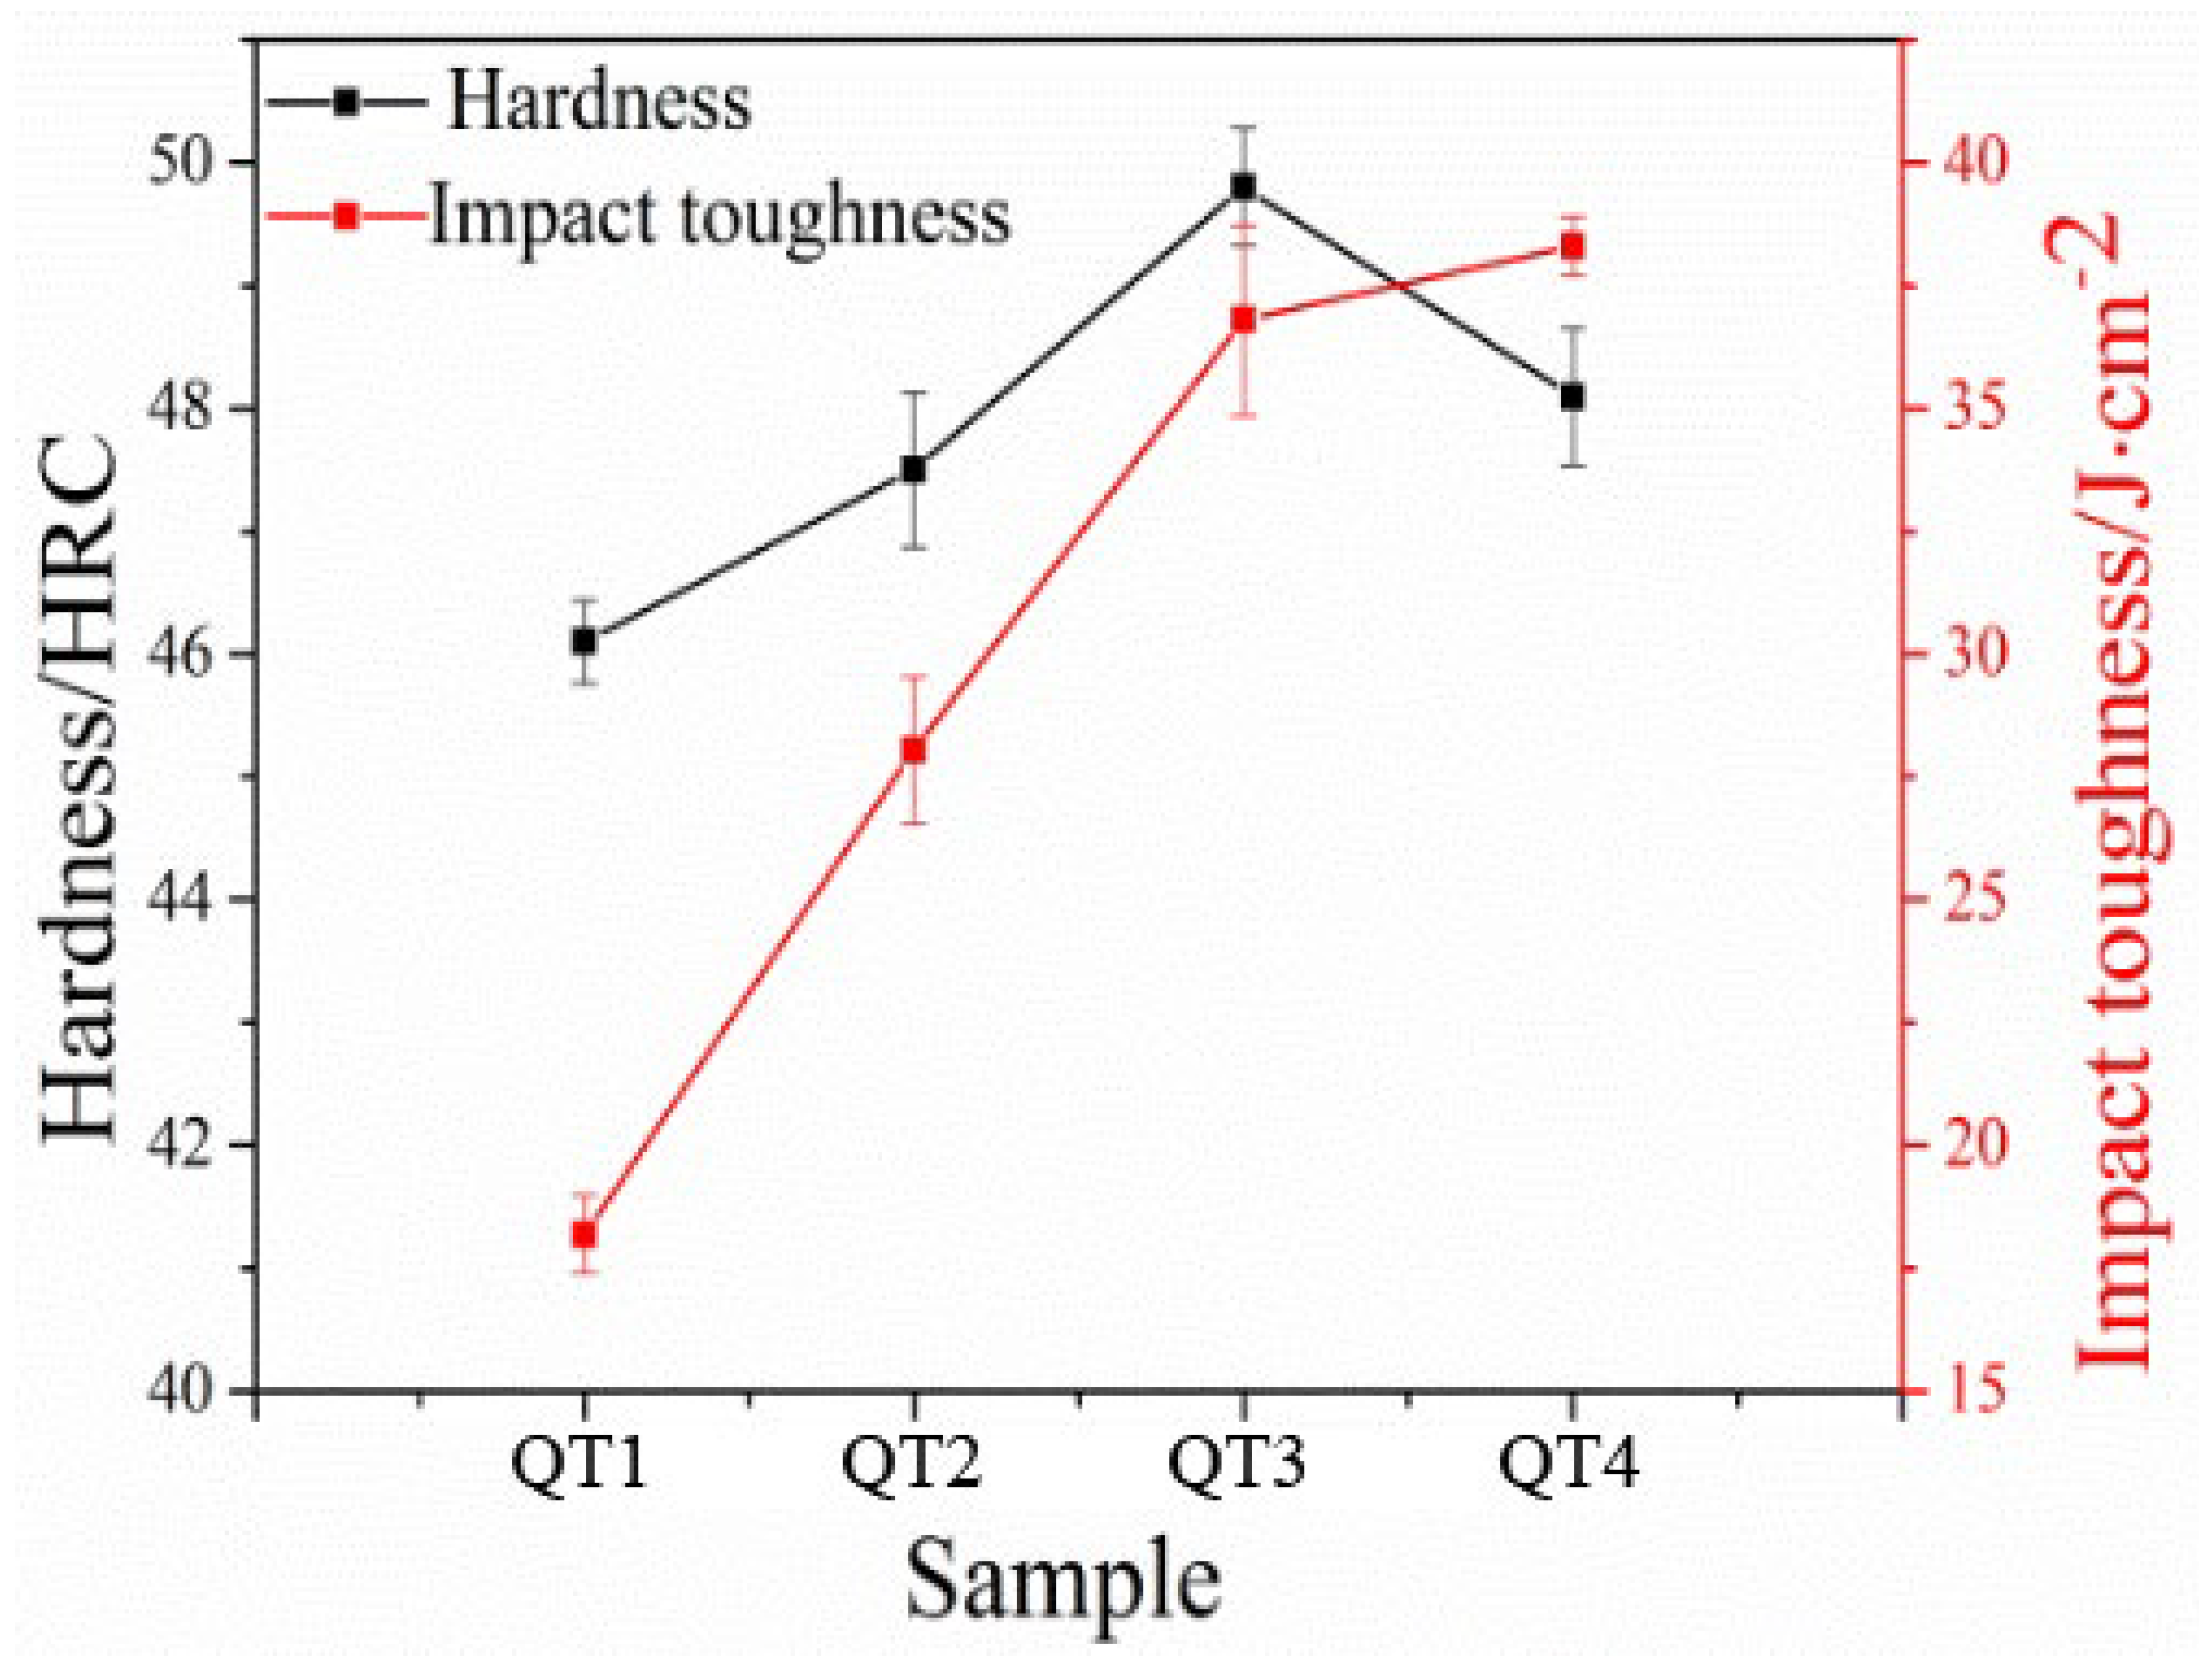
3.4.1. Quenching Temperature
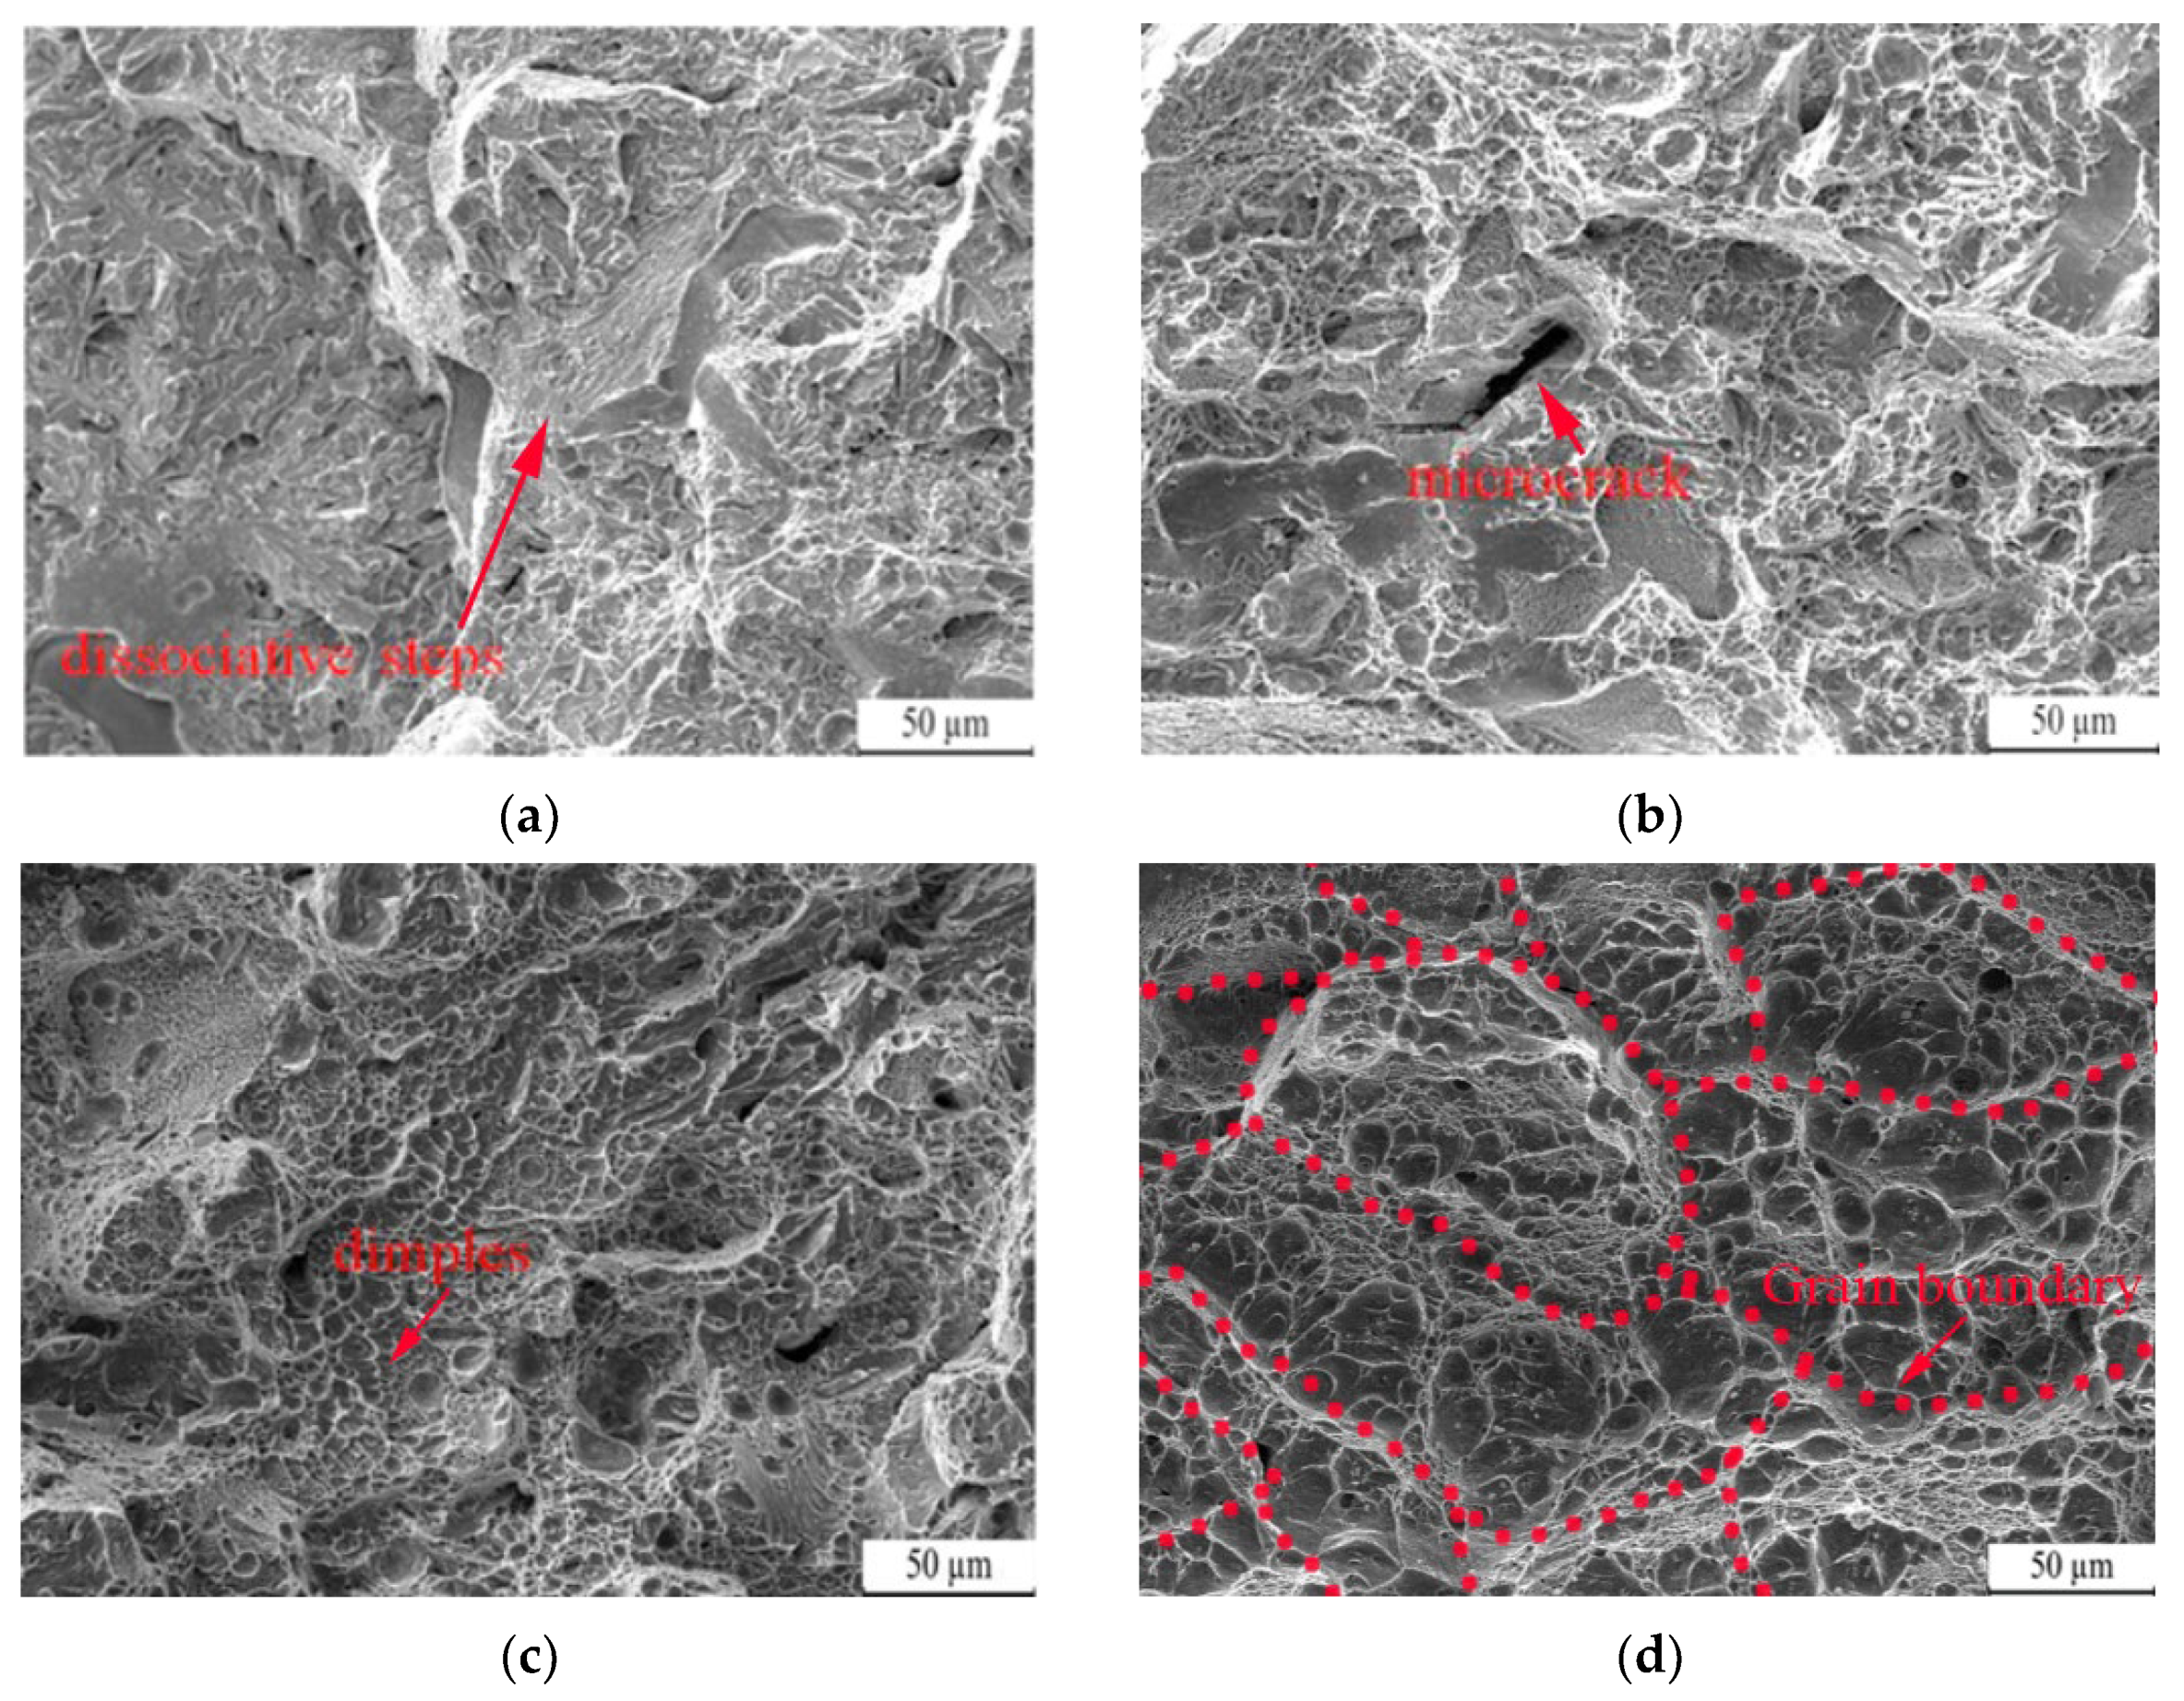
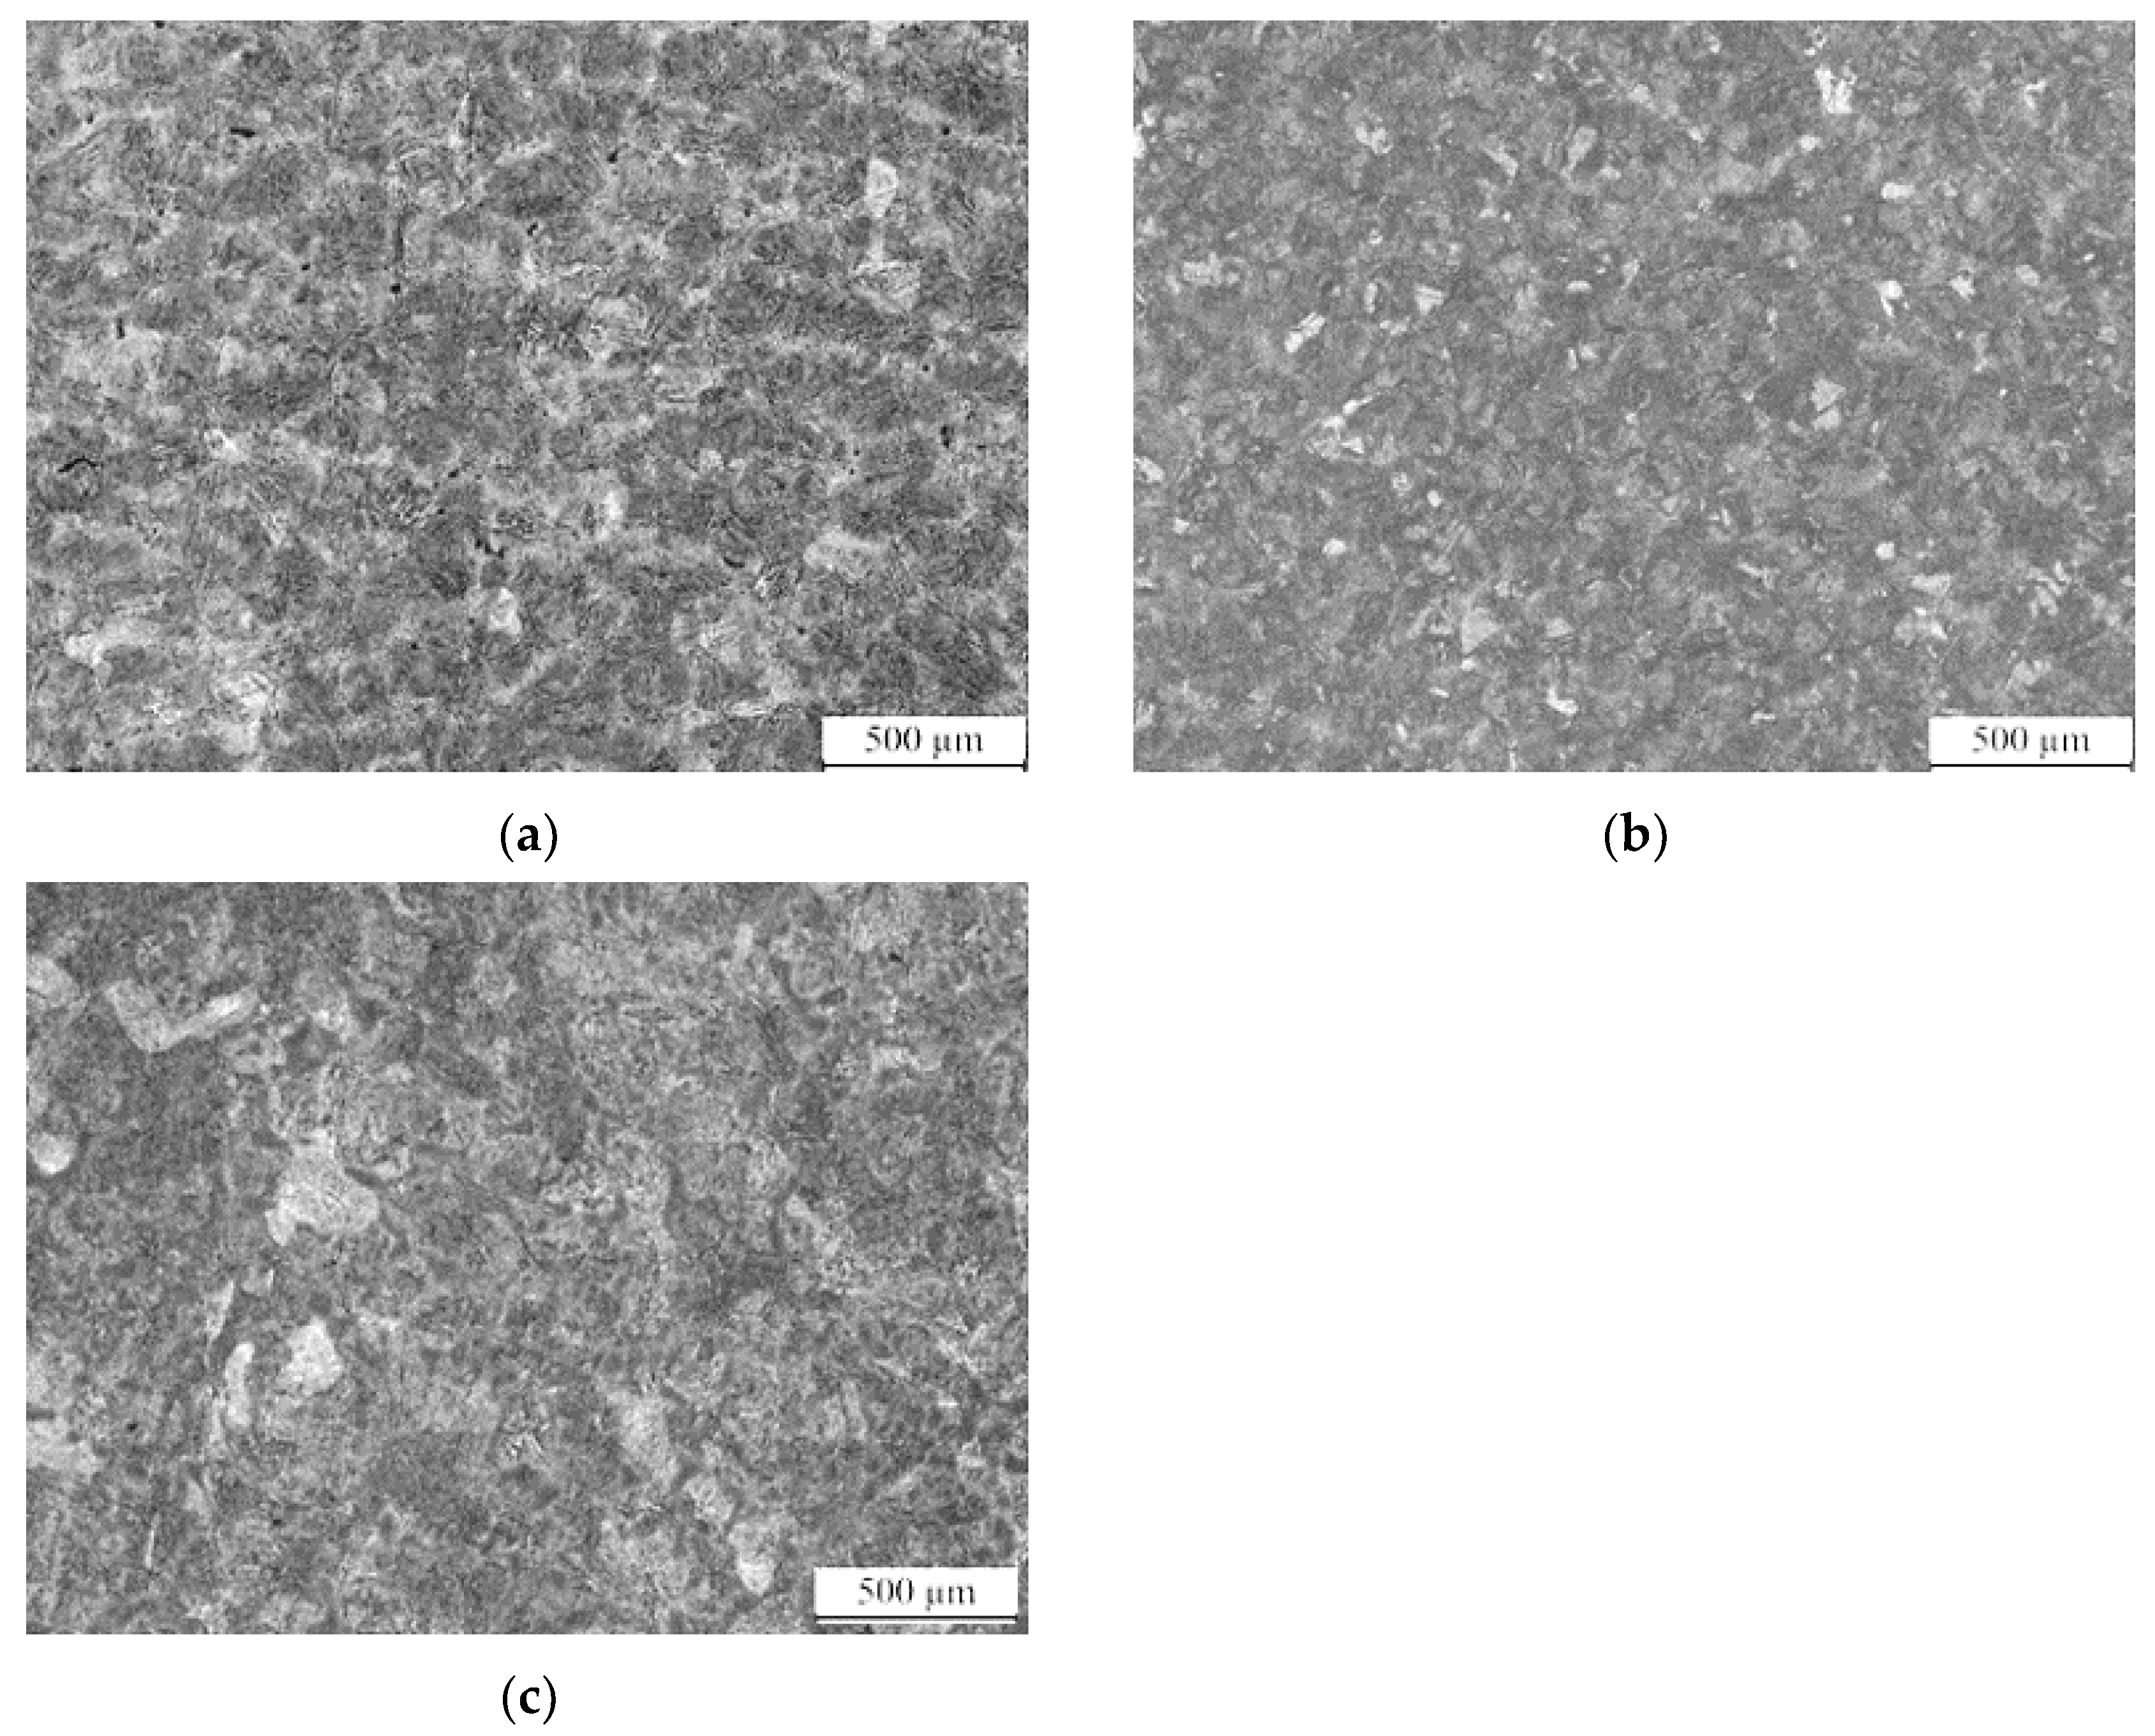
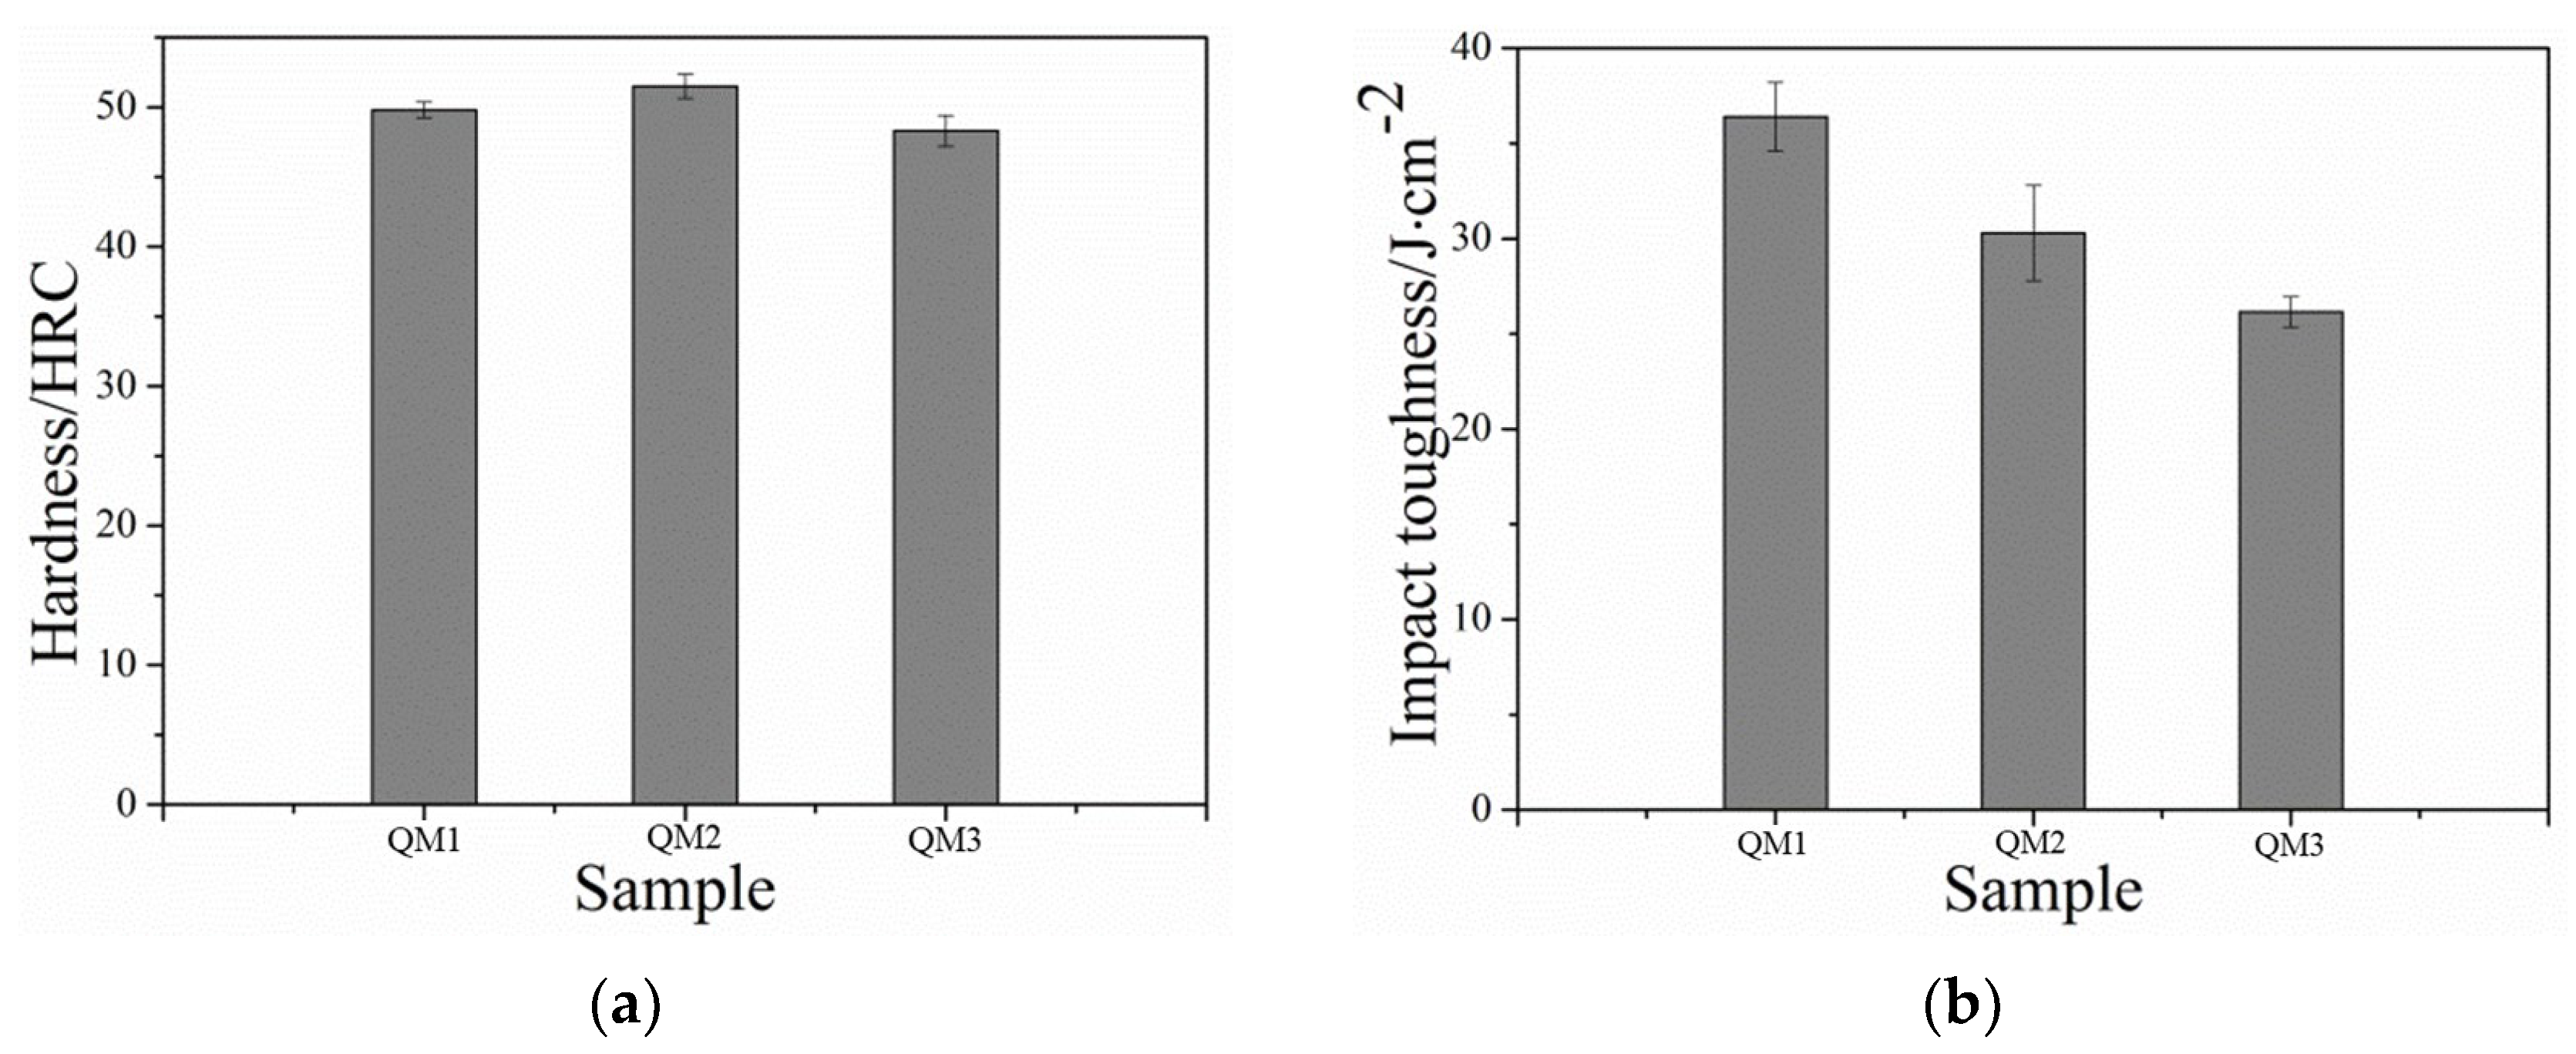
3.4.2. Quenching Media
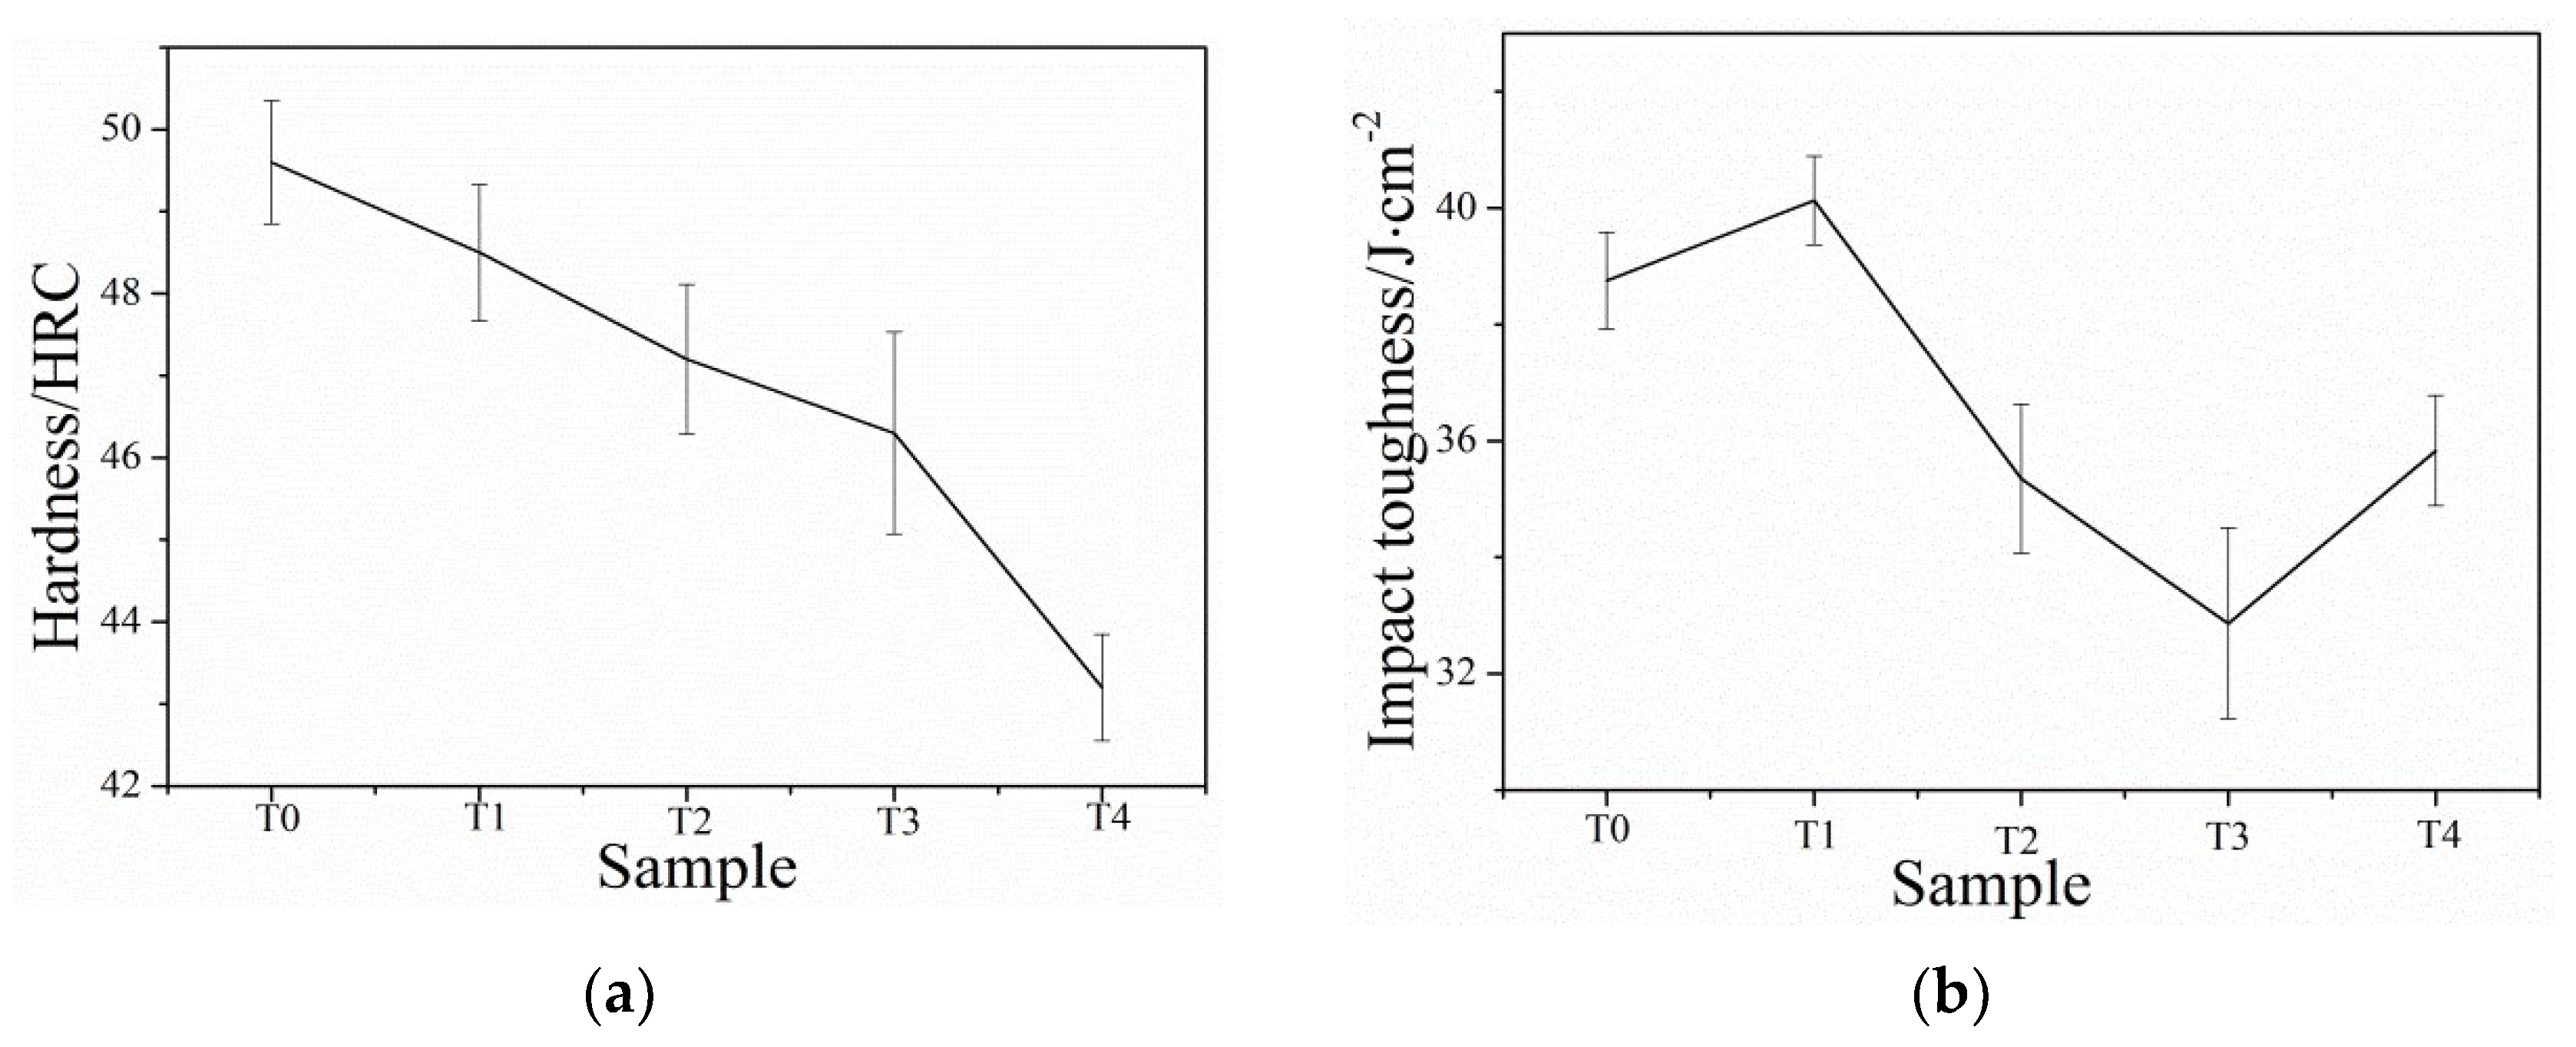
3.5. Tempering Process
3.6. Wear Test Results
4. Conclusions
- (1)
- The microstructure of the low-carbon medium-chromium steel typically consists of martensite and residual austenite network when in its as-cast state. However, after annealing at 930 °C, the microstructure undergoes a transformation into martensite and pearlite. It should be noted that both the hardness and impact toughness of the steel decrease compared to the original as-cast sample.
- (2)
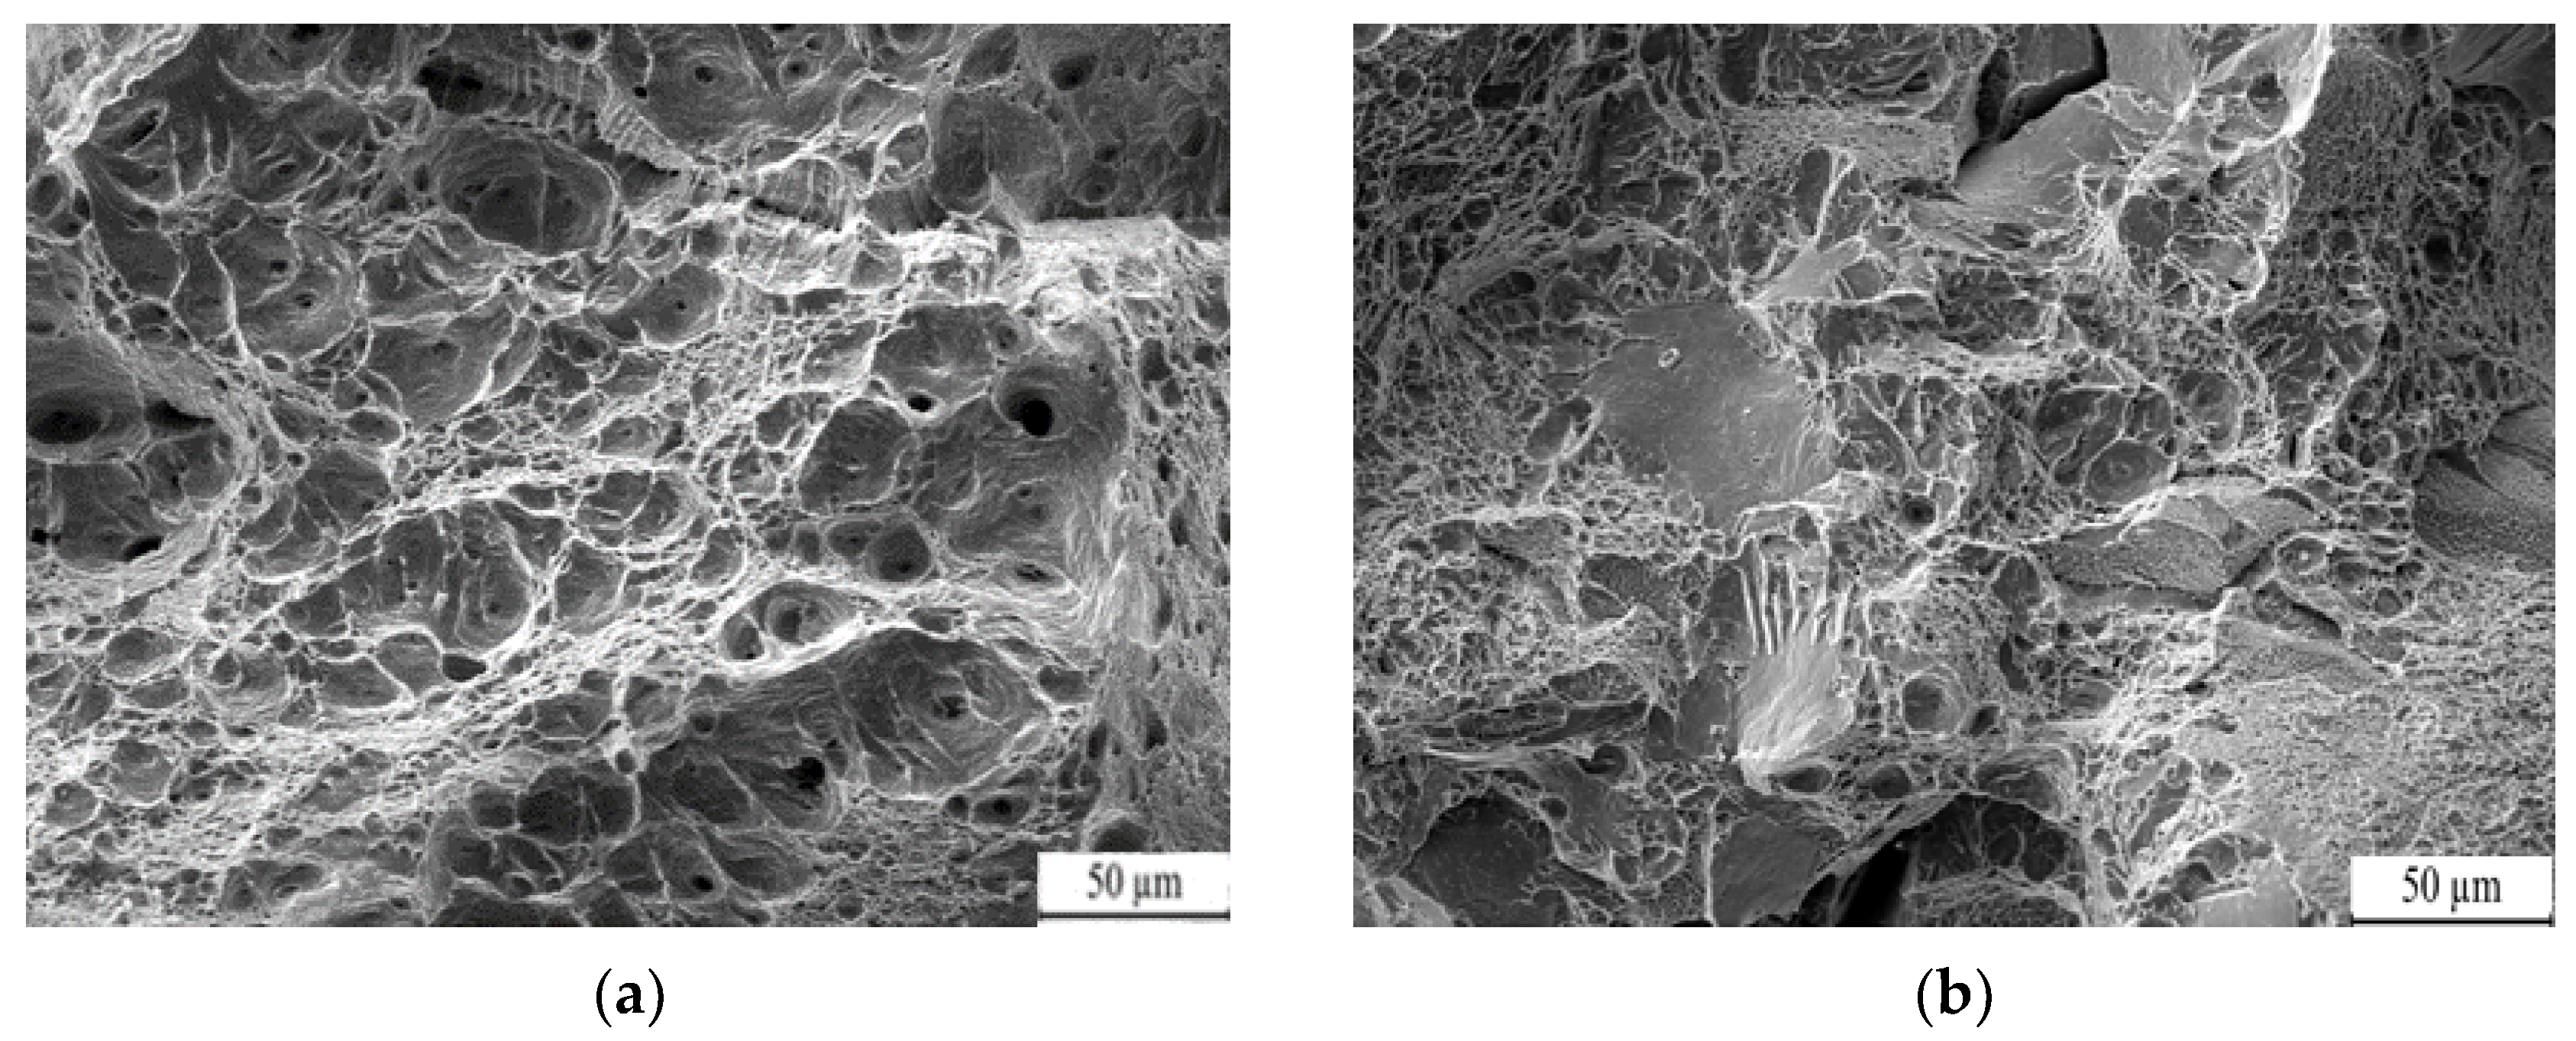
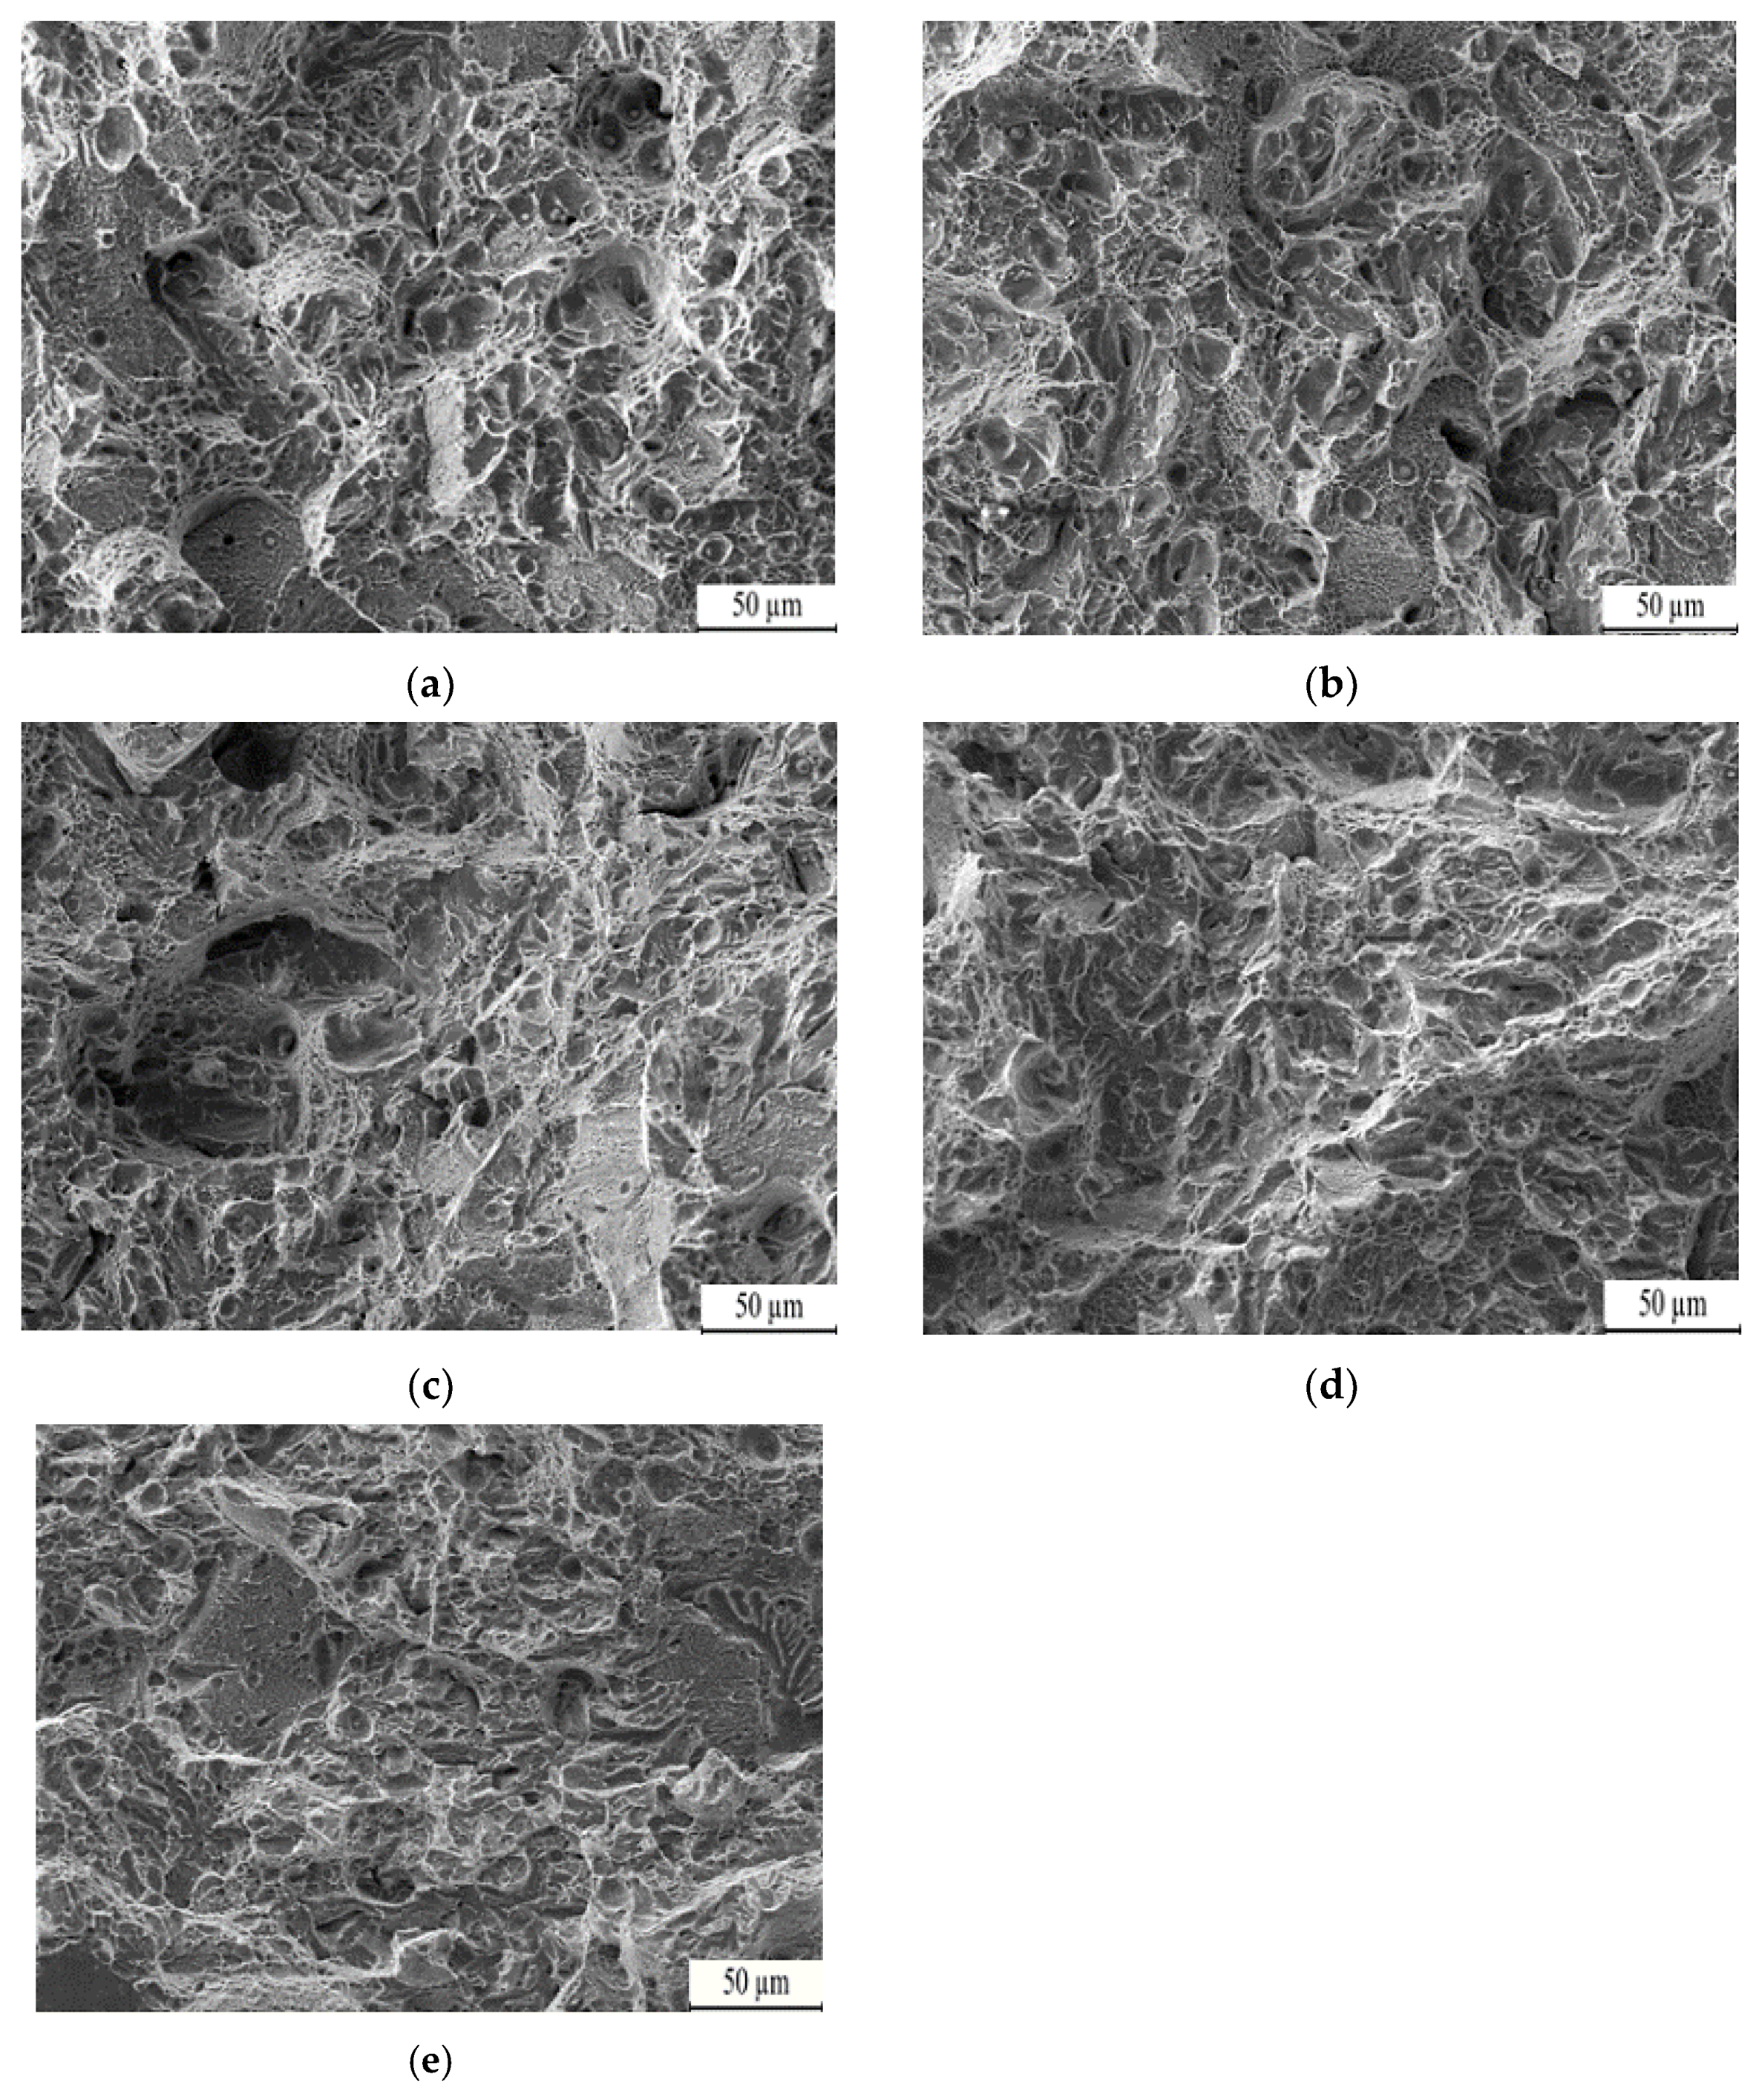
- The quenching temperature, ranging from 950 °C to 1100 °C, has a significant influence on the microstructure of the steel, namely martensite and nano residual austenite. Regardless of the quenching temperature, the hardness of the steel remains above 45 HRC, while the impact toughness continuously improves as the quenching temperature increases. The primary failure mode is dimple fracture, while quasi-dissociation fracture occurs as a secondary mode.
- (3)
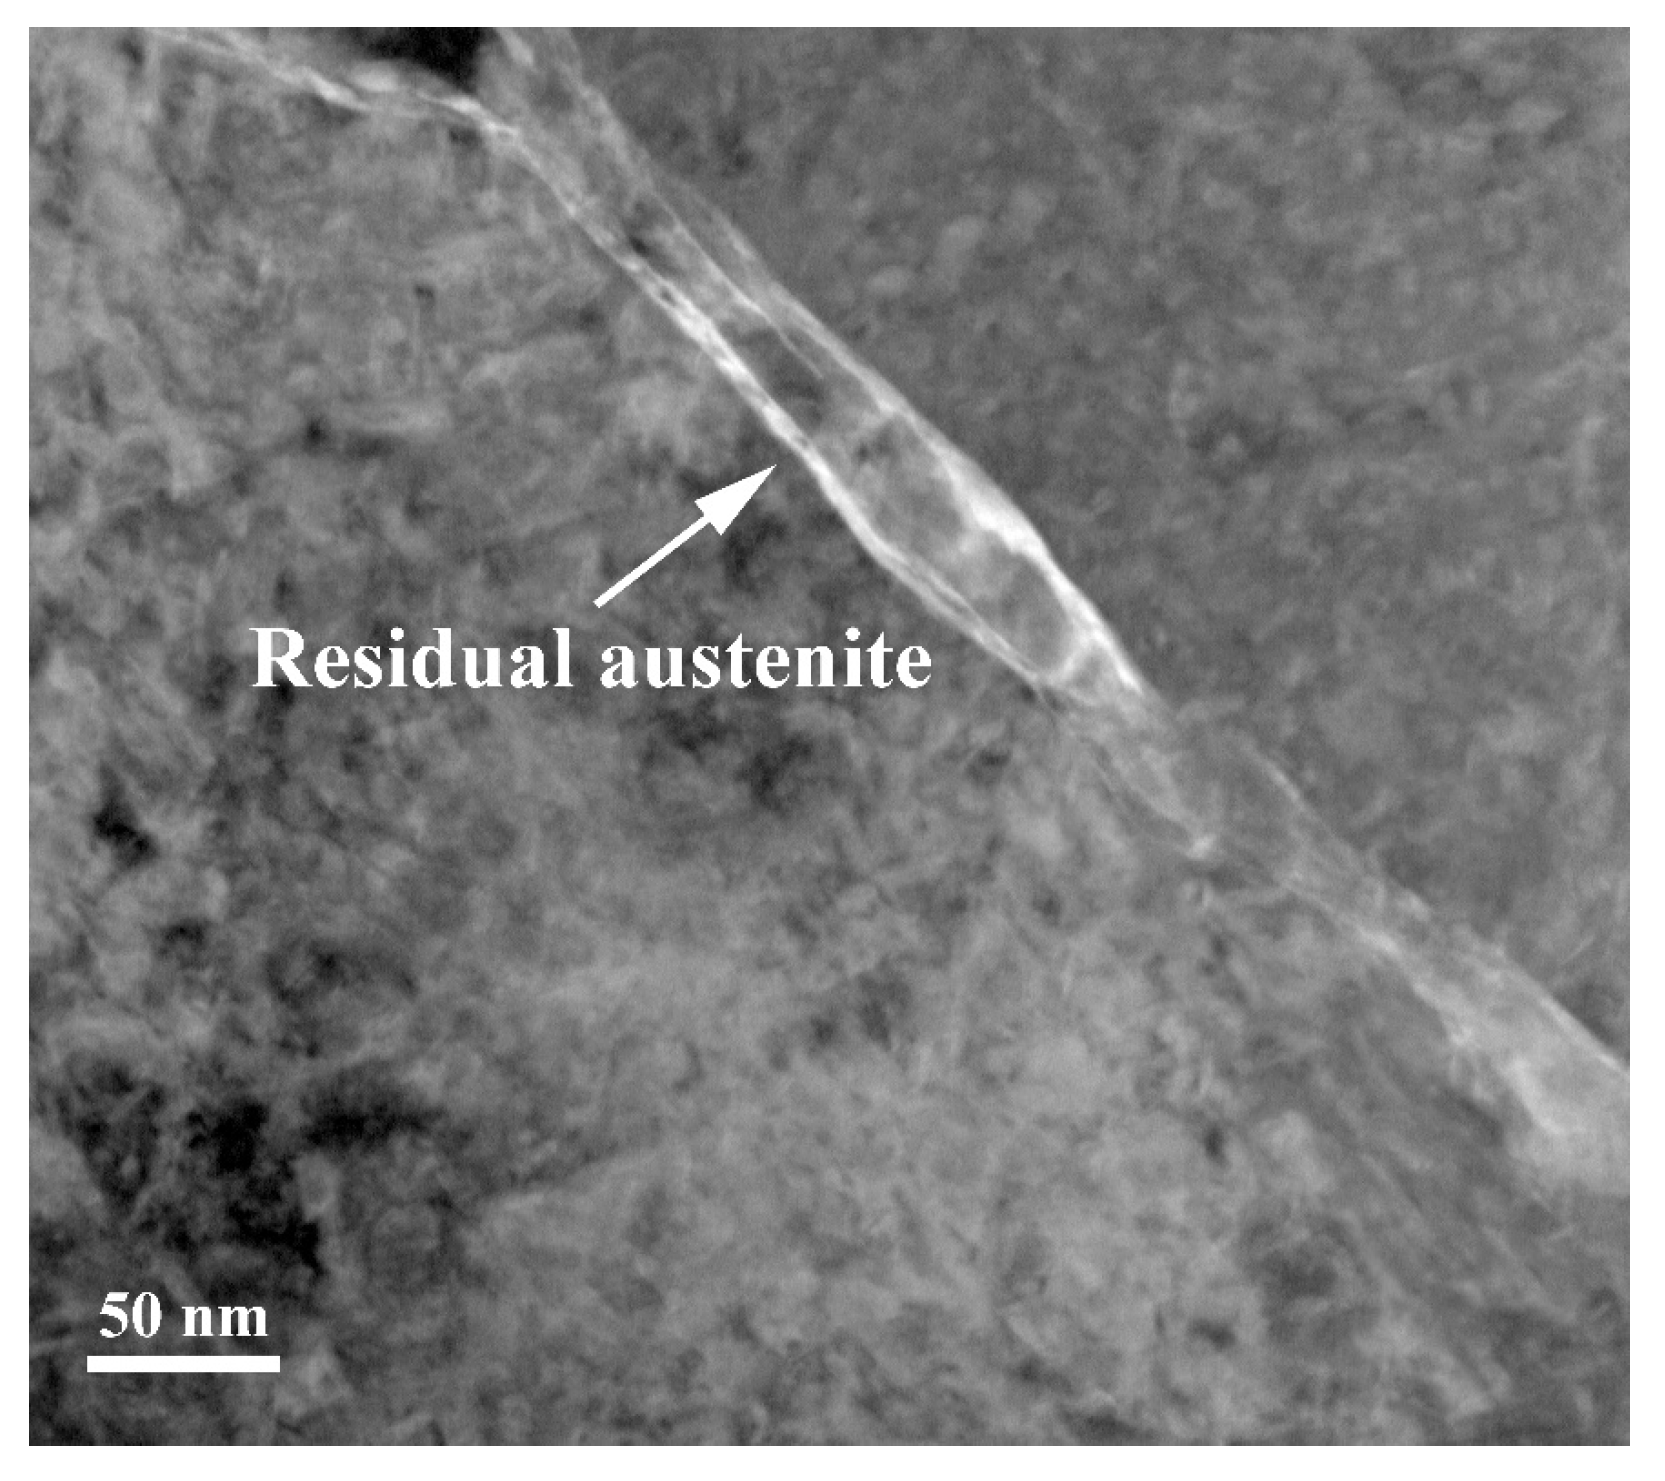
- At low tempering temperatures, an increase in tempering temperature leads to a decrease in the steel’s hardness. Initially, an increase in tempering temperature results in improved impact toughness, followed by a subsequent decrease in impact toughness. However, at a certain tempering temperature, the impact toughness begins to increase once again. The microstructure obtained after annealing at 930 °C, oil quenching at 1050 °C, and tempering at 250 °C primarily consists of martensite and fine nano residual austenite. This combination of microstructures contributes to well-balanced properties in the steel, with a hardness of 51 HRC and impact toughness of 40 J/cm2, representing a nearly fourfold improvement compared to the original as-cast sample.
- (4)
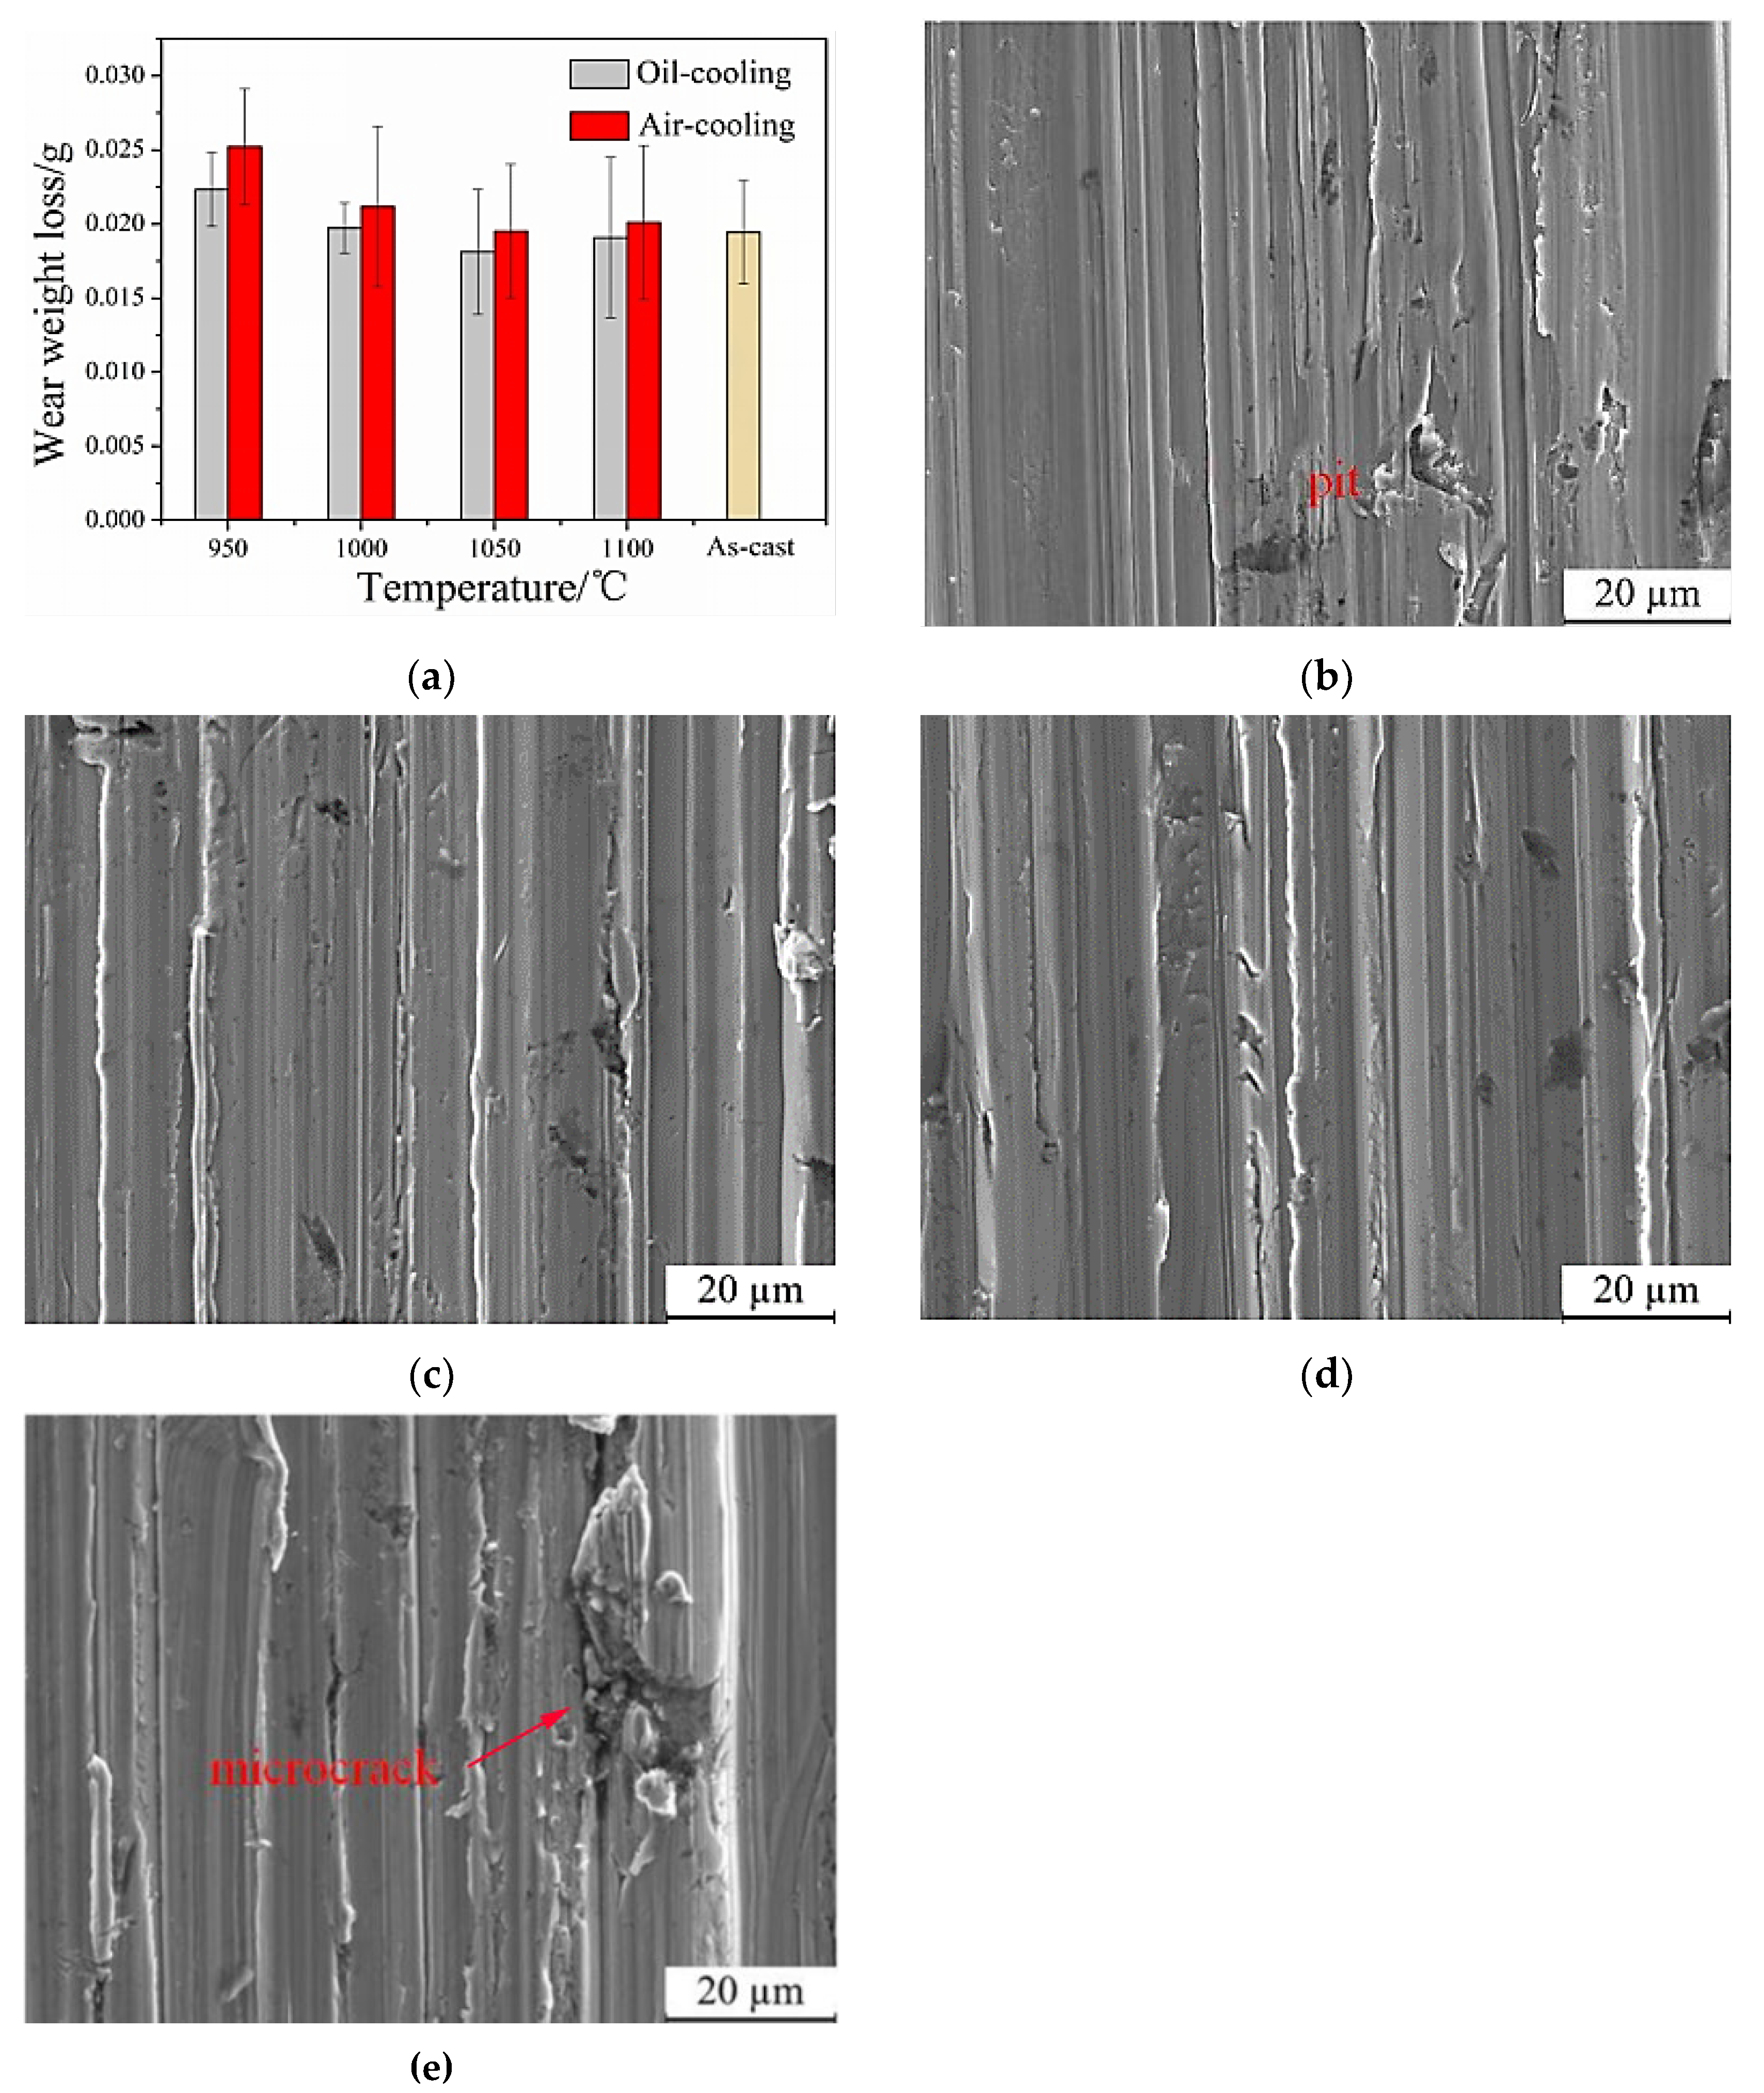
- The wear weight loss of the steel exhibits a non-linear trend with increasing quenching temperature. Initially, the wear weight loss decreases as the temperature increases, but eventually starts to increase. The minimum wear weight loss is observed at a quenching temperature of 1050 °C. Additionally, at the same temperature, the wear weight loss of the oil-quenched sample is lower than that of the air-cooled sample. The steel with the highest wear resistance is obtained through the process of annealing at 930 °C, oil quenching at 1050 °C, and tempering at 250 °C.
Author Contributions
Funding
Data Availability Statement
Acknowledgments
Conflicts of Interest
References
- Feng, X.; Zhang, Y.; Liu, C.; Jiang, G. Countermeasure research and force analysis of lining board for 1580 SP rolling mill. J. Iron Steel Res. 2006, 18, 24–27. [Google Scholar]
- Wang, D. Study and application of ball mill liner of ZGCr13SiMo steel. Heat Treat. Met. 2008, 33, 81–83. [Google Scholar]
- Mujica, L.; Weber, S.; Thomy, C.; Vollertsen, F. Microstructure and mechanical properties of laser welded austenitic high manganese steels. Sci. Technol. Weld. Join. 2009, 14, 517–522. [Google Scholar] [CrossRef]
- Li, C.; Sun, H.; Zhang, X.; Zuo, J. Properties of Wear-resisting lining board in mining conditions in China and abroad. Hot Work. Technol. 2013, 42, 93–95. [Google Scholar]
- Petrico, V.; Chen, Z.; Dieter, S.; Alexander, L. Effect of different casting parameters on the cleanliness of high manganese steel ingots compared to high carbon steel. Metall. Mater. Trans. 2013, 44, 96–102. [Google Scholar]
- Erdakov, I.; Kachev, V.; Novokreshchenov, V. Increase of wear resistance of steel plates for crushing stations. J. Frict. Wear 2014, 35, 514–519. [Google Scholar] [CrossRef]
- Çöl, M.; Koç, F.G.; Öktem, H.; Kır, D. The role of boron content in high alloy white cast iron (Ni-Hard 4) on microstructure, mechanical properties and wear resistance. Wear 2016, 278, 348–349. [Google Scholar] [CrossRef]
- Pavlina, E.J.; Lee, S.; Virtanen, E.T.; Rothleutner, L.M.; Van Tyne, C.J. Effects of Copper on the Hardenability of a Medium-Carbon Steel. Metall. Mater. Trans. A Phys. Metall. Mater. Sci. 2011, 42, 3572–3576. [Google Scholar] [CrossRef]
- Guo, W.; Hu, X.; Ma, X.; Li, D. Effect of TiN precipitates on solidification microstructure of medium carbon Cr-Mo wear resistant steel. Acta Metall. Sin. 2016, 52, 769–777. [Google Scholar]
- Yang, Y.; Fang, H.; Zheng, Y.; Yang, Z.; Jiang, Z. The failure models induced by white layers during impact wear. Wear 1995, 185, 17–22. [Google Scholar] [CrossRef]
- Kang, Y.; Oh, J.; Lee, H.; Lee, S. Effects of carbon and chromium additions on the wear resistance and surface roughness of cast high-speed steel rolls. Metall. Mater. Trans. A 2001, 32, 2515–2525. [Google Scholar] [CrossRef]
- Wang, C.; Wang, M.; Shi, J.; Hui, W.; Dong, H. Effect of microstructure refinement on the strength and toughness of low alloy martensitic steel. J. Mater. Sci. Technol. 2007, 23, 659–664. [Google Scholar]
- Tressia, G.; Penagos, J.J.; Sinatora, A. Effect of abrasive particle size on slurry abrasion resistance of austenitic and martensitic steels. Wear 2017, 376, 63–69. [Google Scholar] [CrossRef]
- Chen, W.; Biswas, S.; Roberts, A.; O’Shea, J.; Williams, K. Abrasion wear resistance of wall lining materials in bins and chutes during iron ore mining. Int. J. Miner. Process. 2017, 167, 42–48. [Google Scholar] [CrossRef]
- Eckstein, C.; Spies, H.; Albrecht, J. Improvement of the corrosion resistance of high alloyed austenitic Cr-Ni-Mo stainless steels by solution nitriding. Trans. Mater. Heat Treat. 2004, 25, 316–321. [Google Scholar]
- Wieczerzak, K.; Bała, P. Hypoeutectic Fe-Cr-Ni-Mo-C alloys additionally strengthened by the Frank-Kasper phases-Design by means of the CALPHAD approach. Calphad-Comput. Coupling Phase Diagr. Thermochem. 2019, 64, 248–257. [Google Scholar] [CrossRef]
- Krauss, G. Physical Metallurgy of Steels: An Overview; Elsevier Inc.: Golden, CO, USA, 2017. [Google Scholar]
- Gomez, M.; Rancel, L.; Escudero, E.; Medina, S.F. Phase transformation under continuous cooling conditions in medium carbon micro-alloyed steels. J. Mater. Sci. Technol. 2014, 30, 511–516. [Google Scholar] [CrossRef]
- Ghassemi, M.H.; Abouei, V.; Moshtaghi, M.; Noghani, M.T. The effect of removing worn particles by ultrasonic cleaning on the wear characterization of LM13 alloy. Surf. Eng. Appl. Electrochem. 2015, 51, 382–388. [Google Scholar] [CrossRef]
- Zhao, Z.; Liu, C.; Liu, Y.; Northwood, D.O. A new empirical formula for the bainite upper temperature limit of steel. J. Mater. Sci. 2001, 36, 5045–5056. [Google Scholar] [CrossRef]
- Davis, J.R. Metals Handbook Desk Edition, 2nd ed.; ASM International: Almailer, The Netherlands, 1998. [Google Scholar]
- Honarpisheh, M.; Asemabadi, M.; Sedighi, M. Investigation of annealing treatment on the interfacial properties of explosive-welded Al/Cu/Al multilayer. Mater. Des. 2012, 37, 122–127. [Google Scholar] [CrossRef]
- Kroupa, A.; Kirkaldy, J.S. Computed multicomponent phase diagrams for hardenability (H) and HSLA steels with application to the prediction of microstructure and mechanical properties. J. Phase Equilibria 1993, 14, 150–161. [Google Scholar] [CrossRef]
- Hui, Q.; Xue, X.; Kou, H.; Lai, M.; Tang, B.; Li, J. Kinetics of the ω phase transformation of Ti-7333 titanium alloy during continuous heating. J. Mater. Sci. 2013, 48, 1966–1972. [Google Scholar] [CrossRef]
- Galindo-Nava, E.; Rainforth, W.; Rivera-Díaz-Del-Castillo, P. Predicting microstructure and strength of maraging steels: Elemental optimisation. Acta Mater. 2016, 117, 270–285. [Google Scholar] [CrossRef]
- Moshtaghi, M.; Safyari, M. Effect of Work-Hardening Mechanisms in Asymmetrically Cyclic-Loaded Austenitic Stainless Steels on Low-Cycle and High-Cycle Fatigue Behavior. Steel Res. Int. 2021, 92, 2000242. [Google Scholar] [CrossRef]


| Elements | C | Cr | Si | Mn | Ni | Mo | Fe |
|---|---|---|---|---|---|---|---|
| Designed | 0.20–0.22 | 10.00–12.00 | 0.50–0.65 | 0.60–0.80 | 0.80~1.00 | 0.35~0.40 | Bal. |
| Measured | 0.21 | 11.00 | 0.55 | 0.70 | 0.90 | 0.36 | Bal. |
| Sample | Annealing Temperature/°C | Quenching Temperature/°C | Quenching Media | Tempering Temperature/°C |
|---|---|---|---|---|
| QT1 | 930 | 950 | Oil | 250 |
| QT2 | 930 | 1000 | Oil | 250 |
| QT3 | 930 | 1050 | Oil | 250 |
| QT4 | 930 | 1100 | Oil | 250 |
| QM1 | 930 | 1050 | Water | 250 |
| QM2 | 930 | 1050 | Oil | 250 |
| QM3 | 930 | 1050 | Air | 250 |
| T0 | 930 | 1050 | Oil | 200 |
| T1 | 930 | 1050 | Oil | 250 |
| T2 | 930 | 1050 | Oil | 300 |
| T3 | 930 | 1050 | Oil | 350 |
| T4 | 930 | 1050 | Oil | 400 |
| Project | Parameters |
|---|---|
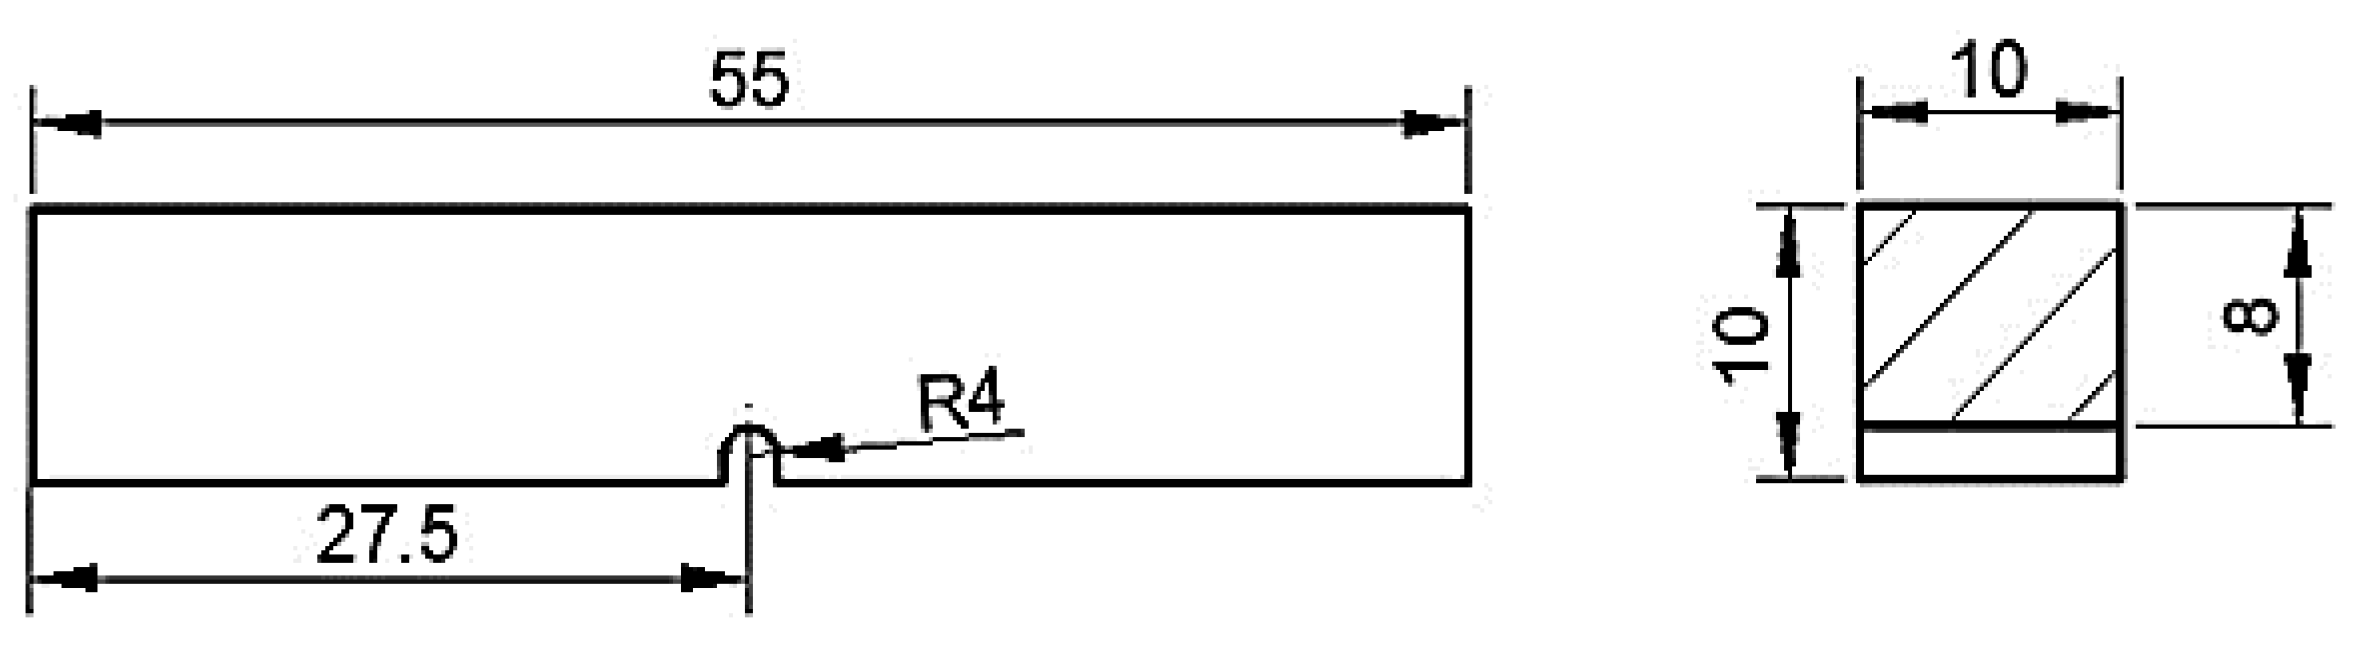
| Sample size/mm | Φ6 × 20 |
| Test load/N | 50 |
| Test distance/m | 6 |
| Test speed/mm·r−1 | 4 |
| Disk speed/r·min−1 | 6 |
| Sample | Hardness/HRC | Impact Toughness/J·cm−2 |
|---|---|---|
| As-cast state | 50 | 8.1 |
| Annealing at 930 °C | 41 | 6.4 |
Disclaimer/Publisher’s Note: The statements, opinions and data contained in all publications are solely those of the individual author(s) and contributor(s) and not of MDPI and/or the editor(s). MDPI and/or the editor(s) disclaim responsibility for any injury to people or property resulting from any ideas, methods, instructions or products referred to in the content. |
© 2023 by the authors. Licensee MDPI, Basel, Switzerland. This article is an open access article distributed under the terms and conditions of the Creative Commons Attribution (CC BY) license (https://creativecommons.org/licenses/by/4.0/).
Share and Cite
Wang, Y.; Wang, R.; Yu, W.; Gao, Y. Effect of Heat Treatment Parameters on the Modification of Nano Residual Austenite of Low-Carbon Medium-Chromium Steel. Nanomaterials 2023, 13, 2829. https://doi.org/10.3390/nano13212829
Wang Y, Wang R, Yu W, Gao Y. Effect of Heat Treatment Parameters on the Modification of Nano Residual Austenite of Low-Carbon Medium-Chromium Steel. Nanomaterials. 2023; 13(21):2829. https://doi.org/10.3390/nano13212829
Chicago/Turabian StyleWang, Yiran, Ruian Wang, Wenzhen Yu, and Yimin Gao. 2023. "Effect of Heat Treatment Parameters on the Modification of Nano Residual Austenite of Low-Carbon Medium-Chromium Steel" Nanomaterials 13, no. 21: 2829. https://doi.org/10.3390/nano13212829
APA StyleWang, Y., Wang, R., Yu, W., & Gao, Y. (2023). Effect of Heat Treatment Parameters on the Modification of Nano Residual Austenite of Low-Carbon Medium-Chromium Steel. Nanomaterials, 13(21), 2829. https://doi.org/10.3390/nano13212829