

Exploring Nitrogen-Functionalized Graphene Composites for Urinary Catheter Applications
 , , ,
, , ,  and
and
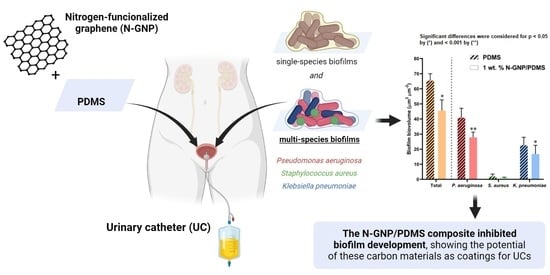
Abstract
:
1. Introduction
2. Materials and Methods
2.1. Synthesis of Nitrogen-Functionalized Graphene (N-GNP)
2.2. Characterization of Pristine and Nitrogen-Functionalized Graphene
2.2.1. Elemental Analysis
2.2.2. Textural Properties
2.2.3. Zeta Potential
2.3. Production and Characterization of N-GNP/Polydimethylsiloxane (PDMS) Composites
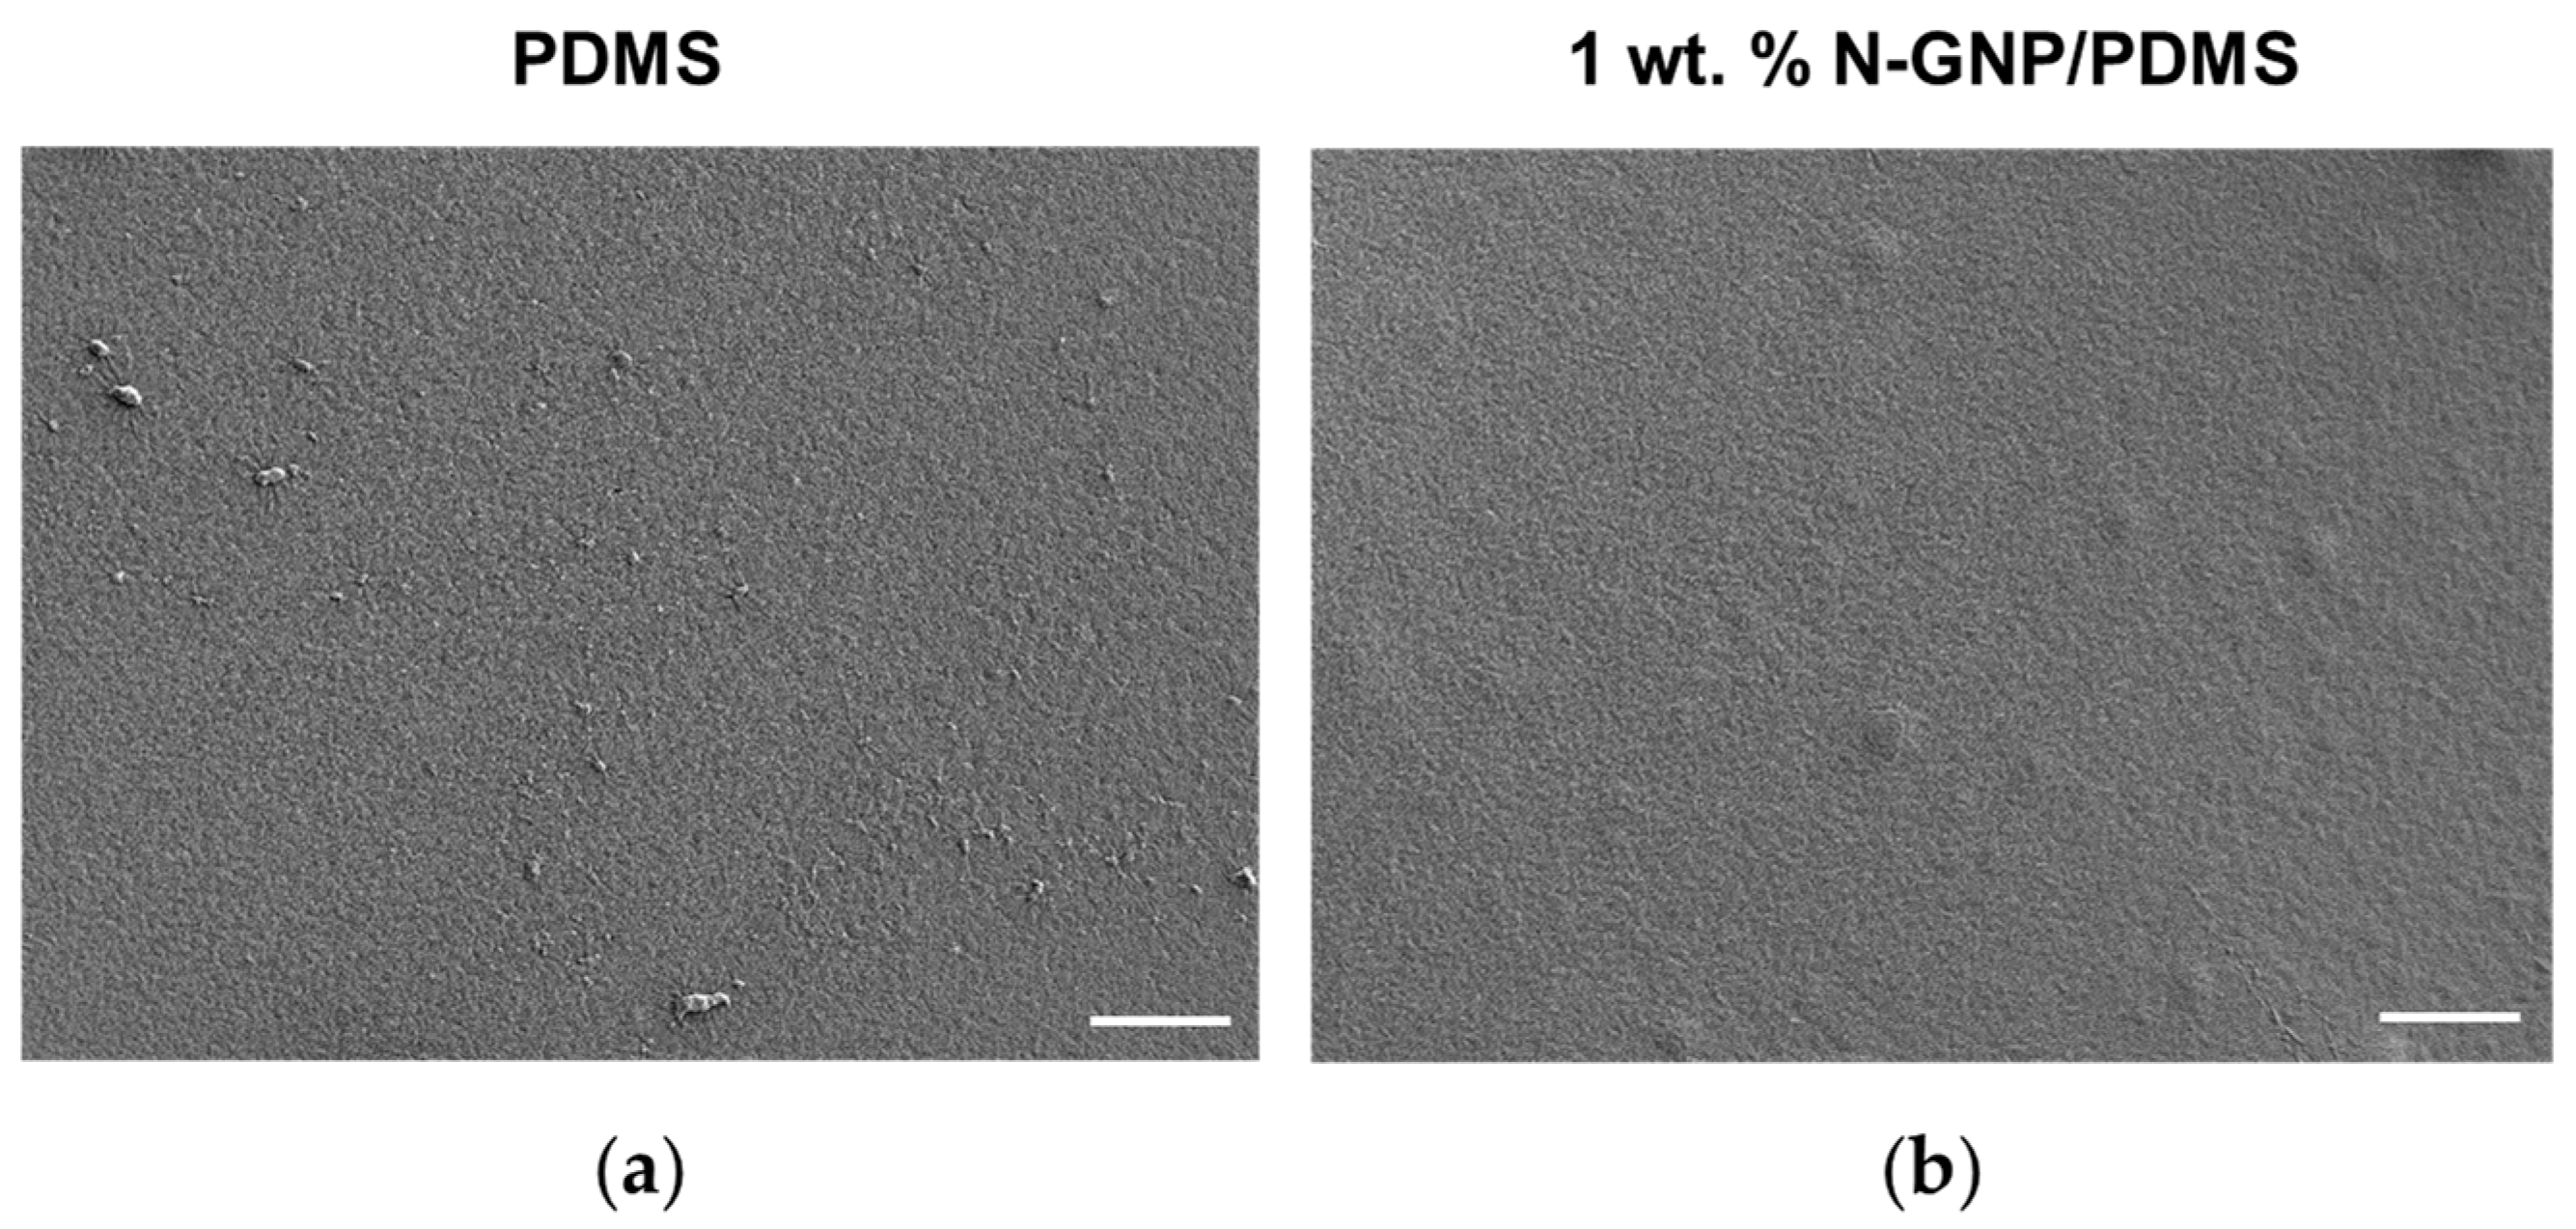
2.3.1. SEM
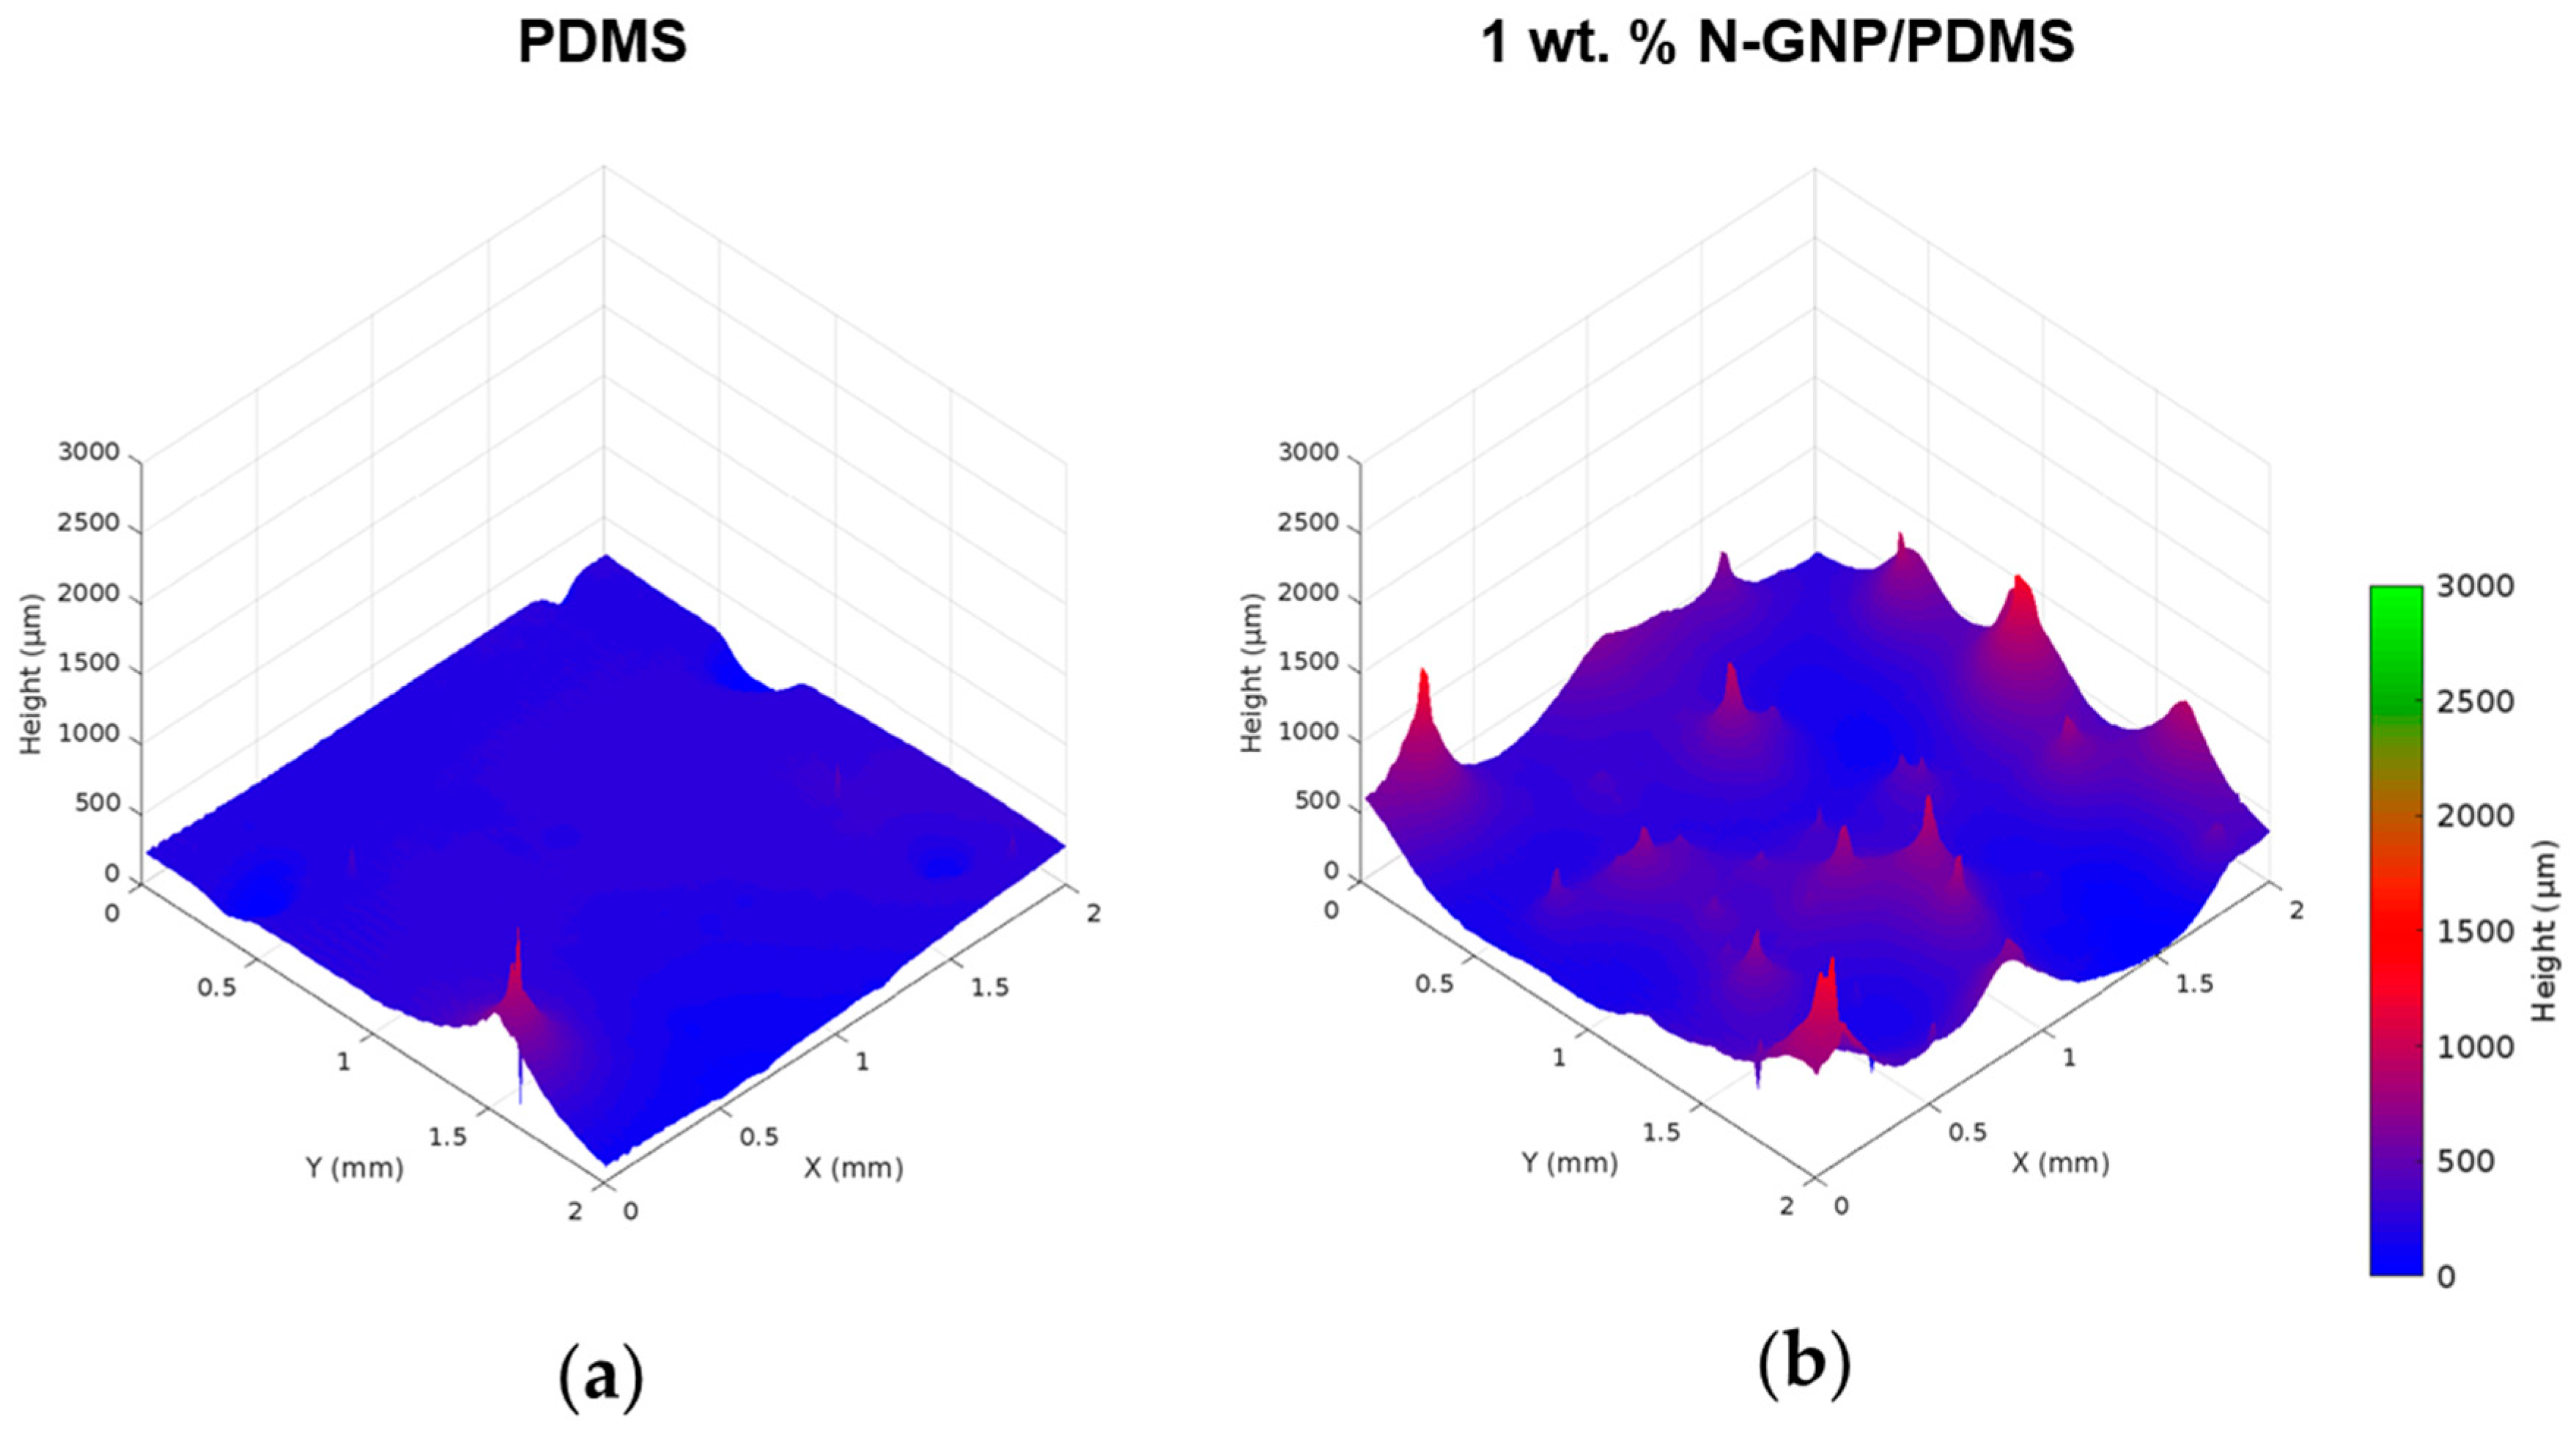
2.3.2. OP
2.3.3. Contact Angle Measurements
2.3.4. Leaching Assays
2.4. Biofilm Formation Assay
2.5. Biofilm Analysis
2.5.1. Total Cell Count
2.5.2. Culturable Cell Count
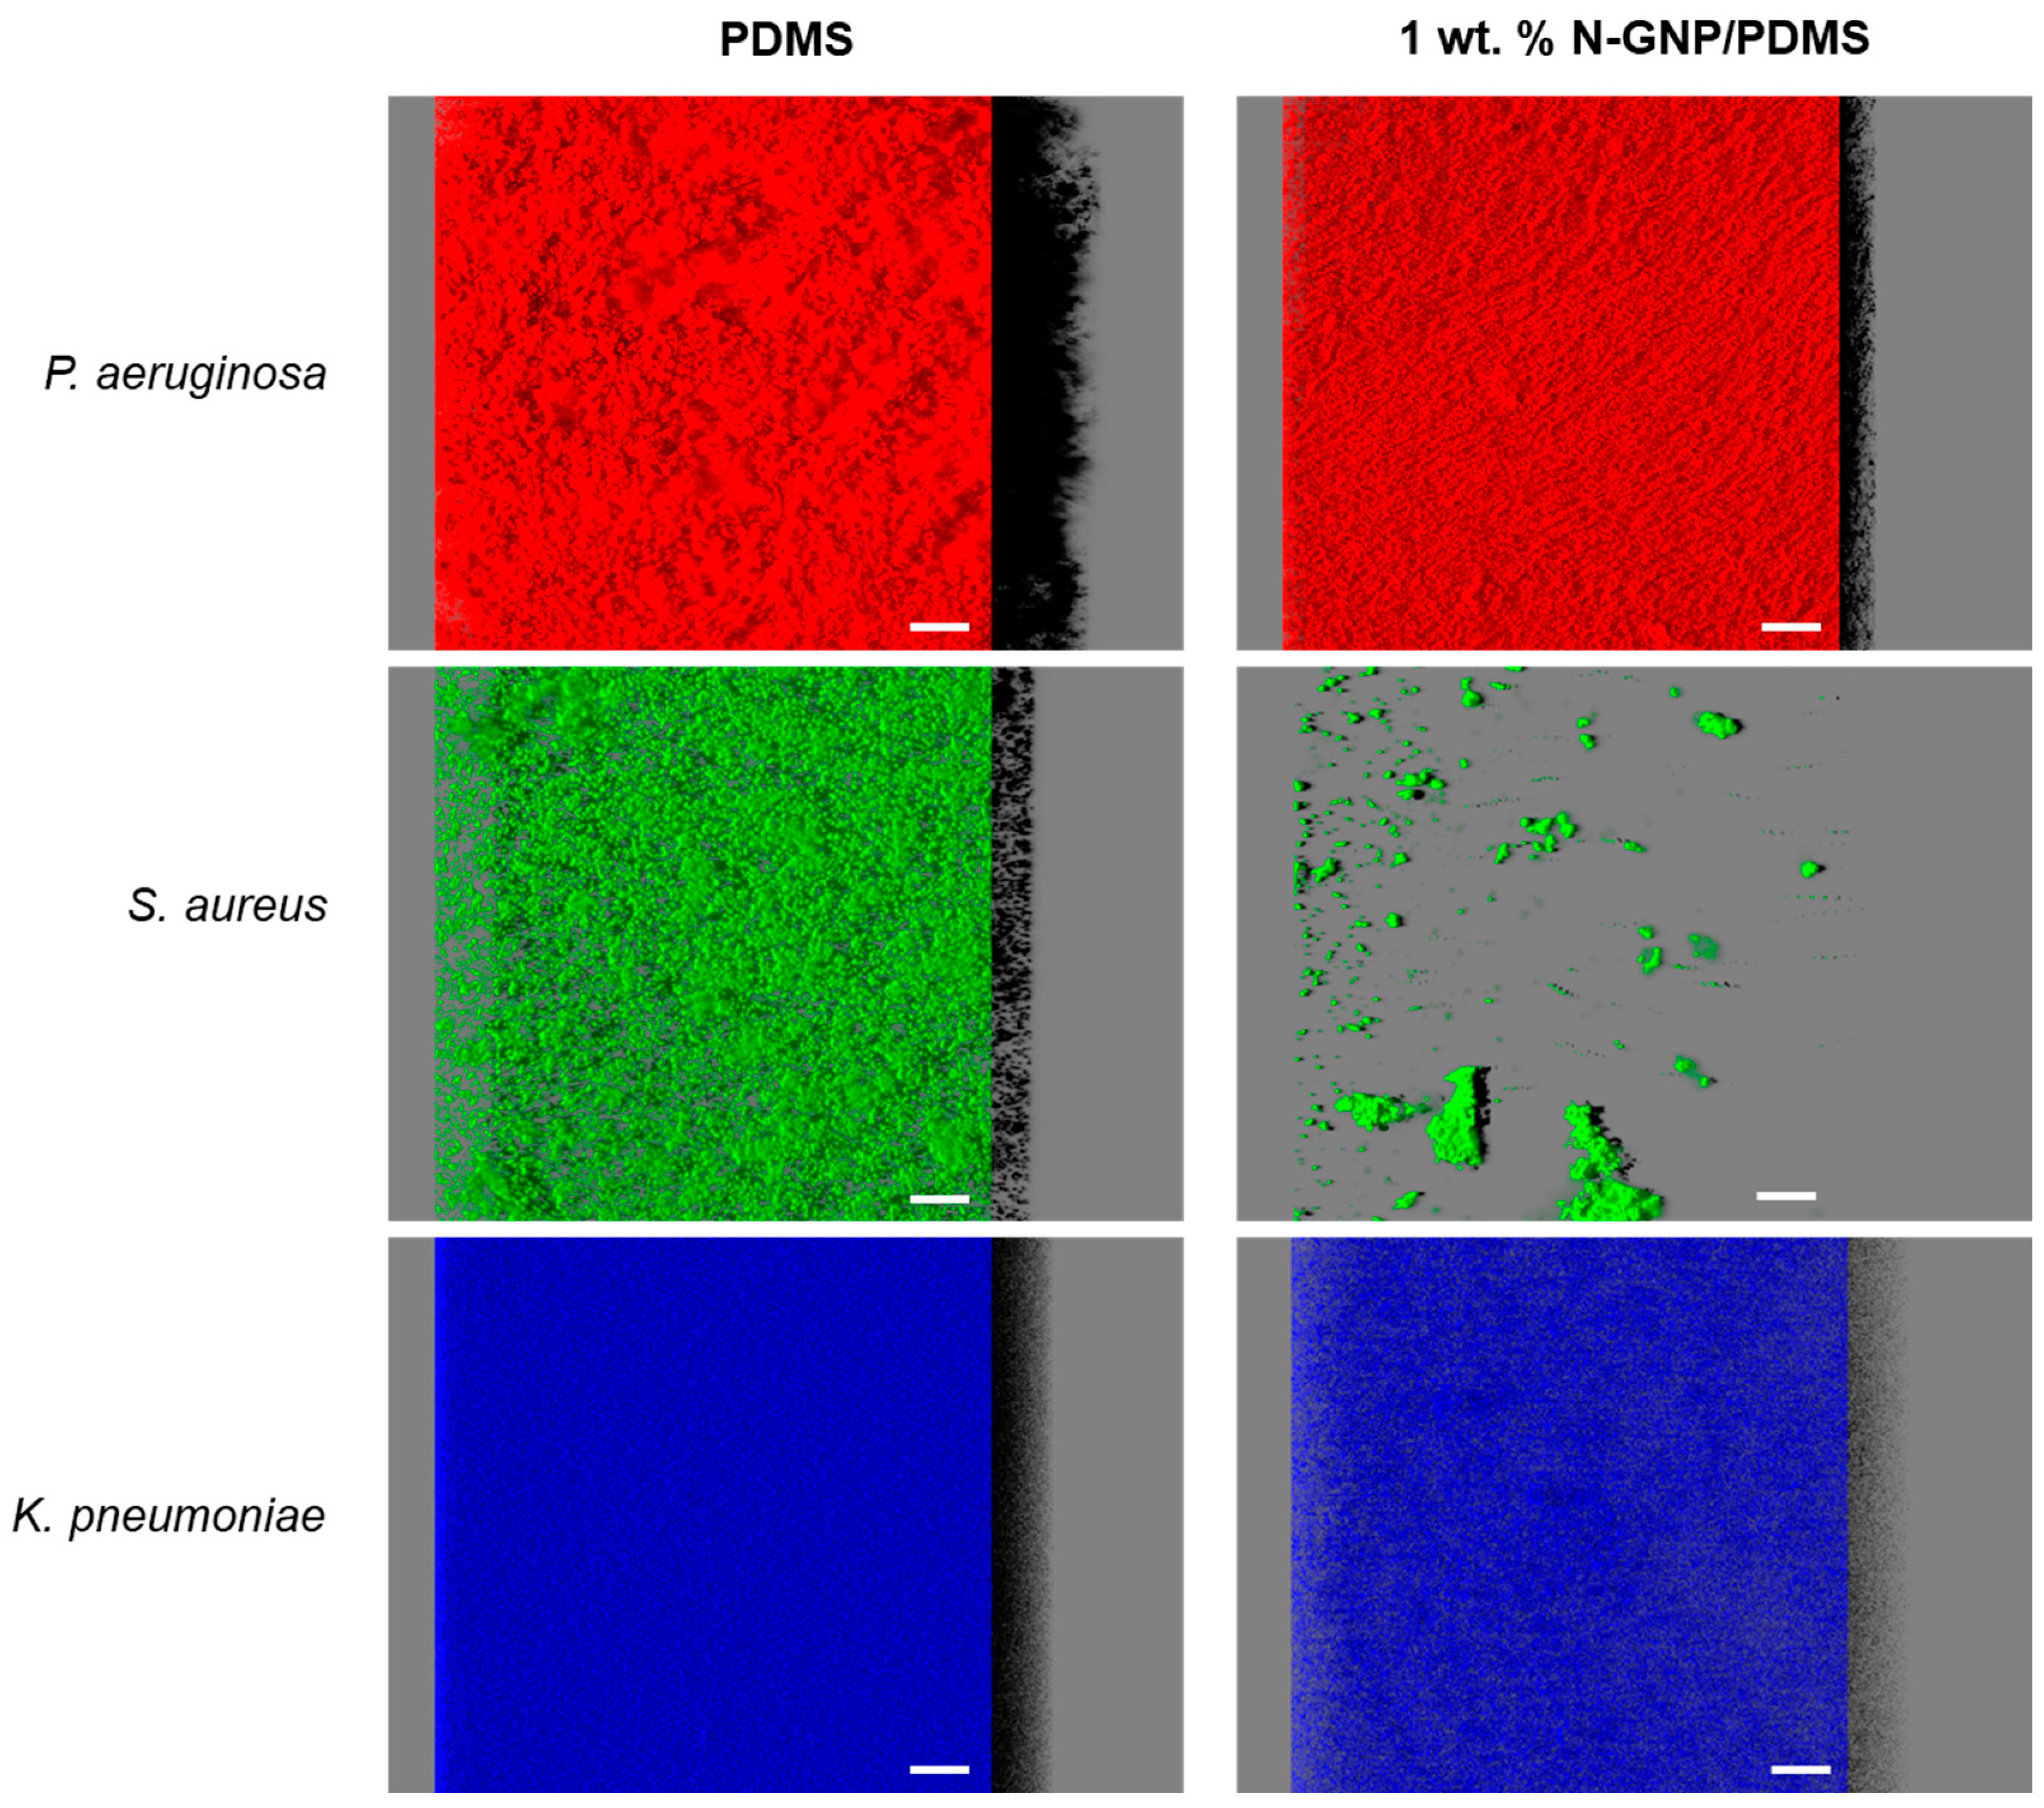
2.5.3. Confocal Laser Scanning Microscopy (CLSM) and Image Analysis
2.6. Evaluation of N-GNP Mechanisms of Action
2.7. Statistical Analysis
3. Results and Discussion
3.1. Characterization of Pristine and Nitrogen-Functionalized Graphene
3.2. Composite Characterization
3.2.1. Surface Morphology
3.2.2. Surface Roughness
3.2.3. Surface Hydrophobicity
3.3. Antibiofilm Performance of N-GNP/Polydimethylsiloxane (PDMS) Composites
3.3.1. Biofilm Total Cells
3.3.2. Biofilm Culturable Cells
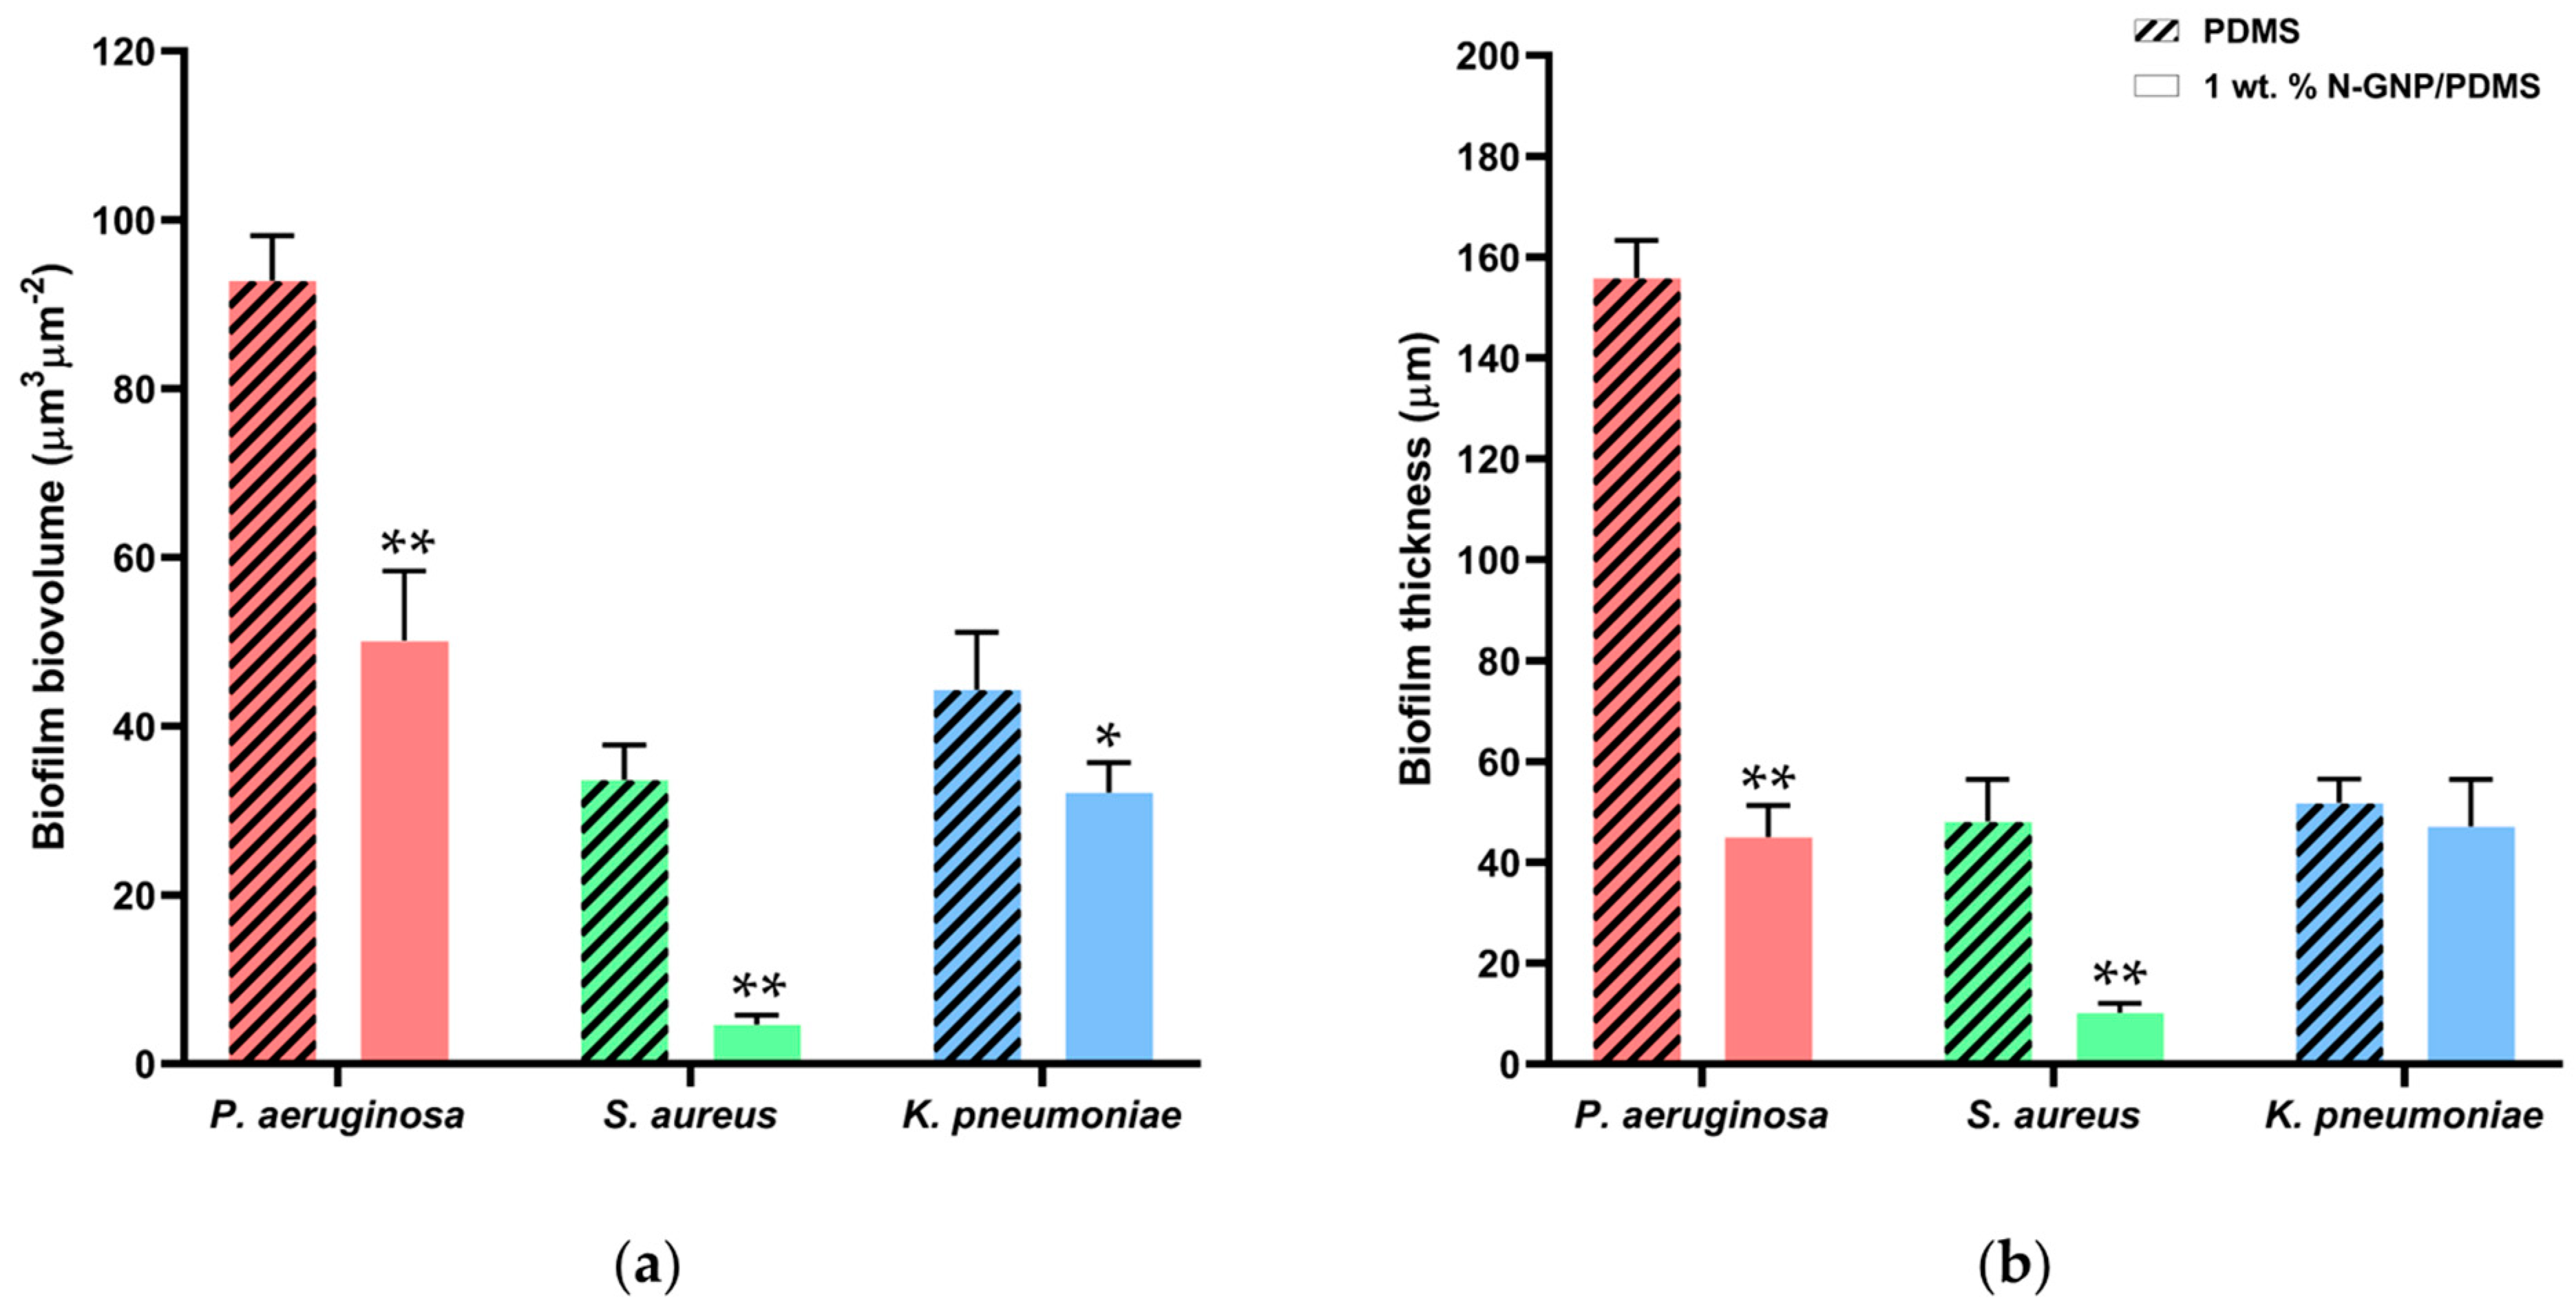
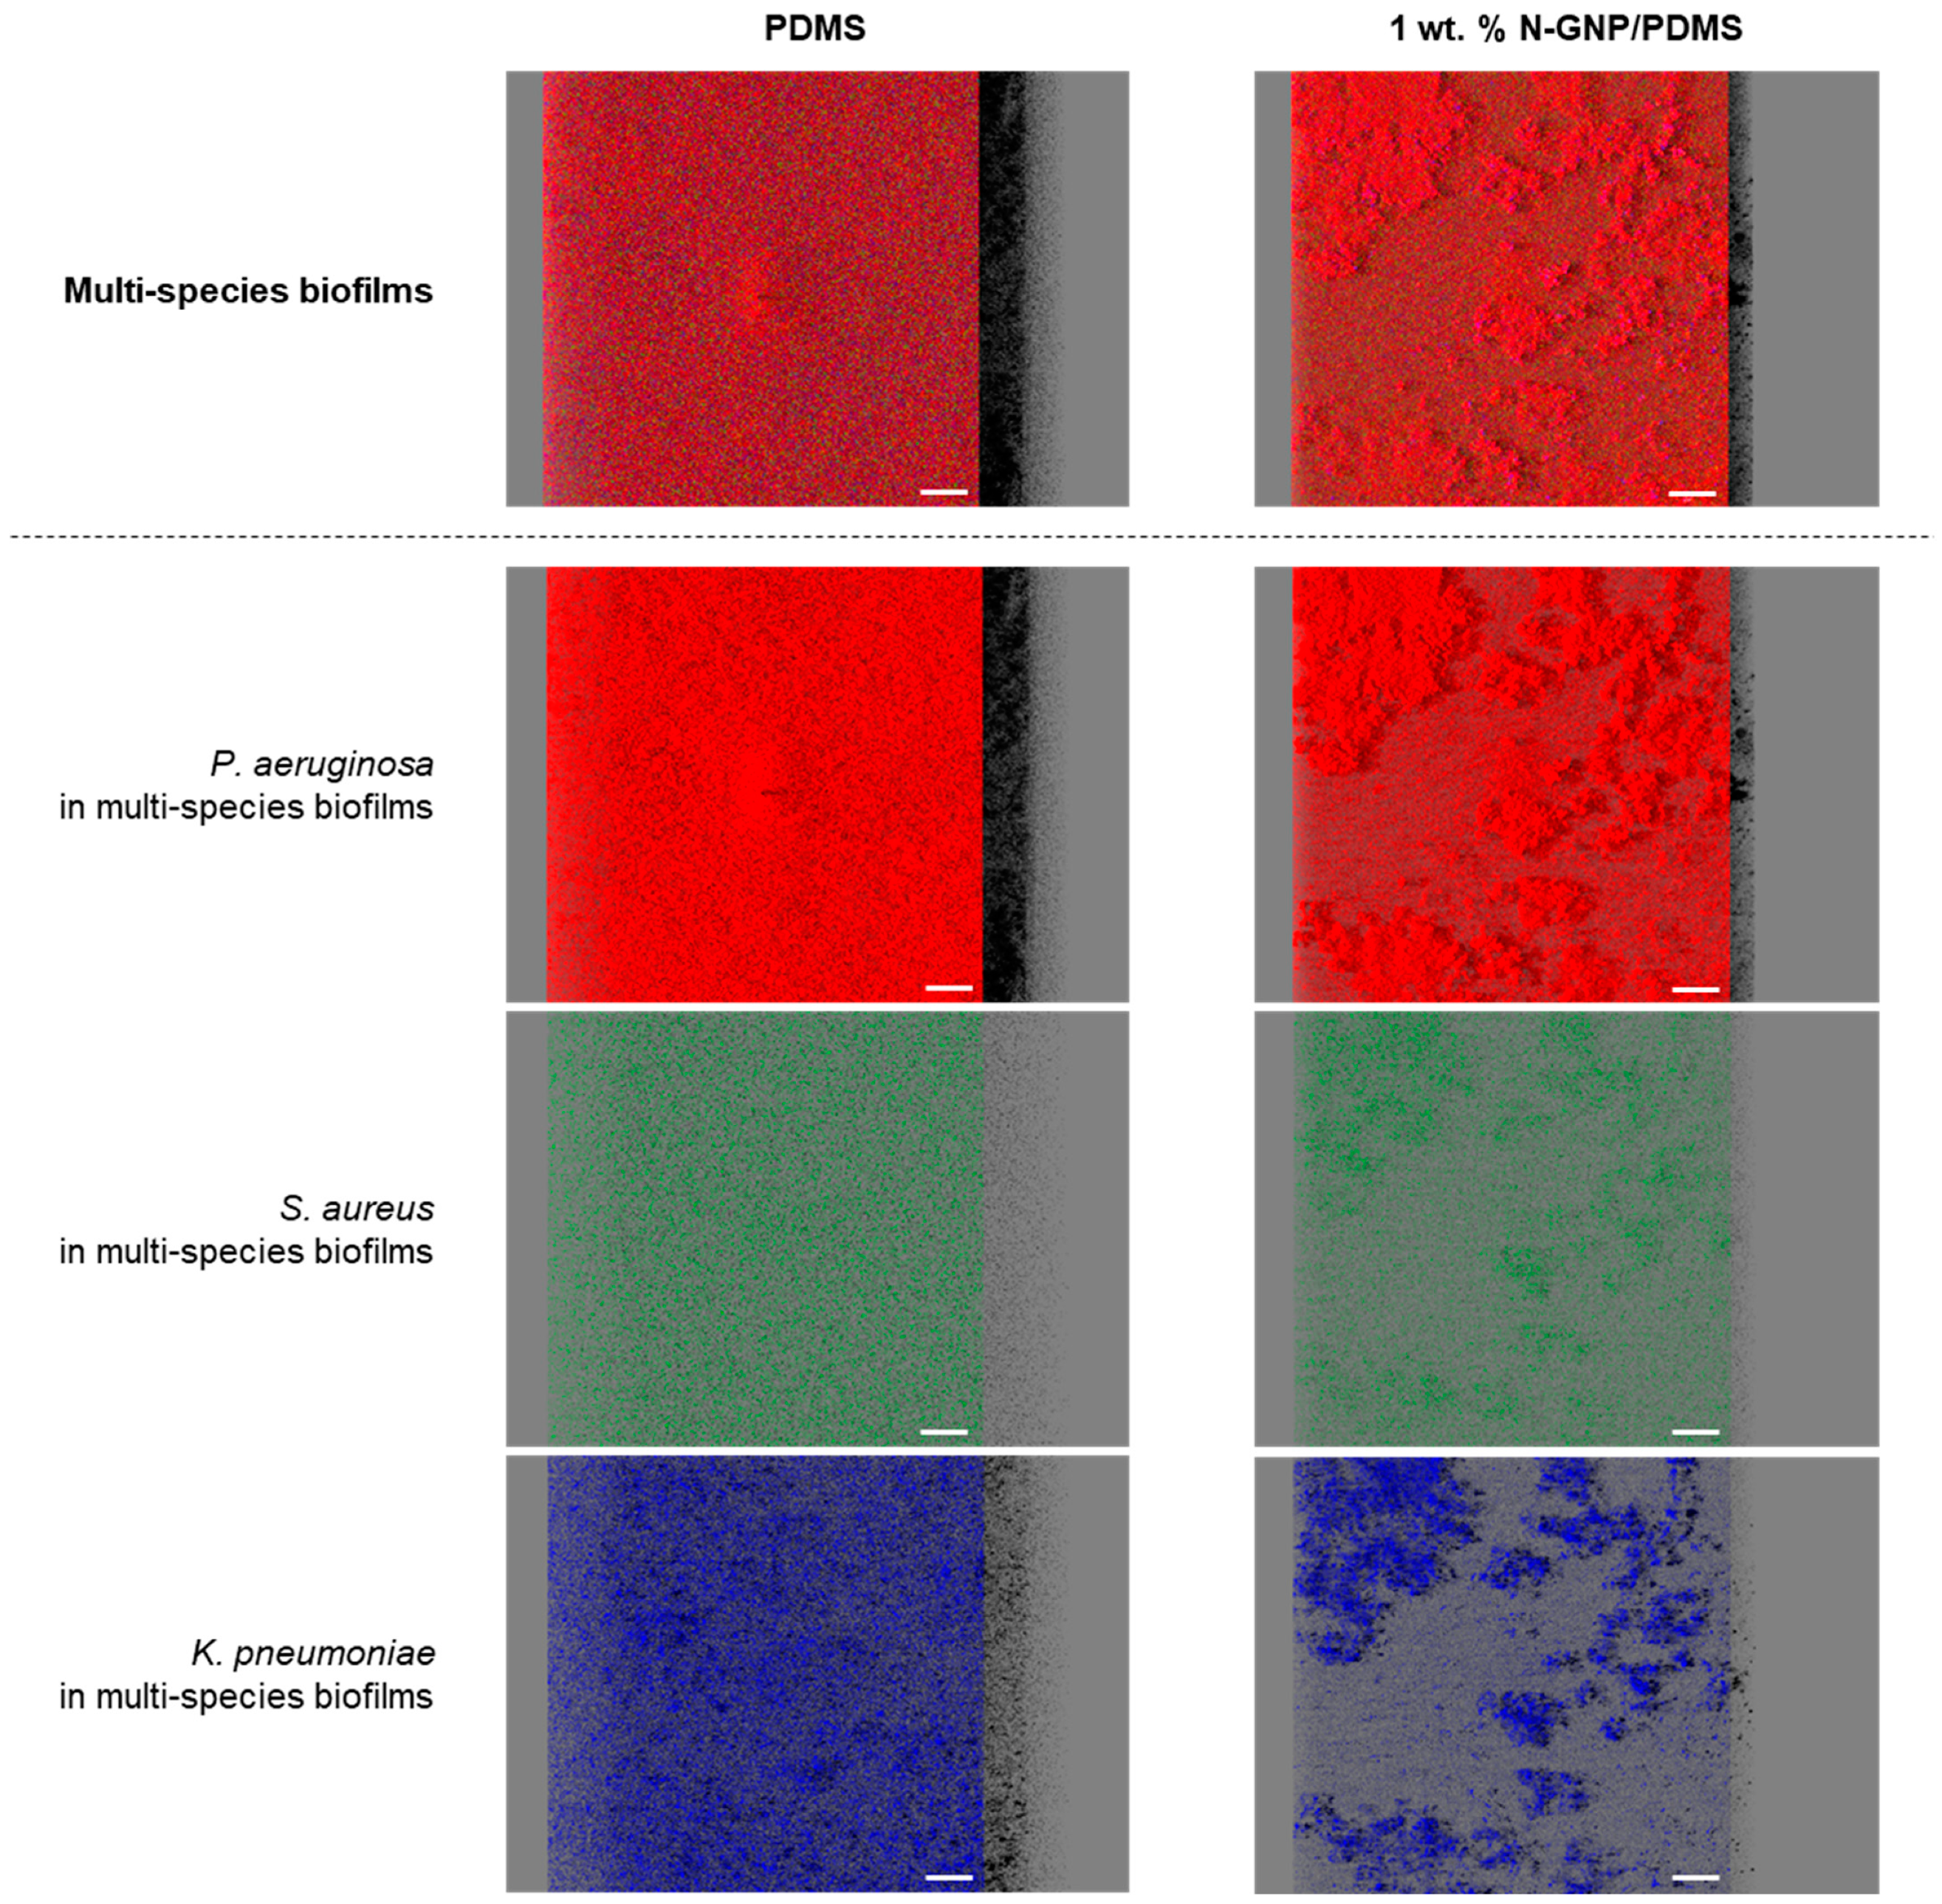
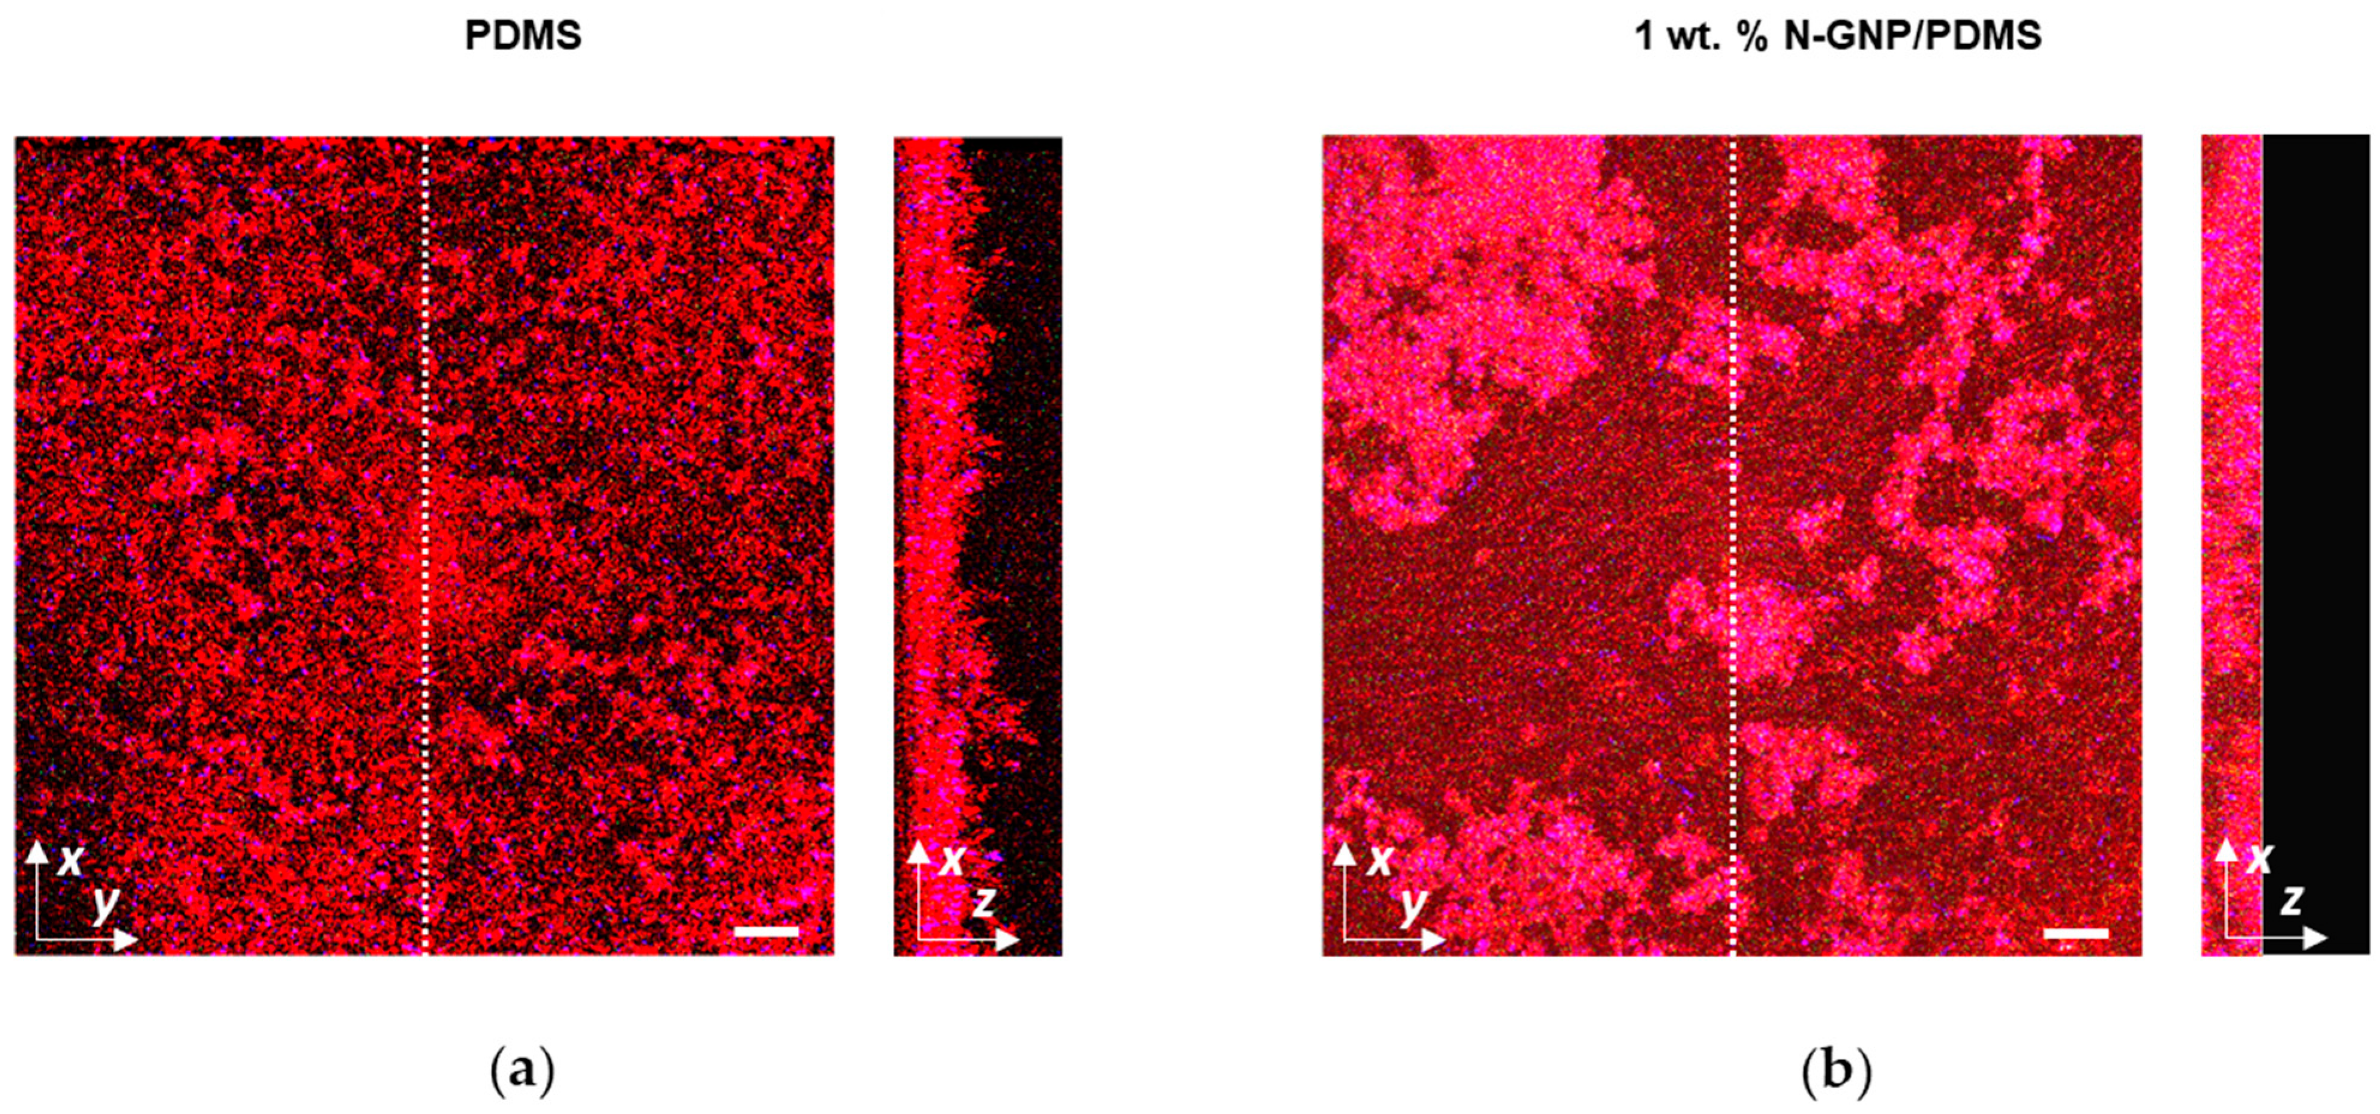
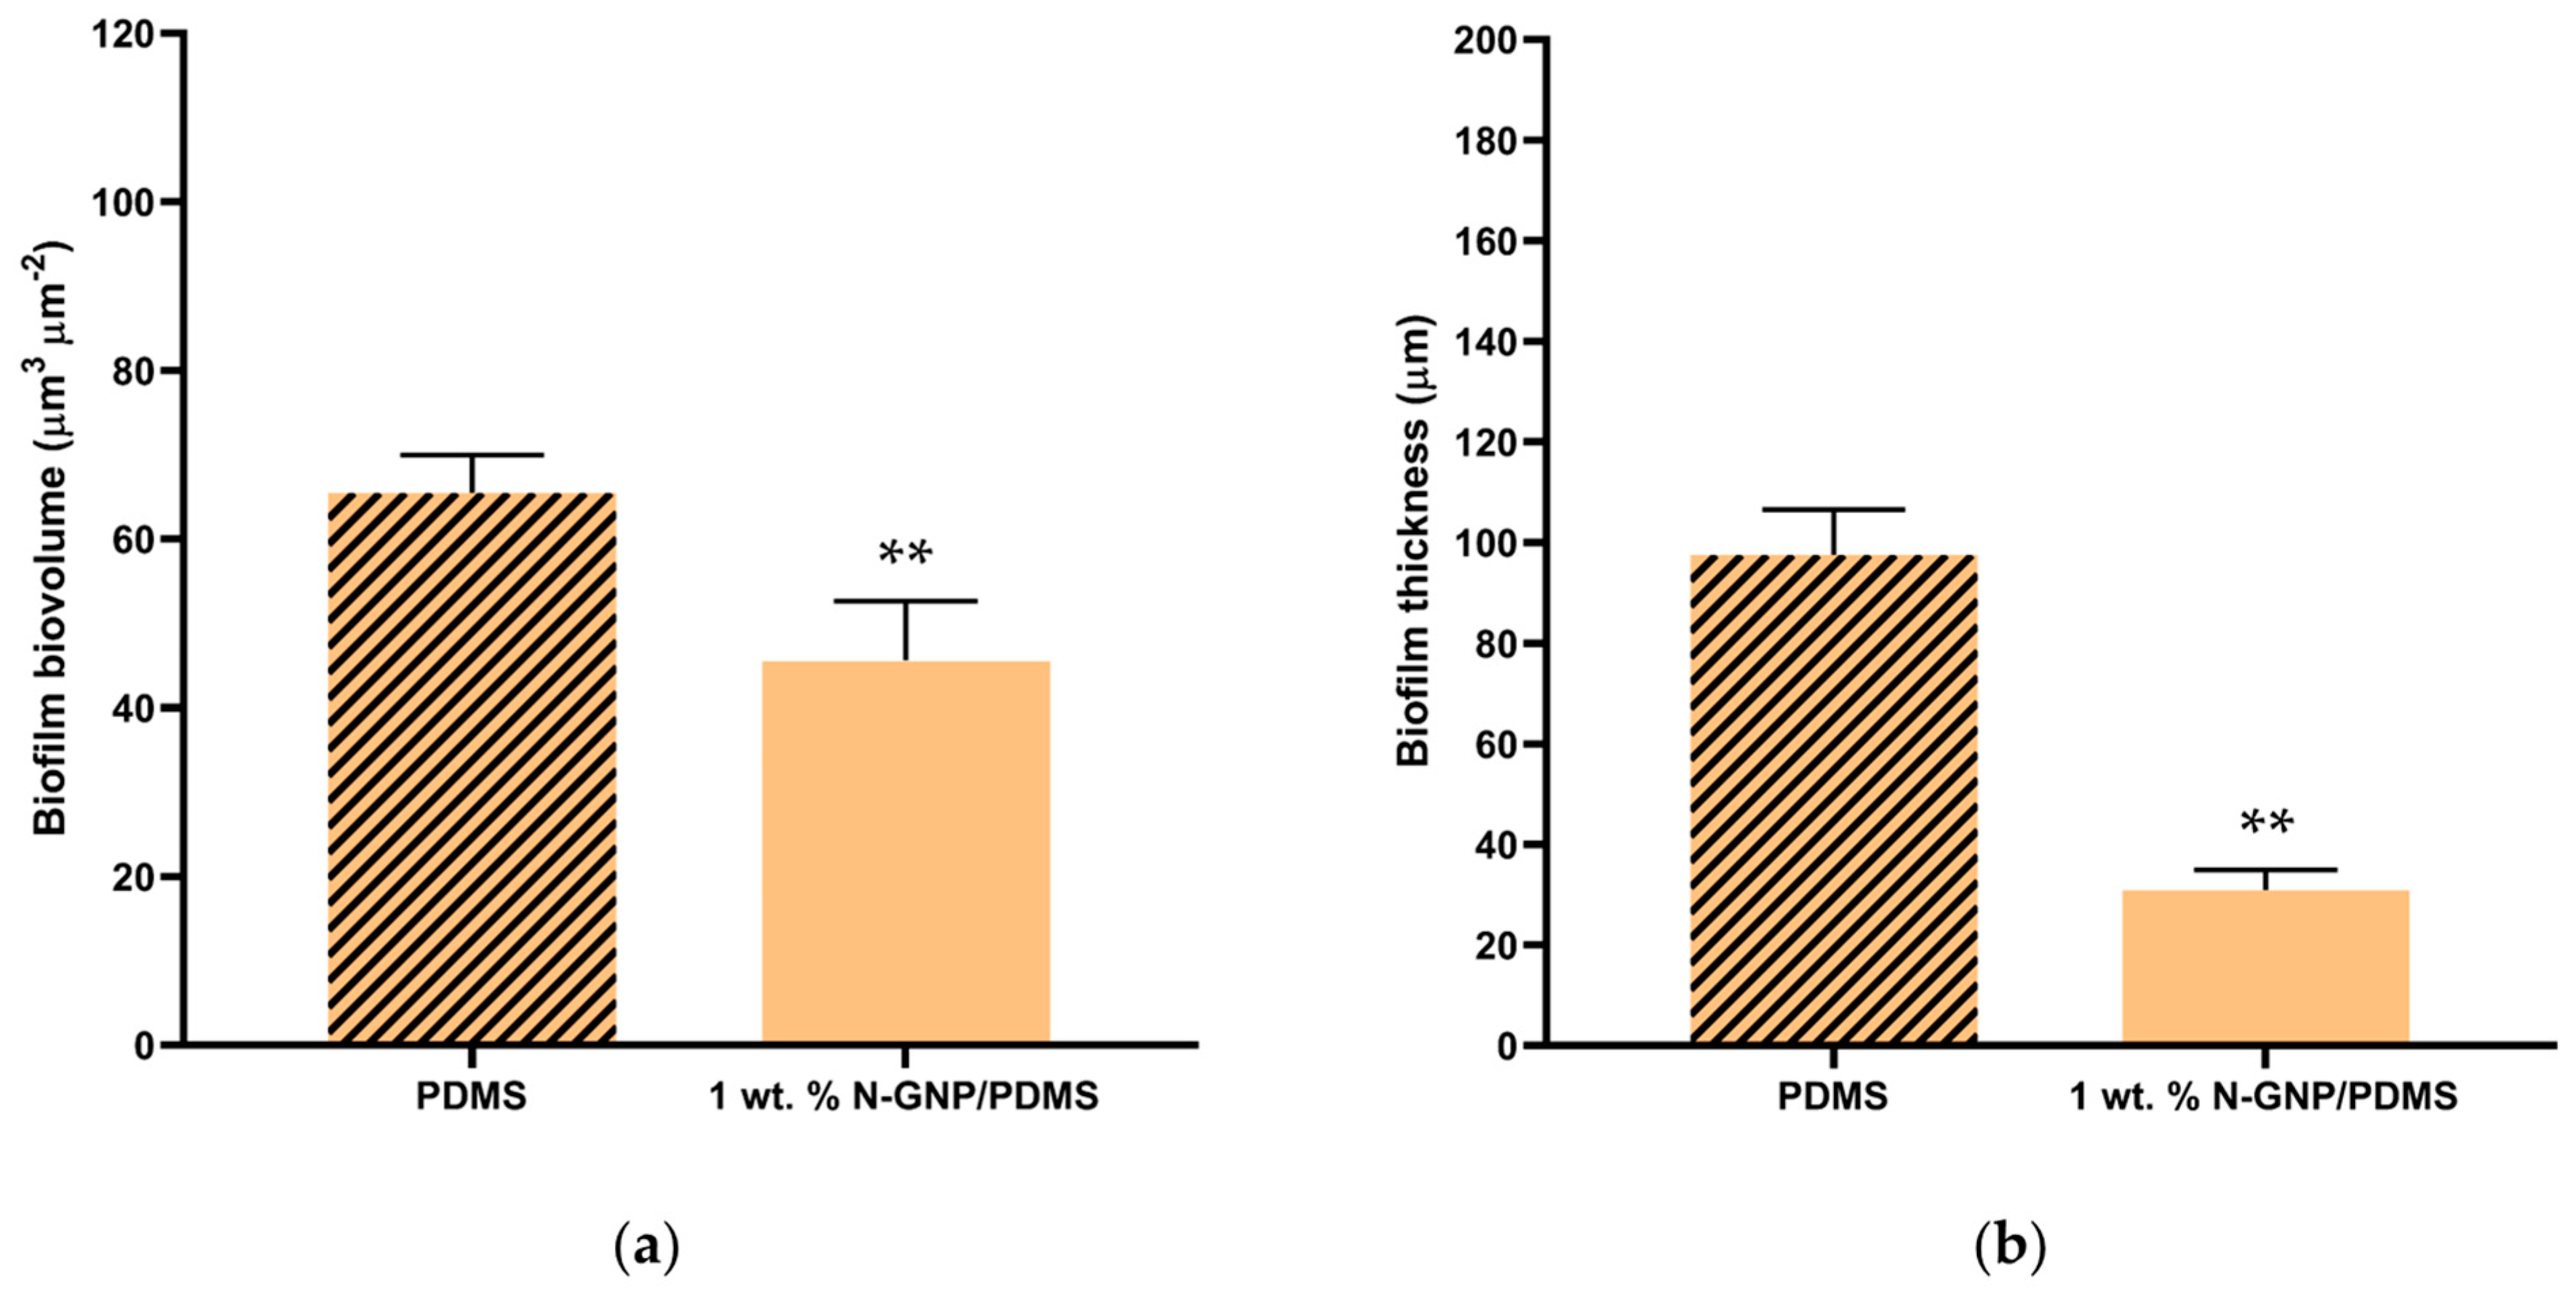
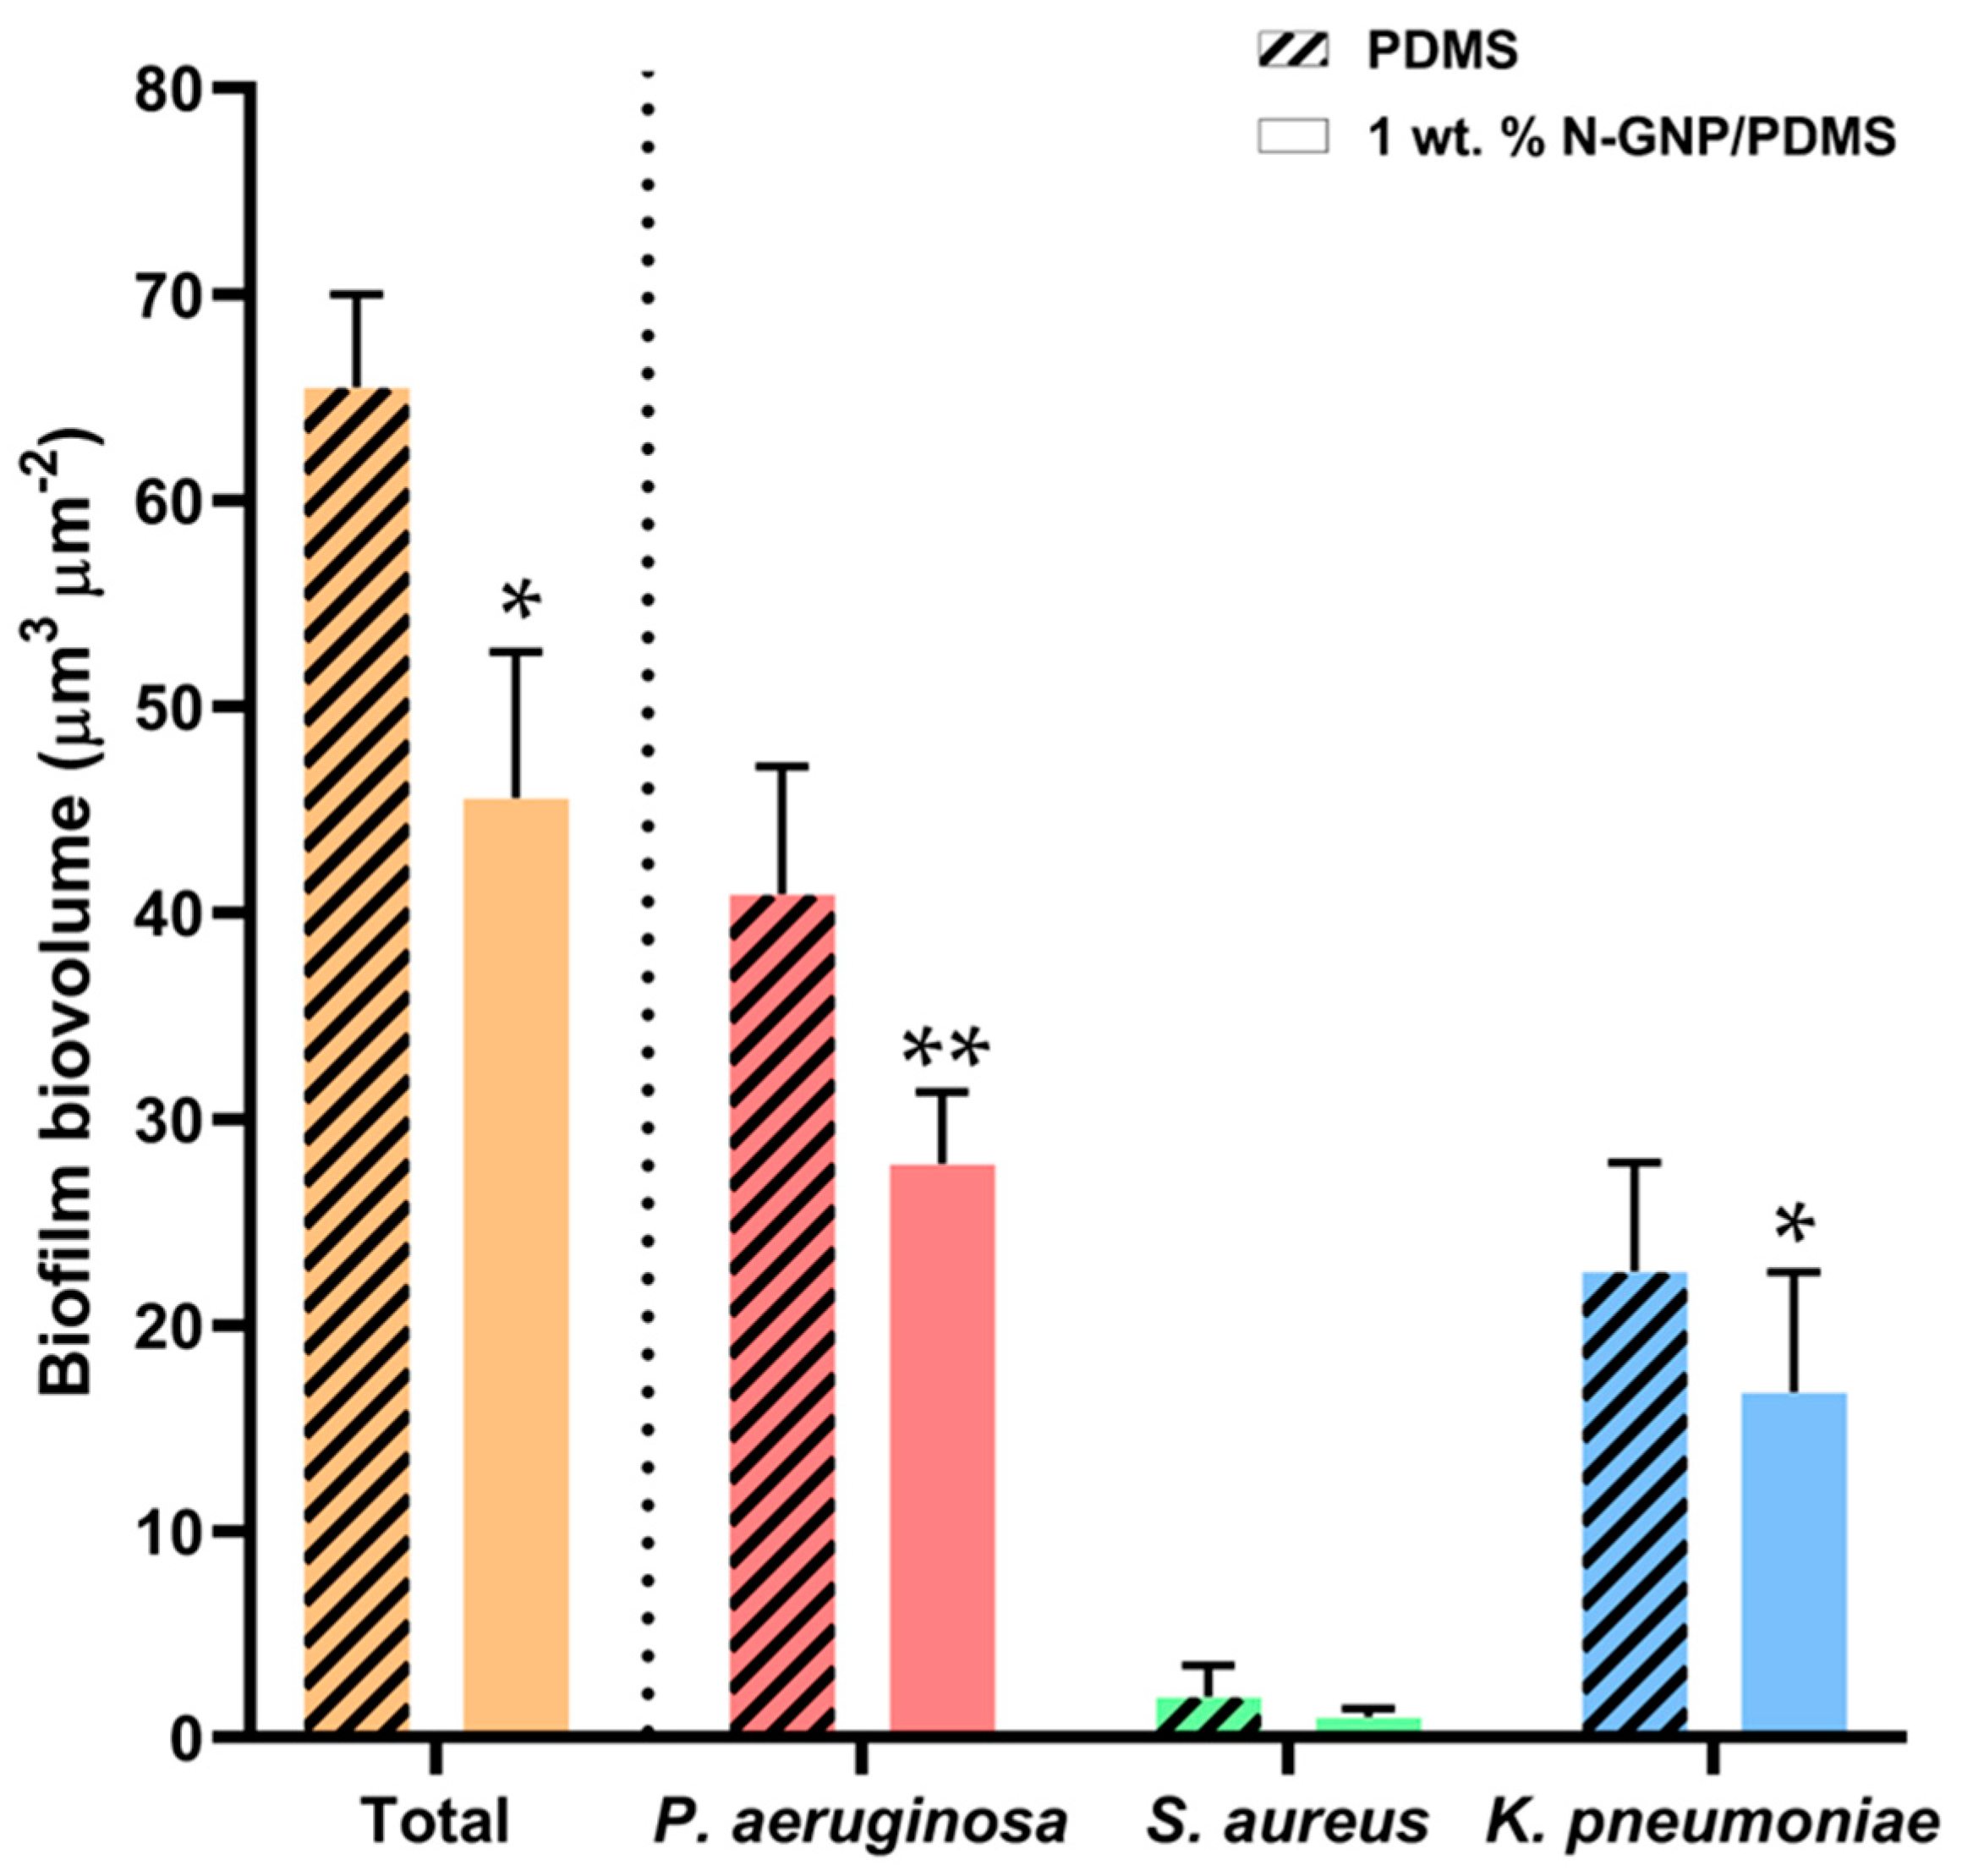
3.3.3. CLSM Analysis
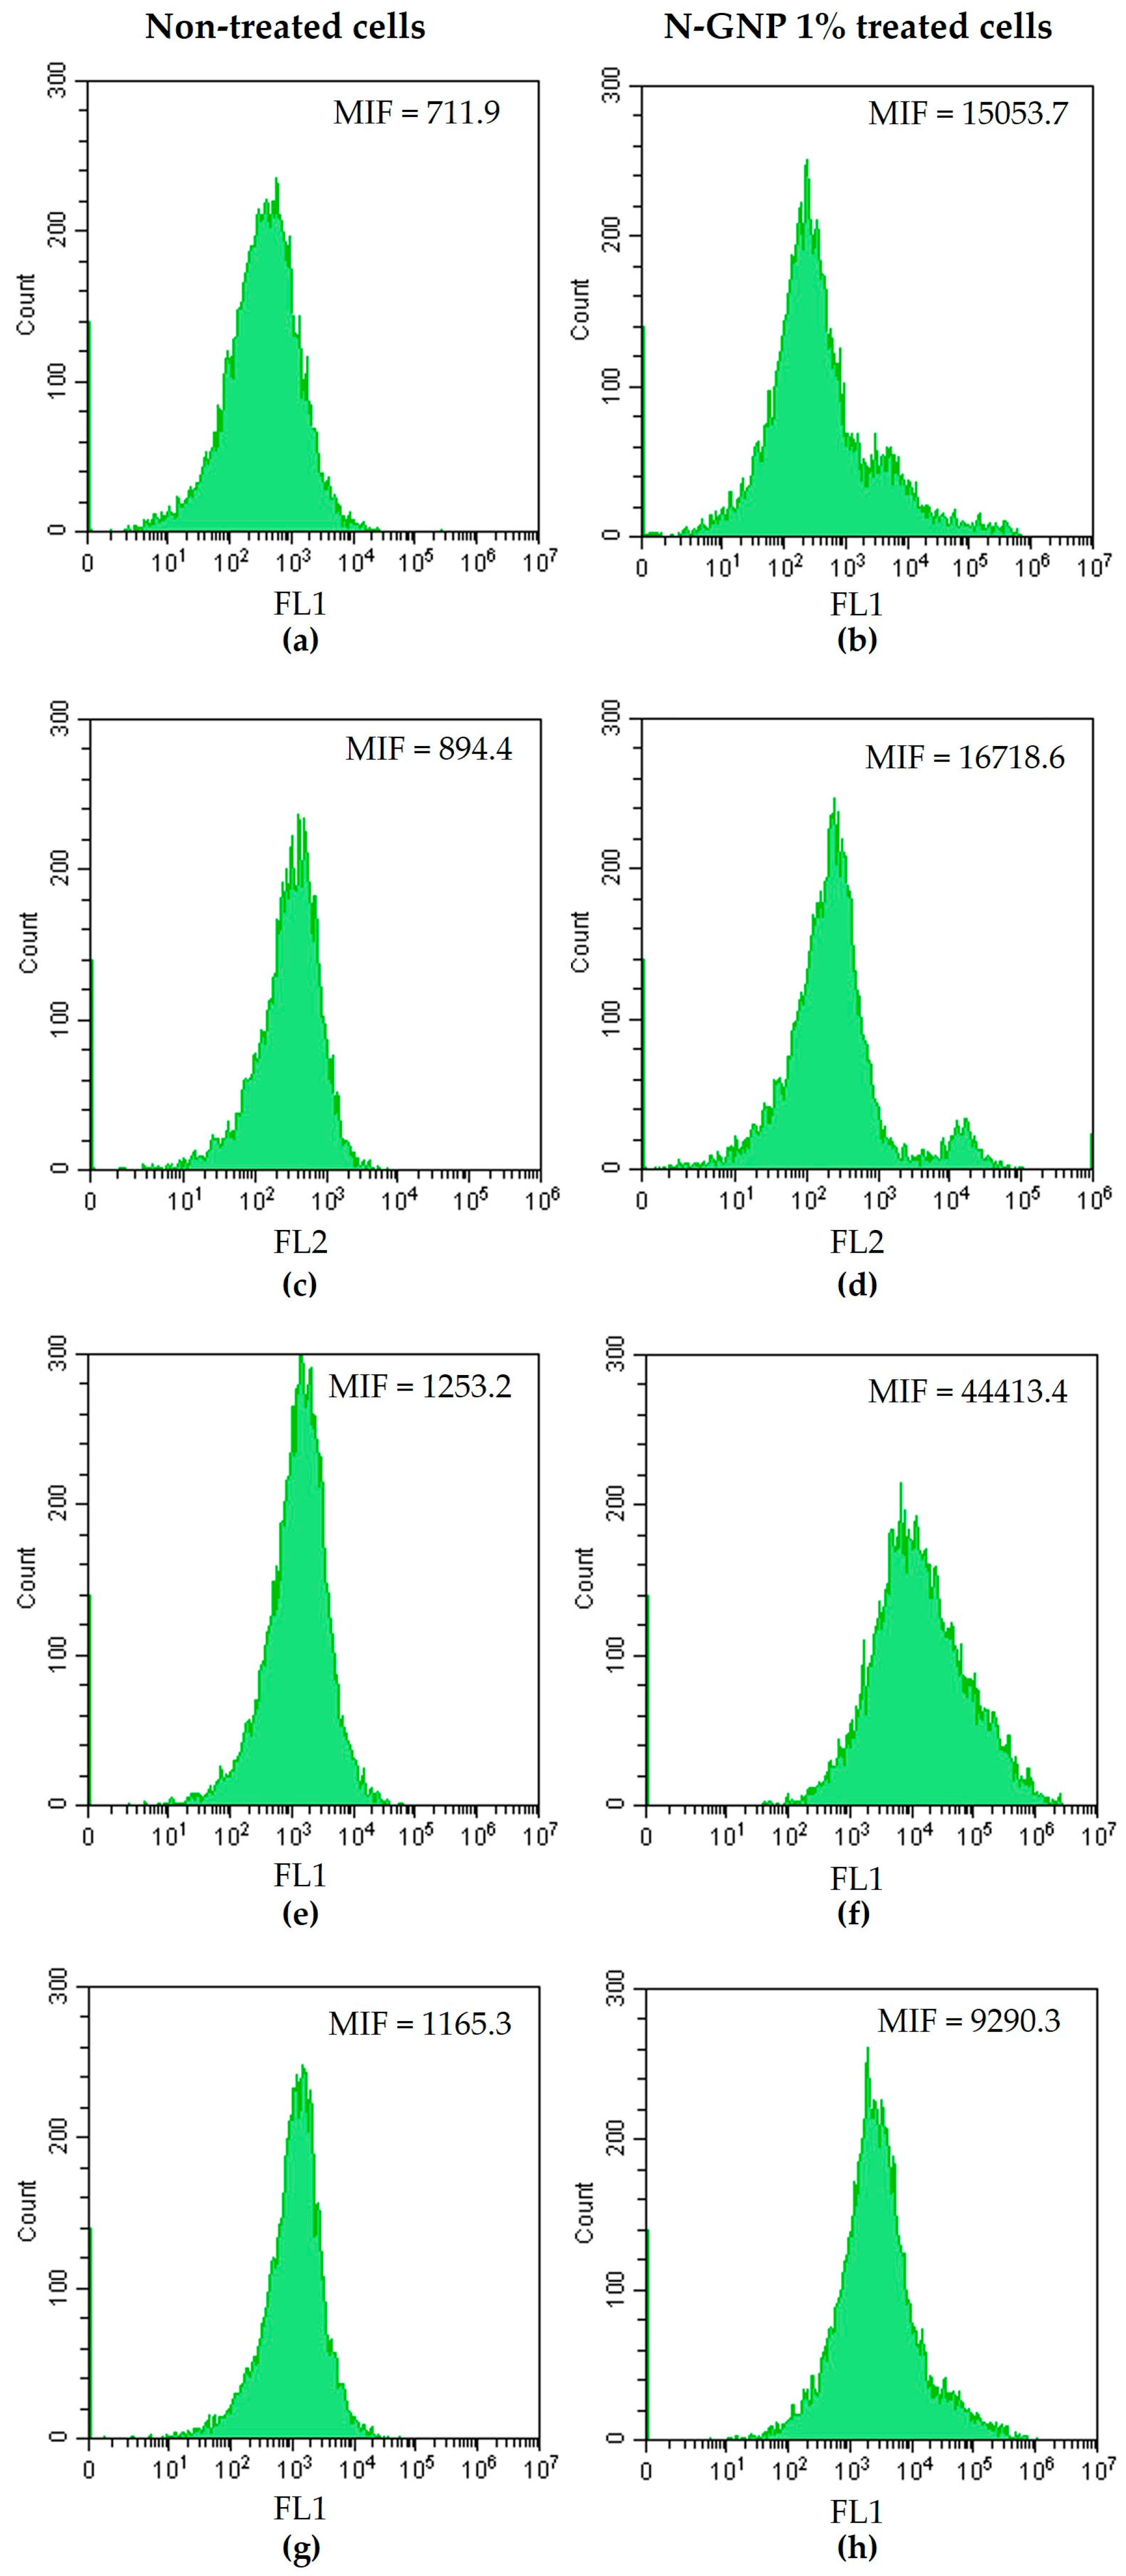
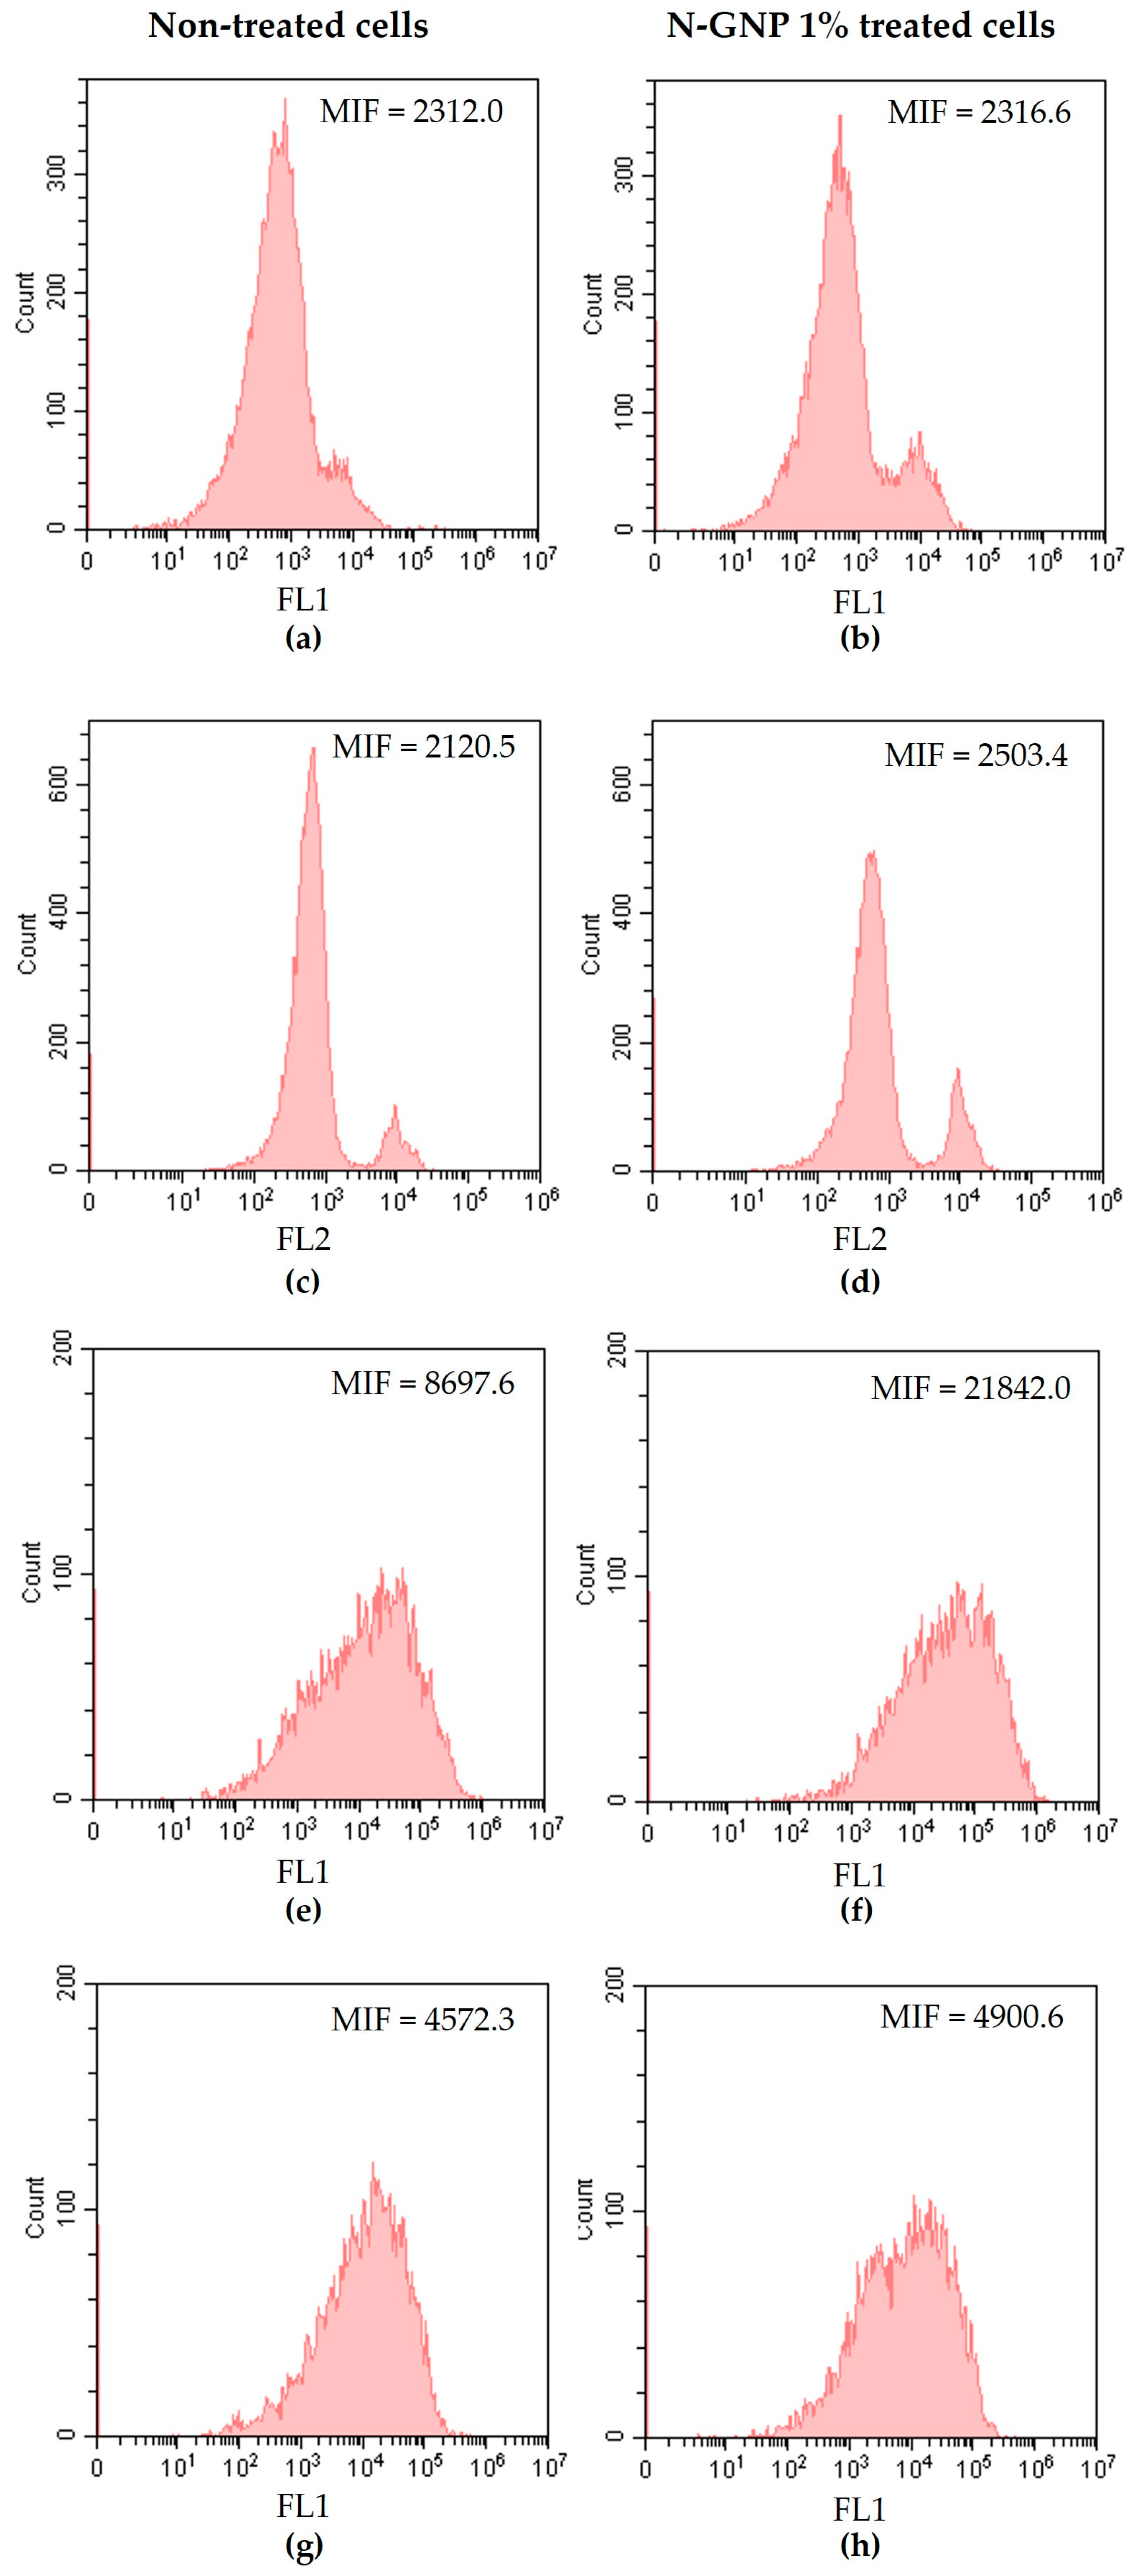
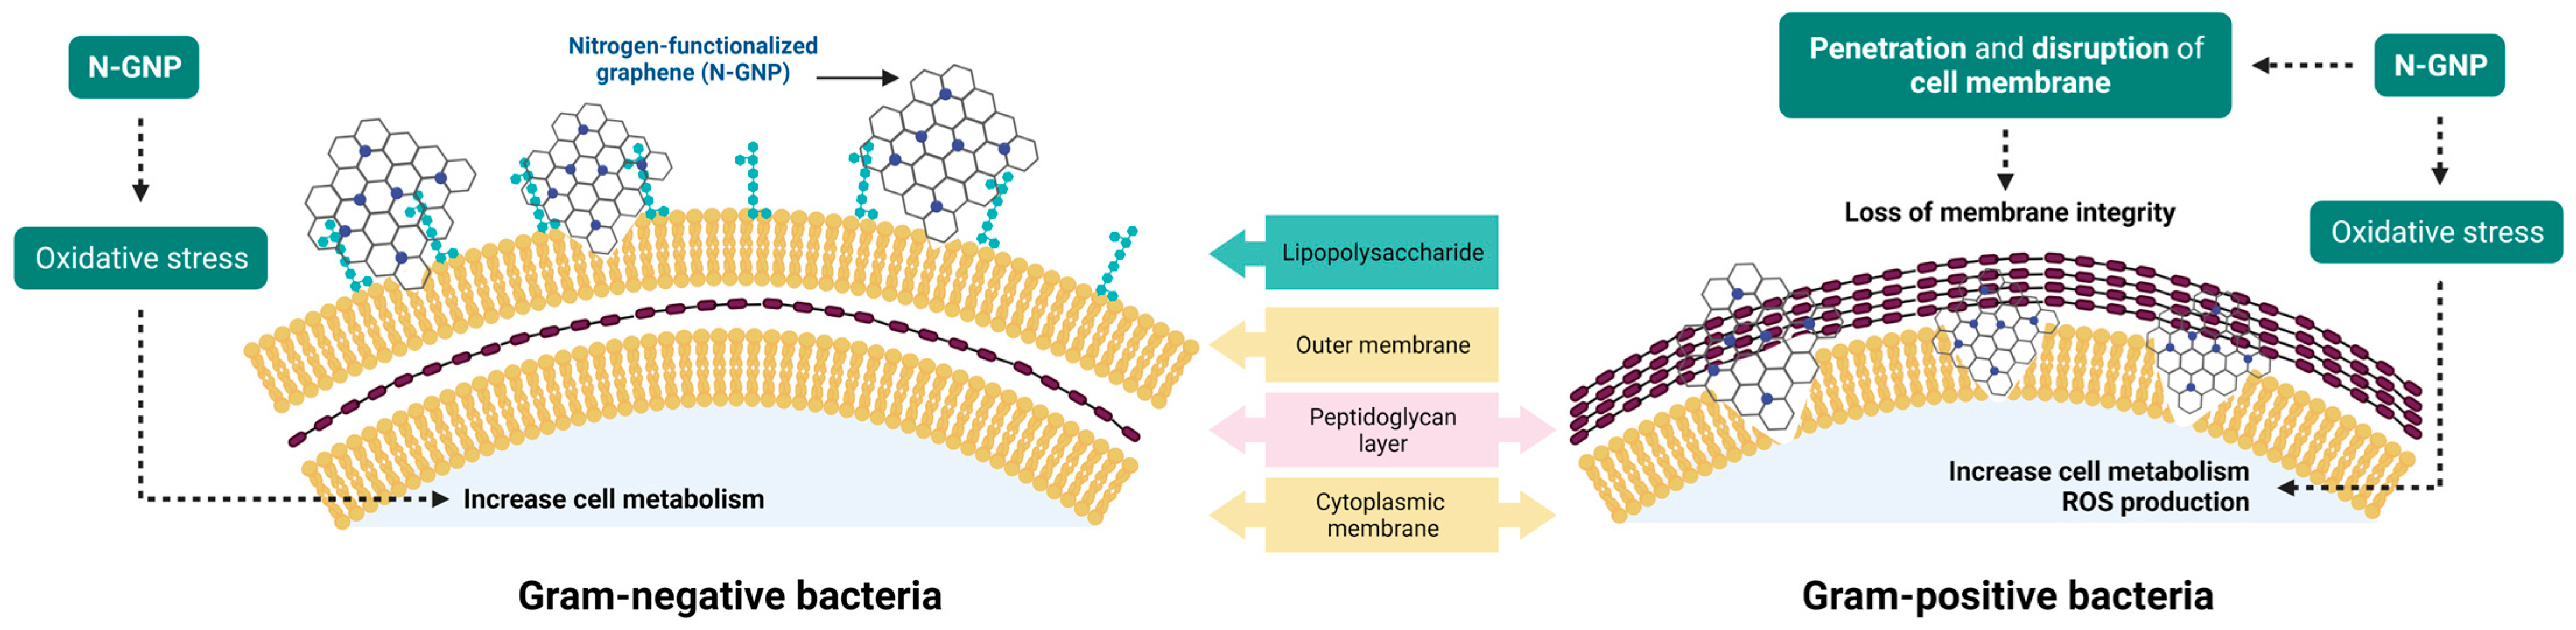
3.4. N-GNP Mechanisms of Action
4. Conclusions
Supplementary Materials
Author Contributions
Funding
Data Availability Statement
Conflicts of Interest
References
- McCleskey, S.G.; Shek, L.; Grein, J.; Gotanda, H.; Anderson, L.; Shekelle, P.G.; Keeler, E.; Morton, S.; Nuckols, T.K. Economic evaluation of quality improvement interventions to prevent catheter-associated urinary tract infections in the hospital setting: A systematic review. BMJ Qual. Saf. 2022, 31, 308–321. [Google Scholar] [CrossRef]
- Rhee, C.; Phelps, M.E.; Meyer, B.; Reed, W.G. Viewing Prevention of Catheter-Associated Urinary Tract Infection as a System: Using Systems Engineering and Human Factors Engineering in a Quality Improvement Project in an Academic Medical Center. Jt. Comm. J. Qual. Patient Saf. 2016, 42, 447-AP410. [Google Scholar] [CrossRef]
- Vallejo-Torres, L.; Pujol, M.; Shaw, E.; Wiegand, I.; Vigo, J.M.; Stoddart, M.; Grier, S.; Gibbs, J.; Vank, C.; Cuperus, N.; et al. Cost of hospitalised patients due to complicated urinary tract infections: A retrospective observational study in countries with high prevalence of multidrug-resistant Gram-negative bacteria: The COMBACTE-MAGNET, RESCUING study. BMJ Open 2018, 8, e020251. [Google Scholar] [CrossRef] [PubMed]
- Simmering, J.E.; Tang, F.; Cavanaugh, J.E.; Polgreen, L.A.; Polgreen, P.M. The Increase in Hospitalizations for Urinary Tract Infections and the Associated Costs in the United States, 1998–2011. Open Forum Infect. Dis. 2017, 4, ofw281. [Google Scholar] [CrossRef] [PubMed]
- Gomes, M.; Gomes, L.C.; Teixeira-Santos, R.; Mergulhão, F.J. PDMS in Urinary Tract Devices: Applications, Problems and Potential Solutions. In Polydimethylsiloxane: Structure and Applications; Carlsen, P.N., Ed.; Nova Science Publishers: New York, NY, USA, 2020; Volume 502, pp. 95–144. [Google Scholar]
- Victor, A.H.J.; Apolónia, S.; Ribeiro, J.G.R.; Araújo, F.F.; Bragança; Portugal; Apolónia, C.S.; Cefet; Reis, R.C.A.d.; Janeiro, R.D.; et al. Study of PDMS characterization and its applications in biomedicine: A review. J. Mech. Eng. Biomech. 2019, 4, 1–9. [Google Scholar] [CrossRef]
- Zhang, H.; Chiao, M. Anti-fouling Coatings of Poly(dimethylsiloxane) Devices for Biological and Biomedical Applications. J. Med. Biol. Eng. 2015, 35, 143–155. [Google Scholar] [CrossRef]
- Feneley, R.C.L.; Hopley, I.B.; Wells, P.N.T. Urinary catheters: History, current status, adverse events and research agenda. J. Med. Eng. Technol. 2015, 39, 459–470. [Google Scholar] [CrossRef]
- Trautner, B.W.; Darouiche, R.O. Role of biofilm in catheter-associated urinary tract infection. Am. J. Infect. Control 2004, 32, 177–183. [Google Scholar] [CrossRef]
- del Pozo, J.L.; Patel, R. The Challenge of Treating Biofilm-associated Bacterial Infections. Clin. Pharmacol. Ther. 2007, 82, 204–209. [Google Scholar] [CrossRef]
- Jacobsen, S.M.; Stickler, D.J.; Mobley, H.L.; Shirtliff, M.E. Complicated catheter-associated urinary tract infections due to Escherichia coli and Proteus mirabilis. Clin. Microbiol. Rev. 2008, 21, 26–59. [Google Scholar] [CrossRef]
- Weiner-Lastinger, L.M.; Abner, S.; Edwards, J.R.; Kallen, A.J.; Karlsson, M.; Magill, S.S.; Pollock, D.; See, I.; Soe, M.M.; Walters, M.S.; et al. Antimicrobial-resistant pathogens associated with adult healthcare-associated infections: Summary of data reported to the National Healthcare Safety Network, 2015–2017. Infect. Control Hosp. Epidemiol. 2020, 41, 1–18. [Google Scholar] [CrossRef] [PubMed]
- Sycz, Z.; Tichaczek-Goska, D.; Jezierska-Domaradzka, A.; Wojnicz, D. Are Uropathogenic Bacteria Living in Multispecies Biofilm Susceptible to Active Plant Ingredient-Asiatic Acid? Biomolecules 2021, 11, 1754. [Google Scholar] [CrossRef] [PubMed]
- Musco, S.; Giammò, A.; Savoca, F.; Gemma, L.; Geretto, P.; Soligo, M.; Sacco, E.; Del Popolo, G.; Li Marzi, V. How to Prevent Catheter-Associated Urinary Tract Infections: A Reappraisal of Vico’s Theory—Is History Repeating Itself? J. Clin. Med. 2022, 11, 3415. [Google Scholar] [CrossRef] [PubMed]
- Ballo, M.K.; Rtimi, S.; Pulgarin, C.; Hopf, N.; Berthet, A.; Kiwi, J.; Moreillon, P.; Entenza, J.M.; Bizzini, A. In Vitro and In Vivo Effectiveness of an Innovative Silver-Copper Nanoparticle Coating of Catheters To Prevent Methicillin-Resistant Staphylococcus aureus Infection. Antimicrob. Agents Chemother. 2016, 60, 5349–5356. [Google Scholar] [CrossRef] [PubMed]
- Rtimi, S.; Sanjines, R.; Pulgarin, C.; Kiwi, J. Quasi-Instantaneous Bacterial Inactivation on Cu–Ag Nanoparticulate 3D Catheters in the Dark and Under Light: Mechanism and Dynamics. ACS Appl. Mater. Interfaces 2016, 8, 47–55. [Google Scholar] [CrossRef]
- Teixeira-Santos, R.; Gomes, M.; Gomes, L.C.; Mergulhão, F.J. Antimicrobial and anti-adhesive properties of carbon nanotube-based surfaces for medical applications: A systematic review. iScience 2021, 24, 102001. [Google Scholar] [CrossRef]
- Kumar, P.; Huo, P.; Zhang, R.; Liu, B. Antibacterial Properties of Graphene-Based Nanomaterials. Nanomaterials 2019, 9, 737. [Google Scholar]
- Soldano, C.; Mahmood, A.; Dujardin, E. Production, properties and potential of graphene. Carbon 2010, 48, 2127–2150. [Google Scholar] [CrossRef]
- Armano, A.; Agnello, S. Two-Dimensional Carbon: A Review of Synthesis Methods, and Electronic, Optical, and Vibrational Properties of Single-Layer Graphene. C 2019, 5, 67. [Google Scholar] [CrossRef]
- Yang, K.; Feng, L.; Liu, Z. The advancing uses of nano-graphene in drug delivery. Expert Opin. Drug Deliv. 2015, 12, 601–612. [Google Scholar] [CrossRef]
- Geetha Bai, R.; Ninan, N.; Muthoosamy, K.; Manickam, S. Graphene: A versatile platform for nanotheranostics and tissue engineering. Prog. Mater. Sci. 2018, 91, 24–69. [Google Scholar] [CrossRef]
- Soliman, M.; Sadek, A.A.; Abdelhamid, H.N.; Hussein, K. Graphene oxide-cellulose nanocomposite accelerates skin wound healing. Res. Vet. Sci. 2021, 137, 262–273. [Google Scholar] [CrossRef] [PubMed]
- Akhavan, O.; Ghaderi, E. Toxicity of Graphene and Graphene Oxide Nanowalls Against Bacteria. ACS Nano 2010, 4, 5731–5736. [Google Scholar] [CrossRef] [PubMed]
- Staneva, A.D.; Dimitrov, D.K.; Gospodinova, D.N.; Vladkova, T.G. Antibiofouling Activity of Graphene Materials and Graphene-Based Antimicrobial Coatings. Microorganisms 2021, 9, 1839. [Google Scholar] [CrossRef] [PubMed]
- Jia, P.P.; Sun, T.; Junaid, M.; Yang, L.; Ma, Y.B.; Cui, Z.S.; Wei, D.P.; Shi, H.F.; Pei, D.S. Nanotoxicity of different sizes of graphene (G) and graphene oxide (GO) in vitro and in vivo. Environ. Pollut. 2019, 247, 595–606. [Google Scholar] [CrossRef]
- Mohammed, H.; Kumar, A.; Bekyarova, E.; Al-Hadeethi, Y.; Zhang, X.; Chen, M.; Ansari, M.S.; Cochis, A.; Rimondini, L. Antimicrobial Mechanisms and Effectiveness of Graphene and Graphene-Functionalized Biomaterials. A Scope Review. Front. Bioeng. Biotechnol. 2020, 8, 465. [Google Scholar] [CrossRef]
- Olborska, A.; Janas-Naze, A.; Kaczmarek, Ł.; Warga, T.; Halin, D.S.C. Antibacterial Effect of Graphene and Graphene Oxide as a Potential Material for Fiber Finishes. Autex Res. J. 2020, 20, 506–516. [Google Scholar] [CrossRef]
- Liu, S.; Wei, L.; Hao, L.; Fang, N.; Chang, M.W.; Xu, R.; Yang, Y.; Chen, Y. Sharper and Faster “Nano Darts” Kill More Bacteria: A Study of Antibacterial Activity of Individually Dispersed Pristine Single-Walled Carbon Nanotube. ACS Nano 2009, 3, 3891–3902. [Google Scholar] [CrossRef]
- Rodrigues, D.F.; Elimelech, M. Toxic Effects of Single-Walled Carbon Nanotubes in the Development of E. coli Biofilm. Environ. Sci. Technol. 2010, 44, 4583–4589. [Google Scholar] [CrossRef]
- Rocha, R.P.; Gonçalves, A.G.; Pastrana-Martínez, L.M.; Bordoni, B.C.; Soares, O.S.G.P.; Órfão, J.J.M.; Faria, J.L.; Figueiredo, J.L.; Silva, A.M.T.; Pereira, M.F.R. Nitrogen-doped graphene-based materials for advanced oxidation processes. Catal. Today 2015, 249, 192–198. [Google Scholar] [CrossRef]
- Soares, O.S.G.P.; Rocha, R.P.; Gonçalves, A.G.; Figueiredo, J.L.; Órfão, J.J.M.; Pereira, M.F.R. Easy method to prepare N-doped carbon nanotubes by ball milling. Carbon 2015, 91, 114–121. [Google Scholar] [CrossRef]
- Gomes, M.; Gomes, L.C.; Teixeira-Santos, R.; Pereira, M.F.R.; Soares, O.S.G.P.; Mergulhão, F.J. Optimizing CNT Loading in Antimicrobial Composites for Urinary Tract Application. Appl. Sci. 2021, 11, 4038. [Google Scholar] [CrossRef]
- Restivo, J.; Orge, C.A.; Guedes Gorito dos Santos, A.S.; Soares, O.S.G.P.; Pereira, M.F.R. Nanostructured Layers of Mechanically Processed Multiwalled Carbon Nanotubes for Catalytic Ozonation of Organic Pollutants. ACS Appl. Nano Mater. 2020, 3, 5271–5284. [Google Scholar] [CrossRef]
- Oliveira, I.M.; Gomes, M.; Gomes, L.C.; Pereira, M.F.R.; Soares, O.S.G.P.; Mergulhão, F.J. Performance of Graphene/Polydimethylsiloxane Surfaces against S. aureus and P. aeruginosa Single- and Dual-Species Biofilms. Nanomaterials 2022, 12, 355. [Google Scholar] [CrossRef] [PubMed]
- Belo, S.; Sousa-Cardoso, F.; Teixeira-Santos, R.; Gomes, L.C.; Vieira, R.; Sjollema, J.; Soares, O.S.G.P.; Mergulhão, F.J. Production and Characterization of Graphene Oxide Surfaces against Uropathogens. Coatings 2023, 13, 1324. [Google Scholar] [CrossRef]
- van Oss, C.J. Interfacial Forces in Aqueous Media; CRC Press: Boca Raton, FL, USA, 2006. [Google Scholar]
- Gedas, A.; Draszanowska, A.; Bakker, H.d.; Diez-Gonzalez, F.; Simões, M.; Olszewska, M.A. Prevention of surface colonization and anti-biofilm effect of selected phytochemicals against Listeria innocua strain. Colloids Surf. B 2023, 228, 113391. [Google Scholar] [CrossRef]
- Brooks, T.; Keevil, C.W. A simple artificial urine for the growth of urinary pathogens. Lett. Appl. Microbiol. 1997, 24, 203–206. [Google Scholar] [CrossRef]
- Heydorn, A.; Nielsen, A.T.; Hentzer, M.; Sternberg, C.; Givskov, M.; Ersbøll, B.K.; Molin, S. Quantification of biofilm structures by the novel computer program COMSTAT. Microbiology 2000, 146 Pt 10, 2395–2407. [Google Scholar] [CrossRef]
- Noites, R.; Pina-Vaz, C.; Rocha, R.; Carvalho, M.F.; Gonçalves, A.; Pina-Vaz, I. Synergistic Antimicrobial Action of Chlorhexidine and Ozone in Endodontic Treatment. Biomed Res. Int. 2014, 2014, 592423. [Google Scholar] [CrossRef]
- Kramer, B.; Muranyi, P. Effect of pulsed light on structural and physiological properties of Listeria innocua and Escherichia coli. J. Appl. Microbiol. 2014, 116, 596–611. [Google Scholar] [CrossRef]
- Rosenkranz, A.R.; Schmaldienst, S.; Stuhlmeier, K.M.; Chen, W.; Knapp, W.; Zlabinger, G.J. A microplate assay for the detection of oxidative products using 2′,7′-dichlorofluorescin-diacetate. J. Immunol. Methods 1992, 156, 39–45. [Google Scholar] [CrossRef] [PubMed]
- Sing, K. Reporting physisorption data for gas/solid systems with special reference to the determination of surface area and porosity (Recommendations 1984). Pure Appl. Chem. 1985, 57, 603. [Google Scholar] [CrossRef]
- Donohue, M.D.; Aranovich, G.L. Classification of Gibbs adsorption isotherms. Adv. Colloid Interface Sci. 1998, 76, 137–152. [Google Scholar] [CrossRef]
- León, V.; Quintana, M.; Herrero, M.A.; Fierro, J.L.G.; Hoz, A.d.l.; Prato, M.; Vázquez, E. Few-layer graphenes from ball-milling of graphite with melamine. Chem. Comm. 2011, 47, 10936–10938. [Google Scholar] [CrossRef]
- Zheng, S.; Bawazir, M.; Dhall, A.; Kim, H.E.; He, L.; Heo, J.; Hwang, G. Implication of Surface Properties, Bacterial Motility, and Hydrodynamic Conditions on Bacterial Surface Sensing and Their Initial Adhesion. Front. Bioeng. Biotechnol. 2021, 9, 643722. [Google Scholar] [CrossRef] [PubMed]
- Krsmanovic, M.; Biswas, D.; Ali, H.; Kumar, A.; Ghosh, R.; Dickerson, A.K. Hydrodynamics and surface properties influence biofilm proliferation. Adv. Colloid Interface Sci. 2021, 288, 102336. [Google Scholar] [CrossRef]
- Borges, I.; Henriques, P.C.; Gomes, R.N.; Pinto, A.M.; Pestana, M.; Magalhães, F.D.; Gonçalves, I.C. Exposure of Smaller and Oxidized Graphene on Polyurethane Surface Improves its Antimicrobial Performance. Nanomaterials 2020, 10, 349. [Google Scholar] [CrossRef]
- Oh, J.K.; Yegin, Y.; Yang, F.; Zhang, M.; Li, J.; Huang, S.; Verkhoturov, S.; Schweikert, E.A.; Perez-Lewis, K.; Scholar, E.A.; et al. The influence of surface chemistry on the kinetics and thermodynamics of bacterial adhesion. Sci. Rep. 2018, 8, 17247. [Google Scholar] [CrossRef]
- Harkes, G.; Feijen, J.; Dankert, J. Adhesion of Escherichia coli on to a series of poly(methacrylates) differing in charge and hydrophobicity. Biomaterials 1991, 12, 853–860. [Google Scholar] [CrossRef]
- Cerca, N.; Pier, G.B.; Vilanova, M.; Oliveira, R.; Azeredo, J. Quantitative analysis of adhesion and biofilm formation on hydrophilic and hydrophobic surfaces of clinical isolates of Staphylococcus epidermidis. Res. Microbiol. 2005, 156, 506–514. [Google Scholar] [CrossRef]
- Hwang, G.; Kang, S.; El-Din, M.G.; Liu, Y. Impact of conditioning films on the initial adhesion of Burkholderia cepacia. Colloids Surf. B 2012, 91, 181–188. [Google Scholar] [CrossRef] [PubMed]
- Ramstedt, M.; Ribeiro, I.A.C.; Bujdakova, H.; Mergulhão, F.J.M.; Jordao, L.; Thomsen, P.; Alm, M.; Burmølle, M.; Vladkova, T.; Can, F.; et al. Evaluating Efficacy of Antimicrobial and Antifouling Materials for Urinary Tract Medical Devices: Challenges and Recommendations. Macromol. Biosci. 2019, 19, e1800384. [Google Scholar] [CrossRef] [PubMed]
- Ghanim, R.; Mohammad, M.; Abdul Hussein, A. Antibacterial Activity and Morphological Characterization of Synthesis Graphene Oxide Nanosheets by Simplified Hummer’s Method. Biosci. Biotechnol. Res. Asia 2018, 15, 627–633. [Google Scholar] [CrossRef]
- Di Giulio, M.; Zappacosta, R.; Di Lodovico, S.; Di Campli, E.; Siani, G.; Fontana, A.; Cellini, L. Antimicrobial and Antibiofilm Efficacy of Graphene Oxide against Chronic Wound Microorganisms. Antimicrob. Agents Chemother. 2018, 62, 10–1128. [Google Scholar] [CrossRef] [PubMed]
- Al-Thani, R.F.; Patan, N.K.; Al-Maadeed, M.A. Graphene oxide as antimicrobial against two gram-positive and two gram-negative bacteria in addition to one fungus. OnLine J. Biol. Sci. 2014, 14, 230–239. [Google Scholar] [CrossRef]
- Zhang, G.; Meredith, T.C.; Kahne, D. On the Essentiality of Lipopolysaccharide to Gram-Negative Bacteria. Curr. Opin. Microbiol. 2013, 16, 779–785. [Google Scholar] [CrossRef]
- Sun, J.; Rutherford, S.T.; Silhavy, T.J.; Huang, K.C. Physical properties of the bacterial outer membrane. Nat. Rev. Microbiol. 2022, 20, 236–248. [Google Scholar] [CrossRef]
- Rojas, E.R.; Billings, G.; Odermatt, P.D.; Auer, G.K.; Zhu, L.; Miguel, A.; Chang, F.; Weibel, D.B.; Theriot, J.A.; Huang, K.C. The outer membrane is an essential load-bearing element in Gram-negative bacteria. Nature 2018, 559, 617–621. [Google Scholar] [CrossRef]
- Qiu, J.; Liu, L.; Qian, S.; Qian, W.; Liu, X. Why does nitrogen-doped graphene oxide lose the antibacterial activity? J. Mater. Sci. Technol. 2021, 62, 44–51. [Google Scholar] [CrossRef]
- Radhi, A.; Mohamad, D.; Abdul Rahman, F.S.; Abdullah, A.M.; Hasan, H. Mechanism and factors influence of graphene-based nanomaterials antimicrobial activities and application in dentistry. J. Mater. Res. Technol. 2021, 11, 1290–1307. [Google Scholar] [CrossRef]
- Akhavan, O.; Ghaderi, E.; Akhavan, A. Size-dependent genotoxicity of graphene nanoplatelets in human stem cells. Biomaterials 2012, 33, 8017–8025. [Google Scholar] [CrossRef] [PubMed]


| Sample | C | H | N | S | O |
|---|---|---|---|---|---|
| p-GNP | 90.80 ± 0.80 | 0.44 ± 0.01 | 0.03 ± 0.00 | 0.05 ± 0.03 | 5.60 ± 0.07 |
| N-GNP | 88.60 ± 0.20 | 0.58 ± 0.03 | 4.17 ± 0.02 | 0.02 ± 0.00 | 3.80 ± 0.12 |
| Property | Sample | |
|---|---|---|
| p-GNP | N-GNP | |
| SBET (m2 g−1) | 471 | 361 |
| Vmicro (cm3 g−1) | 0.052 | 0.073 |
| Smeso (m2 g−1) | 353 | 196 |
| VP (p/p0 = 0.99) (cm3 g−1) | 0.892 | 0.485 |
| Sample | Roughness (µm) | |
|---|---|---|
| Sa | Sq | |
| PDMS | 47.5 ± 8.4 | 75.3 ± 6.9 |
| 1 wt. % N-GNP/PDMS | 155.8 ± 33.2 | 236.1 ± 73.4 |
| Sample | Contact Angle (°) | Hydrophobicity (mJ m−2) | ||
|---|---|---|---|---|
| θW | θF | θB | ΔG | |
| PDMS | 114.3 ± 1.4 | 111.8 ± 1.6 | 88.3 ± 3.8 | −63.1 |
| 1 wt. % N-GNP/PDMS | 122.1 ± 0.6 * | 111.5 ± 1.7 | 64.7 ± 5.8 * | −81.1 |
Disclaimer/Publisher’s Note: The statements, opinions and data contained in all publications are solely those of the individual author(s) and contributor(s) and not of MDPI and/or the editor(s). MDPI and/or the editor(s) disclaim responsibility for any injury to people or property resulting from any ideas, methods, instructions or products referred to in the content. |
© 2023 by the authors. Licensee MDPI, Basel, Switzerland. This article is an open access article distributed under the terms and conditions of the Creative Commons Attribution (CC BY) license (https://creativecommons.org/licenses/by/4.0/).
Share and Cite
Teixeira-Santos, R.; Gomes, L.C.; Vieira, R.; Sousa-Cardoso, F.; Soares, O.S.G.P.; Mergulhão, F.J. Exploring Nitrogen-Functionalized Graphene Composites for Urinary Catheter Applications. Nanomaterials 2023, 13, 2604. https://doi.org/10.3390/nano13182604
Teixeira-Santos R, Gomes LC, Vieira R, Sousa-Cardoso F, Soares OSGP, Mergulhão FJ. Exploring Nitrogen-Functionalized Graphene Composites for Urinary Catheter Applications. Nanomaterials. 2023; 13(18):2604. https://doi.org/10.3390/nano13182604
Chicago/Turabian StyleTeixeira-Santos, Rita, Luciana C. Gomes, Rita Vieira, Francisca Sousa-Cardoso, Olívia S. G. P. Soares, and Filipe J. Mergulhão. 2023. "Exploring Nitrogen-Functionalized Graphene Composites for Urinary Catheter Applications" Nanomaterials 13, no. 18: 2604. https://doi.org/10.3390/nano13182604
APA StyleTeixeira-Santos, R., Gomes, L. C., Vieira, R., Sousa-Cardoso, F., Soares, O. S. G. P., & Mergulhão, F. J. (2023). Exploring Nitrogen-Functionalized Graphene Composites for Urinary Catheter Applications. Nanomaterials, 13(18), 2604. https://doi.org/10.3390/nano13182604