
Effect of Mechanical Vibration on the Durability of Proton Exchange Membrane Fuel Cells


Abstract
1. Introduction
2. Experimental Section
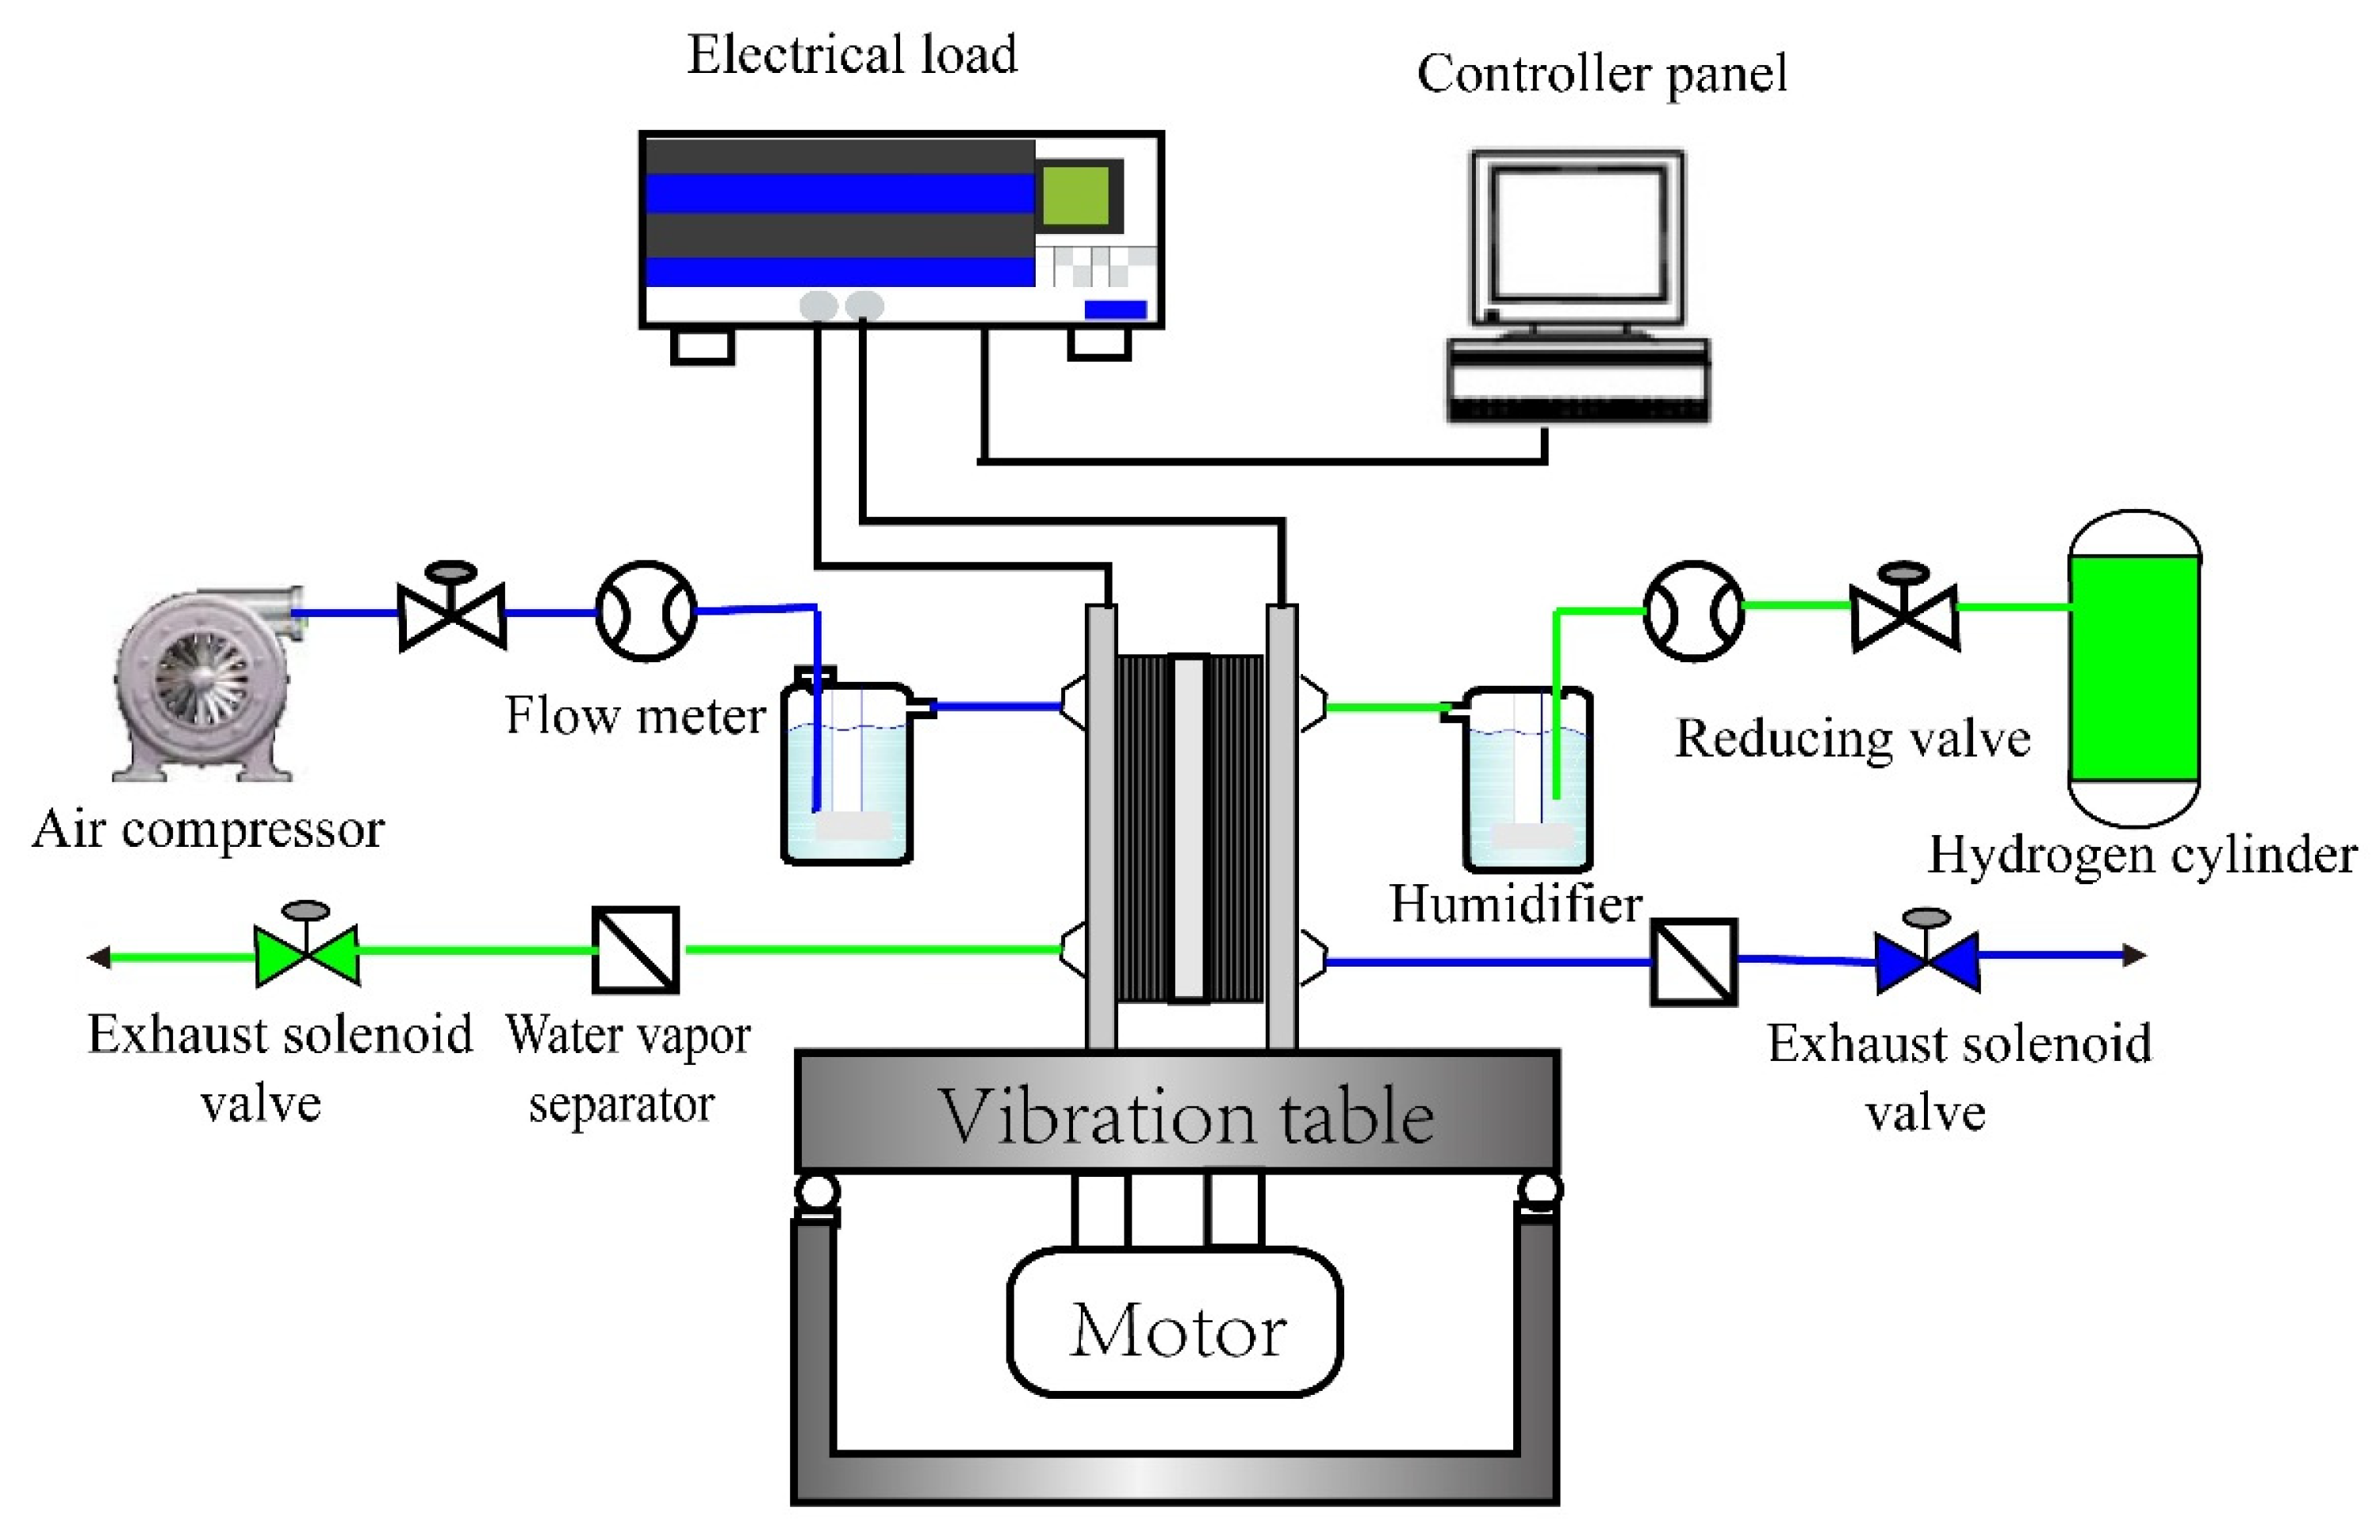
2.1. Experimental Setup
2.2. Test Procedure
2.3. Characterization of MEA
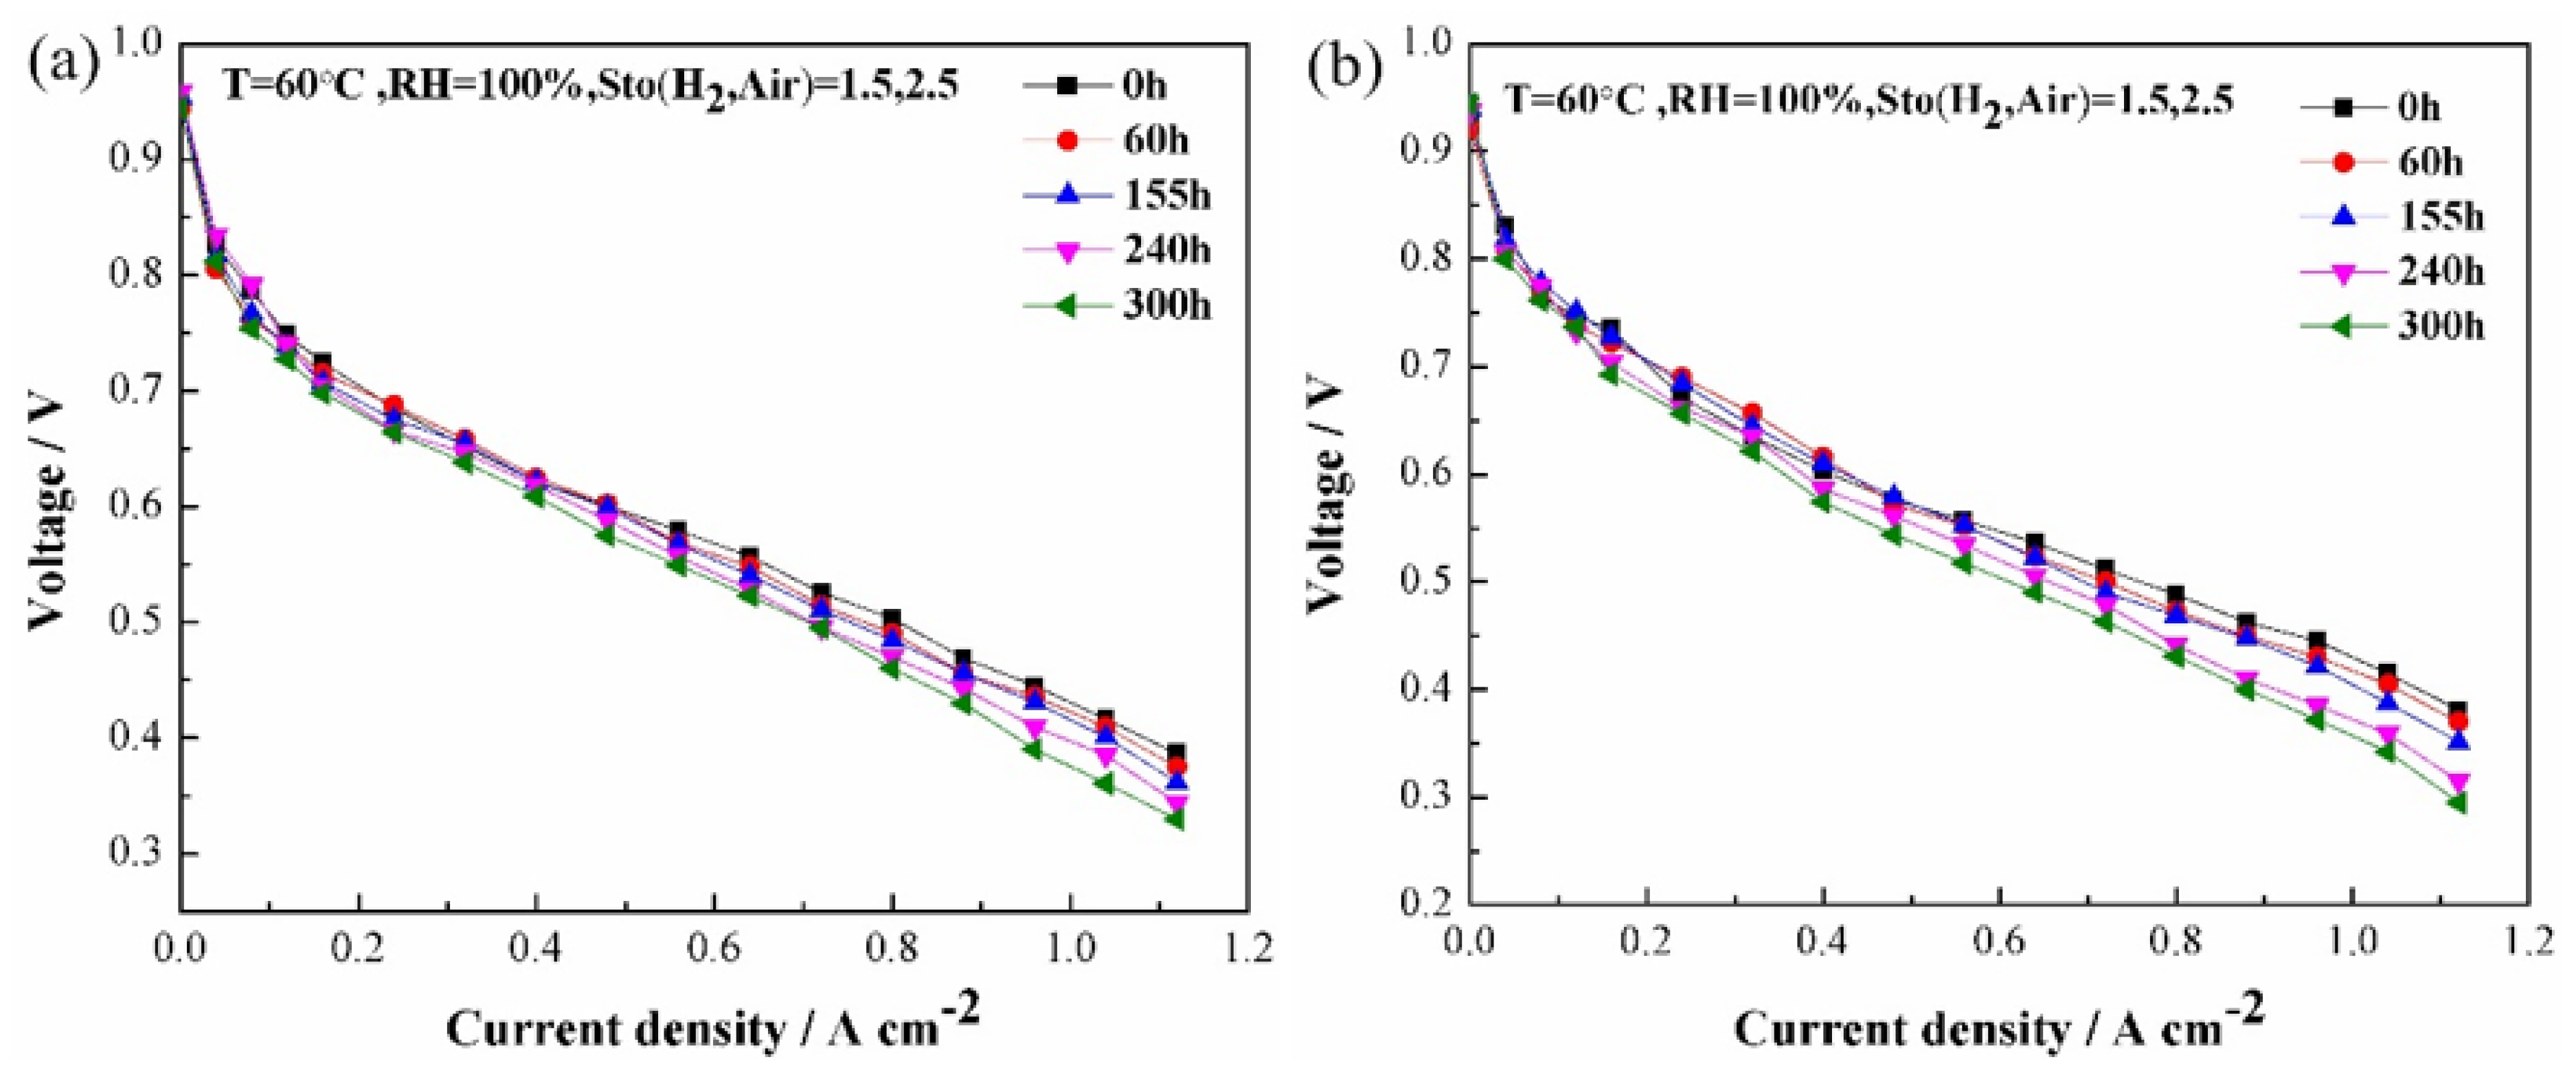
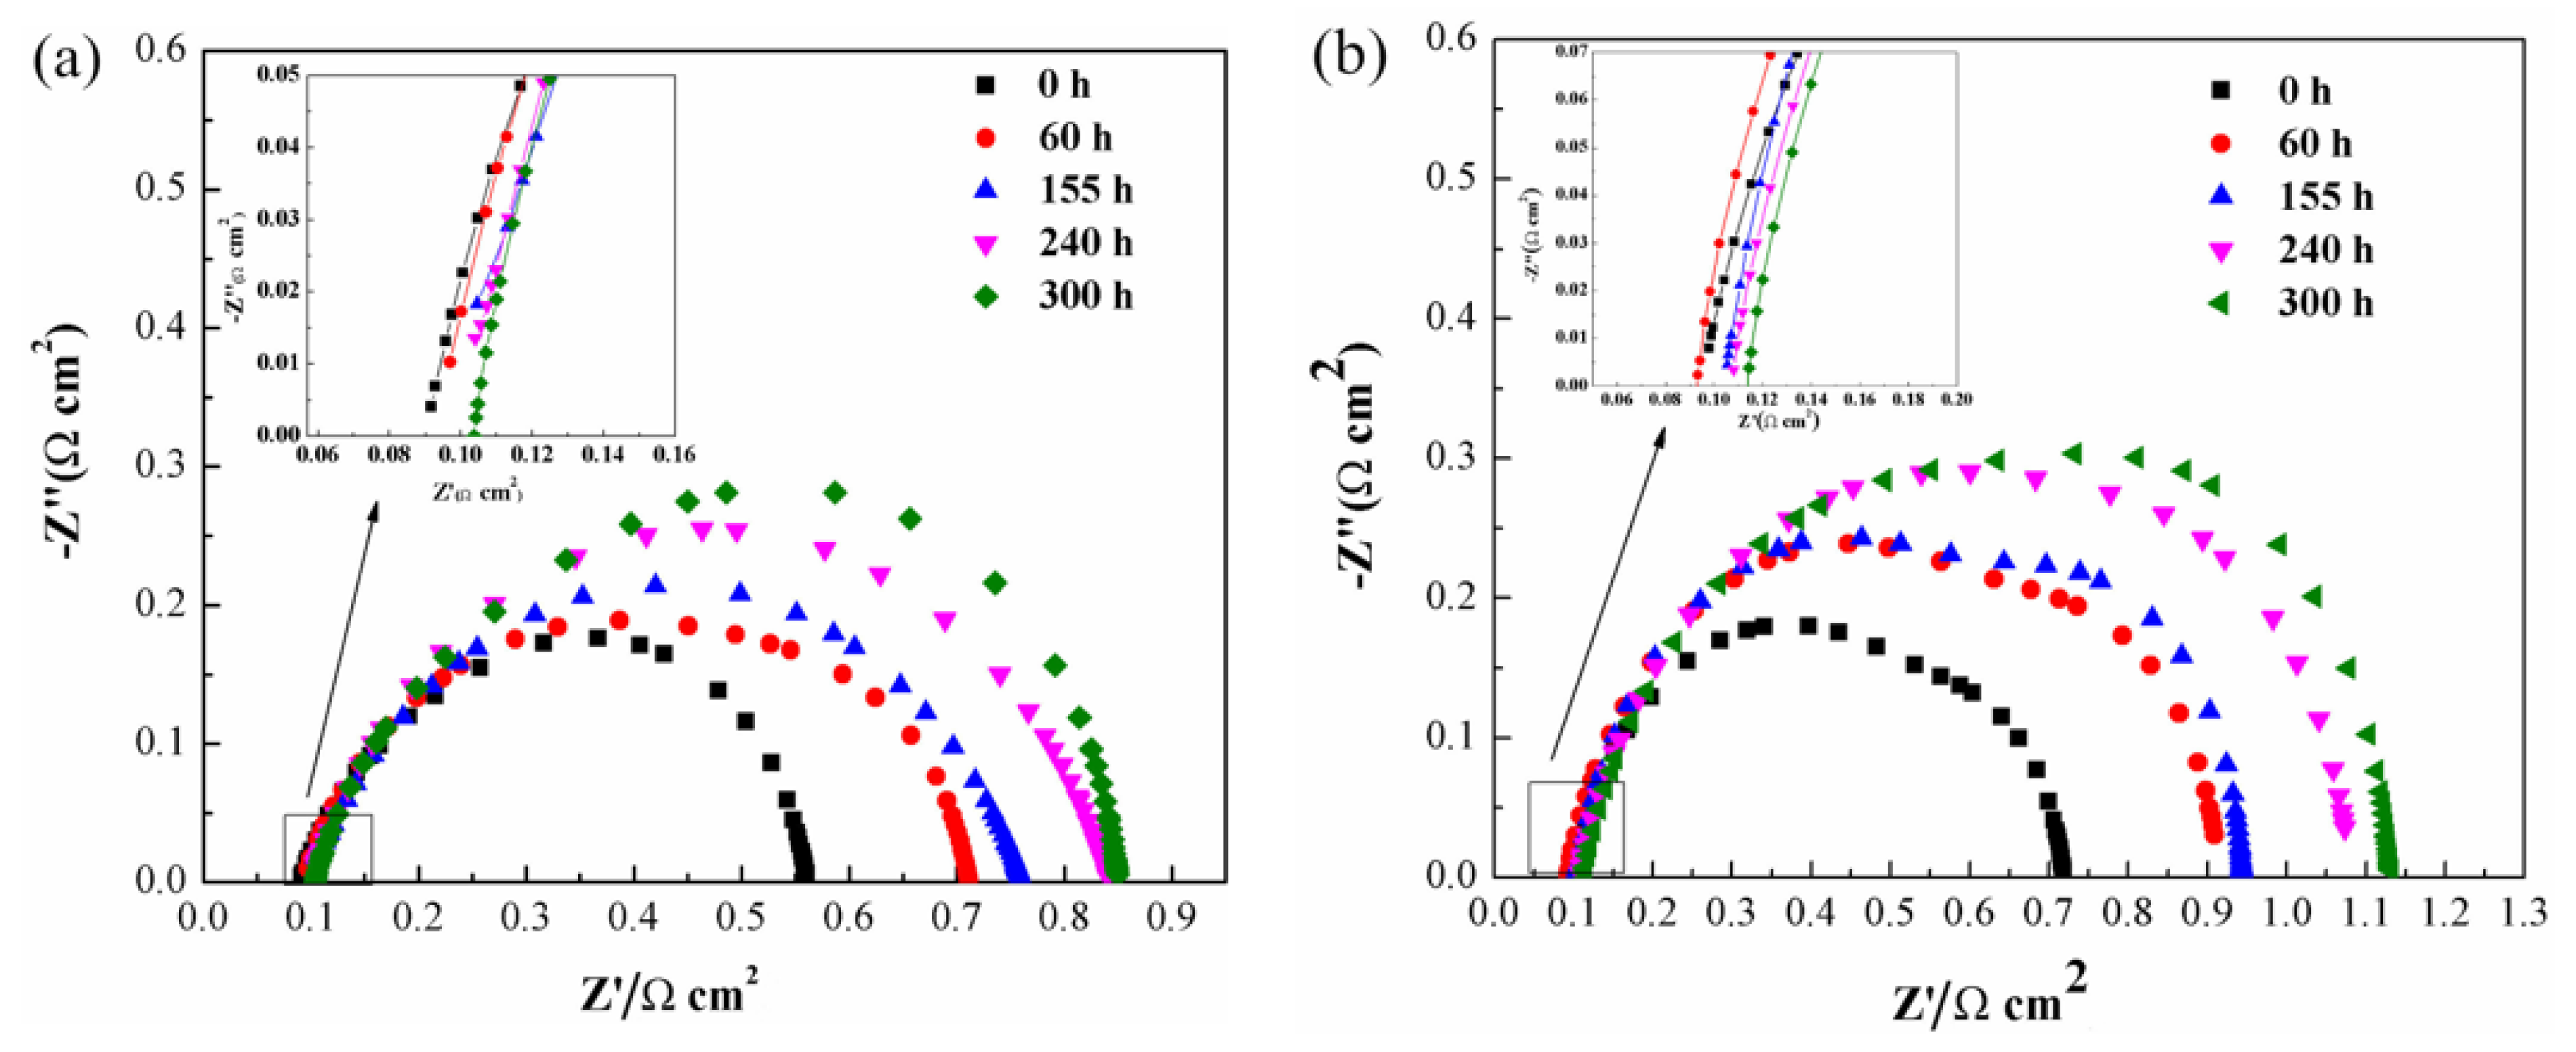
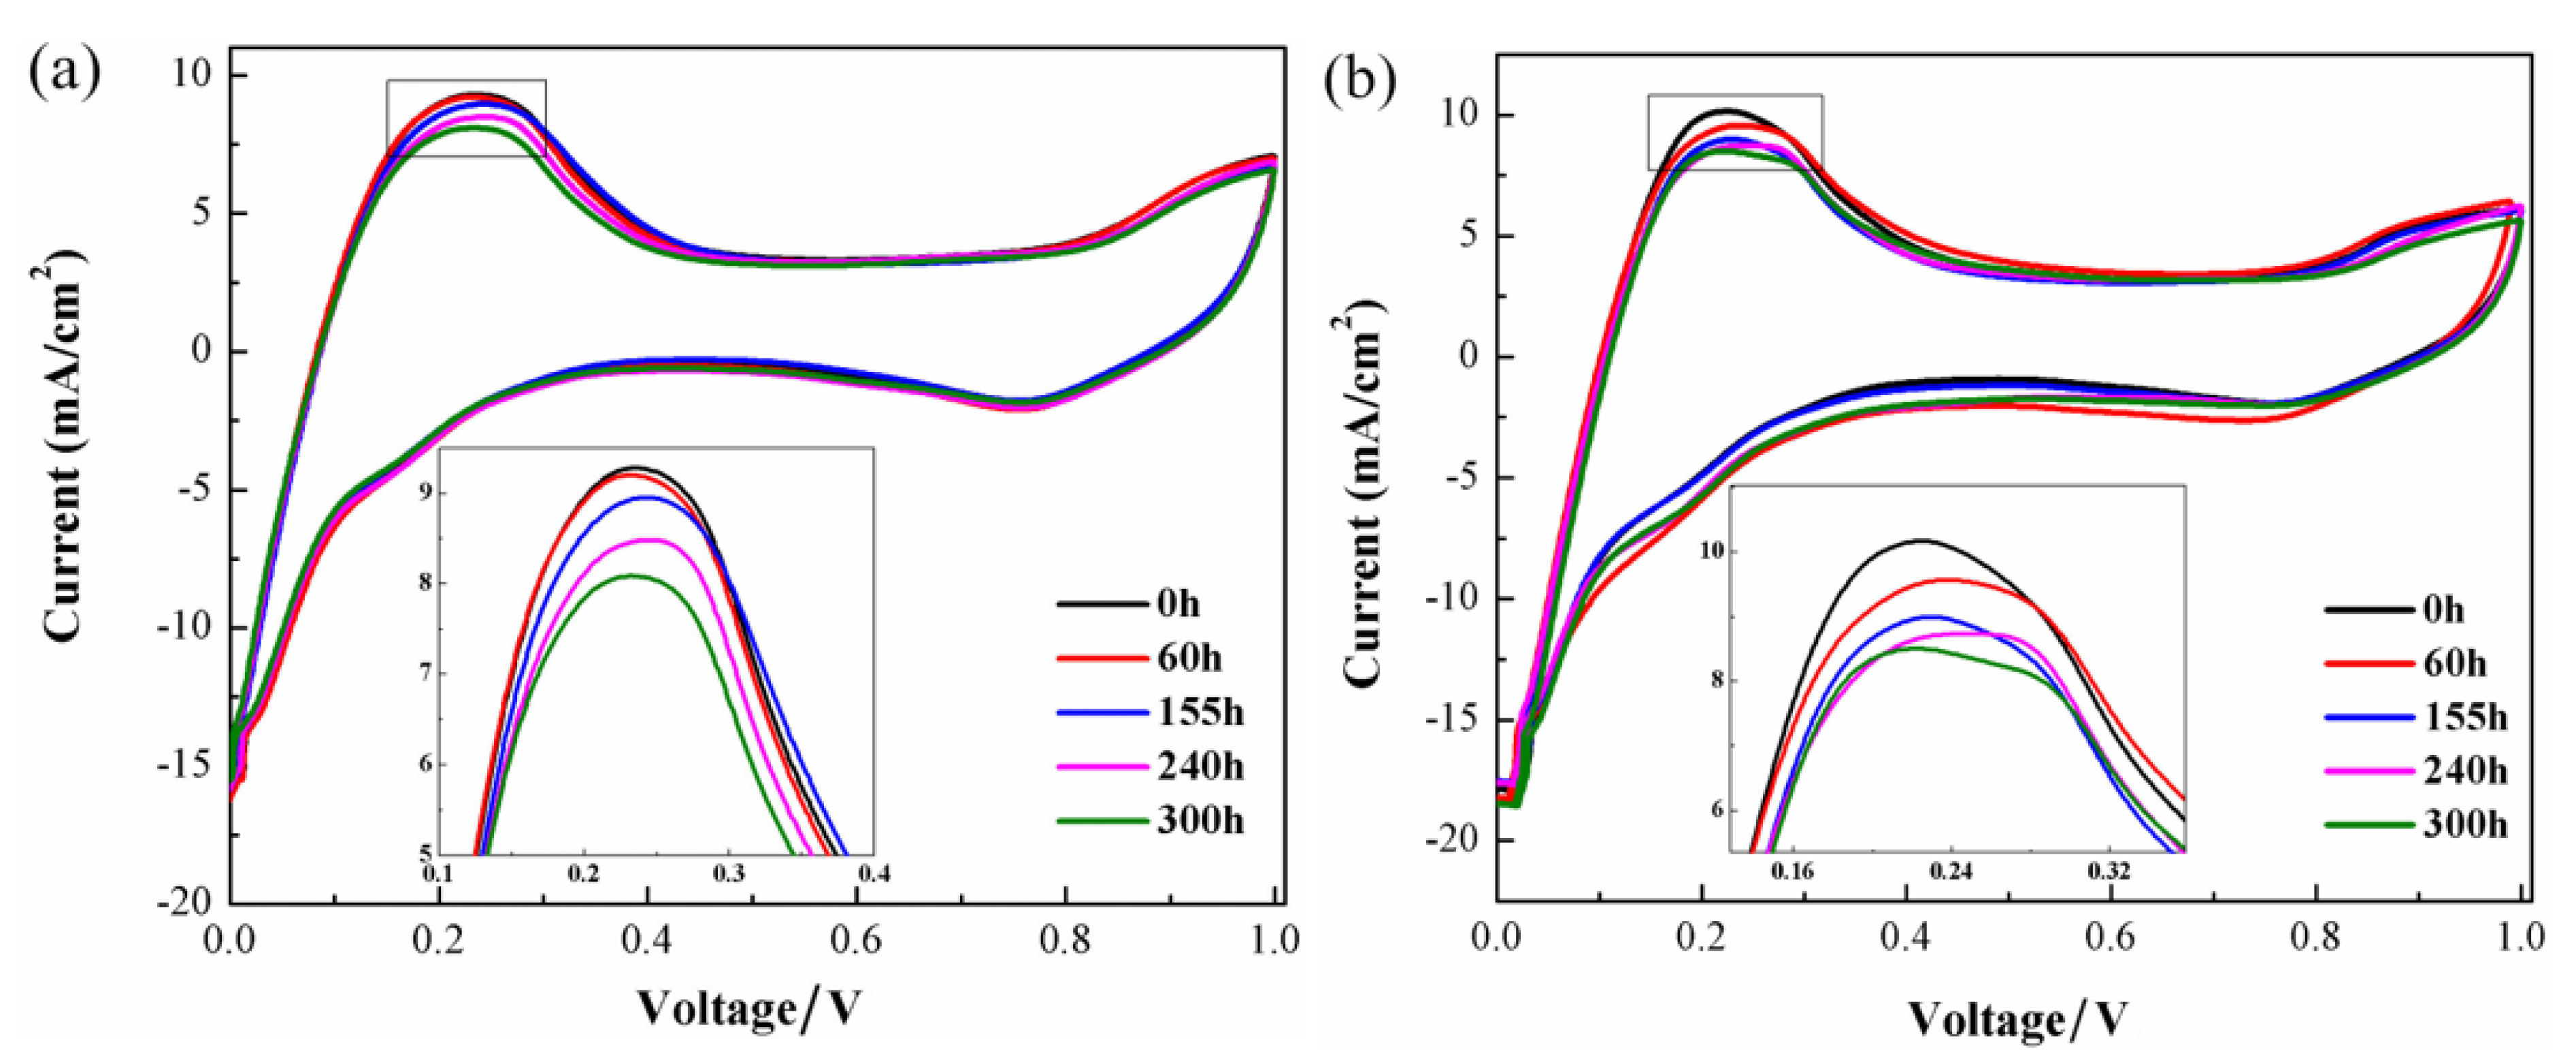
3. Results and Discussion
4. Conclusions
Author Contributions
Funding
Data Availability Statement
Conflicts of Interest
References
- Wang, X.; Ma, Y.; Gao, J.; Li, T.; Jiang, G.Z.; Sun, Z.Y. Review on water management methods for proton exchange membrane fuel cells. Int. J. Hydrogen Energy 2021, 46, 12206–12229. [Google Scholar] [CrossRef]
- Xu, J.M.; Zhang, C.Z.; Wan, Z.M.; Chen, X.; Chan, S.H.; Tu, Z.K. Progress and perspectives of integrated thermal management systems in PEM fuel cell vehicles: A review. Renew. Sust. Energ. Rev. 2022, 155, 111908.1–111908.23. [Google Scholar] [CrossRef]
- U.S. Department of Energy. Hydrogen and Fuel Cells Program Overview. Available online: http://www.eere.energy.gov/hydrogenandfuelcells/presentations.html (accessed on 20 December 2018).
- Zhao, Y.; Mao, Y.; Zhang, W.; Tang, Y.; Wang, P. Reviews on the effects of contaminations and research methodologies for PEMFC. Int. J. Hydrogen Energy 2020, 45, 23174–23200. [Google Scholar] [CrossRef]
- Cheng, X.; Shi, Z.; Glass, N.; Zhang, L.; Zhang, J.J.; Song, D. Poisoning of proton exchange membrane fuel cells by contaminants and impurities: Review of mechanisms, effects, and mitigation strategies. J. Power Sources 2019, 427, 21–48. [Google Scholar]
- Wang, P.; Li, L.J. Cold start optimization of the proton-exchange membrane fuel cell by penetrating holes in the cathode micro-diffusion layer. Int. J. Hydrogen Energy 2022, 47, 36650–36658. [Google Scholar] [CrossRef]
- Xie, X.; Zhang, G.; Zhou, J.; Jiao, K. Experimental and theoretical analysis of ionomer/carbon ratio effect on PEM fuel cell cold start operation. Int. J. Hydrogen Energy 2017, 42, 12521–12530. [Google Scholar] [CrossRef]
- Chen, S.T.; Wang, S.B.; Wang, X.K.; Zhu, T. Microencapsulated Phase Change Material Suspension for Cold Start of PEMFC. Materials 2021, 14, 1514. [Google Scholar] [CrossRef]
- Yang, X.K.; Sun, J.Q.; Sun, S.C.; Shao, Z.G. An efficient cold start strategy for proton exchange membrane fuel cell stacks. J. Power Sources 2022, 542, 231492–231503. [Google Scholar] [CrossRef]
- Cheng, S.; Hu, D.H.; Hao, D. Investigation and analysis of proton exchange membrane fuel cell dynamic response characteristics on hydrogen consumption of fuel cell vehicle. Int. J. Hydrogen Energy 2022, 47, 15845–15864. [Google Scholar] [CrossRef]
- Bajaj, A.; Liu, F.; Kulik, H.J. Uncovering Alternate Pathways to Nafion Membrane Degradation in Fuel Cells with First-Principles Modeling. J. Phys. Chem. C 2020, 124, 15094–15106. [Google Scholar] [CrossRef]
- Robert, M.; Kaddouri, A.E.; Perrin, J.C.; Raya, J.; Lottin, O. Time-resolved monitoring of composite Nafion (TM) XL membrane degradation induced by Fenton’s reaction. J. Membr. Sci. 2021, 621, 118977–118988. [Google Scholar] [CrossRef]
- Madhav, D.; Shao, C.Y.; Mus, J. The Effect of Salty Environments on the Degradation Behavior and Mechanical Properties of Nafion Membranes. Energies 2023, 16, 2256. [Google Scholar] [CrossRef]
- Fan, L.; Zhao, J.; Luo, X.; Tu, Z. Comparison of the performance and degradation mechanism of PEMFC with Pt/C and Pt black catalyst. Int. J. Hydrogen Energy 2022, 47, 5418–5428. [Google Scholar] [CrossRef]
- Ohyagi, S.; Matsuda, T.; Iseki, Y.; Sasaki, T.; Kaito, C. Effects of operating conditions on durability of polymer electrolyte membrane fuel cell Pt cathode catalyst layer. J. Power Sources 2011, 196, 3743–3749. [Google Scholar] [CrossRef]
- Kang, M.S.; Sim, J.; Min, K.Y.D. Analysis of surface and interior degradation of gas diffusion layer with accelerated stress tests for polymer electrolyte membrane fuel cell. Int. J. Hydrogen Energy 2022, 47, 29467–29480. [Google Scholar] [CrossRef]
- Li, B.; Wan, K.C.; Xie, M.; Chu, T.K.; Zhang, C.M. Durability degradation mechanism and consistency analysis for proton exchange membrane fuel cell stack. Appl. Energy 2022, 314, 119020–119031. [Google Scholar] [CrossRef]
- Liu, H.; George, M.G.; Ge, N.; Muirhead, D. Microporous Layer Degradation in Polymer Electrolyte Membrane Fuel Cells. J. Electrochem. Soc. 2018, 165, 3271–3279. [Google Scholar] [CrossRef]
- Liu, H.; George, M.G.; Zeis, R.; Messerschmidt, M. The Impacts of Microporous Layer Degradation on Liquid Water Distributions in Polymer Electrolyte Membrane Fuel Cells Using Synchrotron Imaging. ECS Trans. 2017, 80, 155–164. [Google Scholar] [CrossRef]
- Imen, S.J.; Shakeri, M. Reliability Evaluation of an Open-Cathode PEMFC at Operating State and Longtime Vibration by Mechanical Loads. Fuel Cells 2016, 16, 126–134. [Google Scholar] [CrossRef]
- Rajalakshmi, N.; Pandian, S.; Dhathathreyan, K.S. Vibration tests on a PEM fuel cell stack usable in transportation application. Int. J. Hydrogen Energy 2009, 34, 3833–3837. [Google Scholar] [CrossRef]
- Hou, Y.P.; Hao, D.; Shen, J.P.; Li, P.; Zhang, T.; Wang, H. Effect of strengthened road vibration on performance degradation of PEM fuel cell stack. Int. J. Hydrogen Energy 2016, 41, 5123–5134. [Google Scholar] [CrossRef]
- Wu, C.W.; Liu, B.; Wei, M.Y.; Zhang, W. Mechanical response of a large fuel cell stack to impact: A numerical analysis. Fuel Cells 2015, 15, 344–351. [Google Scholar] [CrossRef]
- Wang, X.K.; Wang, S.B.; Chen, S.T.; Zhu, T. Dynamic response of proton exchange membrane fuel cell under mechanical vibration. Int. J. Hydrogen Energy 2016, 41, 16287–16295. [Google Scholar] [CrossRef]
- Diloyan, G.; Sobel, M.; Das, K.; Hutapea, P. Effect of mechanical vibration on platinum particle agglomeration and growth in Polymer Electrolyte Membrane Fuel Cell catalyst layers. J. Power Sources 2012, 214, 59–67. [Google Scholar] [CrossRef]
- Yildirim, S.; Erkaya, S.; Eski, I.; Uzmay, I. Noise and Vibration Analysis of Car Engines using Proposed Neural Network. J. Vib. Control 2009, 15, 133–156. [Google Scholar] [CrossRef]
- Hou, Y.; Zhou, B.; Zhou, W.; Shen, C.; He, Y. An investigation of characteristic parameter variations of the polarization curve of a proton exchange membrane fuel cell stack under strengthened road vibrating conditions. Int. J. Hydrogen Energy 2012, 37, 11887–11893. [Google Scholar] [CrossRef]
- Hou, J.B.; Yu, H.M.; Zhang, S.S.; Sun, S.C.; Wang, H.W.; Yi, B.L.; Ming, P.W. Analysis of PEMFC freeze degradation at −20°C after gas purging. J. Power Sources 2006, 162, 513–520. [Google Scholar] [CrossRef]
- Ralph, T.R.; Hards, G.A.; Keating, J.E.; Campbell, S.A.; Wilkinson, D.P. ChemInform Abstract: Low Cost Electrodes for Proton Exchange Membrane Fuel Cells Performance in Single Cells and Ballard Stacks. J. Electrochem. Soc. 1998, 144, 3845–3857. [Google Scholar] [CrossRef]
- Radmilovic, V.; Gasteiger, H.A.; Ross, P.N. Structure and Chemical Composition of a Supported Pt-Ru Electrocatalyst for Methanol Oxidation. J. Catal. 1995, 154, 98–106. [Google Scholar] [CrossRef]
- Zhai, Y.F.; Zhang, H.M.; Xing, D.M.; Shao, Z.G. The stability of Pt/C catalyst in H3PO4/PBI PEMFC during high temperature life test. J. Power Sources 2007, 164, 126–133. [Google Scholar] [CrossRef]
- Akita, T.; Taniguchi, A.; Maekawa, J.; Sirorna, Z.; Tanaka, K.; Kohyama, M. Analytical TEM study of Pt particle deposition in the proton-exchange membrane of a membrane-electrode-assembly. J. Power Sources 2006, 159, 461–467. [Google Scholar] [CrossRef]
- Shao, Y.Y.; Yin, G.P.; Gao, Y.Z. Understanding and approaches for the durability issues of Pt-based catalysts for PEM fuel cell. J. Power Sources 2007, 171, 558–566. [Google Scholar] [CrossRef]
- Ettingshausen, F.; Kleemann, J.; Marcu, A.; Toth, G.; Fuess, H.; Roth, C. Dissolution and Migration of Platinum in PEMFCs Investigated for Start/Stop Cycling and High Potential Degradation. Fuel Cells 2011, 11, 238–245. [Google Scholar] [CrossRef]


| Test Conditions | |
|---|---|
| Fuel/Oxidant | Hydrogen/Air |
| Constant current density | 400 mA/cm2 |
| PEMFC temperature | 65 °C |
| Anode/Cathode humidity | 100%/100% |
| Anode/Cathode stoic | 1.5/2.5 |
| Test length | 300 h |
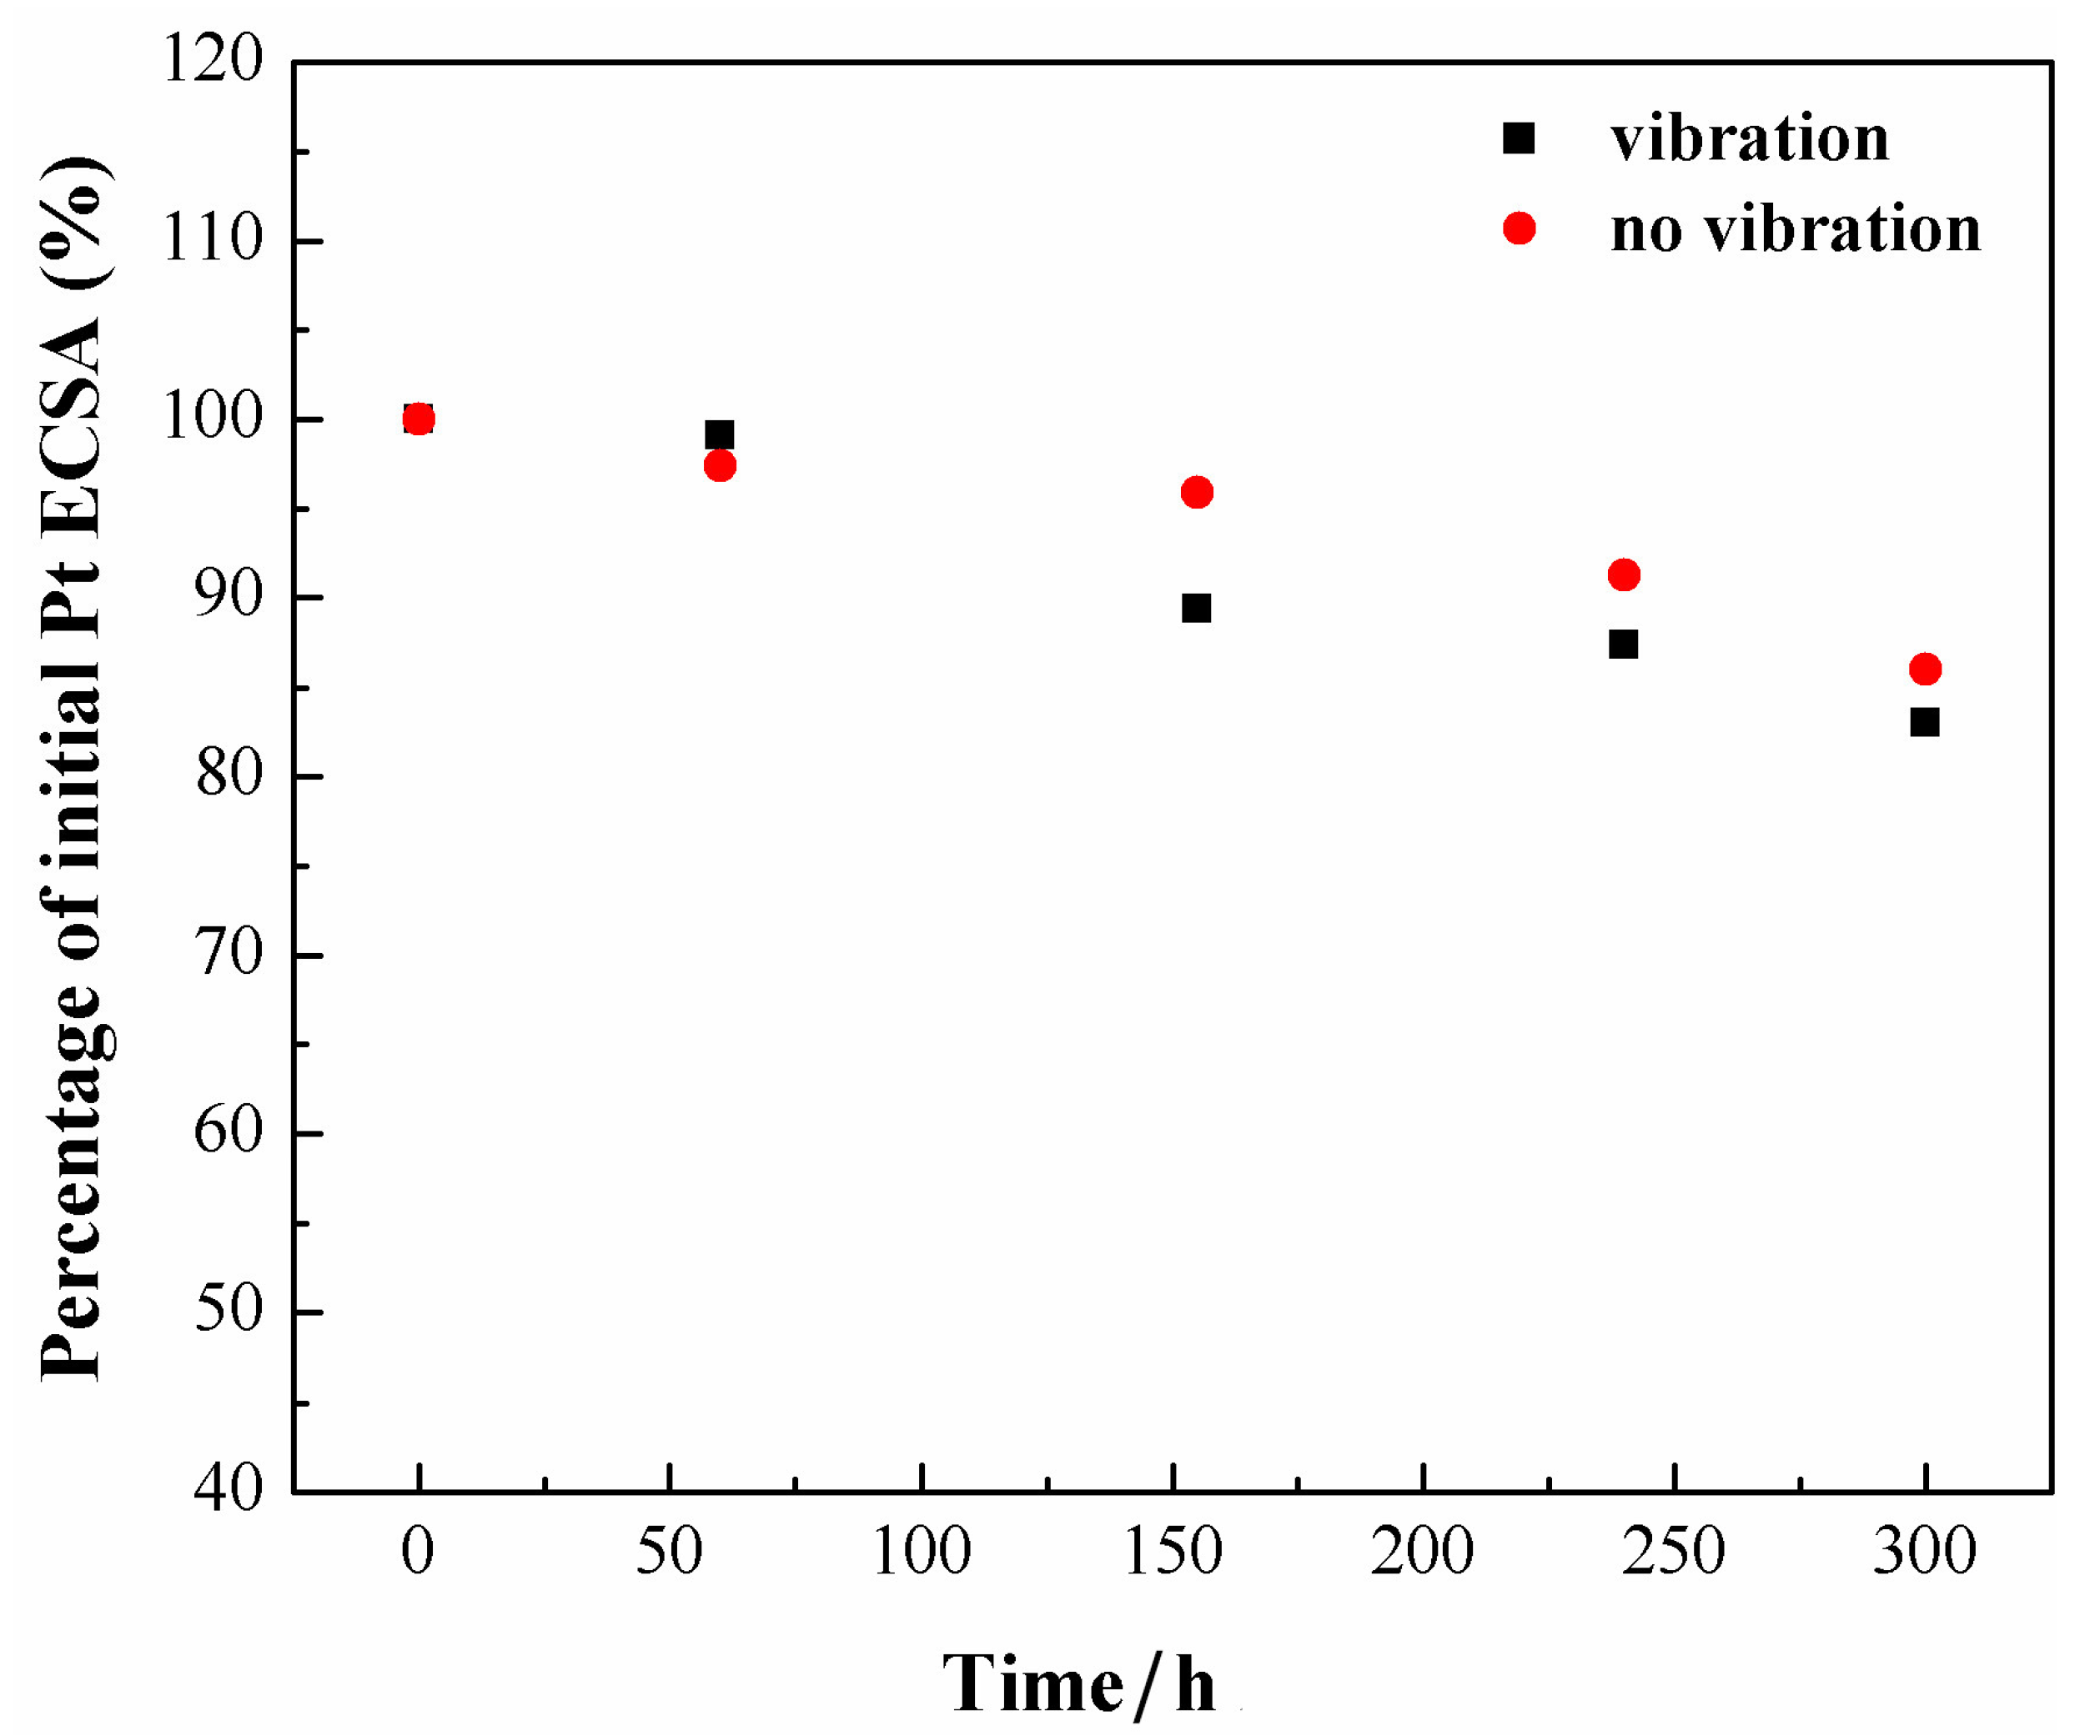
| Operating Time | Under Vibration | Under No Vibration | ||
|---|---|---|---|---|
| Peak Area (mC cm−2) | ECSA (m2 g−1) | Peak Area (mC cm−2) | ECSA (m2 g−1) | |
| 0 h | 60.6 | 60.1 | 58 | 57.5 |
| 60 h | 60.2 | 59.7 | 56.4 | 55.9 |
| 155 h | 54.4 | 53.9 | 55.6 | 55.1 |
| 240 h | 52 | 51.5 | 52.6 | 52.1 |
| 300 h | 50 | 49.6 | 50.4 | 50 |
Disclaimer/Publisher’s Note: The statements, opinions and data contained in all publications are solely those of the individual author(s) and contributor(s) and not of MDPI and/or the editor(s). MDPI and/or the editor(s) disclaim responsibility for any injury to people or property resulting from any ideas, methods, instructions or products referred to in the content. |
© 2023 by the authors. Licensee MDPI, Basel, Switzerland. This article is an open access article distributed under the terms and conditions of the Creative Commons Attribution (CC BY) license (https://creativecommons.org/licenses/by/4.0/).
Share and Cite
Chen, S.; Wang, X.; Zhu, T. Effect of Mechanical Vibration on the Durability of Proton Exchange Membrane Fuel Cells. Nanomaterials 2023, 13, 2191. https://doi.org/10.3390/nano13152191
Chen S, Wang X, Zhu T. Effect of Mechanical Vibration on the Durability of Proton Exchange Membrane Fuel Cells. Nanomaterials. 2023; 13(15):2191. https://doi.org/10.3390/nano13152191
Chicago/Turabian StyleChen, Sitong, Xueke Wang, and Tong Zhu. 2023. "Effect of Mechanical Vibration on the Durability of Proton Exchange Membrane Fuel Cells" Nanomaterials 13, no. 15: 2191. https://doi.org/10.3390/nano13152191
APA StyleChen, S., Wang, X., & Zhu, T. (2023). Effect of Mechanical Vibration on the Durability of Proton Exchange Membrane Fuel Cells. Nanomaterials, 13(15), 2191. https://doi.org/10.3390/nano13152191