Article

Controllable Doping Characteristics for WSxSey Monolayers Based on the Tunable S/Se Ratio

1
Graduate Institute of Electro-Optical Engineering, Department of Electronic and Computer Engineering, National Taiwan University of Science and Technology, Taipei 106335, Taiwan
2
Bachelor Program in Industrial Technology, National Yunlin University of Science and Technology, Douliu 64002, Yunlin, Taiwan
3
Department of Electronic Engineering, National Yunlin University of Science and Technology, Douliu 64002, Yunlin, Taiwan
4
Graduate School of Materials Science, National Yunlin University of Science and Technology, Douliu 64002, Yunlin, Taiwan
*
Author to whom correspondence should be addressed.
These authors contributed equally to this work.
Nanomaterials 2023, 13(14), 2107; https://doi.org/10.3390/nano13142107
Submission received: 16 June 2023 / Revised: 10 July 2023 / Accepted: 13 July 2023 / Published: 19 July 2023
(This article belongs to the Special Issue 2D Semiconductor Nanomaterials and Heterostructures)

Abstract

:
Transition metal dichalcogenides (TMDs) have attracted much attention because of their unique characteristics and potential applications in electronic devices. Recent reports have successfully demonstrated the growth of 2-dimensional MoSxSey, MoxWyS2, MoxWySe2, and WSxSey monolayers that exhibit tunable band gap energies. However, few works have examined the doping behavior of those 2D monolayers. This study synthesizes WSxSey monolayers using the CVD process, in which different heating temperatures are applied to sulfur powders to control the ratio of S to Se in WSxSey. Increasing the Se component in WSxSey monolayers produced an apparent electronic state transformation from p-type to n-type, recorded through energy band diagrams. Simultaneously, p-type characteristics gradually became clear as the S component was enhanced in WSxSey monolayers. In addition, Raman spectra showed a red shift of the WS2-related peaks, indicating n-doping behavior in the WSxSey monolayers. In contrast, with the increase of the sulfur component, the blue shift of the WSe2-related peaks in the Raman spectra involved the p-doping behavior of WSxSey monolayers. In addition, the optical band gap of the as-grown WSxSey monolayers from 1.97 eV to 1.61 eV is precisely tunable via the different chalcogenide heating temperatures. The results regarding the doping characteristics of WSxSey monolayers provide more options in electronic and optical design.

1. Introduction

Transition metal dichalcogenides (TMDs) have recently attracted considerable research attention due to their atomic monolayer structure, moderate carrier mobility [1,2], direct band gap [3,4,5], outstanding flexibility [6], and excellent optical properties [7,8]. These unique characteristics allow them to serve as flexible field effect transistors (FETs) [9,10,11,12], photovoltaic cells [13,14], light-emitting diodes [15,16], photodetectors [17], and catalysts [18,19,20]. In particular, TMD monolayers have shown up to 5–10% sunlight absorption ability [13], more than 2200 A/W photoresponsivity [21], and pronounced threshold behavior in electroluminescence [17], making them well suited for applications in optoelectronic devices. Optoelectronic performance, in areas such as efficiency and optical responsivity, is extremely dependent on the optical band gap of the semiconductor TMD materials. Therefore, a technology is urgently needed to control the optical band gap of TMD monolayers. Early strain engineering [22,23,24,25] and stacking of various TMD monolayers [26,27] have successfully modified the optical band gap to a limited degree. Recently, a 2H phase MoS2 monolayer was modified by 1T phase MoS2 quantum dot arrays through electron beam irradiation, displaying tunable band gap characteristics [28]. The synthesis technology for 2D TMD alloys is also an important engineering area for studying their band gap and tuning doping characteristics and structures. The selenization/sulfurization of as-grown MoS2/MoSe2 monolayers using selenium/sulfur to replace the original chalcogenide elements was proposed to form MoSxSey alloys [29]. Note that the selenization/sulfurization process makes it difficult to modulate the band gap at the assigned emission position. Although MoxWyS2 and MoxWySe2 alloys have been acquired via mechanical exfoliation from bulk crystals [30,31,32], the flake structures would inhibit their development in future applications. Recently, a series of 2D TMD alloys (e.g., MoSxSey, MoxWyS2, MoxWySe2, and WSxSey) has been prepared by CVD, with tunable band gap energies controlled via chemical compositions [33,34,35,36,37,38,39,40,41]. However, most of the studies in TMD alloys were focused on fabrication, optical analysis, TEM investigation, electricity, band gap energies, and theoretical exploration. Few studies in the literature have discussed the transition of electronic properties via the changes in the concentration of transition metals/chalcogenides. Even energy band diagrams as a function of transition metal/chalcogenide concentration in TMD alloys are not explored via ultraviolet photoemission spectroscopy (UPS). Duan et al. used this approach to directly prepare WS2xSe2−2x monolayers by using different ratios of WS2 and WSe2 powders mixed together in the CVD process [34]. In addition, increasing the S element in WS2xSe2−2x monolayers resulted in the transition of electronic properties from p-type WSe2 to n-type WS2 by back-gated field effect transistors. However, the calculations of density functional theory claim that WS2 was p-type and would be transformed into n-type WSxSey when enough Se element was added to the WSxSey [42]. These inconsistent conclusions point to the urgent need to systematically explore the doping behaviors of these 2D monolayers.
In this study, we report the synthesis of WSxSey monolayers using tungsten oxides, selenium, and sulfur powders as the sources for the CVD process, in which different heating temperatures are applied to sulfur powders for S/Se ratio modulation. The optical band gap of the as-grown WSxSey monolayers from 1.97 eV (WS2) to 1.61 eV (WSe2) was precisely controlled through the tunable S/Se ratio. The red shift of the WS2-related peaks in Raman spectra involved n-doping behavior in WSxSey monolayers, whereas the blue shift of the WSe2-related peaks indicated p-doping characteristics. The electronic state transformation of WSxSey monolayers could be tuned from p-type WS2 toward n-type WSe2 by systematically controlling the S/Se ratio as recorded through UPS measurements. The reported observations of the doping characteristics in these WSxSey monolayers have implications for electronic and optical design [17,43,44,45].

2. Experimental Section

2.1. Synthesis of Monolayer WS2 and WSe2

Crystal WS2 and WSe2 triangles were synthesized by modifying the processes described in our previous work. In brief, the WO3 powders (0.3 g; Sigma-Aldrich, New Taipei City, Taiwan, 99.5%) were placed in a quartz boat located in the heating zone center of the furnace. The S powders (Sigma-Aldrich, 99.5%) were placed in a separate quartz boat on the upper stream side. The sapphire substrates for growing WS2 were located downstream close to the WO3 powders. The central heating zone was first heated to 500 °C at 10 °C/min with an Ar/H2 flowing gas (Ar = 70 sccm, H2 = 5 sccm, chamber pressure = 5 Torr) and kept for 20 min. The furnace was then heated to 925 °C at a ramping rate of 25 °C/min and kept for 15 min. The sulfur was heated separately by a heating belt to 160 °C when the furnace reached 650 °C. After growth, the furnace was slowly cooled to room temperature. For WSe2 growth, the Se powders (Sigma-Aldrich, 99.5%) were substituted for S powders as the source of the Se element, and the same growth process was followed, except for the heating belt being heated to 270 °C during growth.

2.2. Synthesis of Monolayer WSxSey Alloys

To synthesize WSxSey, the sulfur and selenium powders were separately but simultaneously placed in two quartz boats on the upper stream side. During WSxSey alloy growth, the selenium powders were continuously heated to 260 °C by a heating belt and, for the various proportion of ingredients, the heating temperature of the sulfur powders was increased from 80 °C, 90 °C, 100 °C, and 110 °C to 120 °C. The location of the WO3 powders (0.3 g) and the growth procedure are identical to the conditions previously described. After growth, the furnace was allowed to cool to room temperature.

2.3. Characterizations

Raman spectra were collected with an NT-MDT confocal Raman microscopic system (laser wavelength 473 nm and laser spot size ~0.5 μm). The Si peak at 520 cm−1 was used as a reference for wavenumber calibration. The atomic force microscope (AFM) images were performed using a Veeco Dimension Icon system. The photoluminescence (PL) and differential reflectance spectra were measured with a homemade microscopy system. For PL measurements, a 532 nm solid-state laser was focused to a spot size < 1 μm on the sample by an objective lens (×100; N.A. = 0.9). The PL signals were collected through the same objective lens, analyzed by a 0.75 m monochromator, and detected by a liquid-nitrogen-cooled charge-coupled device (CCD) camera. The apparatus for differential reflectance measurements was basically the same, except that the light source was replaced by a fiber-coupled tungsten–halogen lamp. Chemical configurations were determined by X-ray photoelectron spectroscope (XPS, Phi V5000, Kanagawa, Japan). XPS measurements of the samples were performed with an Mg Kα X-ray source. The energy calibrations were made against the C 1 s peak to eliminate sample charging during analysis.

3. Results and Discussion

3.1. WSxSey Monolayer Fabrication

The growth of crystalline WS2 and WSe2 monolayers has been reported in our previous studies. Briefly, the triangular WS2 and WSe2 flakes are fabricated through the vapor phase reaction of WO3 with S and Se powders, respectively; similar methods have been demonstrated by many other groups [46,47,48]. The experimental set-up for as-deposited WSxSey monolayers in a hot-wall furnace is illustrated in Figure 1a. To synthesize the WSxSey monolayers, S and Se powders were introduced simultaneously into the furnace during the growth process. Moreover, the Se powder was maintained at 260 °C, while the S powder was heated incrementally from 80, 90, 100, and 110 to 120 °C to modulate the S/Se ratio, labeled as Ts = 80 °C, Ts = 90 °C, Ts = 100 °C, Ts = 110 °C, and Ts = 120 °C. Figure 1c–e show the optical micrographs (OM) of the WSxSey monolayers on sapphire substrates, which are at different locations far from the WO3 precursor. First, Figure 1c shows sparsely isolated triangular flakes at the farthest place from the WO3 precursor, indicating that the nucleation density and the precursor density are low. Close to the WO3 precursor, small isolated triangles grew generally and then merged together with a lateral size of ~50 µm, shown in Figure 1d. Finally, due to the enlarged number of precursors, the WSxSey domains closest to the WO3 precursor merged together and formed a continuous complete film. Some bilayer flakes are still observed on the top of the continuous monolayer film, which is attributed to the nucleation assisted by the grain boundary or particles, as shown in Figure 1e. In addition, according to the cross-sectional height of ~0.85 nm, inspected by atomic force microscope (AFM) in Figure 1b, the monolayer structure of the WSxSey flake was confirmed [30].
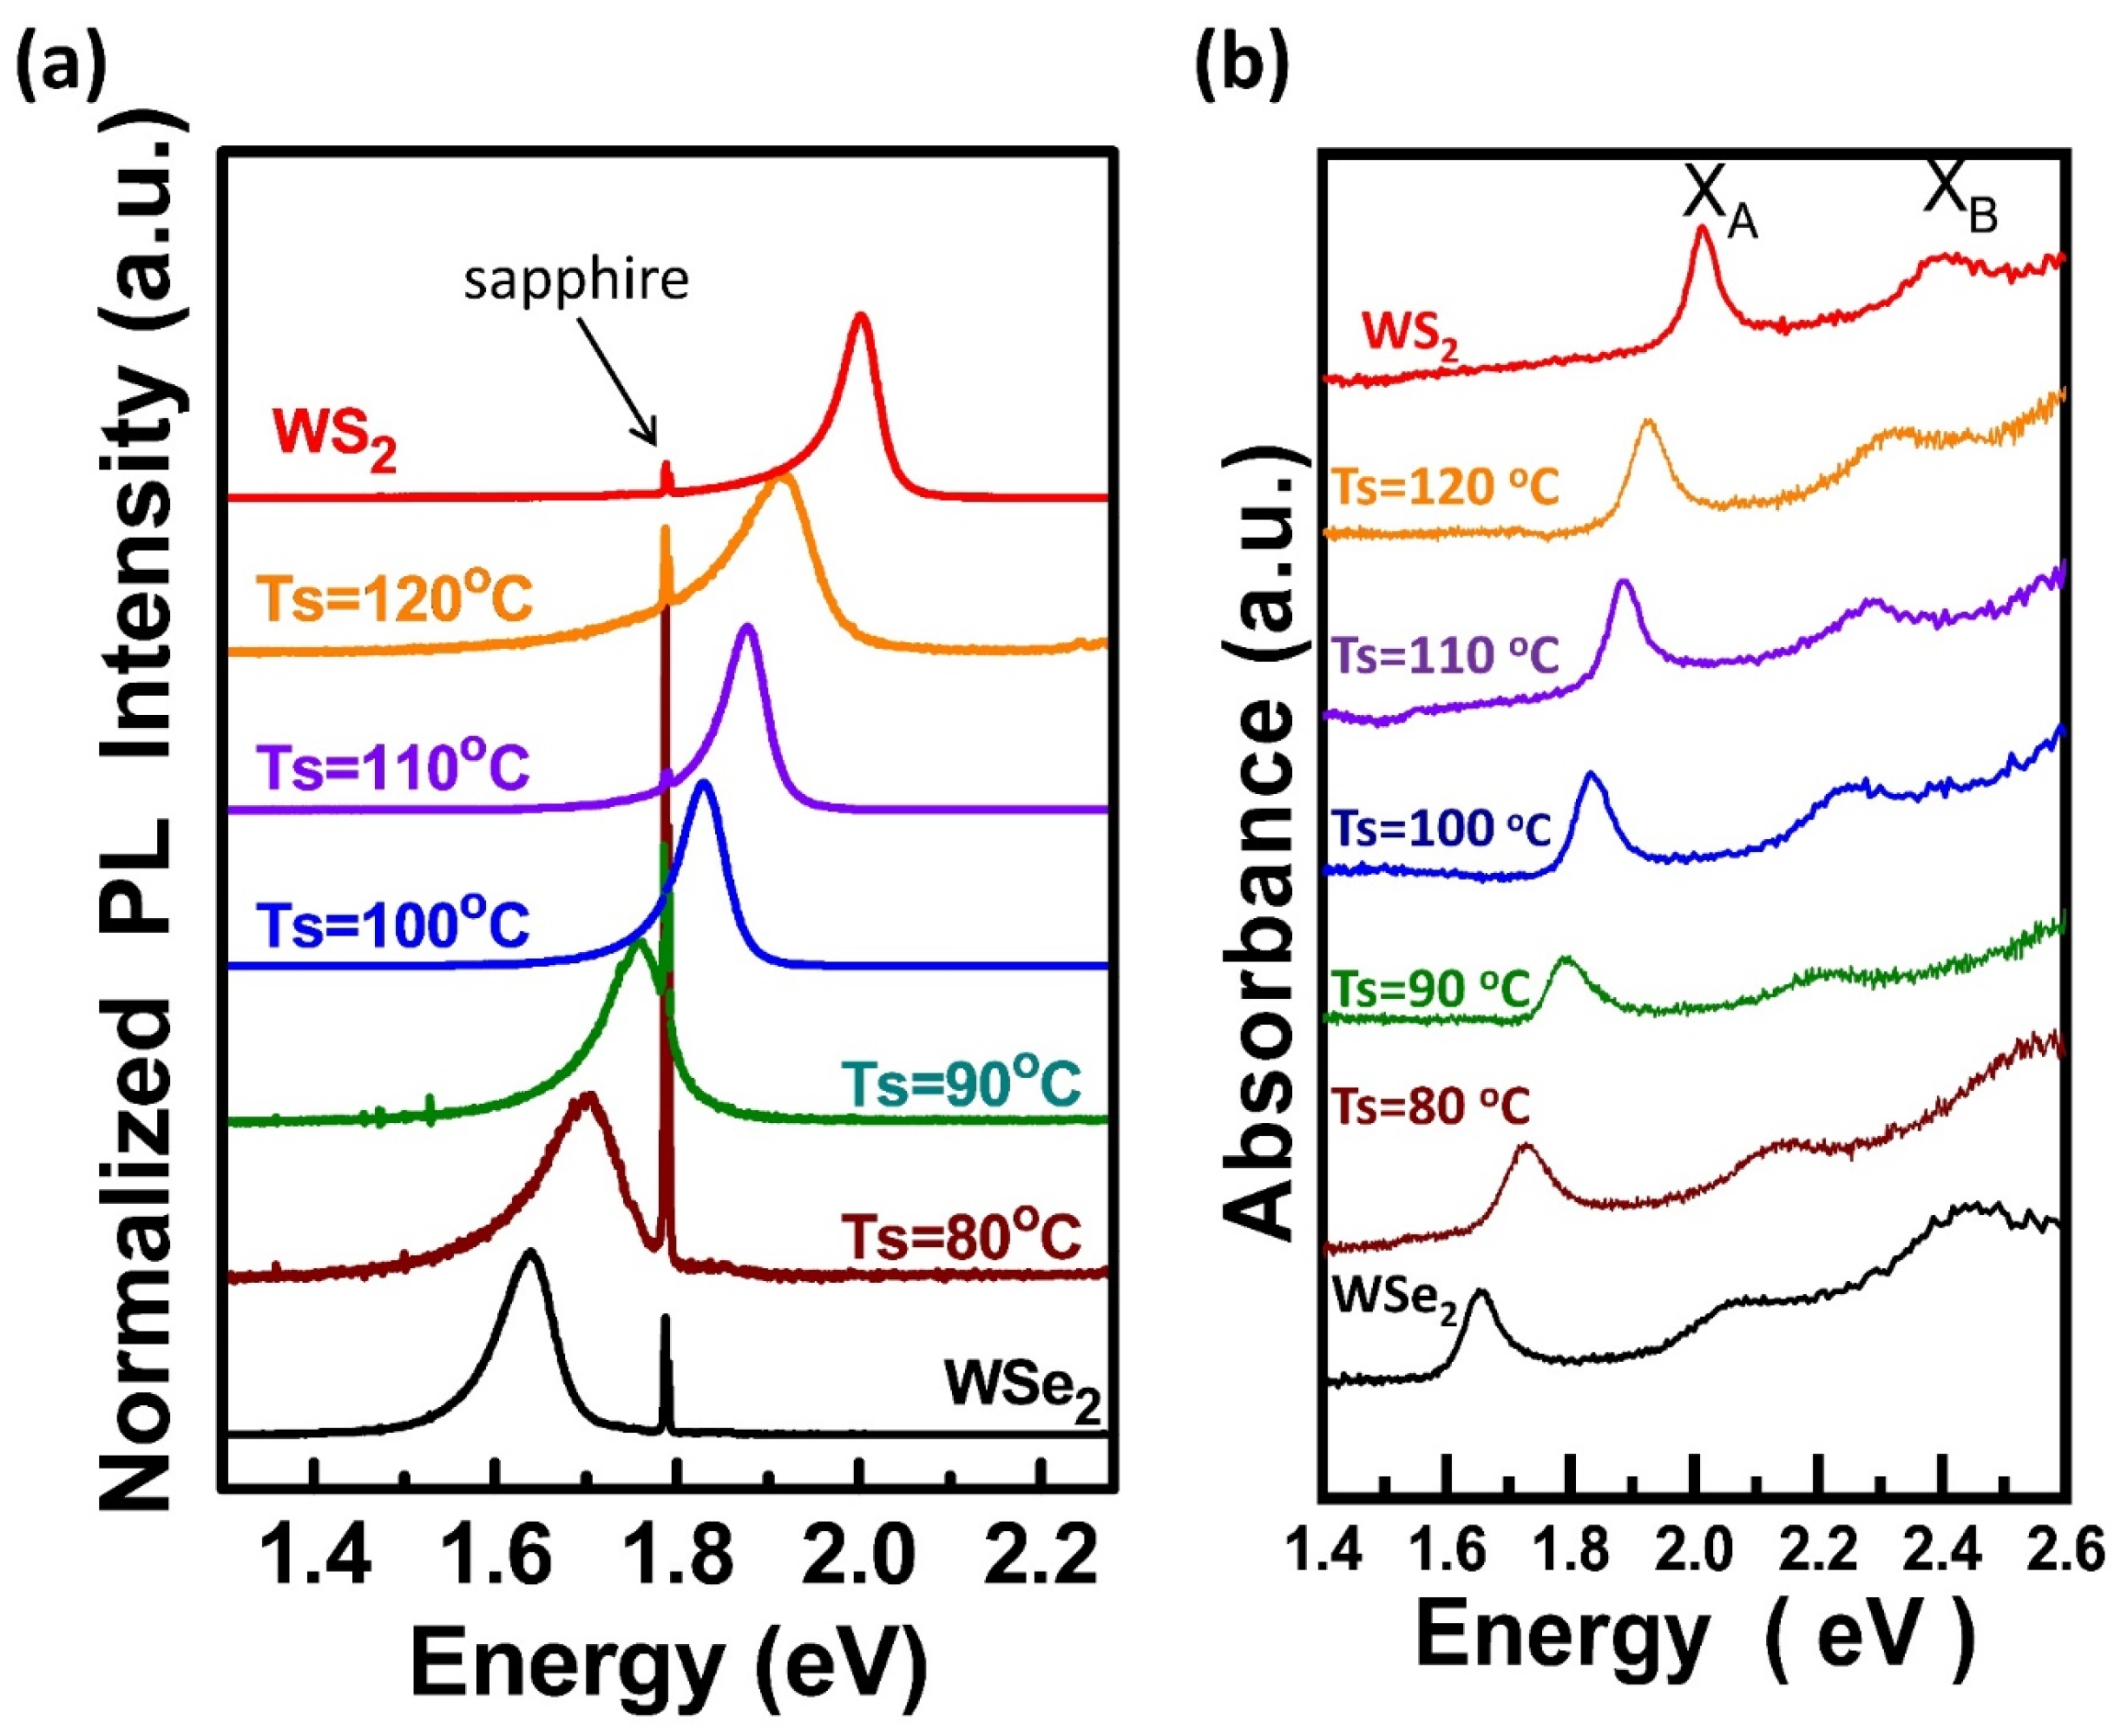
Figure 2a shows the normalized photoluminescence (PL) spectra for the WS2, WSe2, and WSxSey monolayers. The PL peak positions for the pristine WS2 and WSe2 are, respectively, located at 2.0 and 1.64 eV [49], attributed to direct emission from the conduction band minimum (CBM) to the valence band maximum (VBM) for A excitons at the K point in the Brillouin zone [3,50]. When the heating temperature of the S powder was reduced from Ts = 120, 110, 100, and 90, to 80 °C, the PL peak positions of the WSxSey monolayers gradually decreased from 1.91, 1.88, 1.83, and 1.76 to 1.70 eV, respectively. Therefore, a tuneable PL emission position can be easily achieved based on the modulation of the S/Se ratio in WSxSey monolayers by controlling the heating temperatures of the S and Se precursors. The strong emission from A excitons without B excitons for WSxSey compounds is in good agreement with the direct band gap emission in a monolayer, consistent with pristine TMD monolayer materials [51]. Furthermore, the only strong PL peak observed in the WSxSey monolayers indicates a uniform distribution of S and Se in the compound domain. Otherwise, two apparent characteristic peaks, respectively belonging to MoS2 and MoSe2, would present simultaneously in the PL spectrum due to distinguishable components of MoS2 and MoSe2 in the WSxSey monolayer, shown in Figure S1. Figure 2b shows the optical absorption spectra for these WS2, WSe2, and WSxSey monolayers. Two distinct A and B excitonic absorption peaks for WS2 (WSe2) monolayers are at 2.01 and 2.40 eV (1.65 and 2.07 eV), respectively, resulting from the spin–orbital splitting of the valence band [52]. The two A and B absorption peaks for the WSxSey monolayers at Ts = 120, 110, 100, and 90, to 80 °C are located at 1.93 and 2.33 eV, 1.89 and 2.29 eV, 1.84 and 2.26 eV, and 1.79 and 2.22 eV to 1.73 and 2.14 eV, respectively. An absorption spectrum represents the energy required for electrons to be excited from the valence band (EV) to the conduction band (EC). Therefore, the optical band gap energy (Eg) can be determined from the absorption coefficient near the absorption edge shown in Figure S2 (as described in the previous study) [53]. The optical band gap energy of the WS2, WSxSey at Ts = 120, 110, 100, 90, and 80 °C, and WSe2 monolayers is 1.97, 1.88, 1.85, 1.79, 1.75, 1.67, and 1.61 eV, respectively. Hence, the optical band gap energy of WSxSey alloys could be controlled precisely in the range between that of the WS2 and WSe2 monolayers.

3.2. Raman Characterizations

The Raman spectra of as-deposited WS2, WSe2, and WSxSey monolayers on sapphire substrates are shown in Figure 3a. Pristine WS2 shows two distinct characteristic peaks of E 2 g 1 and A1g at 359.8 and 420.7 cm−1, respectively, due to the in-plane and out-of-plane vibration models of the atoms [49]. The characteristic peaks of E 2 g 1 and A1g at 251.7 and 262.7 cm−1 for pristine WSe2 were also confirmed [49]. However, in the case of the WSxSey monolayers, both WS2-related and WSe2-related characteristic peaks were simultaneously observed in the spectrum. In addition, the shifts of the WS2-related and WSe2-related characteristic peaks were seen in opposite directions. Compared with pristine WS2, a slight red shift for the WS2-related peaks of E 2 g 1 and A1g at 358 and 415.7 cm−1 was revealed after Se doping in pristine WS2 at the Ts = 120 °C stage. Meanwhile, the intensity of the WS2-related E 2 g 1 peak decreased dramatically, and full width at half maximum (FWHM) was also broadened in both WS2-related E 2 g 1 and A1g peaks. Note that an unidentified peak at 265 cm−1 could be attributed to the vibration from the degenerate E 2 g 1 mode of W-Se structures. Furthermore, as the amount of selenium in the WSxSey monolayers is increased by the Ts = 120 °C to Ts = 80 °C processes, the WS2-related A1g peak shows a red shift trend from 415.7, 413.8, 412.7, and 407 to 406 cm−1. However, the position of the WS2-related E 2 g 1 mode does not clearly change except for the enlarged FWHM associated with the relaxation of the Raman selection rule at defects [54,55]. Although stretching strain caused a red shift [56], compressive strain produces the opposite blue shift [22]. Due to the larger lattice constant of a = 3.25 Å for WSe2 (a = 3.13 Å for WS2) [57], the WS2 monolayer would suffer compressive strain arising from Se atom doping. Therefore, the red shift of the WS2-related peaks does not result from the compressive strain arising from Se atom doping in the WSxSey monolayers. The increased red shift of the WS2-related peaks may be attributed to the effect of changing carrier concentrations on phonon vibrations arising from the increased amount of selenium in the WSxSey monolayers, where relevant investigations have been reported on the Au nanoparticle-decorated MoS2 [48,53] and MoS2/graphene stacks [58]. In addition to WS2-related peaks, a blue shift of WSe2-related E 2 g 1 at 259.7 cm−1 was also observed for sulfur doping in pristine WSe2 at the Ts = 80 °C stage. Furthermore, as the amount of sulfur in the WSxSey monolayers increases from Ts = 80 °C to Ts = 120 °C, the WSe2-related E 2 g 1 peak shows an expanded blue shift, broadened FWHM, and decreased intensity, as shown in Figure 3a. Interestingly, the opposite shift direction for the WS2- and WSe2-related Raman peaks was apparently revealed, suggesting that doping behaviors for S and Se atoms in WSxSey monolayers may result in different changes in carrier concentrations or strain. However, as previously mentioned, according to the smaller lattice constant for WS2 [57], the blue shift of the WSe2-related peaks does not result from the stretching strain arising from S atom doping in the WSxSey monolayers. Hence, the strain is not the main reason for the shifts of both WS2- and WSe2-related peaks in the Raman spectra, indicating that the carrier concentration is the key factor. Consequently, according to prior work [22,56,59], the red shift of WS2-related Raman peaks through the increase of the Se element in WSxSey monolayers may be associated with the change of carrier concentration toward the n-type, while the blue shift of WSe2-related Raman peaks via the S atom increase in WSxSey monolayers could involve an increase in hole carrier concentrations. The doping behaviors for carrier concentration will be discussed further below. A multilayer-related peak at 307 cm−1 is not observed, indicating that these WSxSey materials are monolayers [47]. The Raman shifts referenced to pristine characteristic peaks and FWHM for the WS2-related E 2 g 1 and A1g peaks and the WSe2-related E 2 g 1 peak at various heating temperatures are shown in Figure 3b,c.

3.3. PL and Raman Mapping

To confirm the homogeneity of the WSxSey monolayers, an optical micrograph and the corresponding PL and Raman mapping of a triangular WSxSey flake are shown in Figure 4. Figure 4a shows the isolated monolayer WSxSey triangle with a lateral size of ~10 µm, grown using the Ts = 120 °C process. The corresponding peak intensity and position mappings of PL, WS2-related A1g Raman mode, and WSe2-related E 2 g 1 Raman mode show homogeneous intensity within the same individual domains, respectively shown in Figure 4b–d and Figure 4e–g. However, the slight variations of PL position mapping in Figure 4c changing from 650 nm to 635 nm (~45 meV) could be attributed to componential fluctuations within the triangular flake, consistent with prior findings [60]. No shift in PL position at the edges of the triangles was found, suggesting no strain effects on the edges from the substrates [60,61]. However, the remarkable suppression of PL intensity at the edges shown in Figure 4b results from edge-localized states in the band gap, structural imperfections, or charged defects that quenched the PL [60]. Note that the PL intensity for the WSxSey monolayer is much stronger than the Raman signal, indicating superior crystallinity and lower defects in the as-grown WSxSey monolayers. In addition, the homogeneous Raman intensity mappings shown in Figure 4d,f present excellent uniformity of crystalline quality within the WSxSey flake. The tiny variation within ±2 cm–1 for both Raman position mappings in Figure 4e,g show that WS2-related and WSe2-related materials were uniformly distributed over the whole WSxSey flake, indicating good mixing and consistent components for the W, S, and Se elements. Therefore, the mapping results show that WS2-related and WSe2-related materials are uniformly mixed to form an homogeneous alloy monolayer.

3.4. X-ray Photoemission Spectroscopy (XPS)

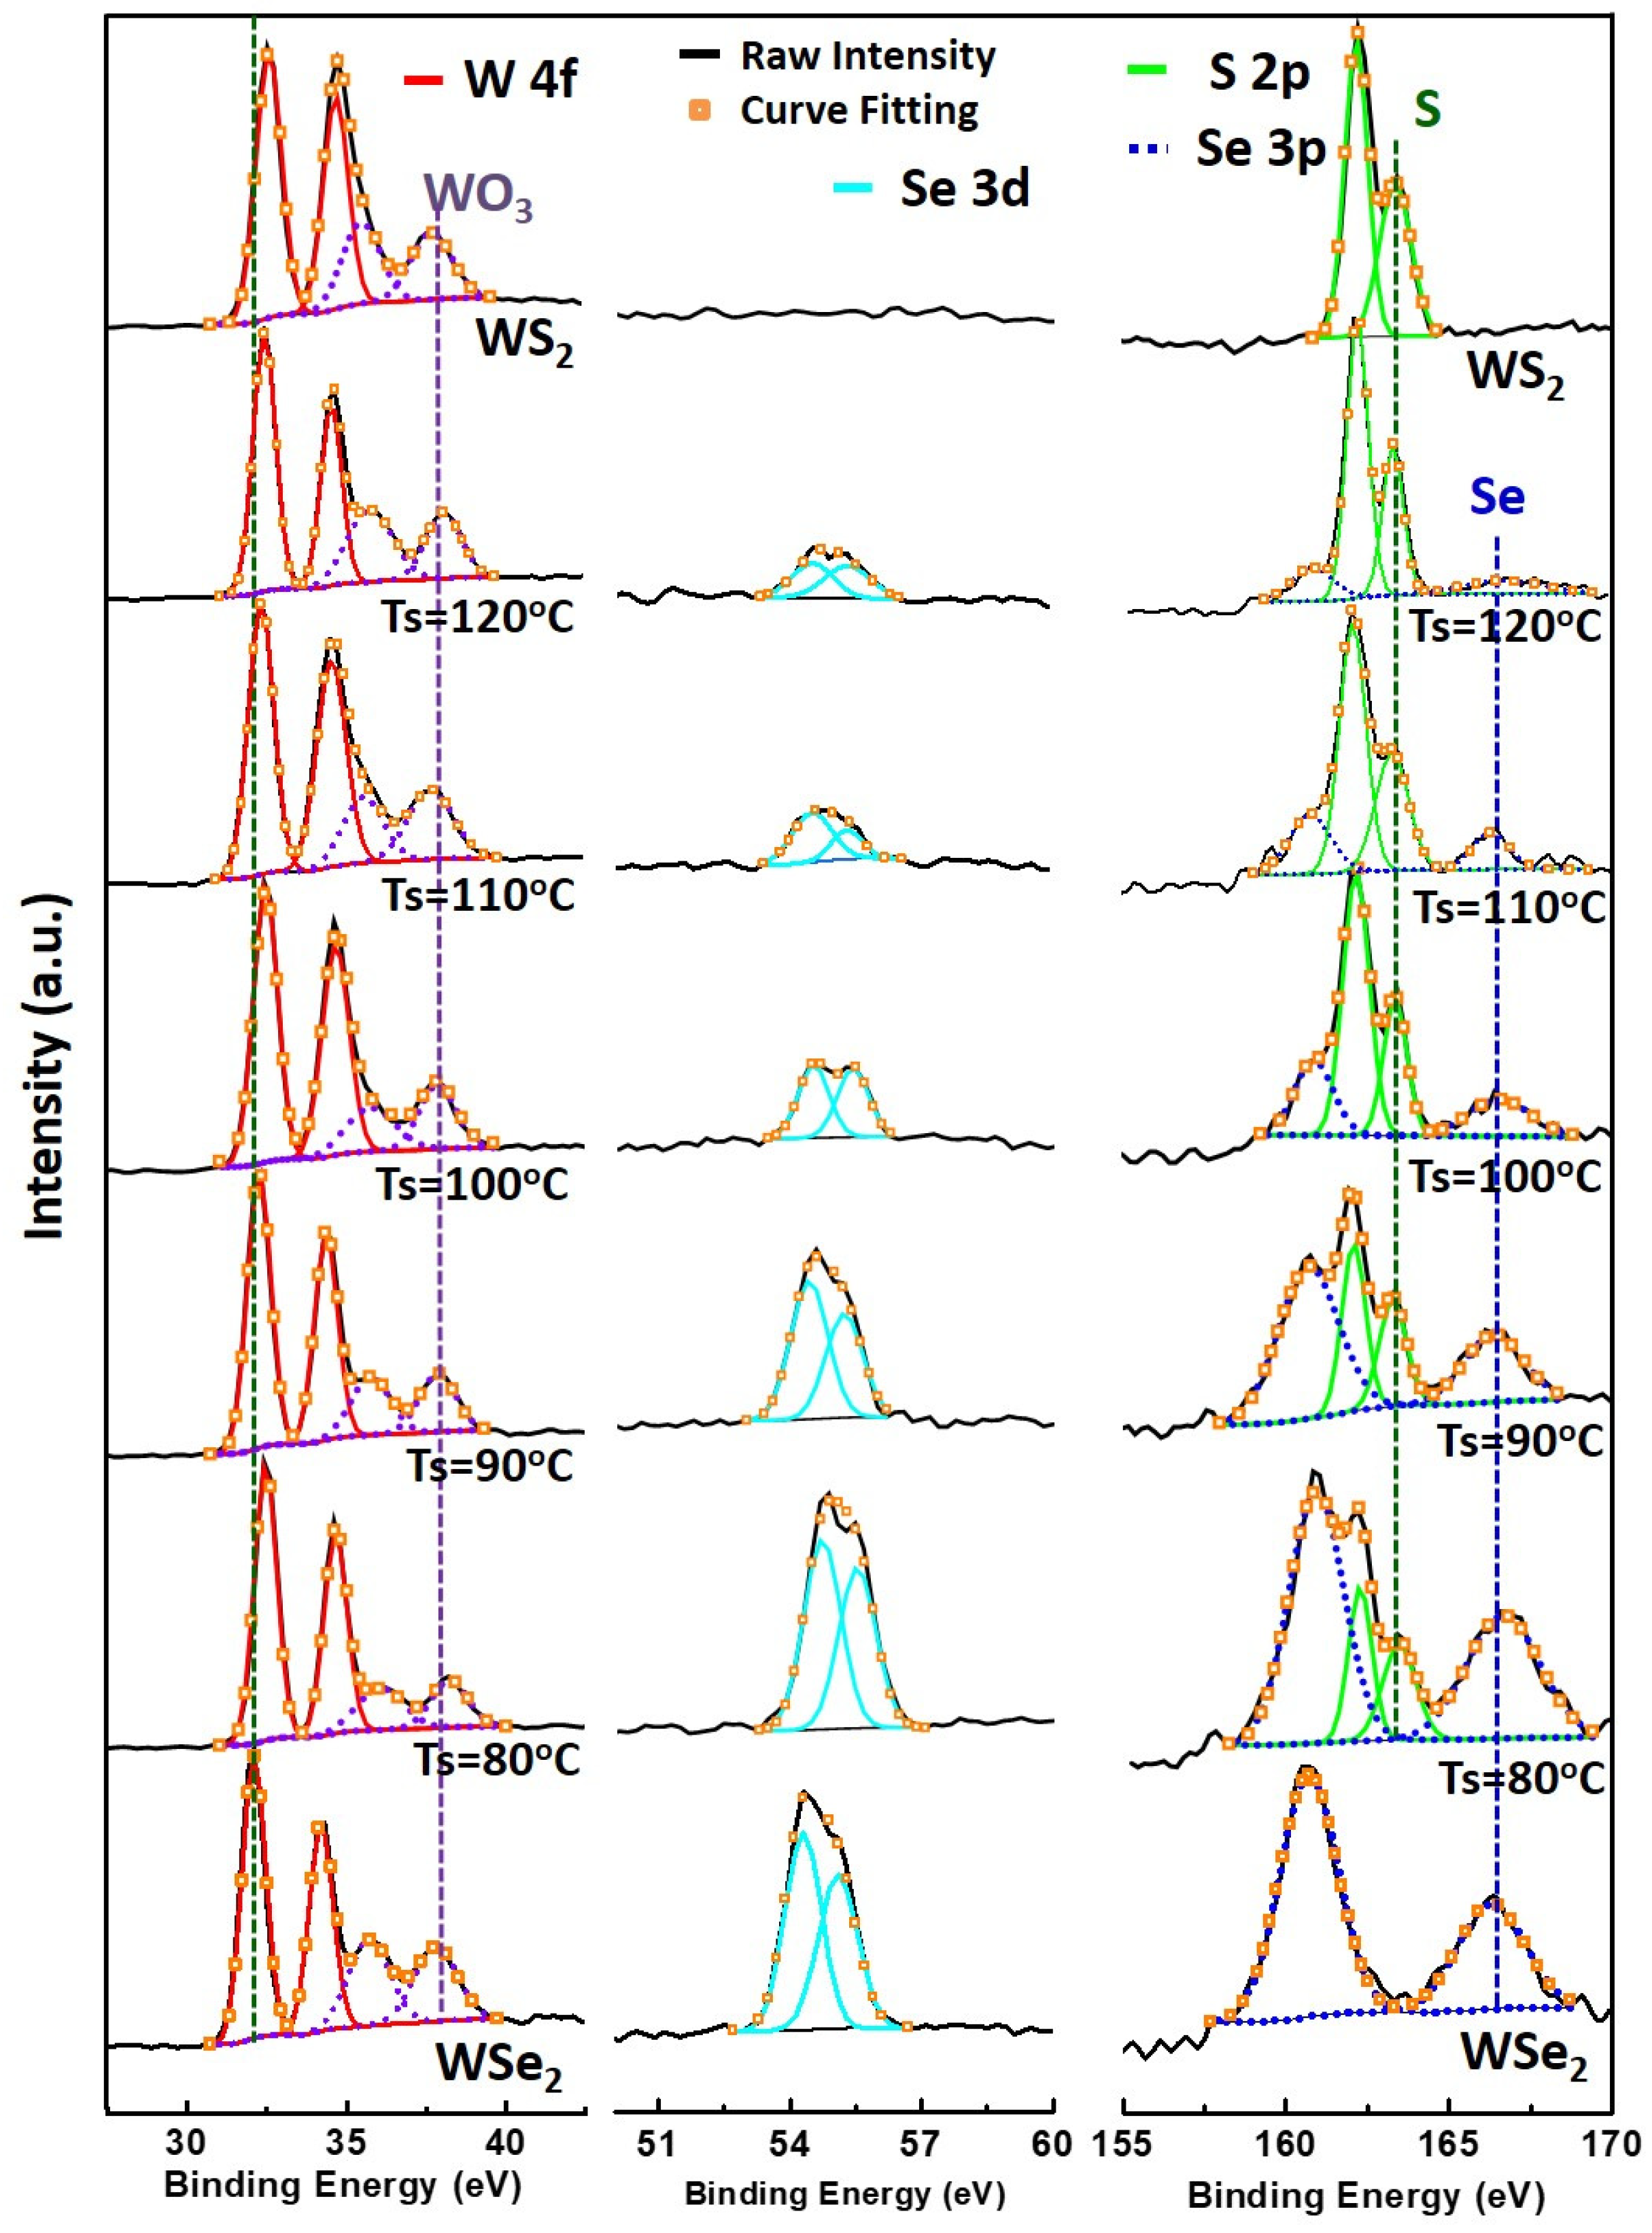
The surface composition and stoichiometry of the as-deposited WS2, WSe2, and WSxSey monolayers were characterized using X-ray photoemission spectroscopy (XPS). Figure 5 shows pristine WS2 with two characteristic peaks at 32.8 and 35.0 eV, attributed to the doublet W 4f7/2 and W 4f5/2 binding energies for W4+, whereas WSe2 presents a slight red shift at 32.1 and 34.3 eV due to weaker electronegativity [47]. The doublet peaks corresponding to the S 2p3/2 and S 2p1/2 orbital of divalent sulfide ions (S2−) are observed at 162.1 and 163.3 eV [29]. The doublet peaks for Se2− at 54.3 and 55.1 eV are assigned to the Se 3d5/2 and Se 3d3/2 binding energies [29,47]. In addition, the weak doublet peaks associated with WO3 at 35.8 and 38.0 eV are also observed in all samples, possibly resulting from incomplete-reaction WO3 precursors or oxidation from residual oxygen in the chamber [47]. When the sulfur heating temperature decreases, the sulfur doublet peaks (S 2p3/2 and S 2p1/2) gradually become less evident, while the two selenium doublet peaks (Se 3d3/2, Se 3d5/2) and (Se 3p3/2, Se 3p5/2) become more prominent. The magnitude of each profile was normalized for easier comparison. By changing the sulfur heating temperature from 120 to 80 °C, various stoichiometries from the WS1.87Se0.31 to WS0.88Se1.39 for WSxSey monolayers could be controlled precisely, specifically listed in Table S1. Hence, various concentrations of S and Se elements in the WSxSey monolayers could be accurately modulated by controlling the precursor heating temperature. In addition, the chemical stoichiometry of these WSxSey monolayers is chalcogen-plentiful; that is, the ratio of (S + Se)/Mo is greater than 2, which could be attributed to lower WSxSey formation enthalpies evaluated by first-principle calculations [62] or excess chalcogen elements in the process.

3.5. Ultraviolet Photoemission Spectroscopy (UPS)

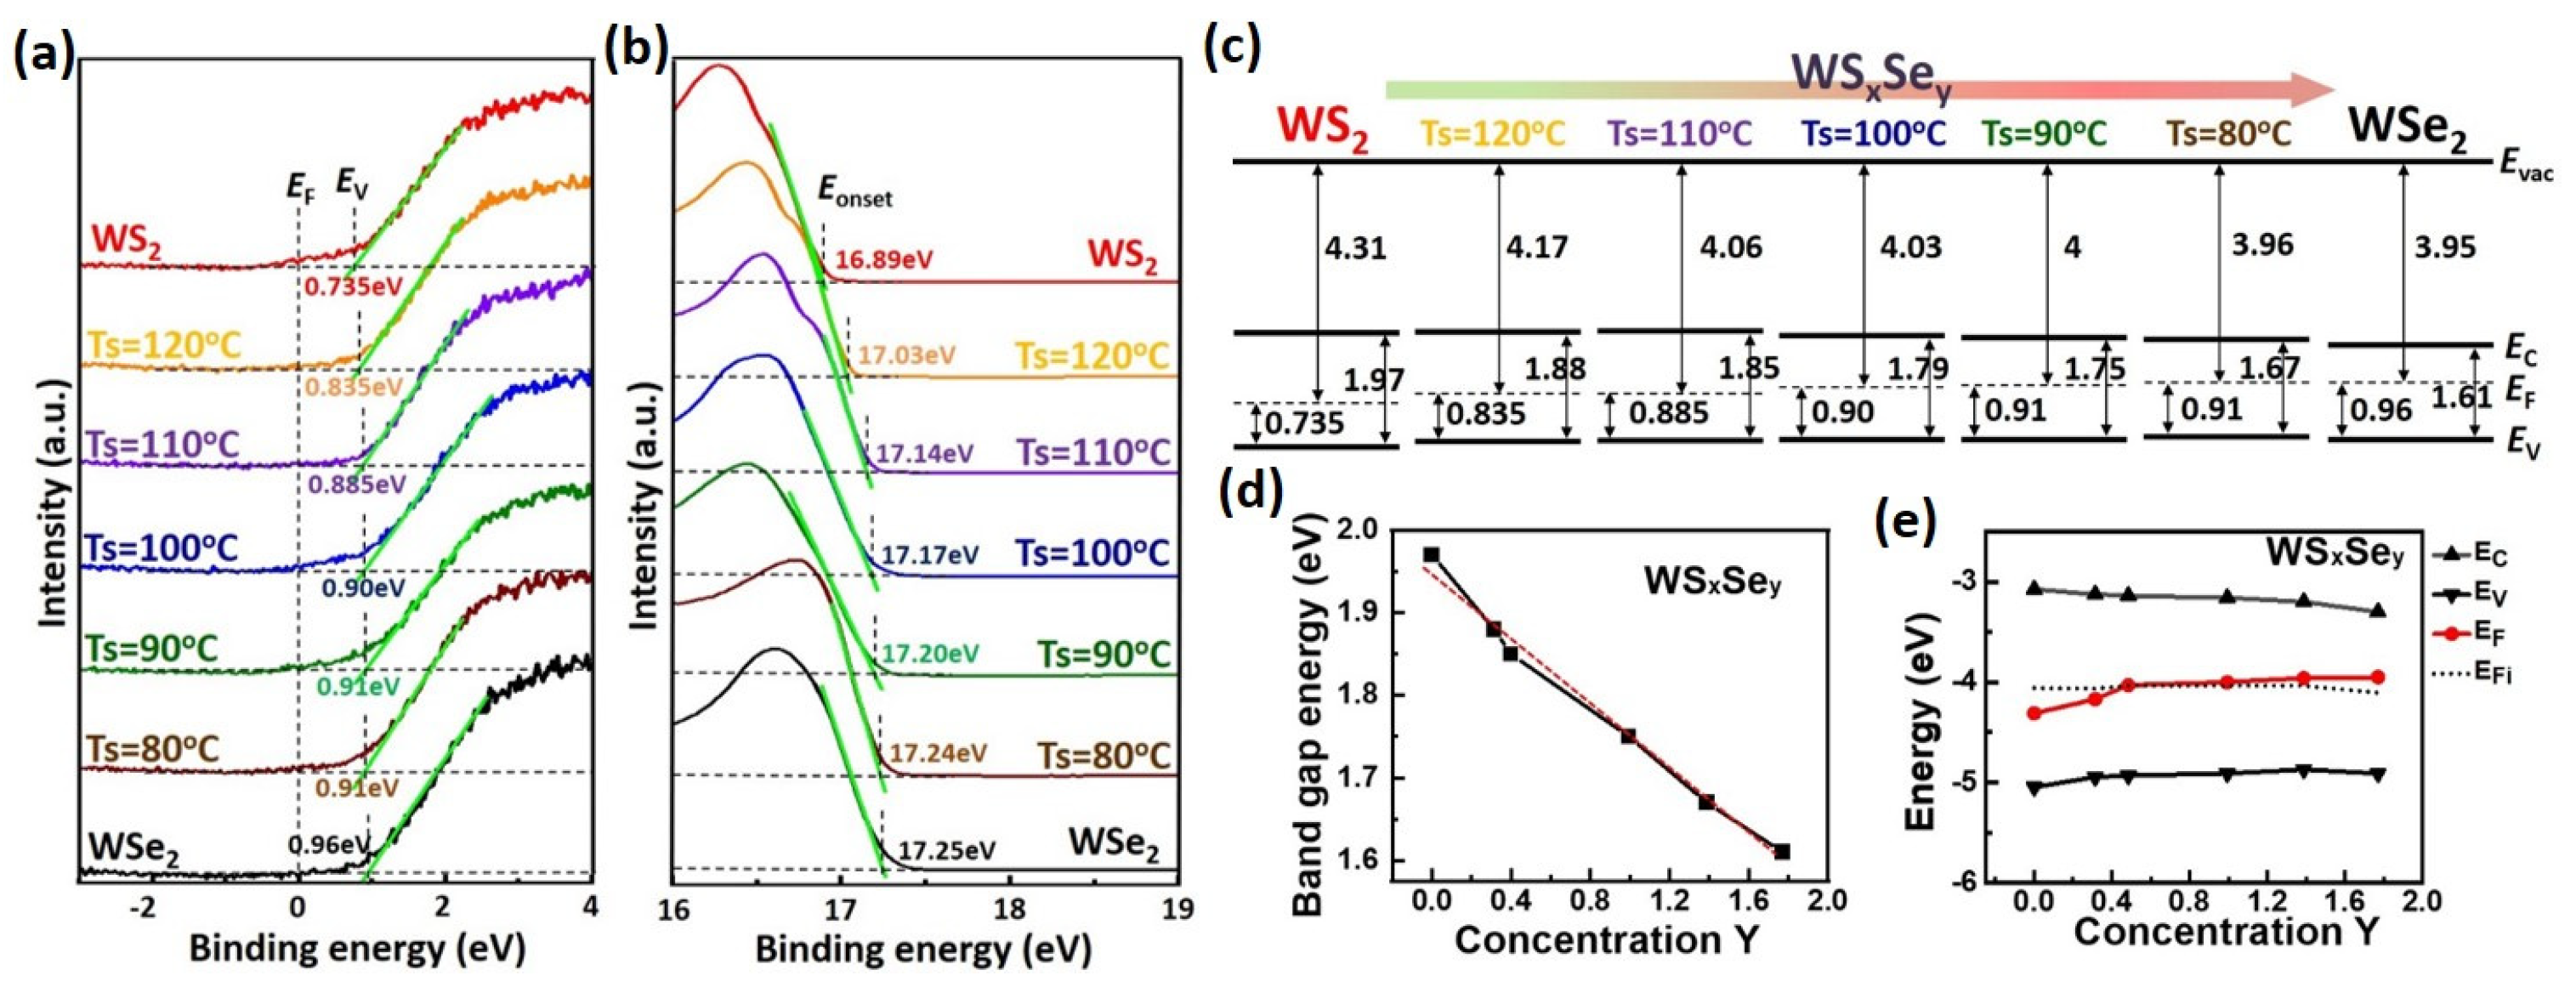
The energy level alignment with respect to the Fermi energy (EF) was explored using ultraviolet photoemission spectroscopy (UPS). The Au layer was used as a reference to ensure that the Fermi energy was located at 0 eV [53]. The valence band below the EF (EF-EV) for WS2, WSxSey at Ts = 120, 110, 100, 90, and 80 °C, and WSe2 monolayers is 0.735, 0.835, 0.885, 0.90, 0.91, 0.91, and 0.96 eV, respectively, acquired by linearly extrapolating the leading edge of the spectrum to the baseline shown in Figure 6a. Moreover, the work function (Φ) can be estimated using Φ = hν − Eonset, where hν is the incident photon energy (21.2 eV) and Eonset is the onset level related to the secondary electrons, as shown in Figure 6b [53]. Thus, the Φ for WS2, WSxSey at Ts = 120, 110, 100, 90, and 80 °C, and WSe2 monolayers is 4.31, 4.17, 4.06, 4.03, 4.00, 3.96, and 3.95 eV, respectively. In addition, the optical band gaps of the WS2, WSxSey, and WSe2 monolayers were discussed above in Figure S2. The values of the optical band gap, Φ, and EF-EV for the WS2, WSxSey, and WSe2 monolayers are listed in Table S2. The energy band diagrams relative to the EF for the WS2, WSxSey, and WSe2 monolayers are shown in Figure 6c. The EF-EV energy of the WS2 is 0.735 eV, which is smaller than half the band gap energy, indicating that the WS2 monolayer is a p-type semiconductor material, consistent with other reports [63,64]. With an increase of the Se component in the WSxSey monolayers (i.e., a decrease of Ts), the EF-EV energy increased, and the EF moved from the valence band toward the conduction band, demonstrating the transformation of electronic states from p-type to n-type. In addition, n-type WSe2 was identified according to the EF position near to the conduction band, consistent with other reports [65,66]. The band gap and the energy band diagrams as a function of Se concentration in WSxSey monolayers are, respectively, in Figure 6d,e. Good linear fitting for the band gap and Se concentration in Figure 6d suggested that the band gap could be determined precisely and linearly through the control of Se concentration in WSxSey monolayers. In addition, the electronic state model could be tuned to p-type or n-type by modulating the Se concentration in the WSxSey monolayers. Therefore, the WSxSey monolayers can be adjusted as p-type or n-type semiconductors by systematically modulating the S/Se ratio in the process.

4. Conclusions

WSxSey monolayers were synthesized using tungsten oxides, selenium, and sulfur powders as the sources in the CVD process, in which different heating temperatures for the selenium and sulfur powders are applied, respectively, to control the S/Se ratio. The tunable band gap of the as-grown WSxSey monolayers changed from 1.97 eV to 1.61 eV with different chalcogenide heating temperatures, consistent with findings in other literature of 626.6 nm to 751.9 nm. The red shift for WS2-related Raman peaks arising from an increase of the Se element in the WSxSey monolayers was associated with an increase in electron concentration, whereas the blue shift for the WSe2-related Raman peaks was related to enhanced hole concentration. The homogeneous element distribution within a WSxSey flake was identified by PL and Raman mapping. The chemical stoichiometry for the WS2, WSxSey at Ts = 120, 110, 100, 90, and 80 °C, and WSe2 monolayers was, respectively, WS2.20, WS1.87Se0.31, WS1.66Se0.40, WS1.54Se0.48, WS1.12Se1.00, WS0.88Se1.39, and WSe1.77, indicating good control of the S/Se ratio via the chalcogenide heating temperature. With an increase of the Se element in the WSxSey monolayers, the work function changed from 4.31, 4.17, 4.06, 4, and 3.96 to 3.95, demonstrating the electronic state transition from p-type to n-type. The study of doping characteristics in those WSxSey monolayers via different chalcogen heating temperatures provides useful implications for electronic and optical design.

Supplementary Materials

The following are available online at https://www.mdpi.com/article/10.3390/nano13142107/s1, Figure S1. (a) PL spectrum showing the two characteristic peaks belonging to MoS2 and MoSe2 respectively. (b,c) The bright-field TEM images showing the distinguishable S- and Se-rich parts in the WSxSey. Figure S2. Plots of the (αhv)2 versus photon energy (hv) for direct inter-band transitions of WS2, WSxSey, and WSe2 monolayers whose intercepts of tangents represent the band gap energy. Table S1. The chemical stoichiometries for the WS2, WSxSey at Ts = 120, 110, 100, 90 to 80 °C, and WSe2 monolayers. Table S2. The band gap (Eg), work function (Φ), and EF-EV for the WS2, WSxSey at Ts = 120, 110, 100, 90 to 80 °C, and WSe2 monolayers.

Author Contributions

Investigation, C.J.; resources, C.-S.H., B.-R.H. and Y.-T.C.; writing—original draft, Y.-H.C. All authors have read and agreed to the published version of the manuscript.

Funding

This research was supported by the Ministry of Science and Technology (MOST 108-2221-E-224-015-MY3) and National Yunlin University of Science and Technology (108T01 and 108T04).

Data Availability Statement

Research data are not shared.

Conflicts of Interest

The authors declare no conflict of interest.

References

  1. Radisavljevic, B.; Radenovic, A.; Brivio, J.; Giacometti, V.; Kis, A. Single-Layer MoS2 Transistors. Nat. Nanotechnol. 2011, 6, 147–150. [Google Scholar] [CrossRef] [PubMed]
  2. Radisavljevic, B.; Whitwick, M.B.; Kis, A. Integrated Circuits and Logic Operations Based on Single-Layer MoS2. ACS Nano 2011, 5, 9934–9938. [Google Scholar] [CrossRef] [PubMed]
  3. Tongay, S.; Zhou, J.; Ataca, C.; Lo, K.; Matthews, T.S.; Li, J.; Grossman, J.C.; Wu, J. Thermally Driven Crossover from Indirect toward Direct Bandgap in 2D Semiconductors: MoSe2 versus MoS2. Nano Lett. 2012, 12, 5576–5580. [Google Scholar] [CrossRef] [PubMed]
  4. Horzum, S.; Sahin, H.; Cahangirov, S.; Cudazzo, P.; Rubio, A.; Serin, T.; Peeters, F.M. Phonon Softening and Direct to Indirect Band Gap Crossover in Strained Single-Layer MoSe2. Phys. Rev. B Condens. Matter Mater. Phys. 2013, 87, 125415. [Google Scholar] [CrossRef] [Green Version]
  5. Mak, K.F.; Lee, C.; Hone, J.; Shan, J.; Heinz, T.F. Atomically Thin MoS2: A New Direct-Gap Semiconductor. Phys. Rev. Lett. 2010, 105, 136805. [Google Scholar] [CrossRef] [Green Version]
  6. Pu, J.; Yomogida, Y.; Liu, K.-K.; Li, L.-J.; Iwasa, Y.; Takenobu, T. Highly Flexible MoS2 Thin-Film Transistors with Ion Gel Dielectrics. Nano Lett. 2012, 12, 4013–4017. [Google Scholar] [CrossRef]
  7. Splendiani, A.; Sun, L.; Zhang, Y.; Li, T.; Kim, J.; Chim, C.Y.; Galli, G.; Wang, F. Emerging Photoluminescence in Monolayer MoS2. Nano Lett. 2010, 10, 1271–1275. [Google Scholar] [CrossRef]
  8. Korn, T.; Heydrich, S.; Hirmer, M.; Schmutzler, J.; Schller, C. Low-Temperature Photocarrier Dynamics in Monolayer MoS2. Appl. Phys. Lett. 2011, 99, 102109. [Google Scholar] [CrossRef] [Green Version]
  9. Kim, S.; Konar, A.; Hwang, W.S.; Lee, J.H.; Lee, J.; Yang, J.; Jung, C.; Kim, H.; Yoo, J.B.; Choi, J.Y.; et al. High-Mobility and Low-Power Thin-Film Transistors Based on Multilayer MoS2 Crystals. Nat. Commun. 2012, 3, 1011. [Google Scholar] [CrossRef] [Green Version]
  10. Kashid, R.V.; Late, D.J.; Chou, S.S.; Huang, Y.K.; De, M.; Joag, D.S.; More, M.A.; Dravid, V.P. Enhanced Field-Emission Behavior of Layered MoS2 Sheets. Small 2013, 9, 2730–2734. [Google Scholar] [CrossRef]
  11. Yu, W.J.; Li, Z.; Zhou, H.; Chen, Y.; Wang, Y.; Huang, Y.; Duan, X. Vertically Stacked Multi-Heterostructures of Layered Materials for Logic Transistors and Complementary Inverters. Nat. Mater. 2013, 12, 246–252. [Google Scholar] [CrossRef] [Green Version]
  12. Lin, J.; Zhong, J.; Zhong, S.; Li, H.; Zhang, H.; Chen, W. Modulating Electronic Transport Properties of MoS2 Field Effect Transistor by Surface Overlayers. Appl. Phys. Lett. 2013, 103, 063109. [Google Scholar] [CrossRef]
  13. Bernardi, M.; Palummo, M.; Grossman, J.C. Extraordinary Sunlight Absorption and One Nanometer Thick Photovoltaics Using Two-Dimensional Monolayer Materials. Nano Lett. 2013, 13, 3664–3670. [Google Scholar] [CrossRef]
  14. Fontana, M.; Deppe, T.; Boyd, A.K.; Rinzan, M.; Liu, A.Y.; Paranjape, M.; Barbara, P. Electron-Hole Transport and Photovoltaic Effect in Gated MoS2 Schottky Junctions. Sci. Rep. 2013, 3, 1634. [Google Scholar] [CrossRef] [Green Version]
  15. Ross, J.S.; Klement, P.; Jones, A.M.; Ghimire, N.J.; Yan, J.; Mandrus, D.G.; Taniguchi, T.; Watanabe, K.; Kitamura, K.; Yao, W.; et al. Electrically Tunable Excitonic Light-Emitting Diodes Based on Monolayer WSe2 p-n Junctions. Nat. Nanotechnol. 2014, 9, 268–272. [Google Scholar] [CrossRef]
  16. Britnell, L.; Ribeiro, R.M.; Eckmann, A.; Jalil, R.; Belle, B.D.; Mishchenko, A.; Kim, Y.; Gorbachev, R.V.; Georgiou, T.; Morozov, S.V.; et al. Strong Light-Matter Interactions Thin Films. Science 2013, 340, 1311–1315. [Google Scholar] [CrossRef] [Green Version]
  17. Lopez-Sanchez, O.; Lembke, D.; Kayci, M.; Radenovic, A.; Kis, A. Ultrasensitive Photodetectors Based on Monolayer MoS2. Nat. Nanotechnol. 2013, 8, 497–501. [Google Scholar] [CrossRef]
  18. Chang, Y.H.; Lin, C.T.; Chen, T.Y.; Hsu, C.L.; Lee, Y.H.; Zhang, W.; Wei, K.H.; Li, L.J. Highly Efficient Electrocatalytic Hydrogen Production by MoSx Grown on Graphene-Protected 3D Ni Foams. Adv. Mater. 2013, 25, 756–760. [Google Scholar] [CrossRef]
  19. Chang, Y.H.; Wu, F.Y.; Chen, T.Y.; Hsu, C.L.; Chen, C.H.; Wiryo, F.; Wei, K.H.; Chiang, C.Y.; Li, L.J. Three-Dimensional Molybdenum Sulfide Sponges for Electrocatalytic Water Splitting. Small 2014, 10, 895–900. [Google Scholar] [CrossRef]
  20. Xiang, Q.; Yu, J.; Jaroniec, M. Synergetic Effect of MoS2 and Graphene as Cocatalysts for Enhanced Photocatalytic H2 Production Activity of TiO2 Nanoparticles. J. Am. Chem. Soc. 2012, 134, 6575–6578. [Google Scholar] [CrossRef]
  21. Zhang, W.; Huang, J.K.; Chen, C.H.; Chang, Y.H.; Cheng, Y.J.; Li, L.J. High-Gain Phototransistors Based on a CVD MoS2 Monolayer. Adv. Mater. 2013, 25, 3456–3461. [Google Scholar] [CrossRef] [PubMed]
  22. Hui, Y.Y.; Liu, X.; Jie, W.; Chan, N.Y.; Hao, J.; Hsu, Y.T.; Li, L.J.; Guo, W.; Lau, S.P. Exceptional Tunability of Band Energy in a Compressively Strained Trilayer MoS2 Sheet. ACS Nano 2013, 7, 7126–7131. [Google Scholar] [CrossRef] [PubMed]
  23. Feng, J.; Qian, X.; Huang, C.W.; Li, J. Strain-Engineered Artificial Atom as a Broad-Spectrum Solar Energy Funnel. Nat. Photonics 2012, 6, 866–872. [Google Scholar] [CrossRef]
  24. Pan, H.; Zhang, Y.W. Tuning the Electronic and Magnetic Properties of MoS2 Nanoribbons by Strain Engineering. J. Phys. Chem. C 2012, 116, 11752–11757. [Google Scholar] [CrossRef]
  25. Lu, P.; Wu, X.; Guo, W.; Zeng, X.C. Strain-Dependent Electronic and Magnetic Properties of MoS2 Monolayer, Bilayer, Nanoribbons and Nanotubes. Phys. Chem. Chem. Phys. 2012, 14, 13035–13040. [Google Scholar] [CrossRef]
  26. Ghorbani-Asl, M.; Borini, S.; Kuc, A.; Heine, T. Strain-Dependent Modulation of Conductivity in Single-Layer Transition-Metal Dichalcogenides. Phys. Rev. B Condens. Matter Mater. Phys. 2013, 87, 235434. [Google Scholar] [CrossRef] [Green Version]
  27. Terrones, H.; López-Urías, F.; Terrones, M. Novel Hetero-Layered Materials with Tunable Direct Band Gaps by Sandwiching Different Metal Disulfides and Diselenides. Sci. Rep. 2013, 3, 1549. [Google Scholar] [CrossRef] [Green Version]
  28. Tang, Q.; Jiang, D.E. Stabilization and Band-Gap Tuning of the 1T-MoS2 Monolayer by Covalent Functionalization. Chem. Mater. 2015, 27, 3743–3748. [Google Scholar] [CrossRef] [Green Version]
  29. Su, S.-H.; Hsu, W.-T.; Hsu, C.-L.; Chen, C.-H.; Chiu, M.-H.; Lin, Y.-C.; Chang, W.-H.; Suenaga, K.; He, J.-H.; Li, L.-J. Controllable Synthesis of Band-Gap-Tunable and Monolayer Transition-Metal Dichalcogenide Alloys. Front. Energy Res. 2014, 2, 27. [Google Scholar] [CrossRef]
  30. Chen, Y.; Xi, J.; Dumcenco, D.O.; Liu, Z.; Suenaga, K.; Wang, D.; Shuai, Z.; Huang, Y.S.; Xie, L. Tunable Band Gap Photoluminescence from Atomically Thin Transition-Metal Dichalcogenide Alloys. ACS Nano 2013, 7, 4610–4616. [Google Scholar] [CrossRef]
  31. Zhang, M.; Wu, J.; Zhu, Y.; Dumcenco, D.O.; Hong, J.; Mao, N.; Deng, S.; Chen, Y.; Yang, Y.; Jin, C.; et al. Two-Dimensional Molybdenum Tungsten Diselenide Alloys: Photoluminescence, Raman Scattering, and Electrical Transport. ACS Nano 2014, 8, 7130–7137. [Google Scholar] [CrossRef]
  32. Chen, Y.; Dumcenco, D.O.; Zhu, Y.; Zhang, X.; Mao, N.; Feng, Q.; Zhang, M.; Zhang, J.; Tan, P.H.; Huang, Y.S.; et al. Composition-Dependent Raman Modes of Mo1-xWxS2 Monolayer Alloys. Nanoscale 2014, 6, 2833–2839. [Google Scholar] [CrossRef] [Green Version]
  33. Wu, X.; Li, H.; Liu, H.; Zhuang, X.; Wang, X.; Fan, X.; Duan, X.; Zhu, X.; Zhang, Q.; Meixner, A.J.; et al. Spatially Composition-Modulated Two-Dimensional WS2xSe2(1-x) Nanosheets. Nanoscale 2017, 9, 4707–4712. [Google Scholar] [CrossRef]
  34. Duan, X.; Wang, C.; Fan, Z.; Hao, G.; Kou, L.; Halim, U.; Li, H.; Wu, X.; Wang, Y.; Jiang, J.; et al. Synthesis of WS2xSe2-2x Alloy Nanosheets with Composition-Tunable Electronic Properties. Nano Lett. 2016, 16, 264–269. [Google Scholar] [CrossRef]
  35. Feng, Q.; Zhu, Y.; Hong, J.; Zhang, M.; Duan, W.; Mao, N.; Wu, J.; Xu, H.; Dong, F.; Lin, F.; et al. Growth of Large-Area 2D MoS2(1−x)Se2x Semiconductor Alloys. Adv. Mater. 2014, 26, 2648–2653. [Google Scholar] [CrossRef]
  36. Li, H.; Duan, X.; Wu, X.; Zhuang, X.; Zhou, H.; Zhang, Q.; Zhu, X.; Hu, W.; Ren, P.; Guo, P.; et al. Growth of Alloy MoS2xSe2(1−x) Nanosheets with Fully Tunable Chemical Compositions and Optical Properties. J. Am. Chem. Soc. 2014, 136, 3756–3759. [Google Scholar] [CrossRef]
  37. Zhang, W.; Li, X.; Jiang, T.; Song, J.; Lin, Y.; Zhu, L.; Xu, X. CVD Synthesis of Mo(1−x)WxS2 and MoS2(1−x)Se2x Alloy Monolayers Aimed at Tuning the Bandgap of Molybdenum Disulfide. Nanoscale 2015, 7, 13554–13560. [Google Scholar] [CrossRef]
  38. Chen, Y.; Wen, W.; Zhu, Y.; Mao, N.; Feng, Q.; Zhang, M.; Hsu, H.-P.; Zhang, J.; Huang, Y.-S.; Xie, L. Temperature-Dependent Photoluminescence Emission and Raman Scattering from Mo1−xWxS2 Monolayers. Nanotechnology 2016, 27, 445705. [Google Scholar] [CrossRef]
  39. Dumcenco, D.O.; Kobayashi, H.; Liu, Z.; Huang, Y.S.; Suenaga, K. Visualization and Quantification of Transition Metal Atomic Mixing in Mo1−xWxS2 Single Layers. Nat. Commun. 2013, 4, 1351. [Google Scholar] [CrossRef] [Green Version]
  40. Wang, Z.; Liu, P.; Ito, Y.; Ning, S.; Tan, Y.; Fujita, T.; Hirata, A.; Chen, M. Chemical Vapor Deposition of Monolayer Mo1−xWxS2 Crystals with Tunable Band Gaps. Sci. Rep. 2016, 6, 2–10. [Google Scholar] [CrossRef] [Green Version]
  41. Umrao, S.; Jeon, J.; Jeon, S.M.; Choi, Y.J.; Lee, S. A Homogeneous Atomic Layer MoS2(1- x)Se2x Alloy Prepared by Low-Pressure Chemical Vapor Deposition, and Its Properties. Nanoscale 2017, 9, 594–603. [Google Scholar] [CrossRef] [PubMed]
  42. Onofrio, N.; Guzman, D.; Strachan, A. Novel Doping Alternatives for Single-Layer Transition Metal Dichalcogenides. J. Appl. Phys. 2017, 122, 185102. [Google Scholar] [CrossRef] [Green Version]
  43. Cheng, R.; Li, D.; Zhou, H.; Wang, C.; Yin, A.; Jiang, S.; Liu, Y.; Chen, Y.; Huang, Y.; Duan, X. Electroluminescence and Photocurrent Generation from Atomically Sharp WSe2/MoS2 Heterojunction p-n Diodes. Nano Lett. 2014, 14, 5590–5597. [Google Scholar] [CrossRef] [PubMed] [Green Version]
  44. Li, D.; Cheng, R.; Zhou, H.; Wang, C.; Yin, A.; Chen, Y.; Weiss, N.O.; Huang, Y.; Duan, X. Electric-Field-Induced Strong Enhancement of Electroluminescence in Multilayer Molybdenum Disulfide. Nat. Commun. 2015, 6, 7509. [Google Scholar] [CrossRef] [Green Version]
  45. Pospischil, A.; Furchi, M.M.; Mueller, T. Solar-Energy Conversion and Light Emission in an Atomic Monolayer p-n Diode. Nat. Nanotechnol. 2014, 9, 257–261. [Google Scholar] [CrossRef]
  46. Xue, Y.; Zhang, Y.; Liu, Y.; Liu, H.; Song, J.; Sophia, J.; Liu, J.; Xu, Z.; Xu, Q.; Wang, Z.; et al. Scalable Production of a Few-Layer MoS2/WS2 Vertical Heterojunction Array and Its Application for Photodetectors. ACS Nano 2016, 10, 573–580. [Google Scholar] [CrossRef]
  47. Huang, J.K.; Pu, J.; Hsu, C.L.; Chiu, M.H.; Juang, Z.Y.; Chang, Y.H.; Chang, W.H.; Iwasa, Y.; Takenobu, T.; Li, L.J. Large-Area Synthesis of Highly Crystalline WSe2 Monolayers and Device Applications. ACS Nano 2014, 8, 923–930. [Google Scholar] [CrossRef] [Green Version]
  48. Chen, C.-H.; Wu, C.-L.; Pu, J.; Chiu, M.-H.; Kumar, P.; Takenobu, T.; Li, L.-J. Hole Mobility Enhancement and p -Doping in Monolayer WSe2 by Gold Decoration. 2D Mater. 2014, 1, 034001. [Google Scholar] [CrossRef] [Green Version]
  49. Zeng, H.; Liu, G.B.; Dai, J.; Yan, Y.; Zhu, B.; He, R.; Xie, L.; Xu, S.; Chen, X.; Yao, W.; et al. Optical Signature of Symmetry Variations and Spin-Valley Coupling in Atomically Thin Tungsten Dichalcogenides. Sci. Rep. 2013, 3, 1608. [Google Scholar] [CrossRef] [Green Version]
  50. Ross, J.S.; Wu, S.; Yu, H.; Ghimire, N.J.; Jones, A.M.; Aivazian, G.; Yan, J.; Mandrus, D.G.; Xiao, D.; Yao, W.; et al. Electrical Control of Neutral and Charged Excitons in a Monolayer Semiconductor. Nat. Commun. 2013, 4, 1474. [Google Scholar] [CrossRef] [Green Version]
  51. Komsa, H.-P.; Krasheninnikov, A.V. Two-Dimensional Transition Metal Dichalcogenide Alloys: Stability and Electronic Properties. J. Phys. Chem. Lett. 2012, 3, 3652–3656. [Google Scholar] [CrossRef]
  52. Ramasubramaniam, A. Large Excitonic Effects in Monolayers of Molybdenum and Tungsten Dichalcogenides. Phys. Rev. B Condens. Matter Mater. Phys. 2012, 86, 115409. [Google Scholar] [CrossRef] [Green Version]
  53. Chang, Y.-H.; Zhang, W.; Zhu, Y.; Han, Y.; Pu, J.; Chang, J.-K.; Hsu, W.-T.; Huang, J.-K.; Hsu, C.-L.; Chiu, M.-H.; et al. Monolayer MoSe2 Grown by Chemical Vapor Deposition for Fast Photodetection. ACS Nano 2014, 8, 8582–8590. [Google Scholar] [CrossRef] [Green Version]
  54. Lu, A.Y.; Zhu, H.; Xiao, J.; Chuu, C.P.; Han, Y.; Chiu, M.H.; Cheng, C.C.; Yang, C.W.; Wei, K.H.; Yang, Y.; et al. Janus Monolayers of Transition Metal Dichalcogenides. Nat. Nanotechnol. 2017, 12, 744–749. [Google Scholar] [CrossRef] [Green Version]
  55. Zhao, W.; Ghorannevis, Z.; Amara, K.K.; Pang, J.R.; Toh, M.; Zhang, X.; Kloc, C.; Tan, P.H.; Eda, G. Lattice Dynamics in Mono- and Few-Layer Sheets of WS2 and WSe2. Nanoscale 2013, 5, 9677–9683. [Google Scholar] [CrossRef] [Green Version]
  56. Conley, H.J.; Wang, B.; Ziegler, J.I.; Haglund, R.F.; Pantelides, S.T.; Bolotin, K.I. Bandgap Engineering of Strained Monolayer and Bilayer MoS2. Nano Lett. 2013, 13, 3626–3630. [Google Scholar] [CrossRef] [Green Version]
  57. Ding, Y.; Wang, Y.; Ni, J.; Shi, L.; Shi, S.; Tang, W. First Principles Study of Structural, Vibrational and Electronic Properties of Graphene-like MX2 (M = Mo, Nb, W, Ta; X = S, Se, Te) Monolayers. Phys. B Condens. Matter 2011, 406, 2254–2260. [Google Scholar] [CrossRef]
  58. Zhang, W.; Chuu, C.P.; Huang, J.K.; Chen, C.H.; Tsai, M.L.; Chang, Y.H.; Liang, C.T.; Chen, Y.Z.; Chueh, Y.L.; He, J.H.; et al. Ultrahigh-Gain Photodetectors Based on Atomically Thin Graphene-MoS2 Heterostructures. Sci. Rep. 2015, 4, 3826. [Google Scholar] [CrossRef] [Green Version]
  59. Amin, B.; Kaloni, T.P.; Schwingenschlögl, U. Strain Engineering of WS2, WSe2, and WTe2. RSC Adv. 2014, 4, 34561–34565. [Google Scholar] [CrossRef]
  60. Peimyoo, N.; Shang, J.; Cong, C.; Shen, X.; Wu, X.; Yeow, E.K.L.; Yu, T. Nonblinking, Intense Two-Dimensional Light Emitter: Monolayer WS2 Triangles. ACS Nano 2013, 7, 10985–10994. [Google Scholar] [CrossRef]
  61. Gutiérrez, H.R.; Perea-López, N.; Elías, A.L.; Berkdemir, A.; Wang, B.; Lv, R.; López-Urías, F.; Crespi, V.H.; Terrones, H.; Terrones, M. Extraordinary Room-Temperature Photoluminescence in Triangular WS2 Monolayers. Nano Lett. 2013, 13, 3447–3454. [Google Scholar] [CrossRef] [PubMed] [Green Version]
  62. Kang, J.; Tongay, S.; Li, J.; Wu, J. Monolayer Semiconducting Transition Metal Dichalcogenide Alloys: Stability and Band Bowing. J. Appl. Phys. 2013, 113, 143703. [Google Scholar] [CrossRef]
  63. Cao, Q.; Dai, Y.-W.; Xu, J.; Chen, L.; Zhu, H.; Sun, Q.-Q.; Zhang, D.W. Realizing Stable P-Type Transporting in Two-Dimensional WS2 Films. ACS Appl. Mater. Interfaces 2017, 9, 18215–18221. [Google Scholar] [CrossRef] [PubMed]
  64. Wang, J.; Jia, R.; Huang, Q.; Pan, C.; Zhu, J.; Wang, H.; Chen, C.; Zhang, Y.; Yang, Y.; Song, H.; et al. Vertical WS2/SnS2 van Der Waals Heterostructure for Tunneling Transistors. Sci. Rep. 2018, 8, 17755. [Google Scholar] [CrossRef] [Green Version]
  65. Smyth, C.M.; Addou, R.; McDonnell, S.; Hinkle, C.L.; Wallace, R.M. WSe2-Contact Metal Interface Chemistry and Band Alignment under High Vacuum and Ultra High Vacuum Deposition Conditions. 2D Mater. 2017, 4, 025084. [Google Scholar] [CrossRef]
  66. Schulman, S.D.; Arnold, A.J.; Das, S. Contact Engineering for 2D Materials and Devices. Chem. Soc. Rev. 2018, 47, 3037–3058. [Google Scholar] [CrossRef]
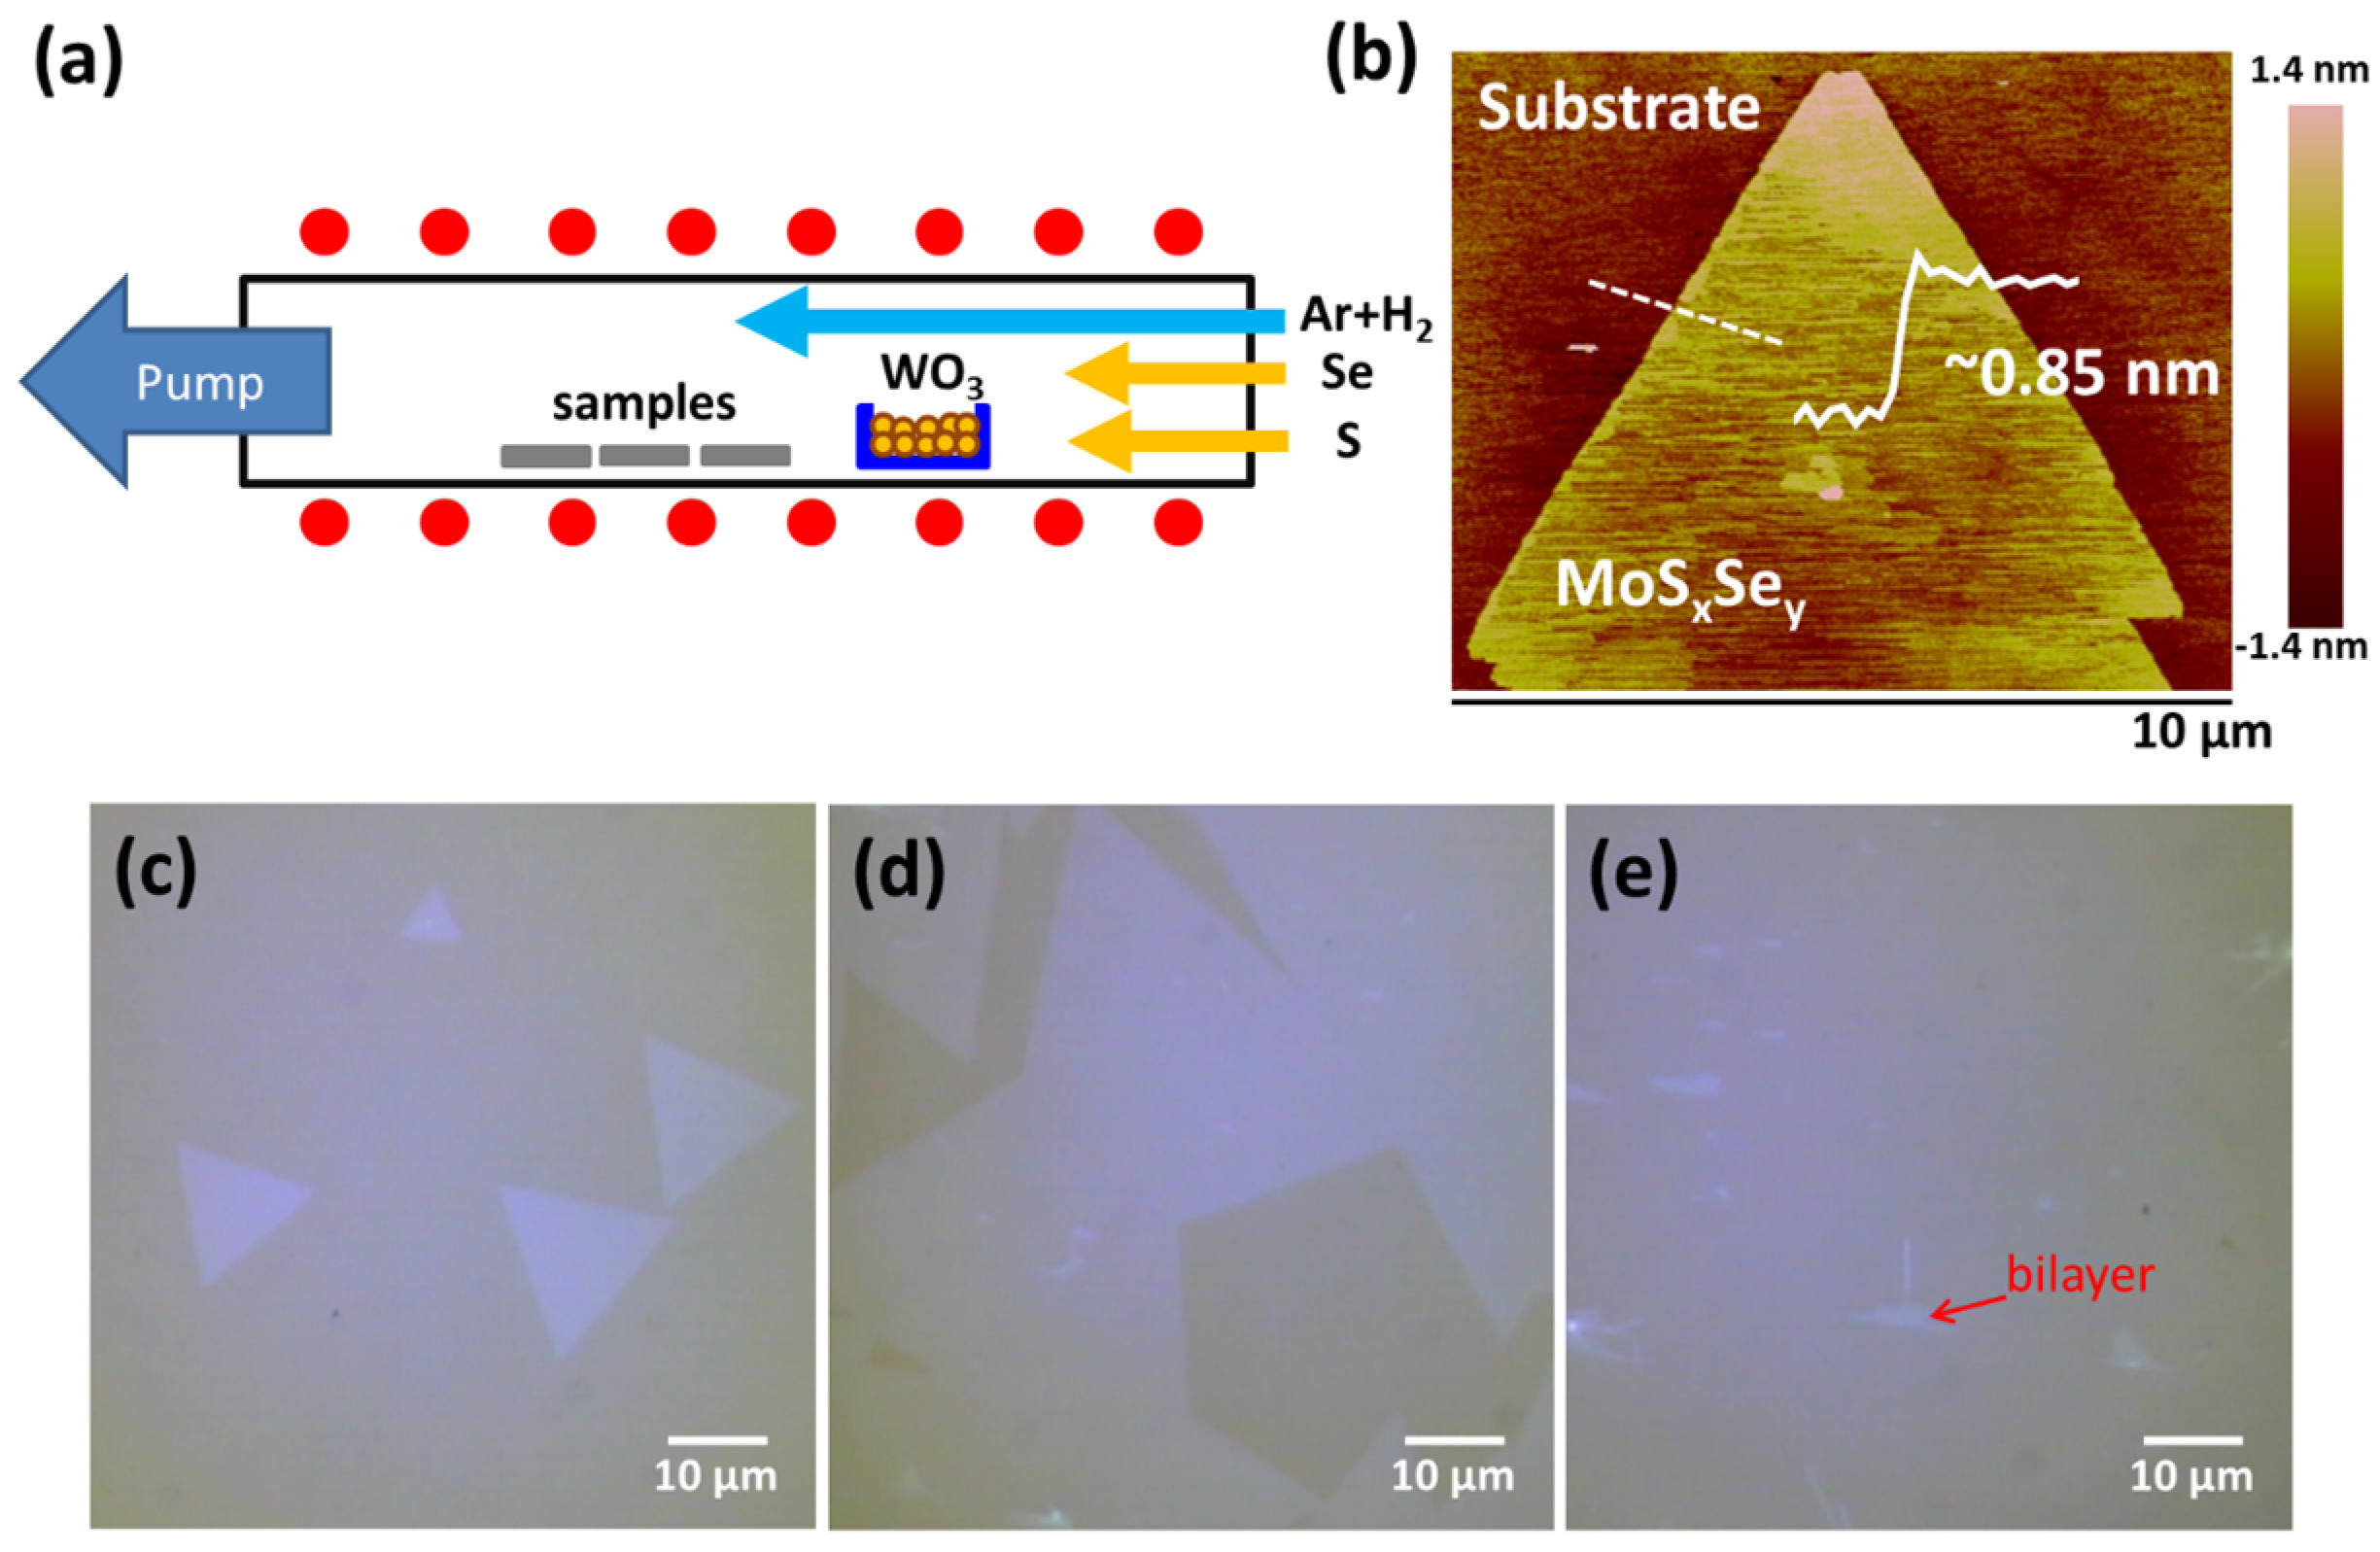
Figure 1. (a) Schematic illustration for the growth of WSxSey monolayers on sapphire substrates in a CVD furnace. (b) The AFM image of the WSxSey monolayers. (ce) Optical micrograph of the monolayer WSxSey flakes and film, where the difference is the location of the substrates in the furnace.
Nanomaterials 13 02107 g001
Figure 2. (a) Photoluminescence spectra for the WS2, WSxSey at Ts = 120, 110, 100, 90, and 80 °C, and WSe2 monolayers. (b) Optical absorption spectra for the WS2, WSxSey at Ts = 120, 110, 100, 90, and 80 °C, and WSe2 monolayers.
Nanomaterials 13 02107 g002
Figure 3. (a) Raman spectra for the WS2, WSxSey at Ts = 120, 110, 100, 90, and 80 °C, and WSe2 monolayers. The (b) Δwavenumber and (c) FWHM of WS2-related A1g and E 2 g 1 mode and WSe2-related E 2 g 1 mode as a function of Se stoichiometry concentration in the WSxSey monolayers. The Δwavenumber is the Raman shift referenced to pristine characteristic peaks.
Nanomaterials 13 02107 g003
Figure 4. (a) Optical micrograph of the monolayer WSxSey flakes grown in the Ts = 120 °C process. Typical PL (b) intensity and (c) position mappings of the isolated WSxSey monolayer. Raman (d) intensity and (e) position mappings for the WS2-related A1g mode at 415.7 cm−1. Raman (f) intensity and (g) position mappings for the WSe2-related E 2 g 1 mode at 265 cm−1.
Nanomaterials 13 02107 g004
Figure 5. XPS scans for the W, S, and Se binding energies for the WS2, WSxSey at Ts = 120, 110, 100, 90 and 80 °C, and WSe2 monolayers. The magnitude of each profile is normalized for easier comparison.
Nanomaterials 13 02107 g005
Figure 6. Ultraviolet photoemission spectroscopy and energy band diagrams. (a) UPS spectra near the Fermi level energy and valence band maximum of the monolayer WS2, WSxSey at Ts = 120, 110, 100, 90, and 80 °C, and WSe2 film transferred onto the 60 nm Au-coated Si substrates. (b) The onset level (Eonset) of the UPS spectra, where the work function (Φ) can be calculated by Φ = hν − Eonset. Here, hν is the incident photon energy of 21.2 eV. (c) The energy band diagrams of the WS2, WSxSey at Ts = 120, 110, 100, 90, and 80 °C, and WSe2 monolayers. (d) The band gap and (e) the energy band diagram as a function of Se stoichiometry concentration in the WSxSey monolayers.
Nanomaterials 13 02107 g006
Disclaimer/Publisher’s Note: The statements, opinions and data contained in all publications are solely those of the individual author(s) and contributor(s) and not of MDPI and/or the editor(s). MDPI and/or the editor(s) disclaim responsibility for any injury to people or property resulting from any ideas, methods, instructions or products referred to in the content.