Article

Selective Thermal and Photocatalytic Decomposition of Aqueous Hydrazine to Produce H2 over Ag-Modified TiO2 Nanomaterial

by
Shaeel Ahmed Althabaiti
1,
Zaheer Khan
1,*,
Katabathini Narasimharao
1,
Salem Mohamed Bawaked
1,
Soad Zahir Al-Sheheri
1,
Mohamed Mokhtar
1 and
Maqsood Ahmad Malik
2,*
1
Chemistry Department, Faculty of Science, King Abdulaziz University, P.O. Box 80203, Jeddah 21589, Saudi Arabia
2
Department of Chemistry, Faculty of Natural Sciences, Jamia Millia Islamia, New Delhi-110025, India
*
Authors to whom correspondence should be addressed.
Nanomaterials 2023, 13(14), 2076; https://doi.org/10.3390/nano13142076
Submission received: 2 April 2023 / Revised: 6 July 2023 / Accepted: 10 July 2023 / Published: 15 July 2023
(This article belongs to the Special Issue Nanoscale Materials as Catalysts for the Hydrogen Evolution Reaction)

Abstract

:
An Ag-modified TiO2 nanomaterial was prepared by a one-pot synthesis method using tetra butyl titanate, silver nitrate, and sodium hydroxide in water at 473 K for 3 h. X-ray diffraction, scanning electron microscopy, and transmission electron microscopy were used to determine the structure and morphology of the synthesized Ag-modified TiO2 nanomaterial. The diffuse reflectance UV-visible and photoluminescence spectroscopy results revealed that metallic Ag nanoparticles decreased the optical band gap and photoluminescence intensity of the TiO2. In addition, the Raman peak intensity and absorbance were increased after Ag modification onto TiO2. The photocatalytic efficiency of the synthesized samples was tested for decomposition of aqueous hydrazine solution under visible light irradiation. The photocatalytic efficiency of Ag-modified TiO2 nanomaterials was higher than that of bare TiO2 and Ag metal NPs due to the synergistic effect between the Ag metal and TiO2 structures. In addition, the surface plasmon resonance (SPR) electron transfer from Ag metal particles to the conduction band of TiO2 is responsible for superior activity of TiO2-Ag catalyst. The Ag-modified TiO2 nanomaterials offered a 100% H2 selectivity within 30 min of reaction time and an apparent rate constant of 0.018 min−1 with an activation energy of 34.4 kJ/mol under visible light radiation.

1. Introduction

Hydrogen has been considered as an alternate source of clean energy. The production of hydrogen from the splitting of water [1,2], photocatalysis [3,4], and decomposition of hydrogen chemical storage materials with different catalysts [5,6], especially nanosized oxides, have been the subject of interest for many years [7]. Hydrazine hydrate (N2H4·H2O) is a well-known hydrogen storage material with an excellent hydrogen storage content (8.0 wt.%), and it produces H2 and N2 when it is completely decomposed, which has been considered as a green process [8]. Hydrazine hydrate can decompose via two major reaction pathways: (i) decomposition to H2 and N2 (Equation (1), complete decomposition) and (ii) decomposition to N2 and NH3 (Equation (2), incomplete decomposition) [9]. Complete decomposition is the desired process to produce H2 with high yields without the formation of byproducts such as NH3, which could lead to catalyst deactivation and environmental pollution. However, the formation of NH3 is thermodynamically favorable; therefore, utilization of a suitable catalyst that selectively decomposes hydrazine hydrate to H2 and N2 is necessary [9].
N H 2 N H 2 2 H 2 + N 2   ( C o m p l e t e   d e c o m p o s i t i o n )  
3 N H 2 N H 2 4 N H 3 + N 2   ( I n c o m p l e t e   d e c o m p o s i t i o n )  
Different types of catalysts such as Rh–Ni/GO, Ir-Ni stabilized by CTAB, Fe-B/MWCNTs, and TiO2-modified Rh (I) coordinated catechol phosphane ligand were used for the selective decomposition of hydrazine hydrate to produce H2. However, these catalysts are expensive catalytic systems, which require multiple synthetic procedures [10]. Semiconductor-based photocatalysts such as TiO2, ZnO, and g-C3N4, etc., are widely used for solar-light-driven photocatalytic degradations of pollutants, the oxidation of VOCs, CO2 reduction, and hydrogen generation [11]. Nowadays, TiO2-based photocatalysts receive great interest due to their photocatalytic activities, chemical stabilities in aqueous solutions, and favorable band gap energies [12,13]. However, its broad band gap (3.0 eV for rutile and 3.2 eV for anatase) and high e/h+ recombination restrict its photocatalytic performance, resulting in confined use [14]. Moreover, pure TiO2 has poor photoelectronic transition efficiency because it can only absorb UV light (λ < 350 nm), which accounts for around 4% of the solar spectrum, into photocatalytic processes [15,16]. On the other hand, metal-modified TiO2 has been used as a photocatalyst under visible and solar light irradiations for H2 generation via water splitting [17]. Therefore, various efforts have been devoted to tuning the band gap and electronic structure of TiO2 by doping transition metals [18,19], nonmetals [20], noble metals [21], and through sensitization with dyes [22] for the improvement of its photocatalytic activity in the visible light region. It is well established that the photocatalytic activity of TiO2 depends on the nature of metals and/or nonmetals and is extensively used for H2 generation from splitting reactions under visible light irradiation (λ > 400 nm) for fuel cells [23,24]. Certain noble metals, such as Pt, Au, Pd, and Ag, can be deposited on TiO2 to increase the H2 production rate by photocatalysis [25]. A UV-active TiO2 photocatalyst can be successfully modified to a visible-light-induced photocatalyst by modifying the surface of the TiO2 by the successful deposition of metal ions [26,27]. It is beneficial to develop a TiO2-based photocatalyst for H2 generation, involving hydrazine decomposition under visible light radiation. Kumar et al. [28] and Luo et al. [29] used Rh-doped TiO2 and face-centered indium–ionic liquid nanocubes as the catalysts for H2 production by hydrazine decomposition under visible light irradiation. However, there is no report available in the literature on photocatalytic H2 production by hydrazine decomposition with Ag-modified TiO2 nanomaterials under visible light. Hence, this research aims to demonstrate the utilization of an Ag-modified TiO2 nanomaterial for the photocatalytic decomposition of hydrazine for H2 generation.
In this contribution, an Ag-modified TiO2 nanomaterial was synthesized by following the one-pot synthesis approach and used for the photocatalytic decomposition of hydrazine under visible light. The H2 generation rates were studied by varying the hydrazine concentrations, amounts of photocatalyst, pHs, and reaction temperatures. However, fast H2 generation within a short reaction time has yet to be examined. Furthermore, the synthesized materials were characterized with different techniques to investigate their physicochemical properties and relationships to photocatalytic performance.

2. Experimental Procedure

2.1. Chemicals

The metal precursors titanium (IV) butoxide (Ti(O-CH2-CH2-CH2-CH3)4, molar mass = 340.3 g/mol, reagent grade, 97%) and silver nitrate (AgNO3, 99%) were received from Sigma Aldrich and used for the synthesis of the Ag-modified TiO2 nanomaterial. Hydrazine anhydrous (NH2NH2, 98%) and sodium hydroxide (NaOH) were utilized as the sources of hydrogen and to control the pH of the solution, respectively. Double-distilled water was used for the preparation of all solutions. The NaOH solution was prepared and standardized with standard oxalic acid using phenolphthalein as an indicator.

2.2. Synthesis of Ag-Modified TiO2 Nanomaterial

The one-pot synthesis method was employed to prepare Ag-modified TiO2 nanomaterials with slight modifications [30]. In a typical procedure, a solution containing titanium (IV) butoxide (0.05 mol/L of 5.5 mL) and silver nitrate (20 mL of 1.0 mM) was placed in a round bottom flask, and pure nitrogen gas was bubbled through the solution to maintain an inert atmosphere. The pH of the contents was adjusted to ca. 9.5 by adding a diluted NaOH solution, promoting the formation of Ti and Ag hydroxides. The obtained suspension was then heated at 473 K for 3 h. After these steps, the solid material was recovered by centrifugation and washed with acetone and water. The obtained material was dried under vacuum for 12 h at 353 K and stored in a brown glass container. The bare TiO2 nanoparticles sample was obtained without the addition of silver nitrate solution (Equations (3) and (4)).
T i ( O ( C H 2 ) 3 C H 3 ) 4 + 4 N a O H T i ( O H ) 4 + 4 C H 3 ( C H 2 ) 3 O N a  
T i ( O H ) 4 + H e a t T i O 2  

2.3. Photocatalytic Activity Test

The photocatalytic activity of the synthesized pure TiO2 and Ag-modified TiO2 nanomaterial for the decomposition of aqueous hydrazine solution in the absence and presence of visible light was tested using a laboratory-built reactor setup. In a typical experiment, the Ag-modified TiO2 nanomaterial (20 mg) was added to 10 mL of deionized water in a reaction vessel; the required hydrazine solution was then injected into the reaction mixture, and then the reaction vessel was purged with an inert gas (He) flow of 90 mL/min for 30 min to remove the air. Finally, the total contents were subjected to monochromatic light irradiation (red LED lamp) with a maximal wavelength (λmax) of 600 nm and a power of 25 mWcm−2. For qualitative measurements for hydrogen gas, a Honeywell XCD Sense point gas detector was used. The gas detector was mounted on a mounting plate attached to the surface of a frame. The outlet of the reactor was connected to the sensor gas cap using tubing. When the produced gas reached the detector, the screen displayed the H2 concentration (vol% in the gas stream) during the run (approximately 3 min to obtain a reading). The volume of generated gases (hydrogen + nitrogen) was determined using the water displacement method at room temperature under pseudo-first-order conditions (excess of hydrazine) [31,32]. The rate constants (kobs) were calculated with Equation (5).
k o b s = 1 t l n ( V α V 0 V α V t )  
Vα = final volume of generated H2 + N2 at the completion of the reaction, V0 = volume of generated H2 + N2 at t = 0 min, and Vt = volume of generated H2 + N2 at different time intervals [33]. The kobs were estimated from the slopes of ln(VαV0/VαVt) plots versus times at different concentrations of hydrazine, amount of catalyst, and temperatures ranging from 295 K to 323 K. The gases released during the reaction were passed through a solution of Nessler’s reagent to ensure the formation of ammonia as the other side product. The same kinetic experiments were also performed in the dark. The catalyst reusability experiments were conducted over the recovered catalyst by adding the same amount of hydrazine to the reaction vessel after the complete evolution of hydrogen. A total of five cycles were tested using synthesized catalysts.

2.4. Characterization of Synthesized Nanomaterials

An X-ray diffractometer (RXD, Ragaku D-max 2200) was employed to establish the crystalline nature of the catalyst. Scherer’s equation: d (hkl) = 0.94 λ/β(cos2θ), where d (hkl) was the average crystallite size (nm), λ was the source of CuKα radiation applied (0.154 nm), and β was the full width at half maximum intensity of the XRD reflection observed at 2θ = 25.2° was used to determine the crystallite size. A transmission electron microscope (TEM, JEOL, JEM-1400Flash) and a scanning electron microscope (JEOL) were used to determine particles’ morphologies, shapes, sizes, and distributions in the synthesized catalysts. To measure TEM/SEM images, a small amount of catalyst was dispersed in ethanol and deposited on the carbon-coated copper grid. The solvent evaporated at room temperature, and then the images were recorded using an operating power of 120 kV. Energy-dispersive X-ray spectroscopy (EDS) determined the elemental composition of samples. Diffuse reflectance UV-visible spectra were recorded using a UV2550 spectrophotometer (Shimadzu, Japan). Photoluminescence spectra (PLS) were measured using an F-7000 fluorescence spectrophotometer (Hitachi, Japan). The textural properties, such as the BET surface areas, pore volumes, and pore sizes, of the catalysts were determined by nitrogen physisorption measurements using an Autosorb AsiQ (Quantachrome, USA) surface area analyzer. A SPECS GmbH X-ray photoelectron spectrometer measured the X-ray photoelectron spectra (XPS). A standard dual anode excitation source with Mg Kα (1253.6 eV) radiation was used at 13 kV and 100 W.

3. Results and Discussion

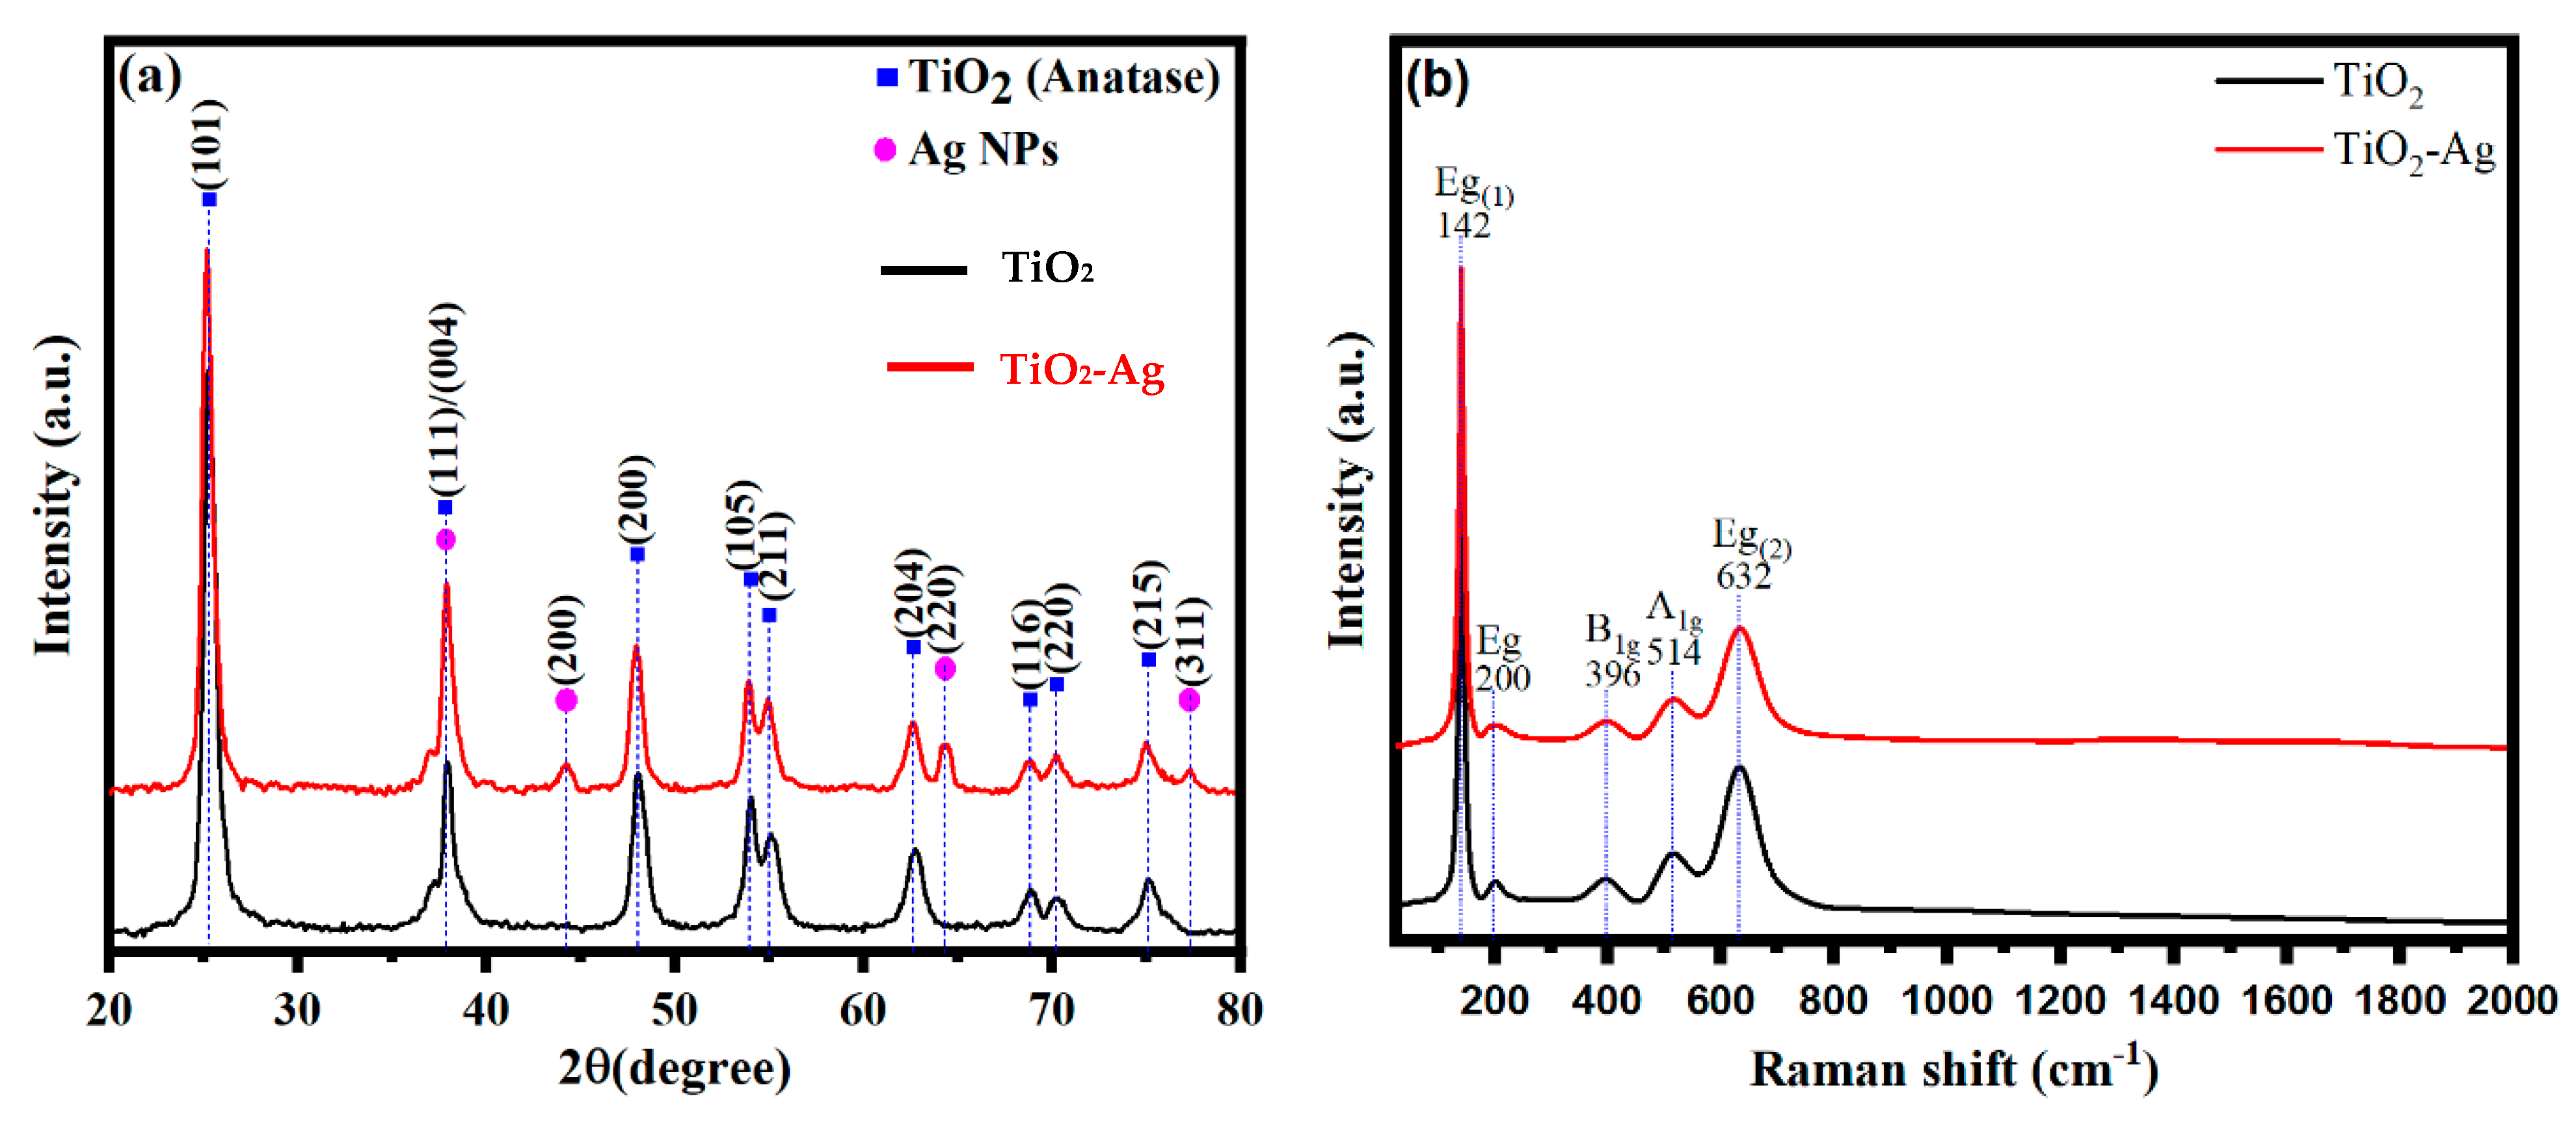
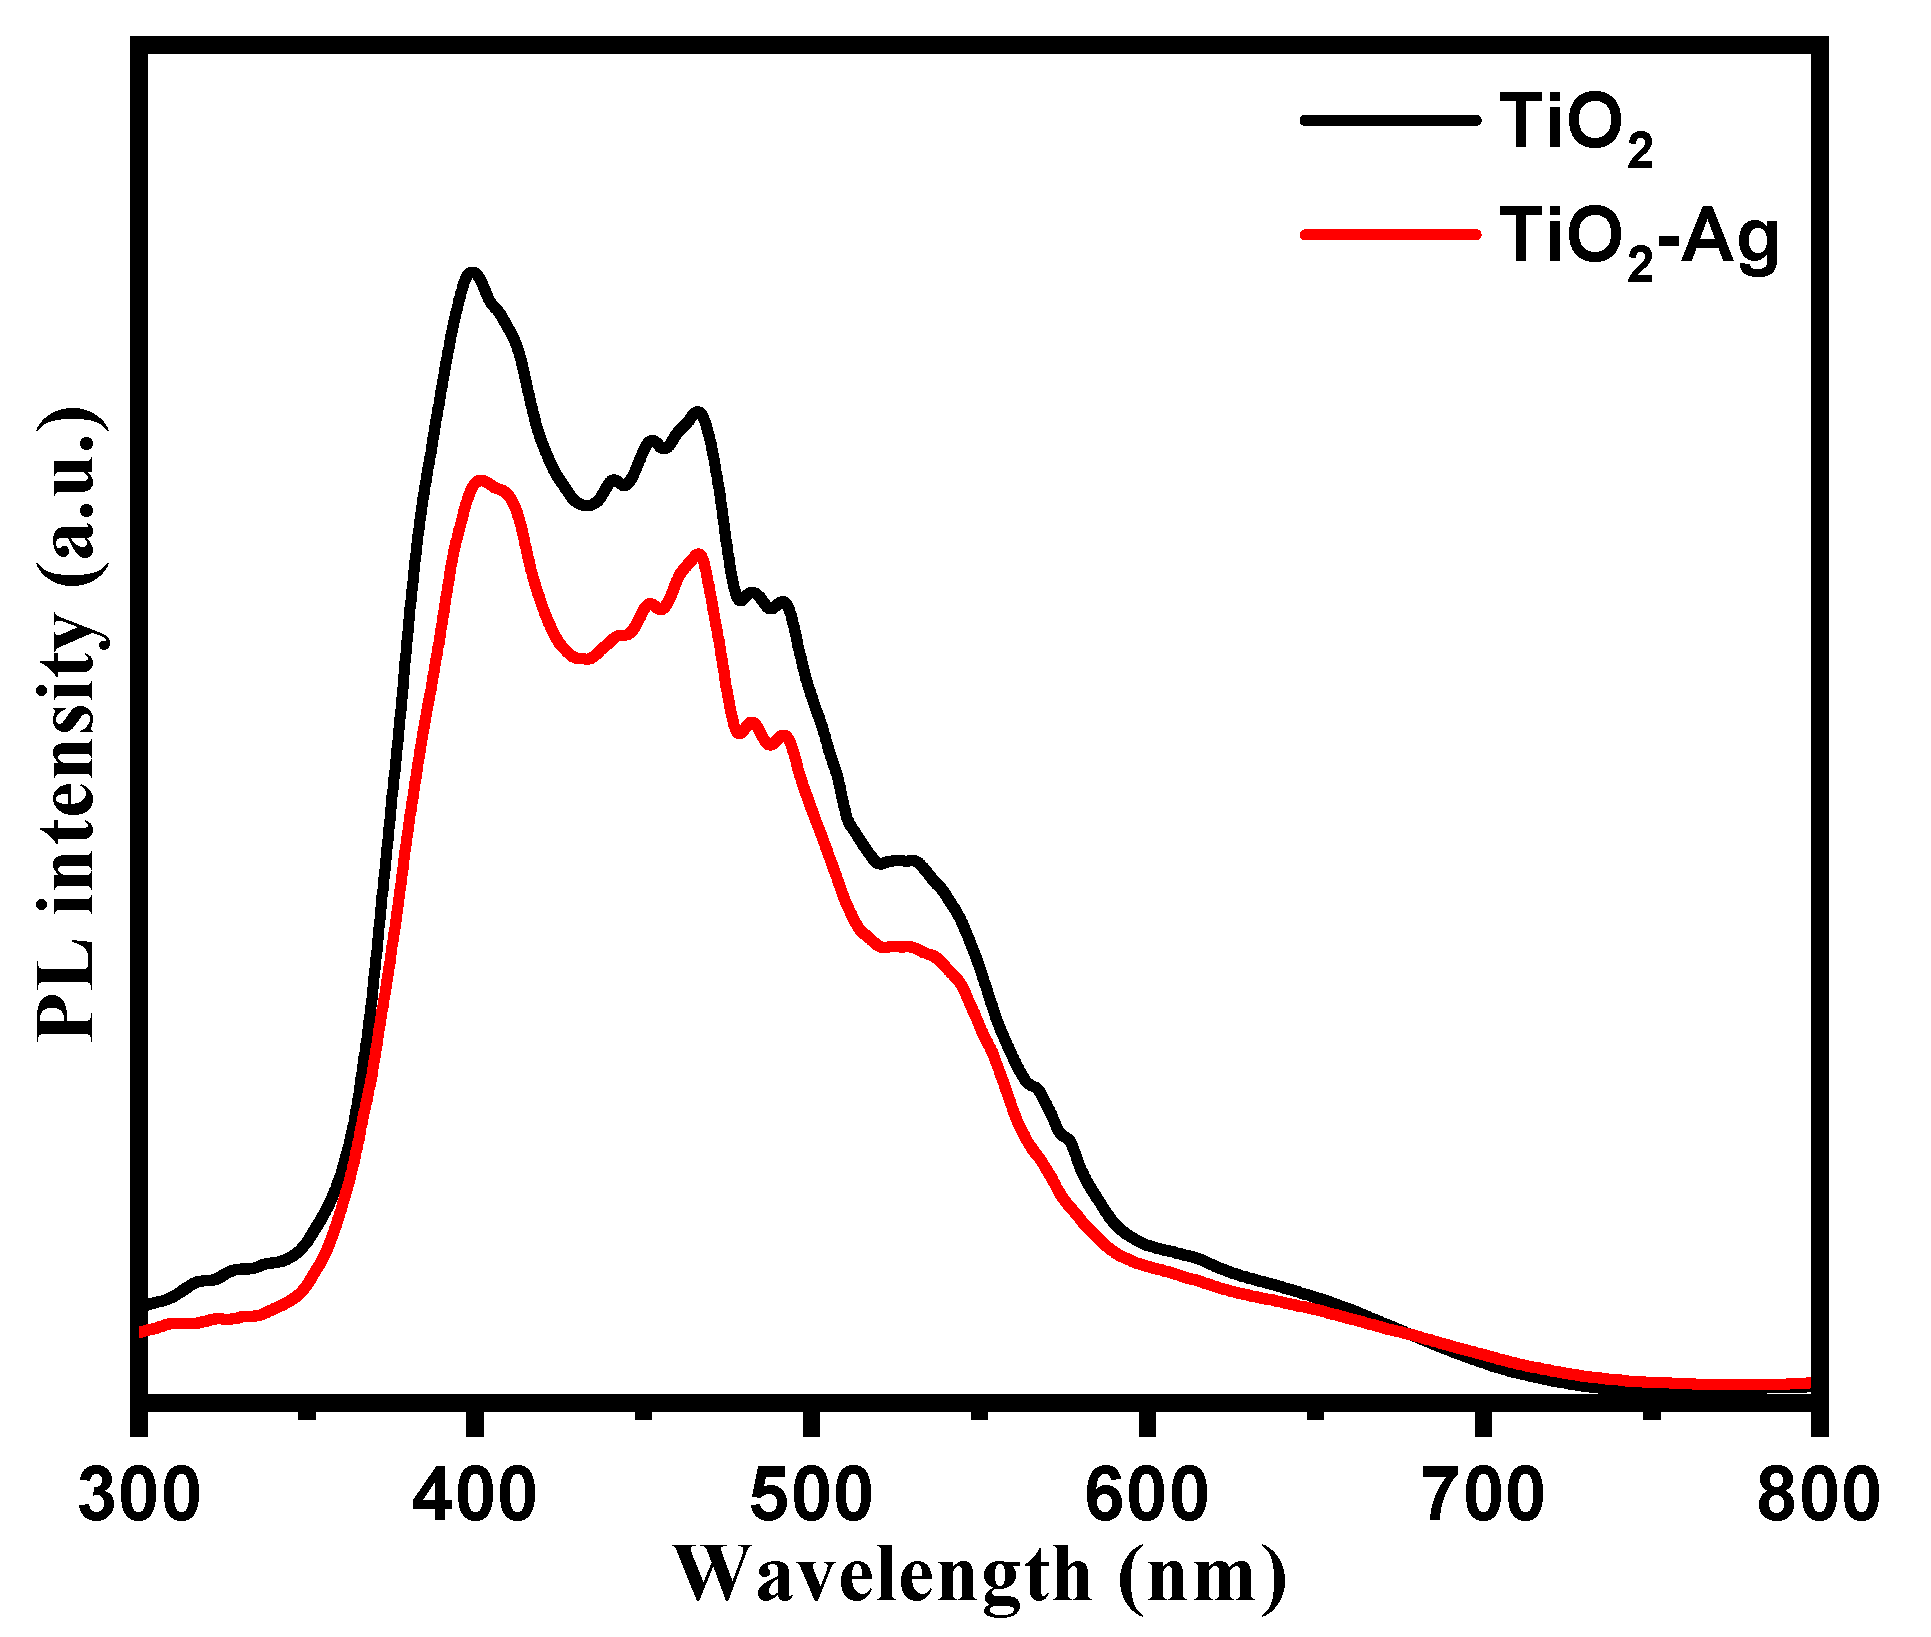
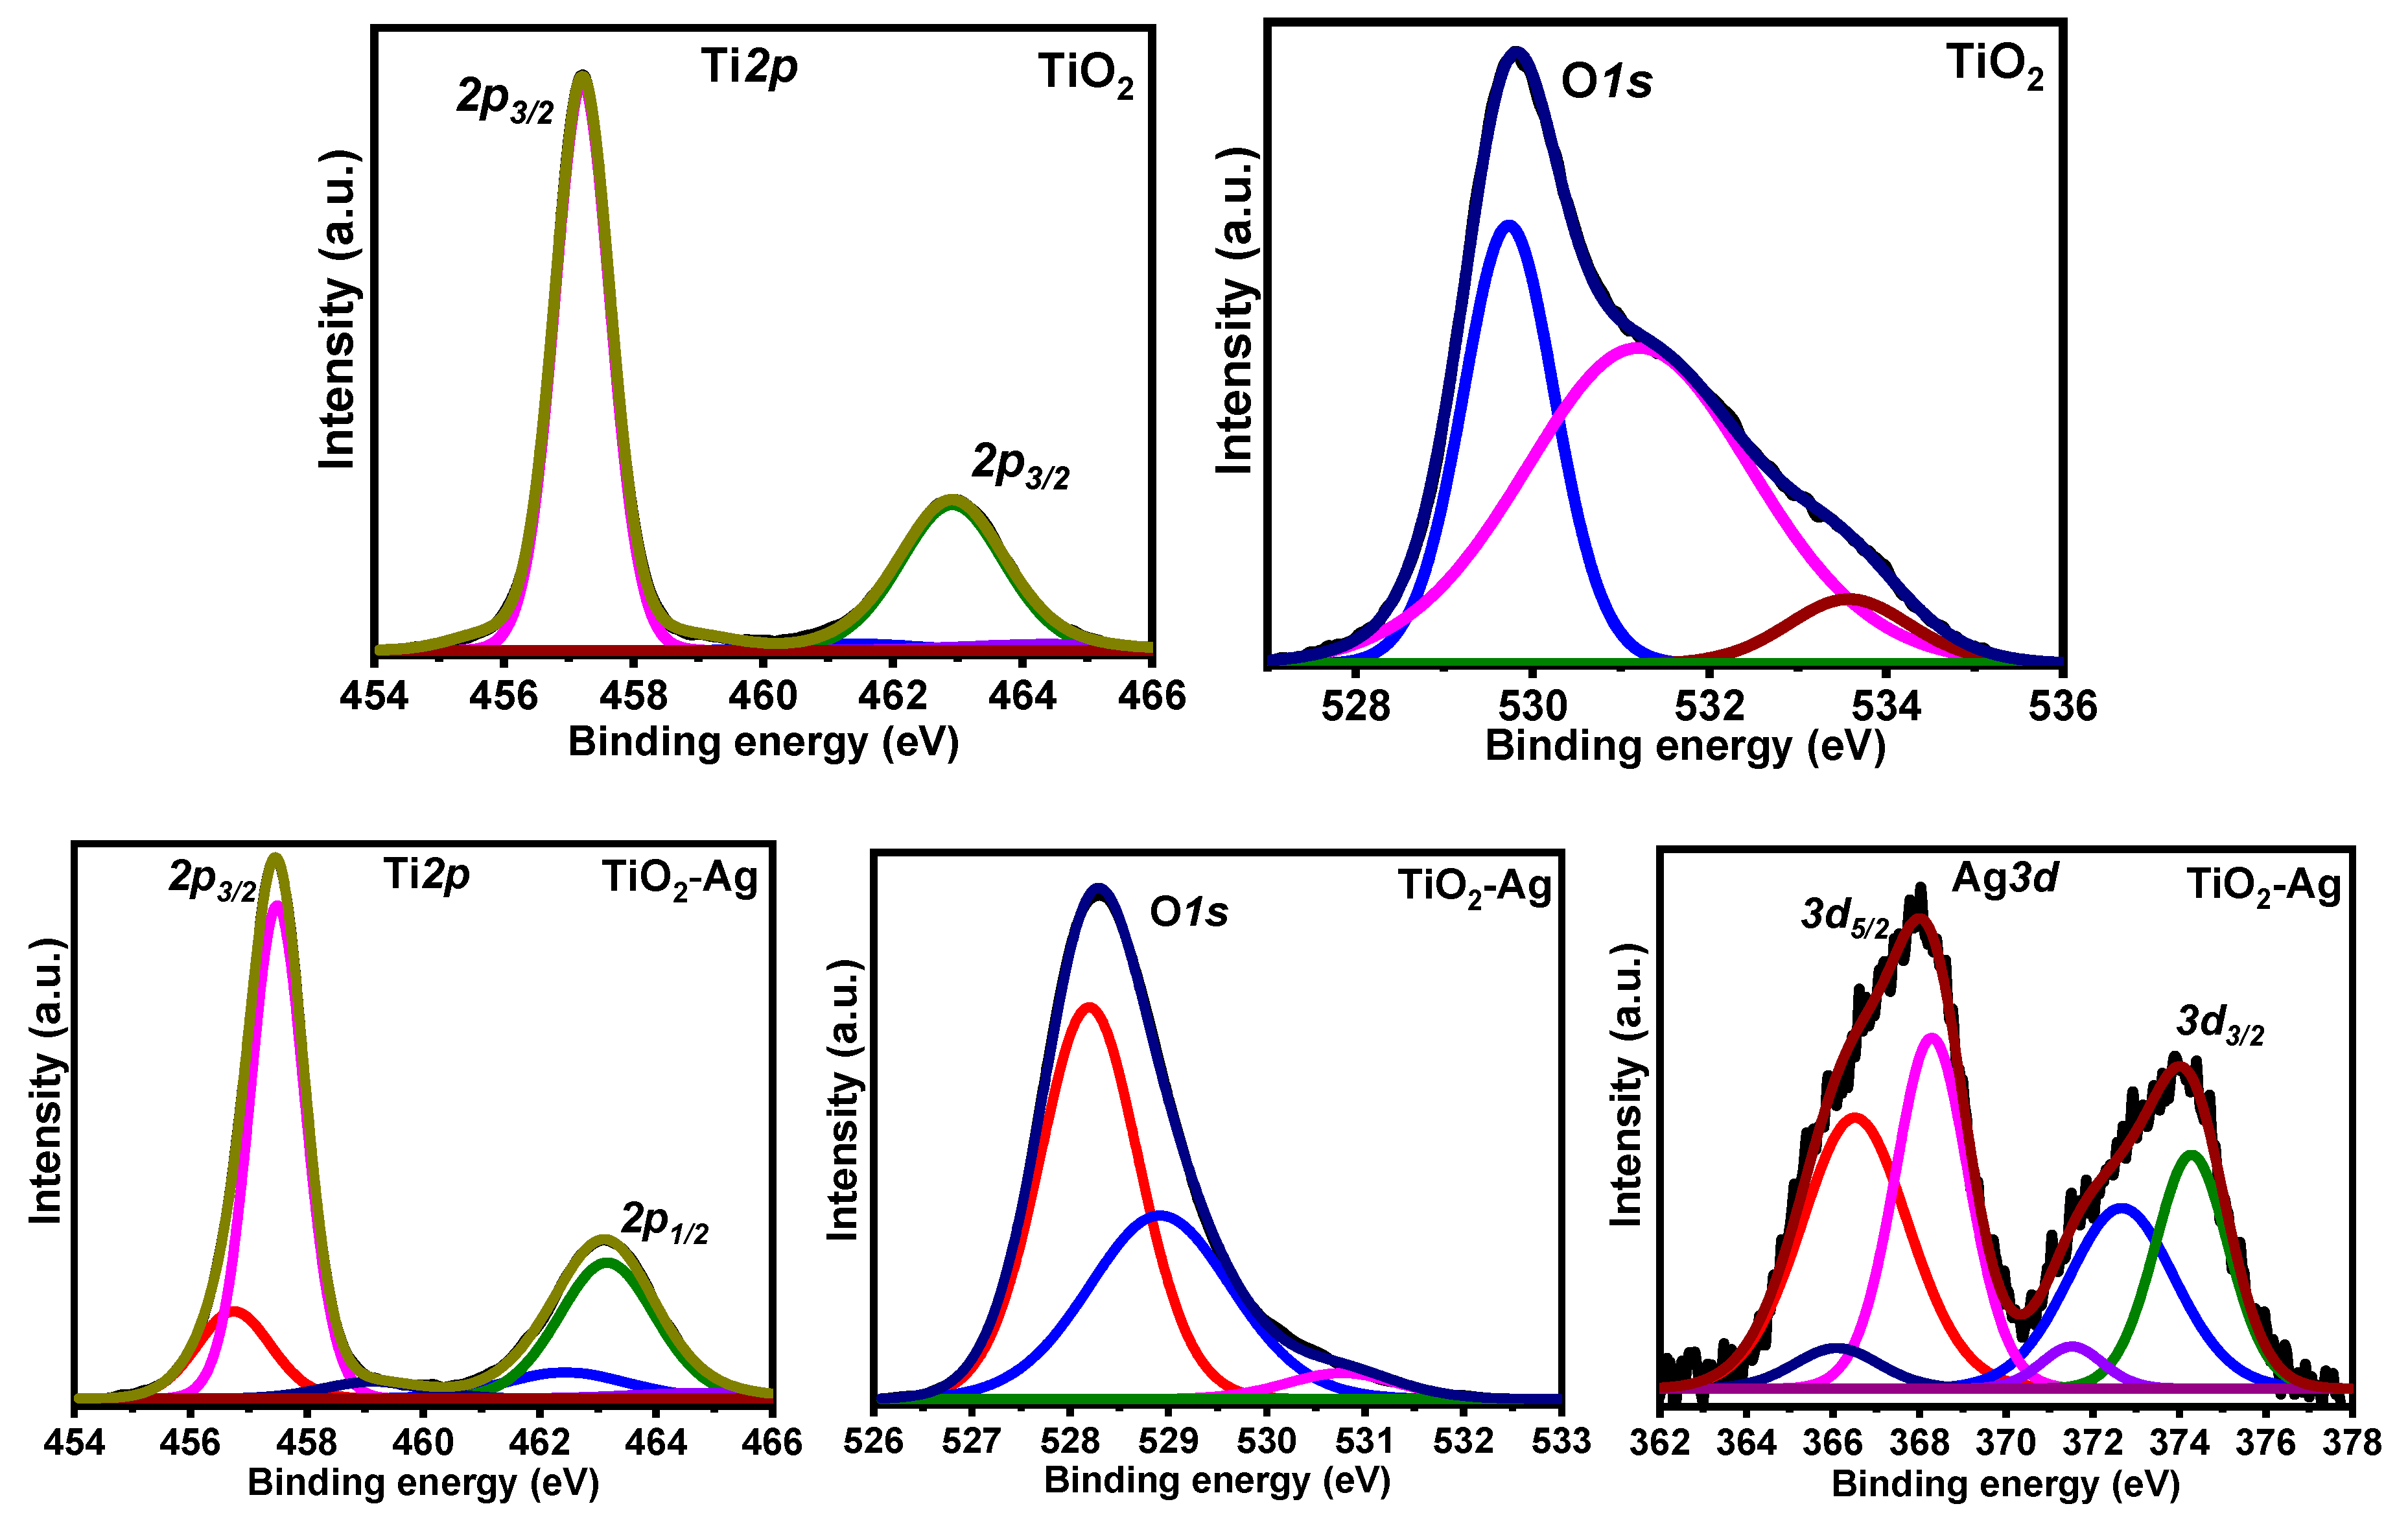
3.1. Catalysts Characterization

The crystalline phases present in the synthesized TiO2 nanomaterials were analyzed by recording the XRD patterns of the samples. Figure 1a shows XRD patterns of the bare TiO2 and Ag-modified TiO2 nanomaterials. For the bare TiO2 sample, the most intense peak was observed at 2θ = 25.2°, corresponding to the (101) plane of the anatase TiO2 phase [34].
The XRD patterns were compared with JCPDS file no. PDF 021-1272 data files. The prominent diffraction peaks that appeared at 2θ = 25.2°, 37.5°, 48.3°, 52.2°, 54.4°, 62.4°, 68.9°, 70.1°, and 75.5° could have been ascribed to the (101), (111), (200), (105), (211), (204), (116), (220), and (215) lattice planes of the anatase phase of the TiO2, respectively [32]. The additional XRD peaks that appeared at 2θ = 37.5°, 44.3°, 64.3°, and 78.2° for (004), (200), (220), and (311) were due to the face-centered cubic metallic silver phase (JCPDS no. 04-0783). No other diffraction peaks were observed in the XRD patterns, indicating the successful synthesis of the desired crystalline phases. The peak at 2θ = 37.5° was for both the (004) and (111) planes of the metallic silver (Ag0) and TiO2 phases, respectively. Liu et al. deposited the Ag0 on the TiO2 nanosheets by a complex microwave chemical reduction method [35] and reported a similar observation. The average crystallite sizes (d) of TiO2 and Ag0 in the Ag-modified TiO2 nanomaterials were calculated from Debye–Scherer’s equation and were about 15 nm and 10 nm, respectively.
The plasmonic Ag nanomaterials on the TiO2 surface could enhance the optical properties of TiO2 and be used as a Raman scattering agent for detecting bioorganic molecules [36]. Therefore, the Raman spectra of the TiO2 and Ag-modified TiO2 samples were recorded. Figure 1b shows the Raman spectra of bare TiO2 and Ag-modified TiO2 samples. The prominent characteristic Raman bands were observed at 142 cm−1, 200 cm−1, 396 cm−1, 514 cm−1, and 632 cm−1, suggesting a pure anatase form (Figure 1b, black line). The Raman band intensity was increased due to presence of plasmonic Ag0 nanoparticles (Figure 1b, red line). Mills et al. [37] and Yang et al. [38] also reported a similar observation, detailing that the Raman signals’ Ag-TiO2 frequency increased with the amount of metallic silver in the samples. Interestingly, the band positions of TiO2 remained unchanged after the Ag0 modification in the Raman spectrum, indicating that the Ag0 particles dispersed on the surface and were not incorporated in the TiO2‘s crystal structure. The surface-enhanced Raman scattering of Ag-modified TiO2 could have been attributed to the surface Plasmon resonance of metallic silver nanoparticles.
The SEM and TEM images of Ag-modified TiO2 are shown in Figure 2a–d, respectively. The TEM images indicated that the Ag0 nanoparticles (black spots) were deposited onto the surface of TiO2 particles in an unsymmetrical manner, which led to the formation of a long aggregated spherical structure in the Ag-TiO2 composite structure. Yu et al. reported the synthesis of spherical TiO2 nanoparticles and observed a similar observation [39]. The high-resolution TEM images showed two TiO2 spherical particles agglomerated with each other, along with Ag-TiO2 interactive species on the surface. It is also clear that the high-resolution TEM showed the lattice fringes with an interplanar distance of 0.35 nm corresponding to the (101) plane of the Anatase crystal structure along the presence of dark spots corresponding to Ag metallic species. These observations suggested that the spherical Ag nanoparticles were highly dispersed onto the spherical TiO2 anatase nanoparticles [40]. This close interaction between Ag0 and TiO2 was believed to enhance the photogenerated electron transfer in the Ag-TiO2 nanomaterial [41]. The histograms obtained for TiO2 and Ag0 nanoparticles were obtained from the TEM image of the TiO2-Ag sample, and the results indicated the presence of TiO2 nanoparticles with an average particle size of 23 nm. In comparison, the sample possessed Ag0 nanoparticles with an average particle size of 7 nm. These observations were in accordance with the crystallite size measured from XRD results. The aqueous solution contained Ag+, Ti4+, [C4H9O], and [NO3] ions before precipitation by NaOH. In the solution state, Ag+ ions could start to receive free electrons in the solution to form an Ag0 metal atom (nucleation process). In the drying process, water began to evaporate. During calcination with N2 gas flow at temperatures from 673 K, the [C4H9O] and [NO3] species could decompose into some gases such as CO, CO2, H2, and NO2. The Ag nanoparticles started to grow after drying. The smaller Ag nanoparticles agglomerated into larger particles after calcination. It was previously reported that the calcination process under N2 gas flow could remove oxygen from possible Ag–O nanoparticles to produce the Ag metal nanoparticles [42].
The diffuse reflectance UV-vis spectrum of the bare TiO2 sample showed a broad band at 380 nm (Figure 3a), and the spectrum did not exhibit any specific peaks at higher wavelengths, as it had not absorbed visible light. On the other hand, the spectrum of the Ag-modified TiO2 sample showed two absorption peaks at 380 nm and 550 nm, which could have been ascribed to the absorption of the UV and visible light energy, respectively. The absorption edges of TiO2 were extended to the visible light region, which indicated that the optical band gap of TiO2 decreased after the modification of metallic silver. The optical band gaps of both the bare and Ag-modified TiO2 samples were estimated from the Tauc plots by following the relation (Equation (6)) [43].
( α h υ ) 2 = K ( h υ E g )  
where α is the absorbance value at a particular wavelength (λ in nm). K = an energy-independent constant, = incident photon energy (hC/λ = 1240/λ), h = Planck’s constant, C = speed of light, and Eg is optical band gap energy. Equation (6) can be written as Equation (7) for a known function.
( α 1240 λ ) 2 = 1240 λ E g  
Figure 3b,c was constructed between (α1240/λ)2 and 1240/λ; a straight line calculated the Eg extrapolated to the (α1240/λ)2 = 0 axis. The band gap of the Ag-modified TiO2 (Eg = 2.95 eV) was inferior to that of bare TiO2 (Eg = 3.09 eV), which suggested the enhancement of visible light absorption and the charge carrier efficiency of Ag-modified TiO2 in comparison to its parent material [44].
Figure 4 shows the PL spectra of bare TiO2 and Ag-modified TiO2 samples in the 300 to 600 nm range at room temperature. The PL spectra of the Ag-modified TiO2 sample exhibited a blue shift in comparison with the bare TiO2 sample. This sample showed three prominent emission peaks at ca. 410 nm, 460 nm, and 480 nm, corresponding to 3.02 eV, 2.69 eV, and 2.58 eV, respectively (Figure 4, red line). The blue emission peak at 410 nm was attributed to the free excitonic emission from the TiO2 (band-band photoluminescence phenomenon). The emission peak at 460 nm was due to the oxygen vacancies presented in the Ag-modified TiO2, whereas the peak at 480 nm could have been due to the bound excitations of surface defects [45]. In addition, a few minor emission peaks were observed in the range of 450 to 500 nm [46]. The photoluminescence peak intensities were decreased after the modification of TiO2 with silver species, indicating the enhanced suppression of e/h+ recombination, which was beneficial for hydrogen generation in the photocatalytic processes [47].
The X-ray photoelectron spectroscopy (XPS) analysis provided an insight into the surface elemental composition of the prepared nanomaterials. Figure 5 depicts the high-resolution deconvoluted O1s, Ti2p, and Ag3d XPS spectra for the synthesized samples. The XPS spectrum of the bare TiO2 sample showed the existence of Ti and O elements on the surface. On the other hand, the TiO2-Ag sample showed contributions due to the Ti, O, and Ag elements. The presence of doublet characterized the Ti+4 oxidation state for TiO2 due to Ti 2p3/2 and Ti 2p1/2 contributions at 457.1 eV and 462.9 eV, respectively [48]. However, the peak positions for Ti 2p shifted to higher binding energies (457.5 eV and 463.1 eV) for the TiO2-Ag sample due to the decrease in the surface electron density of TiO2 after Ag modification. This observation indicated that Ag species interacted with TiO2 nanoparticles in this sample. The deconvoluted Ti 2p XPS spectrum for the TiO2-Ag sample yielded two different peaks centered at 458.9 eV and 458.1 eV, ascribed to Ti4+ and Ti3+ species, respectively. This observation confirmed the existence of strong interaction between Ag and Ti in the TiO2-Ag sample. Visible-light-driven TiO2-Ag nanostructures may exhibit enhanced photocatalytic activities due to the presence of Ti3+ oxides with narrow band gaps. The O1s spectra of bare TiO2 and TiO2-Ag samples are also shown in Figure 5. The deconvoluted O1s spectrum for bare TiO2 sample showed three peaks at 529.8 eV, 531.2 eV, and 533.5 eV, ascribed to the oxygen of the Ti-O bonds in the TiO2, Ti-OH bonds, and surface OH groups, respectively. On the other hand, the O1s for the TiO2-Ag sample showed a different set of three peaks at binding energies of 528.2 eV, 528.9 eV, and 530.7 eV, corresponding to adsorbed O on Ag, the lattice oxygen of TiO2, and the adsorbed OH species, respectively [48].
These observations clearly indicated that the surface structure of the TiO2-Ag sample was different from bare TiO2. The deconvoluted Ag 3d spectrum of the TiO2-Ag sample showed three peaks for both Ag 3d5/2 and Ag 3d3/2 contributions. The Ag 3d5/2 peaks appeared at 368.3 eV, 366.5 eV, and 366.0 eV, corresponding to Ag0, Ag+, and the satellite peak for Ag0, respectively [49]. The binding energies of the Ag 3d peaks were relatively lower than the bulk Ag species, suggesting a strong interaction between the Ag and TiO2. Therefore, there was a clear possibility for the electron transfer from the TiO2 nanoparticles to metallic Ag. In addition, diffuse reflectance UV-vis spectra showed a plasmonic absorption band for the Ag0 species, indicating that the Ag0 species were on the surface of the TiO2 particles. The XPS findings showed that abundant Ag nanocrystals developed on the TiO2 nanoparticles, and the Ag and TiO2 interacted strongly at the interface of the TiO2-Ag nanostructures. As a result, the nanostructures were made up of Ti, O, and Ag elements, which agreed with the XRD results.
It is well known that the porosity of a photocatalyst is one of the physicochemical properties that could influence its photocatalytic efficiency [50]. To investigate the modification of Ag on the textural properties of the prepared TiO2 photocatalyst, N2 physisorption measurements for bare TiO2 and TiO2-Ag samples were performed. The N2 adsorption–desorption isotherm of the bare TiO2 sample exhibited a typical Type-V isotherm with a type D hysteresis loop (Figure 6), indicating the presence of bottleneck mesopores in the sample (IUPAC classification). Interestingly, the TiO2-Ag sample showed a unique inverse “S” shape isotherm. The adsorption isotherm showed a convex-shaped increase at its monolayer adsorption in the low-pressure range (P/P0 = 0 − 0.05), revealing the presence of micropores, and the multilayer adsorption occurred in the pressure range (P/P0 = 0.05 − 0.45). Then, the adsorption increased at the moderate pressure range (P/P0 = 0.35 − 0.9); then, at the latter part of the adsorption isotherm, the sharp rising presented a concave shape, indicating that the TiO2-Ag sample developed macropores, and capillary condensation occurred in the mesopores, indicating that this sample possessed three pore systems (micro-, meso-, and macropores) [51]. The pore size distribution patterns obtained by the NLDFT method presented in the inset of the adsorption–desorption isotherms, which revealed that the bare TiO2 sample possessed unimodal pores with an average pre-width of 2.8 nm. The TiO2-Ag sample exhibited a bimodal pore system, with an average pore width of 3 nm. The observed macropores could have been due to the random arrangements of the TiO2 and Ag metal nanoparticles creating large-size void spaces. The Brunauer–Emmett–Teller (BET) surface area was determined, and it was observed that the TiO2-Ag sample possessed a relatively high surface area (180.2 m2/g) compared to bare TiO2 (140.9 m2/g), probably due to the presence of micropores.

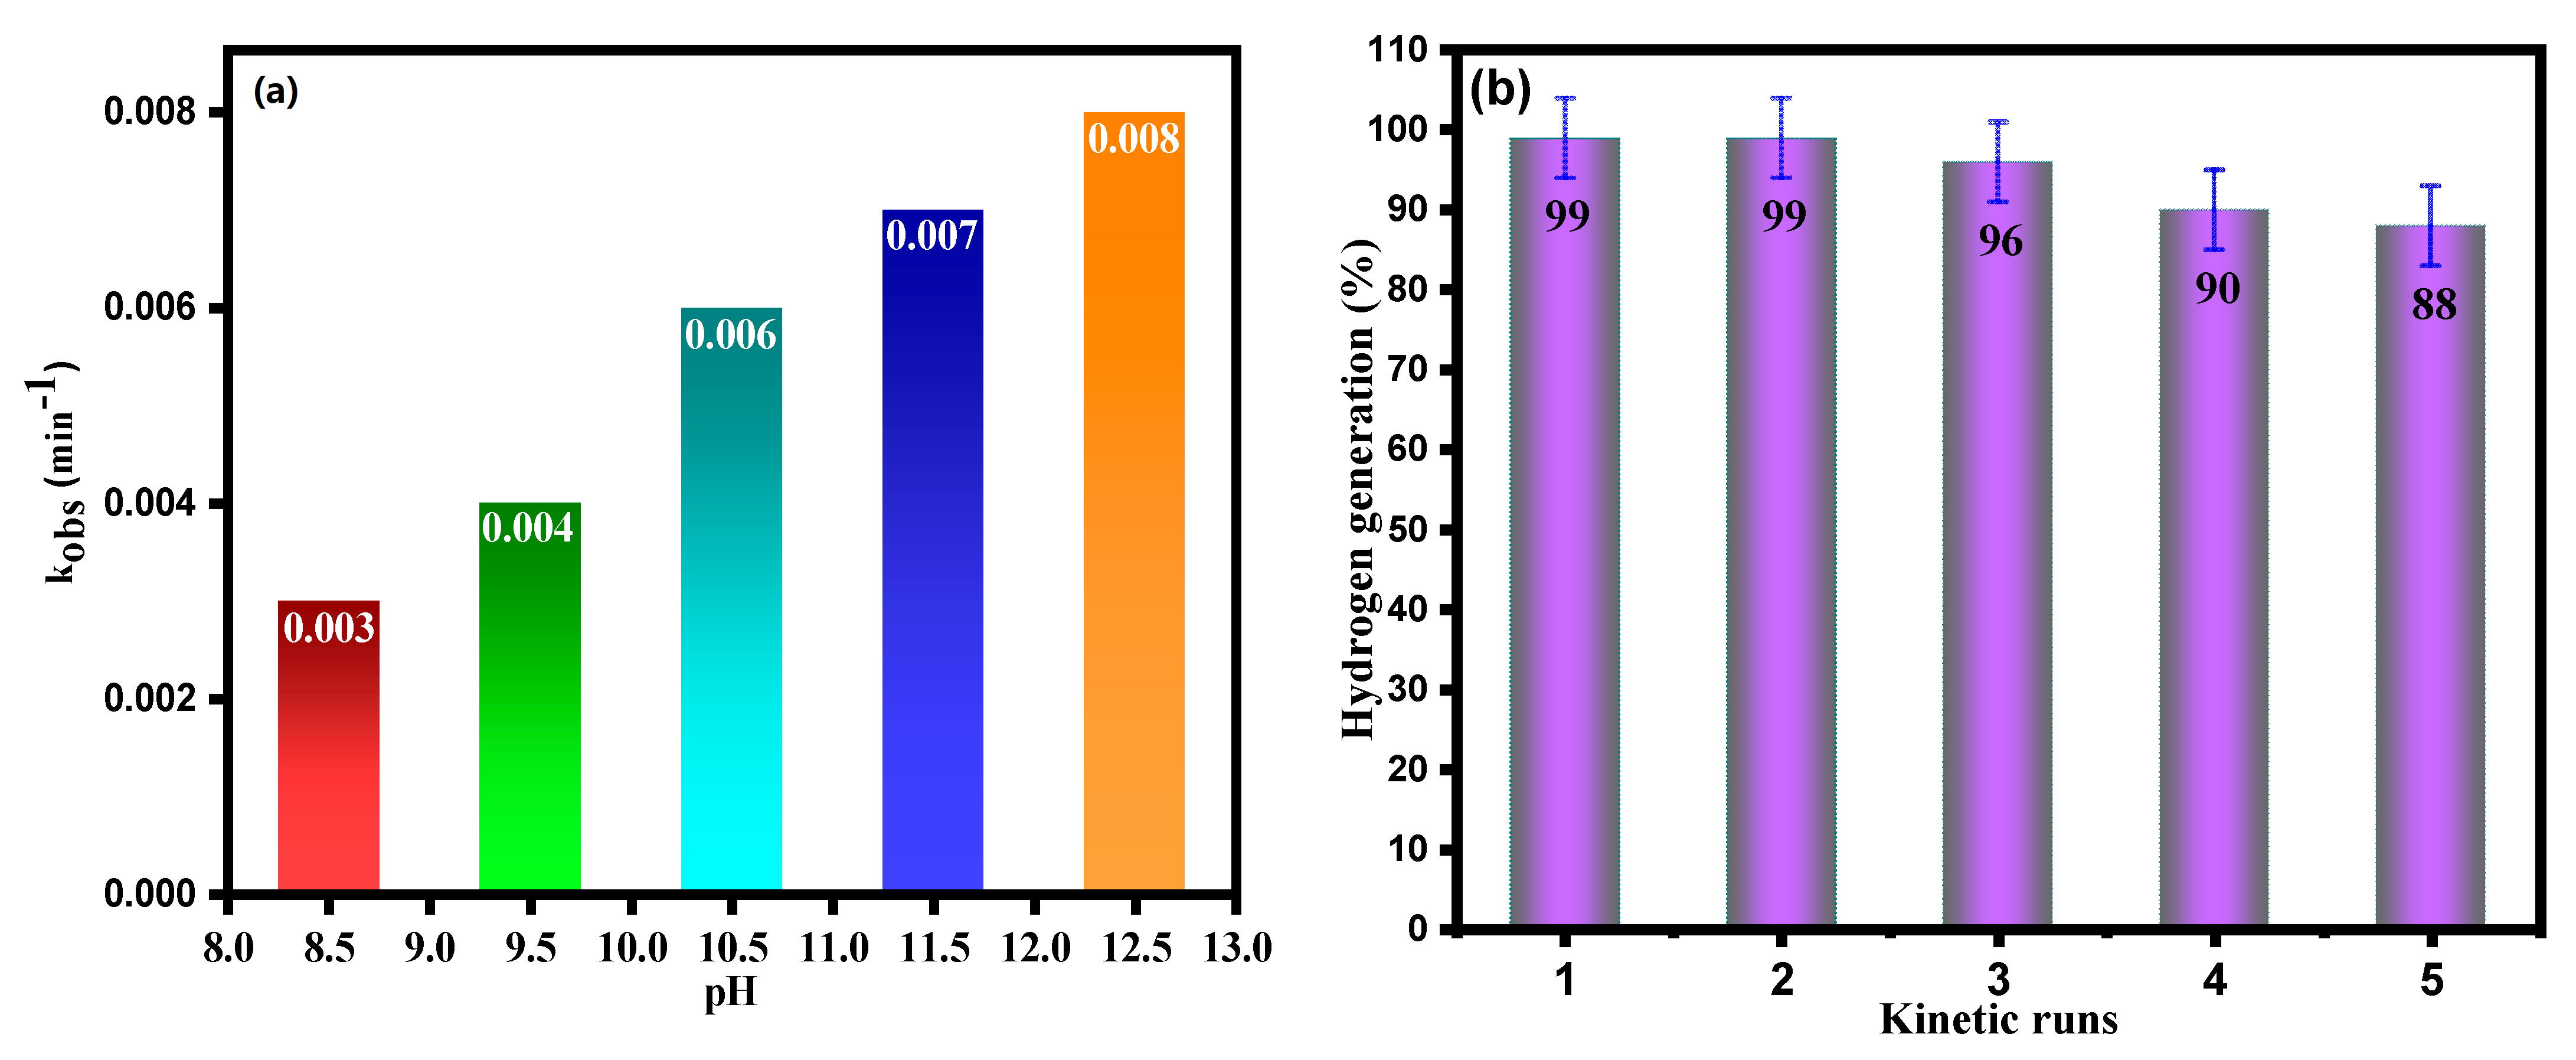
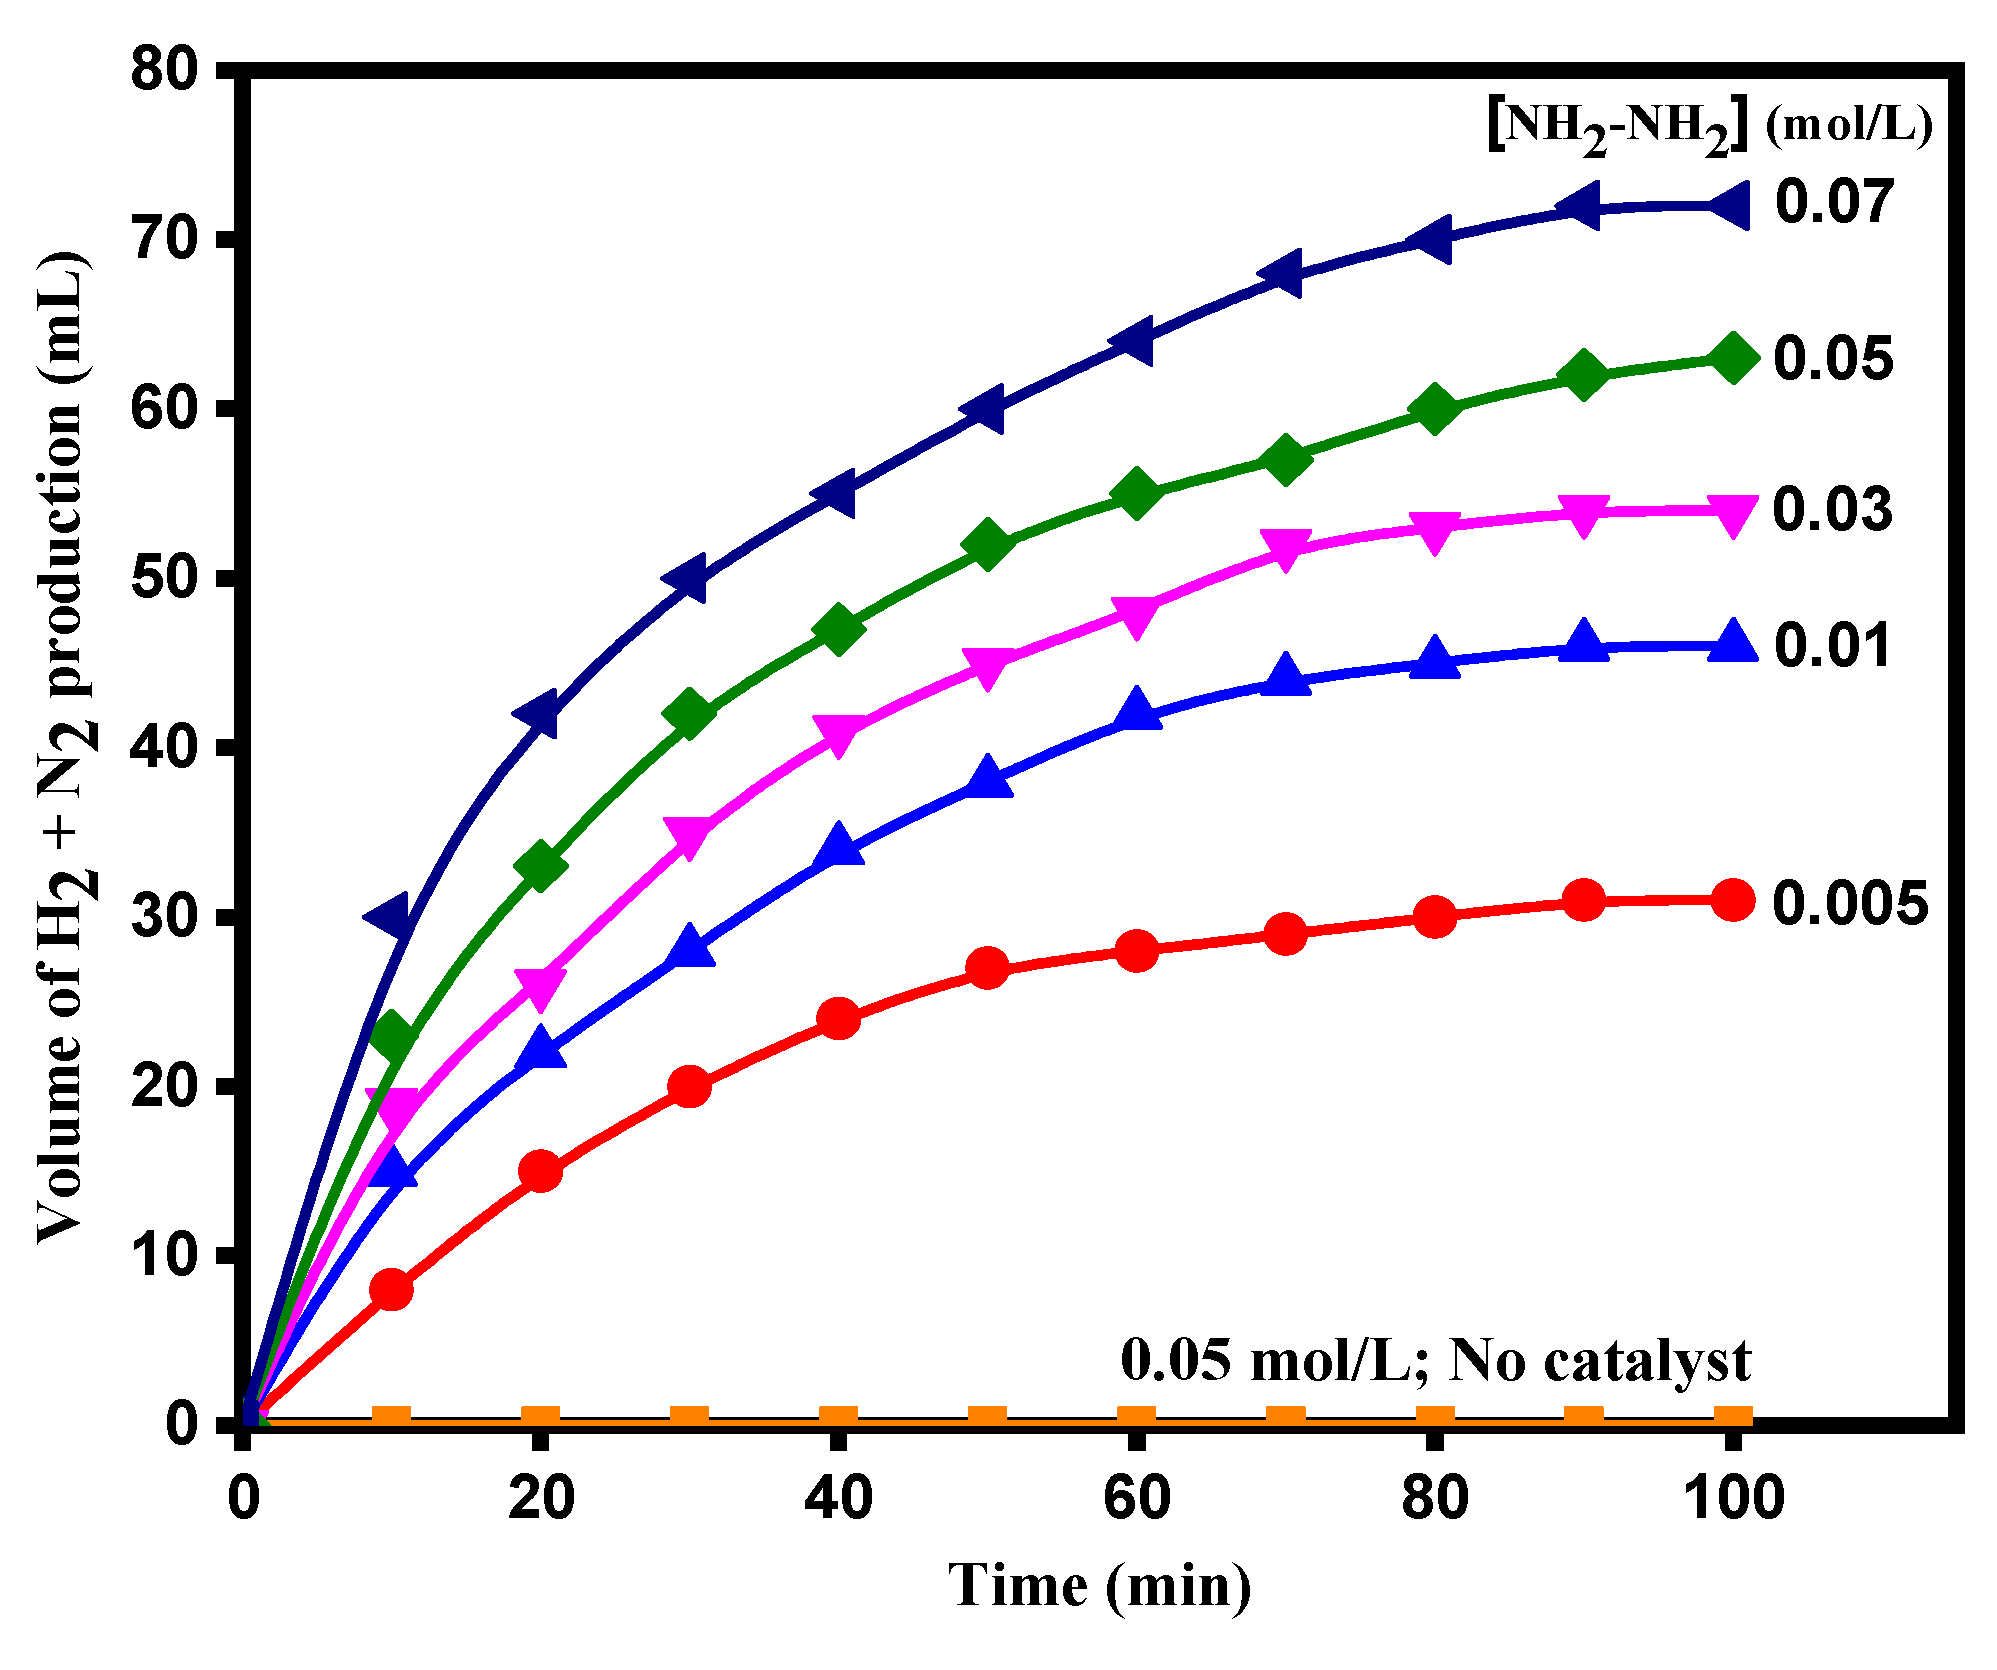
3.2. Catalytic Activity of TiO2 and Ag-Modified TiO2 Nanomaterials for Hydrazine Decomposition

To investigate the catalytic activities of synthesized nanomaterials, hydrazine was chosen as a H2 storage material. Initially, hydrazine decomposition (0.05 mol/L) was performed with a fixed amount of catalyst (20 mg) at 298 K under dark and visible light radiation. Then, the H2 selectivity (α) was calculated according to Equation (8) [52].
α = 3 ( n ( H 2 + N 2 ) / n ( N 2 H 4 ) ) 8 1  
The observed H2 selectivity versus reaction time were plotted in Figure 7. The control experiment (without catalyst) was also carried out for comparison, and no hydrogen evolution was observed, as shown in Figure 7. The progress of the reaction was slow in the dark, and it was completed in 60 min with ca. 50% hydrogen selectivity. Interestingly, no gas formation (H2, N2, or NH3) was observed with bare Ag NPs and bare TiO2 samples even after 2 h of reaction under optimized experimental conditions. Nessler’s reagent tests suggested that NH3 was not formed, as it is the major side product during reaction. These results were in accordance with the observations of Sing et al., who detailed that the mono-metallic Cu, Fe, Pt, and Pd nanoparticles were not active for hydrazine decomposition in an aqueous medium [53]. The H2 selectivity also depended on the molar ratio of metals in the bi-metallic Fe-Pd, Fe-Cu, Co-Cu, Cu-Rh, Cu-Pt, Cu-Ir, and Cu-Pd nanoparticles. In the present study, the H2 generation by hydrazine in the dark with an Ag-modified TiO2 sample was probably due to the surface plasmon resonance (SPR) mechanism as well as a synergistic effect between the Ag0 and TiO2 structures [54,55].
The decomposition of hydrazine was carried out under pseudo-first-order conditions ([hydrazine] ˃ [catalyst]) (Table 1). The decomposition rate constants were calculated by using the well-known first-order rate equation (Equation (5)). The reaction-time profile clearly showed that the decomposition of hydrazine followed first-order kinetics with respect to hydrazine concentration at each temperature under pseudo-first-order conditions. Figure 8a shows the influences of the reaction temperatures (295, 300, 308, 312, and 318 K) on H2 generation. The plots of ln(VαV0/VαVt) versus time are straight lines and pass through the origin, indicating the first-order dependence with respect to hydrazine concentration at each temperature under pseudo-first-order conditions. The Arrhenius equation (Equation (9)) was employed to estimate the activation energy for hydrazine decomposition over an Ag-modified TiO2 catalyst (Figure 8b).
( l n k o b s ) = E a 8.314 × T + l n A  
where kobs, Ea, T, and A are the rate constant, activation energy, absolute temperature, and Arrhenius factor. The Ea = 57.3 kJ/mol was evaluated from the slope of the Arrhenius plot (Figure 7b). The turnover frequency (TOF) was estimated with Equation (10) [56].
T O F = n ( N 2 H 4 ) 50 % n ( A g T i O 2 ) 50 % × t i m e 50 %  
The TOF values were calculated to be 80, 120, and 190 h−1 at 298, 308, and 318 K, respectively. The influence of the pH of the solution was studied (from 9.5, 10.0, and 11.5) at a fixed hydrazine concentration (0.5 mol), catalyst (20 mg), and temperature (298 K) in the dark. It was experimentally tested that the pH of the Ag-modified TiO2 and hydrazine solution was moderately acidic (pH ca. 5.4) and alkaline (pH ca. 8.4) in nature. The pH was adjusted by adding standard NaOH solution, which has been used as a promoter for the decomposition of hydrazine. The pH had a significant role in the catalytic dehydrogenation reaction (Table 1).
Normally, TiO2 is an amphoteric metal oxide; however, the hydroxylated surface of TiO2 tends to donate protons by dissociating water, binding the HO ions and releasing H+ ions. The increased H+ ions in the solution resulted in a decrease in pH. It is known that hydrazine is a weak Brønsted base (pKb = 8.0) and mainly exists in the protonated form at pH ca. 7.0. The acid–base equilibrium in an aqueous suspension of Ag-modified TiO2 and hydrazine was due to the acidic functional groups presented on the surface of TiO2 (Equations (11) and (12)).
T i O 2 + H 2 O T i O 2 O H + H +  
N H 2 N H 3 + N H 2 N H 2 + H +  
As the HO ions’ concentration increased, the catalyst’s surface and hydrazine became active due to the involvement of various surface reactions. The percentage of protonated hydrazine decreased with a pH increase, and equilibrium shifted towards the right at a higher pH (Equation (10)). As a result, H2 generation rates increased with an increase in the pH of the aqueous hydrazine solution (Figure 9a) [33].
The rate-determining step for hydrazine decomposition [NH2-NH2 → NH2-NH + H] was accelerated at high pH due to the inhibition of NH3 formation. The reusability of the Ag-modified TiO2 was estimated under the optimized experimental conditions. After the completion of the first cycle of the activity test, the catalyst was recovered, washed with water, dried at 90 °C for 2 h, and reused for the next cycle. The catalyst was reused for five consecutive kinetic experiments with the same hydrazine concentration. The results of the reusability tests are presented in Figure 9b. It was observed that the catalytic activity remained unchanged for all cycles, which indicated that the Ag-modified TiO2 was a stable catalyst with excellent catalytic performance. However, the activity was slightly decreased after five recycle kinetic runs, and the decrease in activity could have been due to two reasons; (i) loss of catalyst amount during the recycling experiments and/or (ii) oxidative conversion of Ag0 under alkaline reaction media, as Ag0 nanoparticles are not stable in an alkaline reaction condition [57].
Scheme 1 represents the possible mechanism for the thermal decomposition of hydrazine over the surfaces of the Ag-TiO2 particles. Initially, the hydrazine molecules adsorbed onto the surface of Ag/TiO2 particles. Then, the adsorbed hydrazine molecules underwent N-N and N-H bond cleavages [8], which led to the formations of final decomposition products of hydrazine, i.e., H2 and N2 gases. Hydroxyl functional groups on the TiO2 surface could contribute to the formation and fixation of Ag0 NPs but also enhance the synergy between Ag metal NPs and TiO2, which could yield high catalytic activity with 100% H2 selectivity.
Additional experiments were performed to study the effect of hydrazine concentration on the decomposition ability of the TiO2-Ag catalyst. Figure 10 shows the effect of hydrazine concentration on the TiO2-Ag-assisted photocatalytic degradation of hydrazine into H2 and N2. The volume of generated gases mixture increased with increasing hydrazine concentration. The values of rate constants were calculated by using the pseudo-first-order kinetic rate law (Equation (5)) to establish the kinetics of hydrazine decomposition on the surface of the TiO2-Ag catalyst. The values of the rate constants as a function of hydrazine concentration, amount of catalyst, temperature, and pH are given in Table 1. The hydrazine decomposition followed first-order kinetics with respect to hydrazine concentration. Therefore, the complete decomposition of hydrazine occurred, and there was no possibility for a side reaction (oxygen reduction by hydrazine). Thermodynamically, the decomposition of hydrazine by oxygen to H2O and N2 was possible (N2H4 + O2 → 2H2O + N2), but the same reaction was very slow in an aqueous system (hydrazine + O2 + H2O) [58], which might have been due to the protonation of hydrazine in water (Equation (12)). The escaping tendency of N-H bond decreased in the protonated hydrazine due to the presence of a positive charge on the nitrogen. Thus, a suitable catalyst was required for the complete dehydrogenation of hydrazine into N2 and H2 [32,53].
At this juncture, it is important to study the roles of reaction conditions on selective hydrazine decomposition, as it is well known that the presence of molecular oxygen in the reaction system results in the reduction of oxygen by hydrazine to produce N2 and H2O [58]. Therefore, some kinetic experiments were performed to determine the stability of hydrazine in presence of water and oxygen. The results of these experiments are summarized in Table 2. There was no hydrazine decomposition activity when the water, visible light, and molecular oxygen were presented in the reaction mixture. Some experiments were repeated under anaerobic conditions. For this purpose, pure helium gas was bubbled through the reaction mixture (containing TiO2-Ag catalyst and water) for 30 min to remove the oxygen. The 0.05 mol/L hydrazine was added to the reaction vessel, and the evolution of N2/H2 was monitored through the water displacement method at different time intervals. No gases were generated even after 1 h under anaerobic conditions. Therefore, it was clear that the hydrazine was stable in water, and oxygen was not reduced by the hydrazine with and without the TiO2-Ag catalyst. The observed results were in good agreement with the results reported by Gaunt and Wetton, with respect to the reaction of hydrazine and oxygen in water [58]. These authors reported that the direct reaction between hydrazine and oxygen at 298 K was very slow (8% in 90 h), and the slow reaction may have been catalyzed by different catalysts. Moreover, the dehydrogenation of hydrogen was strongly dependent on the nature of the catalyst, as well as other reaction conditions [32,55,58]. In order to establish the role of molecular O2, some experiments were also performed with dissolved O2 in an aqueous solution under various experimental conditions. We did not observe the formation of H2 and N2 gases in the mixture for ca. 1 h (Table 2).
The H2 production rates were accelerated with increased reaction temperature under visible light radiation (Figure 11a). The activation energy (Ea) was calculated from the slope of the Arrhenius plot (Figure 11b) observed as 34.4 kJ/mol. These results indicated that the Ag-modified TiO2 catalyst offered high photocatalytic H2 generation from hydrazine in visible light radiation. Figure 8 clearly shows that the catalytic hydrazine decomposition also occurred in the dark. Therefore, hydrazine decomposition process did not require photo energy to initiate [29,59]. The effect of hydrazine concentration was studied, ranging from 1.0 × 10⁻² to 7.0 × 10⁻² mol/L, with a catalyst amount of 20 mg with pH 9.5 at 295 K. Table 1 shows the rates of hydrazine decomposition, and the reaction followed the first-order kinetics with hydrazine concentration. Oliaee et al. also reported that the decomposition rate (generation of N2 + H2) depended on the initial concentration of hydrazine [60].

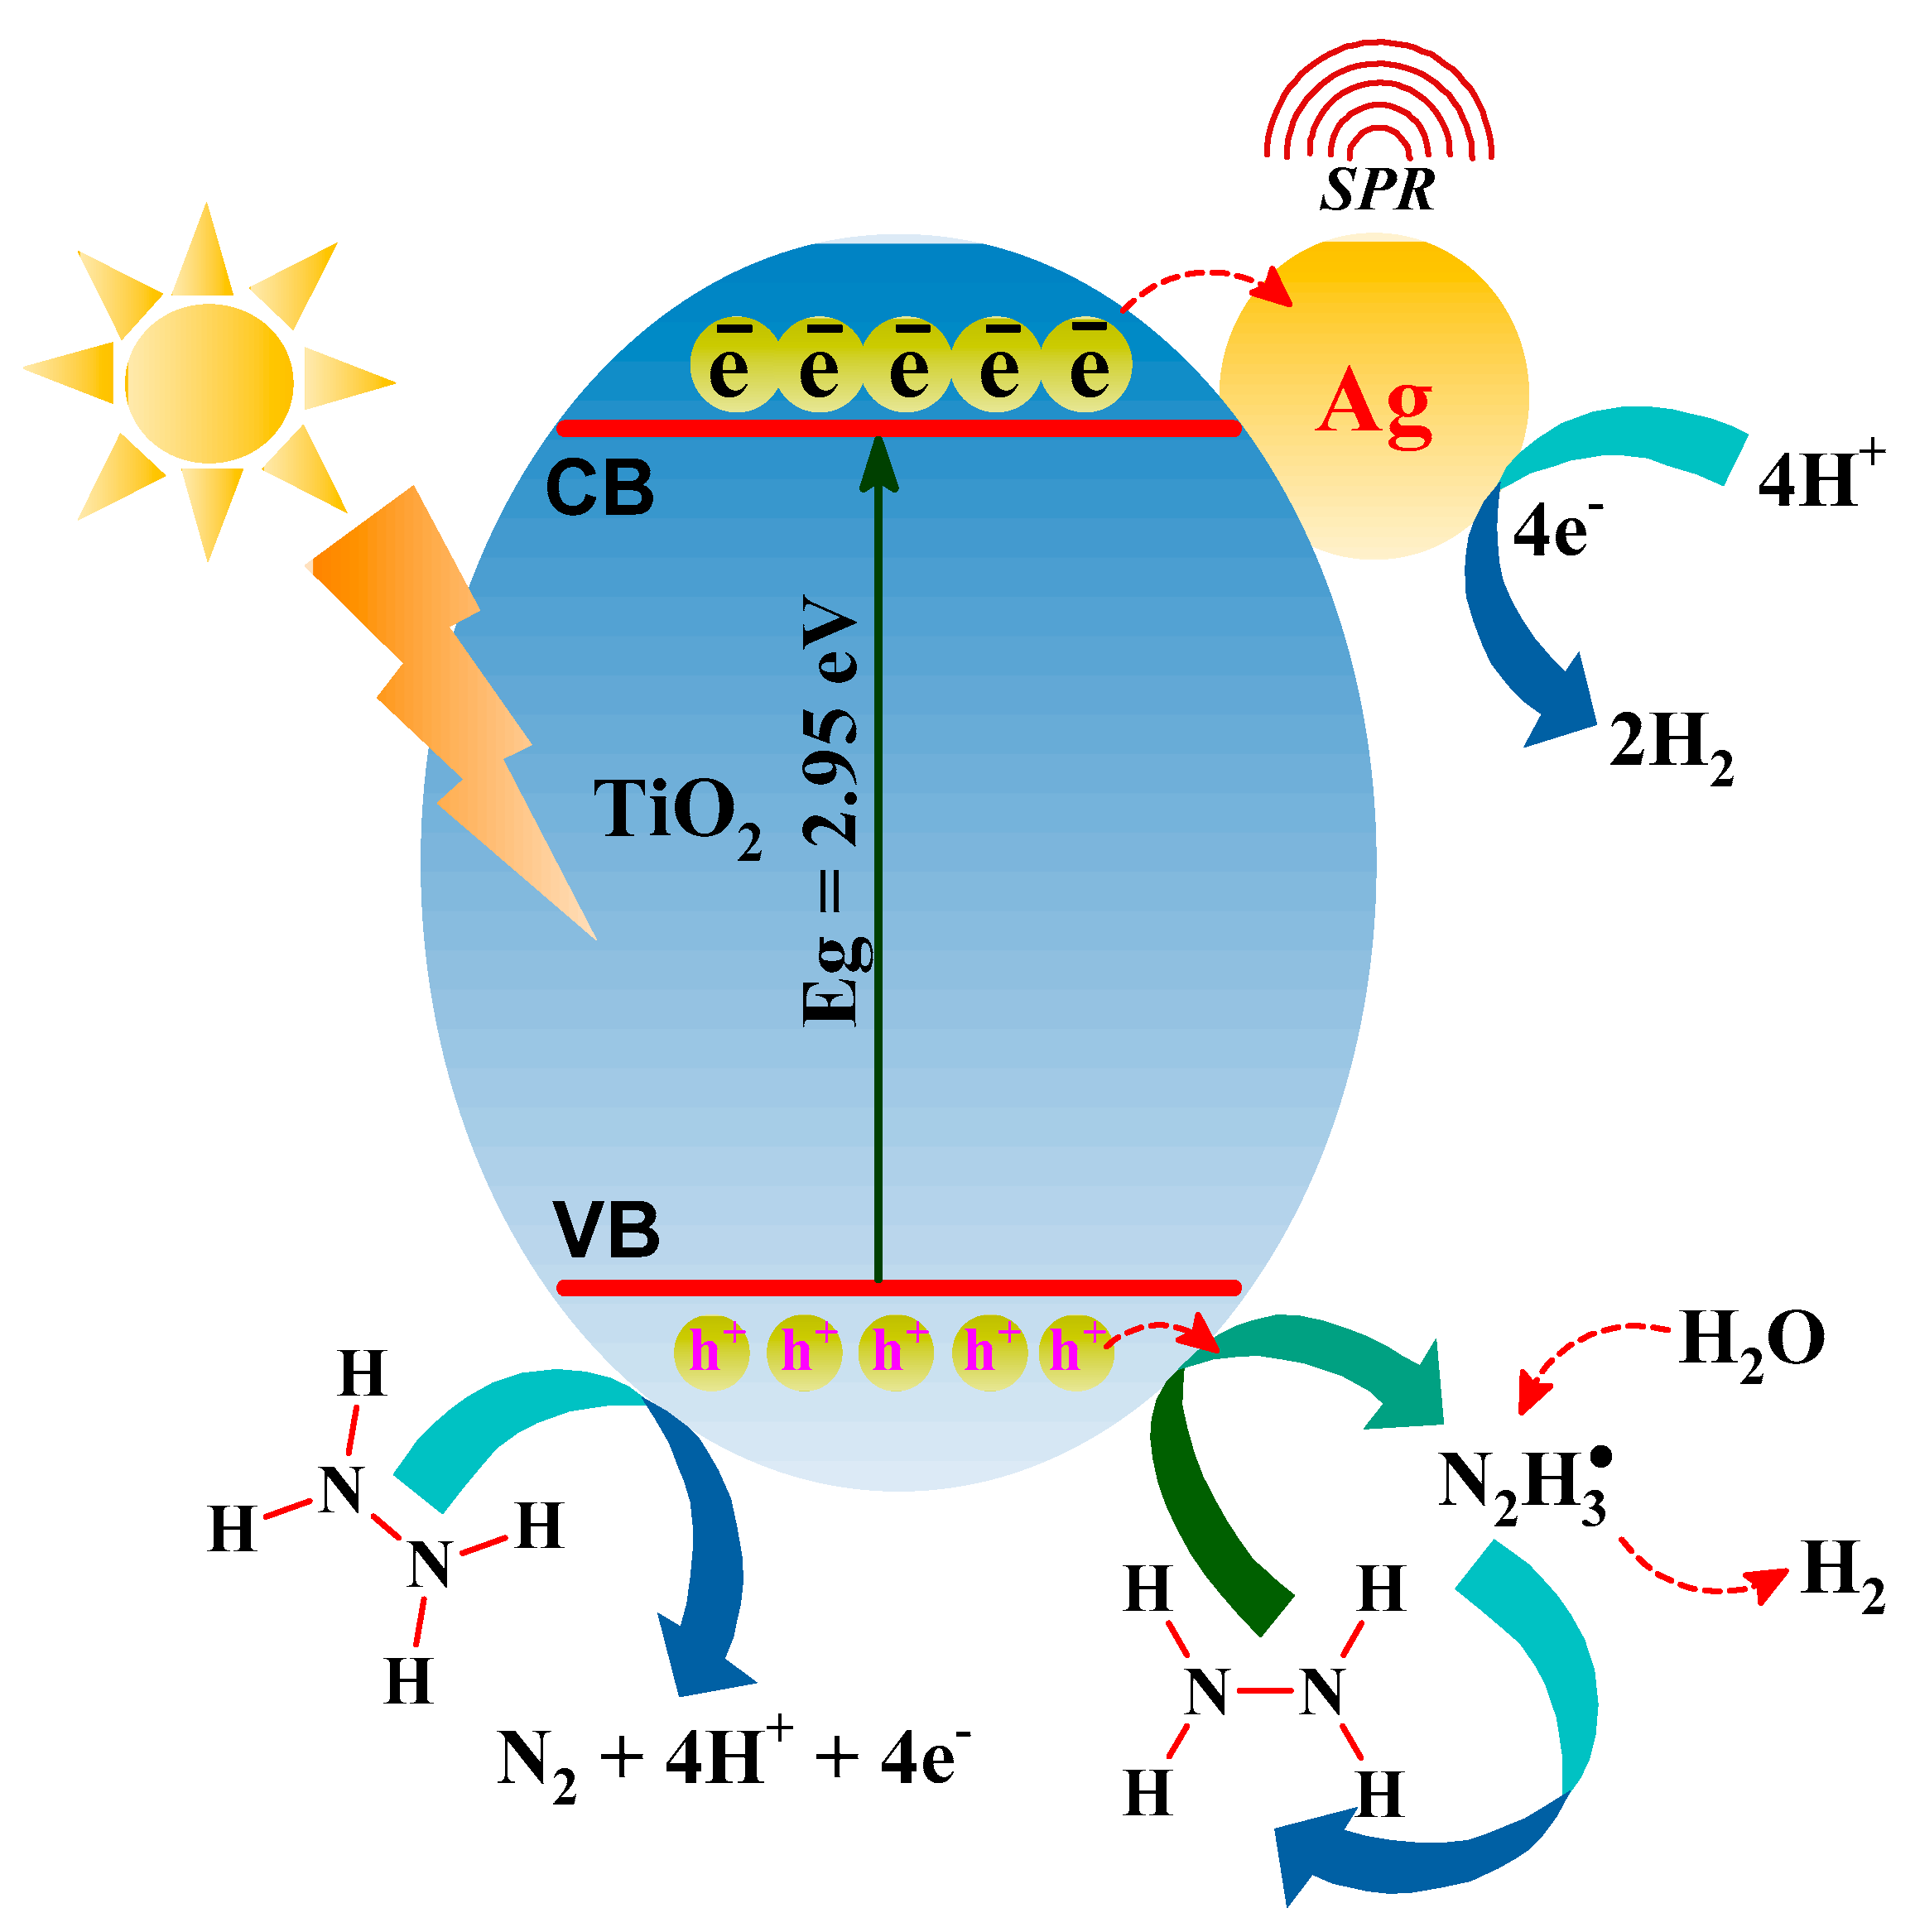
3.3. Mechanism of Photochemical Hydrazine Decomposition

For plasmonic metal nanoparticles, the color and charge separations on their surface were due to the collective oscillations of free electrons derived from the localized surface plasmon resonance (SPR) effect, and the surface charge density was partially localized. Therefore, the catalytic activity of Ag-modified TiO2 might have been due to the combination of synergistic and SPR effects. During the photocatalysis process, target molecules react with photogenerated holes at the valence band (VB) of the semiconductor [61]. To establish the role of photogenerated holes of TiO2 in the degradation of hydrazine, EDTA, a hole scavenger, was used [62] during the photocatalytic process. The H2 selectivity was estimated in presence of EDTA (0.5 mol/L) under similar experimental conditions, and the obtained results are presented in Figure 12.
Figure 12a shows that H2 generation decreased when the hole scavenger was presented in the reaction mixture, which clearly indicated the role of photogenerated holes in hydrazine decomposition. Furthermore, different scavengers, such as ascorbic acid, sodium sulfite, and sodium hydroxide (0.5 mol/L), were also tested under visible light radiation to determine the role of oxidation sites for photo-assisted hydrazine decomposition [63]. Figure 12b demonstrates the decreases in kapp values due to presence of scavengers. Thus, the reactive holes of TiO2 are the most effective sites for the decomposition of hydrazine, indicating that the degradation of hydrous hydrazine progressed by the holes generated by the visible light radiation at the VB of TiO2. The CB potential (ECB) and VB potential (EVB) of Ag-doped TiO2 were determined by applying Equations (13) and (14) [64].
E C B ( T i O 2 ) = E N ( T i O 2 ) E X 0.5 E g ( T i O 2 )  
E V B ( T i O 2 ) = E g ( T i O 2 ) E C B ( T i O 2 )  
where ECB = potential of conduction band, EVB = potential of valence band, EN = electronegativity of TiO2 (5.81), and Eg = band gap energy (2.09 eV) of TiO2. EX is the energy of free electrons on the hydrogen electrode scale (ca. 4.5 eV). The values of ECB and EVB were calculated and found to be −0.16 eV and 3.1 eV, respectively. The higher value of EVB could result in the enhanced oxidizing power of the photocatalyst toward hydrazine under visible light exposure. The (ECB value = −0.16 eV was more negative than the H+/H2 reduction potential, indicating that the photogenerated electrons on the conduction band of TiO2 due to the SPR effect of Ag0 could effectively reduce H+ to H2. It is well known that the 0.00 V and −0.41 V reduction potentials are needed for H2 production (H+/H2) at pH 0.0 and in an aqueous solution at pH 7.0, respectively [63]. The negative and positive values of ECB and EVB were quite enough to promote reduction and oxidation steps to generate the required electrons and protons [65].
Unmodified TiO2 and Ag0 individually could not be able to catalyze the hydrazine decomposition due to the wide band gap and lack of photogenerated holes under tested reaction conditions. The modified TiO2 with Ag0 (TiO2-Ag) was active and produced H2 due to hydrazine decomposition, but decomposition rates were low in the absence of light. The TiO2-Ag semiconductor absorbed visible light radiation and produced e/h+ pairs; the photogenerated e transfer occurred from VB to the CB of TiO2. Thus, Ag0 nanoparticles acted as electron traps, which were essential for efficient H2 generation. It was possible to propose a plausible reaction mechanism for photocatalytic decomposition of hydrazine over Ag-modified TiO2 based on the observed results from the activity and characterization studies (Scheme 2). The N-H and N-N bonds of hydrazine are attached to the surface of TiO2 due to the adsorption of hydrazine. The surface heterogeneity activated the H-N bonds of hydrazine; then, various intermediates (NH2-NH, HN-NH, HN=NH, and N-NH) were formed due to the reactivity of water molecules, which was the key step to hydrazine decomposition in the presence of light [29]. The Schottky barrier could easily form between the Ag0 and TiO2‘s crystal structure due to the high Fermi level of TiO2 compared to metallic silver particles. However, the photogenerated e overcame the Schottky barrier and transferred through the Ag0-TiO2 interface to the CB of TiO2. The e transfer was much faster in the plasmonic nanomaterials due to the SPR effect [66]. A comparison of the catalytic activity of the Ag-modified TiO2 catalyst with the other reported catalysts is shown in Table 3. The activation energy was lower in case of the TiO2-Ag than other reported catalysts, indicating that the Ag0 plasmonic nanoparticles enhanced the photocatalytic activity of bare TiO2.

4. Conclusions

In conclusion, an Ag-modified TiO2 nanomaterial was successfully prepared using a simple, one-pot synthesis method. The synthesized nanomaterial was used as a novel catalyst for H2 production via the thermal and photocatalytic decomposition of an aqueous hydrazine solution under visible light for the first time. The Ag modification decreased the band gap energy of TiO2, enhancing the absorption of UV and visible light and boosting the photocatalytic efficiency. The modified TiO2 with plasmonic Ag0 exhibited excellent catalytic and photocatalytic activities for H2 production compared to bare TiO2 and Ag0 catalysts. TiO2 modified with Ag NPs was found to enhance the catalytic performance of TiO2 and shift the photoresponse of TiO2 from the UV light to the visible light region. In addition, Ag NPs played an important role in reducing the charge recombination of TiO2. The Ag NPs also helped in trapping the excited electrons at the surface of the photocatalyst, acted as an electron acceptor, and played a significant role in electron-hole separation. Furthermore, this study provided new insight into the formation of noble-metal-modified semiconductor materials with enhanced charge separations and resulted in speeding up H2 production rates.

Author Contributions

Conceptualization, K.N. and S.Z.A.-S.; Methodology, Z.K., K.N. and M.A.M.; Software, S.M.B.; Validation, S.M.B. and M.M.; Formal analysis, S.A.A. and M.A.M.; Investigation, K.N., S.Z.A.-S. and M.M.; Resources, S.M.B.; Data curation, M.M.; Writing—original draft, Z.K. and M.A.M.; Writing—review & editing, Z.K. and M.A.M.; Visualization, S.Z.A.-S.; Project administration, S.A.A.; Funding acquisition, S.A.A. All authors have read and agreed to the published version of the manuscript.

Funding

This project was funded by the Deputyship for Research and Innovation, Ministry of Education in Saudi Arabia through the project number IFPNC-001-130-2020, and Deanship of Scientific Research (DSR), King Abdulaziz University, Jeddah, Saudi Arabia.

Data Availability Statement

Not applicable.

Acknowledgments

The authors extend their appreciation to the Deputyship for Research & Innovation, Ministry of Education in Saudi Arabia for funding this research work through the project number IFPNC-001-130-2020 and Deanship of Scientific Research (DSR), King Abdulaziz University, Jeddah, Saudi Arabia.

Conflicts of Interest

The authors declare no conflict of interest.

References

  1. Fujishima, A.; Honda, K. Electrochemical photolysis of water at a semiconductor electrode. Nature 1972, 238, 37–38. [Google Scholar] [CrossRef]
  2. Zou, Z.; Ye, J.; Sayama, K.; Arakawa, H. Direct splitting of water under visible light irradiation with an oxide semiconductor photocatalyst. Nature 2001, 414, 625–627. [Google Scholar] [CrossRef]
  3. Zhang, G.; Li, G.; Lan, Z.-A.; Lin, L.; Savateev, A.; Heil, T.; Zafeiratos, S.; Wang, X.; Antonietti, M. Optimizing optical absorption, exciton dissociation, and charge transfer of a polymeric carbon nitride with ultrahigh solar hydrogen production activity. Angew. Chem. Int. Ed. 2017, 129, 13630–13634. [Google Scholar] [CrossRef]
  4. Wei, R.-B.; Huang, Z.-L.; Gu, G.-H.; Wang, Z.; Zeng, L.; Chen, Y.; Liu, Z.-Q. Z-scheme CdS/WO3 on a carbon cloth, enabling effective hydrogen evolution. Appl. Catal. B 2018, 231, 101–107. [Google Scholar] [CrossRef]
  5. Jiang, H.-L.; Singh, S.K.; Yan, J.-M.; Zhang, X.-B.; Xu, Q. Liquid-phase chemical hydrogen storage: Catalytic hydrogen generation under ambient conditions. ChemSusChem 2010, 3, 541–549. [Google Scholar] [CrossRef] [PubMed]
  6. Bai, J.; Liu, J.; Yun, H.; Li, D.; Cao, Q.; Hou, X.; Xu, Y. Hydrolysis hydrogen generation behavior of mechanico-chemical reaction Mg-M (M = Ni, Ce, and La) binary alloys- A feasible strategy for activating and improving environmental stability. J. Mater. Res. Technol. 2022, 21, 363–372. [Google Scholar] [CrossRef]
  7. Alberas, D.J.; Kiss, J.; Liu, Z.M.; White, J.M. Surface chemistry of hydrazine on Pt (111). Surf. Sci. 1992, 278, 51–61. [Google Scholar] [CrossRef] [Green Version]
  8. Chen, J.; Zou, H.; Yao, Q.; Luo, M.; Li, X.; Lu, Z.-H. Cr2O3-modified NiFe nanoparticles as a noble-metal-free catalyst for complete dehydrogenation of hydrazine in aqueous solution. Appl. Surf. Sci. 2020, 501, 144247. [Google Scholar] [CrossRef]
  9. Motta, D.; Barlocco, I.; Bellomi, S.; Villa, A.; Dimitratos, N. Hydrous Hydrazine Decomposition for Hydrogen Production Using of Ir/CeO2: Effect of Reaction Parameters on the Activity. Nanomaterials 2021, 11, 1340. [Google Scholar] [CrossRef]
  10. Ding, Q.; Chen, T.; Li, Z.; Feng, Z.; Wang, X. Time-resolved infrared spectroscopic investigation of Ga2O3 photocatalysts loaded with Cr2O3-Rh cocatalysts for photocatalytic water splitting. Chin. J. Catal. 2021, 42, 808–816. [Google Scholar] [CrossRef]
  11. Fernando, K.A.; Sahu, S.; Liu, Y.; Lewis, W.K.; Guliants, E.A.; Jafariyan, A.; Wang, P.; Bunker, C.E.; Sun, Y.P. Carbon quantum dots and applications in photocatalytic energy conversion. ACS Appl. Mater. Interfaces 2015, 7, 8363–8376. [Google Scholar] [CrossRef] [PubMed]
  12. Escobedo Salas, S.; Serrano Rosales, B.; de Lasa, H. Quantum yield with platinum modified TiO2 photocatalyst for hydrogen production. Appl. Catal. B Environ. 2013, 140–141, 523–536. [Google Scholar] [CrossRef]
  13. Chiarello, G.L.; Dozzi, M.V.; Selli, E. TiO2-based materials for photocatalytic hydrogen production. J. Energy Chem. 2017, 26, 250–258. [Google Scholar] [CrossRef]
  14. Xiang, Q.; Yu, J.; Jaroniec, M. Synergetic Effect of MoS2 and Graphene as Cocatalysts for Enhanced Photocatalytic H2 Production Activity of TiO2 Nanoparticles. J. Am. Chem. Soc. 2012, 134, 6575–6578. [Google Scholar] [CrossRef]
  15. Asahi, R.; Morikawa, T.; Irie, H.; Ohwaki, T. Nitrogen-doped titanium dioxide as visible-light-sensitive photocatalyst: Designs, developments, and prospects. Chem. Rev. 2014, 114, 9824–9852. [Google Scholar] [CrossRef]
  16. Yang, C.; Zhang, X.; Qin, J.; Shen, X.; Yu, R.; Ma, M.; Liu, R. Porous carbon doped TiO2 on TiC nanostructures for enhanced photocatalytic hydrogen production under visible light. J. Catal. 2017, 347, 36–44. [Google Scholar] [CrossRef]
  17. Kumaravel, V.; Mathew, S.; Bartlett, J.; Pillai, S.C. Photocatalytic hydrogen production using metal doped TiO2: A review of recent advances. Appl. Catal. B Environ. 2019, 244, 1021–1064. [Google Scholar] [CrossRef]
  18. Volfová, L.; Pližingrová, E.; Ecorchard, P.; Motlochová, M.; Klementová, M.; Jánošíková, P.; Bezdička, P.; Kupčík, J.; Krýsa, J.; Lančok, A.; et al. Tailoring Photocatalytic Activity of TiO2 Nanosheets by 57Fe. J. Phys. Chem. C 2020, 124, 6669–6682. [Google Scholar] [CrossRef]
  19. Choi, W.Y.; Termin, A.; Hoffmann, M.R. The role of metal ion dopants in quantum sized TiO2: Correlation between photoreactivity and charge carrier recombination dynamics. J. Phys. Chem. 1994, 98, 13669–13679. [Google Scholar] [CrossRef]
  20. Wessel, M.; Spohr, E. C-, N-, S-, and Fe-Doped TiO2 and SrTiO3 nanotubes for visible-light-driven photocatalytic water splitting: Prediction from first principles. J. Phys. Chem. C 2015, 119, 18686–18696. [Google Scholar]
  21. Priebe, J.B.; Radnik, J., Jr.; Lennox, A.J.; Pohl, M.-M.; Karnahl, M.; Hollmann, D.; Grabow, K.; Bentrup, U.; Junge, H.; Beller, M. Solar hydrogen production by plasmonic Au–TiO2 catalysts: Impact of synthesis protocol and TiO2 phase on charge transfer efficiency and H2 evolution rates. ACS Catal. 2015, 5, 2137–2148. [Google Scholar] [CrossRef]
  22. Brady, M.D.; Sampaio, R.N.; Wang, D.; Meyer, T.J.; Meyer, G.J. Dye-sensitized hydrobromic acid splitting for hydrogen solar fuel production. J. Am. Chem. Soc. 2017, 139, 15612–15615. [Google Scholar] [CrossRef]
  23. Abutalib, M.M.; Alghamdi, H.M.; Rajeh, A.; Nur, O.; Hezma, A.M.; Mannaa, M.A. Fe3O4/Co3O4-TiO2 S-scheme photocatalyst for degradation of organic pollutants and H2 production under natural sunlight. J. Mater. Res. Technol. 2022, 20, 1043–1056. [Google Scholar] [CrossRef]
  24. Zhao, X.G.; Huang, L.Q. Iridium, carbon, and nitrogen multiple-doped TiO2 nanoparticles with enhanced photocatalytic activity. Ceram. Int. 2017, 43, 3975–3980. [Google Scholar] [CrossRef]
  25. Díaz, L.; Rodríguez, V.D.; González-Rodríguez, M.; Rodríguez-Castellón, E.; Algarra, M.; Núñez, P.; Moretti, E. M/TiO2 (M = Fe, Co, Ni, Cu, Zn) catalysts for photocatalytic hydrogen production under UV and visible light irradiation. Inorg. Chem. Front. 2021, 8, 3491–3500. [Google Scholar] [CrossRef]
  26. Balayeva, N.O.; Mamiyev, Z.; Dillert, R.; Zheng, N.; Bahnemann, D.W. Rh/TiO2-Photocatalyzed Acceptorless Dehydrogenation of N-Heterocycles upon Visible-Light Illumination. ACS Catal. 2020, 10, 5542–5553. [Google Scholar] [CrossRef]
  27. Balayeva, N.O.; Zheng, N.; Dillert, R.; Bahnemann, D.W. Visible-Light-Mediated Photocatalytic Aerobic Dehydrogenation of N-heterocycles by Surface-Grafted TiO2 and 4-amino-TEMPO. ACS Catal. 2019, 9, 10694–10704. [Google Scholar] [CrossRef]
  28. Kumar, P.; Kumar, A.; Queffelec, C.; Gudat, D.; Wang, Q.; Jain, S.L.; Boukherroub, R.; Szunerits, S. Visible light assisted hydrogen generation from complete decomposition of hydrous hydrazine using rhodium modified TiO2 photocatalysts. Photochem. Photobiol. Sci. 2017, 16, 1036–1042. [Google Scholar] [CrossRef]
  29. Luo, F.; Miao, X.; Chu, W.; Wu, P.; Tong, D.G. Preparation of face-centered-cubic indium nanocubes and their superior dehydrogenation activity towards aqueous hydrazine with the assistance of light. J. Mater. Chem. A 2016, 4, 17665–17672. [Google Scholar] [CrossRef]
  30. Al-Thubaiti, K.S.; Khan, Z. Trimetallic nanocatalysts to enhanced hydrogen production from hydrous hydrazine: The role of metal centers. Int. J. Hydrogen Energy 2020, 45, 13960–13974. [Google Scholar] [CrossRef]
  31. Sandoval, A.; Aguilar, A.; Louis, C.; Traverse, A.; Zanella, R. Bimetallic Au–Ag/TiO2 catalyst prepared by deposition–precipitation: High activity and stability in CO oxidation. J. Cataly 2011, 281, 40–49. [Google Scholar] [CrossRef]
  32. Singh, S.K.; Xu, Q. Bimetallic Ni-Pt nanocatalysts for selective decomposition of hydrazine in aqueous solution to hydrogen at room temperature for chemical hydrogen storage. Inorg. Chem. 2010, 49, 6148–6152. [Google Scholar] [CrossRef]
  33. Khan, Z. Trimetallic nanoparticles: Synthesis, characterization and catalytic degradation of formic acid for hydrogen generation. Int. J. Hydrogen Energy 2019, 44, 11503–11513. [Google Scholar] [CrossRef]
  34. Shirsath, S.R.; Pinjari, D.V.; Gogate, P.R.; Sonawane, S.H.; Pandit, A.B. Ultrasound assisted synthesis of doped TiO2 nanoparticles: Characterization and comparison of effectiveness for photocatalytic oxidation of dyestuff effluent. Ultrason. Sonochem. 2013, 20, 277–286. [Google Scholar] [CrossRef]
  35. Liu, E.; Kang, L.; Yang, Y.; Sun, T.; Hu, X.; Zhu, C.; Liu, H.; Wang, Q.; Li, X.; Fan, J. Plasmonic Ag deposited TiO2 nano-sheet film for enhanced photocatalytic hydrogen production by water splitting. Nanotechnology 2014, 25, 165401. [Google Scholar] [CrossRef] [PubMed]
  36. Prakash, J.; Sun, S.; Swart, H.C.; Gupta, R.K. Noble metals-TiO2 nanocomposites: From fundamental mechanisms to photocatalysis, surface-enhanced Raman scattering and antibacterial applications. Appl. Mater. Today 2018, 11, 82–135. [Google Scholar] [CrossRef]
  37. Mills, A.; Hill, G.; Stewart, M.; Graham, D.; Smith, W.E.; Hodgen, S.; Halfpenny, P.J.; Faulds, K.; Robertson, P. Characterization of novel Ag on TiO2 films for surface-enhanced Raman scattering. Appl. Spectrosc. 2004, 58, 922. [Google Scholar] [CrossRef] [PubMed] [Green Version]
  38. Yang, L.; Jiang, X.; Ruan, W.; Yang, J.; Zhao, B.; Xu, W.; Lombardi, J.R. Charge-transfer-induced surface-enhanced Raman scattering on Ag–TiO2 nanocomposites. J. Phys. Chem. C 2009, 113, 16226–16231. [Google Scholar] [CrossRef]
  39. Yu, J.G.; Zhang, L.J.; Cheng, B.; Su, Y.R. Hydrothermal preparation and photocatalytic activity of hierarchically sponge-like macro-/mesoporous titania. J. Phys. Chem. C 2007, 111, 10582–10589. [Google Scholar] [CrossRef]
  40. Zhang, F.X.; Guan, N.J.; Li, Y.Z.; Zhang, X.; Chen, J.X.; Zeng, H.S. Control of morphology of silver clusters coated on titanium dioxide during photocatalysis. Langmuir 2003, 19, 8230–8234. [Google Scholar] [CrossRef]
  41. Shi, Y.; Ma, J.; Chen, Y.; Qian, Y.; Xu, B.; Chu, W.; An, D. Recent progress of silver-containing photocatalysts for water disinfection under visible light irradiation: A review. Sci. Total Environ. 2022, 804, 150024. [Google Scholar] [CrossRef]
  42. Waterhouse, G.I.; Bowmaker, G.A.; Metson, J.B. The thermal decomposition of silver (I, III) oxide: A combined XRD, FT-IR and Raman spectroscopic study. Phys. Chem. Chem. Phys. 2001, 3, 3838–3845. [Google Scholar] [CrossRef]
  43. Makula, P.; Pacia, M.; Macyk, W. How to correctly determine the band gap energy of modified semiconductor photocatalysts based on UV−Vis spectra. J. Phys. Chem. Lett. 2018, 9, 6814–6817. [Google Scholar] [CrossRef] [PubMed] [Green Version]
  44. Martinez-Ferrero, E.; Sakatani, Y.; Boissiere, C.; Grosso, D.; Fuertes, A.; Fraxedas, J.; Sanchez, C. Nanostructured titanium oxynitride porous thin films as efficient visible-active photocatalysts. Adv. Funct. Mater. 2007, 17, 3348–3354. [Google Scholar] [CrossRef]
  45. Knorr, F.J.C.; Mercado, C.; McHale, J.L. Trap-state distributions and carrier transport in pure and mixed-phase TiO2: Influence of contacting solvent and interfacial electron transfer. J. Phys. Chem. C 2008, 112, 12786–12794. [Google Scholar] [CrossRef]
  46. Yu, J.; Yue, L.; Liu, S.; Huang, B.; Zhang, X. Hydrothermal preparation and photocatalytic activity of mesoporous Au-TiO2 nanocomposite microspheres. J. Colloid. Interface Sci. 2009, 334, 58–64. [Google Scholar] [CrossRef]
  47. Linsebigler, A.L.; Lu, G.; Yates, J.T., Jr. Photocatalysis on TiO2 Surfaces: Principles, mechanisms, and selected results. Chem. Rev. 1995, 95, 735–758. [Google Scholar] [CrossRef]
  48. Hariharan, D.; Thangamuniyandi, P.; Christy, A.J.; Vasantharaja, R.; Selvakumar, P.; Sagadevan, S.; Pugazhendhi, A.; Nehru, L.C. Enhanced photocatalysis and anticancer activity of green hydrothermal synthesized Ag@TiO2 nanoparticles. J. Photochem. Photobiol. B Biol. 2020, 202, 11636. [Google Scholar] [CrossRef]
  49. Jones, T.E.; Rocha, T.C.R.; Knop-Gericke, A.; Stampfl, C.; Schlogl, R.; Piccinina, S. Thermodynamic and spectroscopic properties of oxygen on silver under an oxygen atmosphere. Phys. Chem. Chem. Phys. 2015, 17, 9288. [Google Scholar] [CrossRef] [Green Version]
  50. Jawhari, A.H.; Hasan, N.; Radini, I.A.; Malik, M.A.; Narasimharao, K. Pt-Ag/Ag3PO4-WO3 nanocomposites for photocatalytic H2 production from bioethanol. Fuel 2023, 344, 127998. [Google Scholar] [CrossRef]
  51. Zhang, Y.; Shao, D.; Yan, J.; Jia, X.; Li, Y.; Yu, P.; Zhang, T. The pore size distribution and its relationship with shale gas capacity in organic-rich mudstone of Wufeng-Longmaxi Formations, Sichuan Basin, China. J. Nat. Gas. Geosci. 2016, 1, 213–220. [Google Scholar] [CrossRef] [Green Version]
  52. Dai, H.; Zhong, Y.; Wang, P. Hydrogen generation from decomposition of hydrous hydrazine over Ni-Ir/CeO2 catalyst. Prog. Nat. Sci. Mater. Int. 2017, 27, 121–125. [Google Scholar] [CrossRef]
  53. Singh, S.K.; Zhang, X.-B.; Xu, Q. Room-temperature hydrogen generation from hydrous hydrazine for chemical hydrogen storage. J. Am. Chem. Soc. 2009, 131, 9894–9895. [Google Scholar] [CrossRef]
  54. Chakhtouna, H.; Benzeid, H.; Zari, N.; Qaiss, A.E.K.; Bouhfid, R. Recent progress on Ag/TiO2 photocatalysts: Photocatalytic and bactericidal behaviors. Environ. Sci. Pollut. Res. 2021, 28, 44638–44666. [Google Scholar] [CrossRef]
  55. Zaheer, Z. Chitosan capped noble metal doped CeO2 nanomaterial: Synthesis, and their enhanced catalytic activities. Int. J. Biol. Macromol. 2021, 166, 1258–1271. [Google Scholar] [CrossRef] [PubMed]
  56. Singh, S.K.; Xu, Q. Nanocatalysts for hydrogen generation from hydrazine. Catal. Sci. Technol. 2013, 3, 1889–1900. [Google Scholar] [CrossRef]
  57. Liu, J.; Hurt, R.H. Ion release kinetics and particle persistence in aqueous nano-silver colloids. Environ. Sci. Technol. 2010, 44, 2169–2175. [Google Scholar] [CrossRef]
  58. Gaunt, H.; Wetton, E.A.M. The reaction between hydrazine and oxygen in water. J. Appl. Chem. 1966, 16, 171–176. [Google Scholar] [CrossRef]
  59. Xue, B.; Sun, T.; Wu, J.-K.; Mao, F.; Yang, W. AgI/TiO2 nanocomposites: Ultrasound-assisted preparation, visible-light-induced photocatalytic degradation of methyl orange and antibacterial activity. Ultrason. Sonochem. 2015, 22, 1–6. [Google Scholar] [CrossRef]
  60. Oliaee, S.N.; Zhang, C.; Hwang, S.Y.; Cheung, H.M.; Peng, Z. Hydrogen Production via Hydrazine Decomposition on Model Platinum−Nickel Nanocatalyst with a Single (111) Facet. J. Phys. Chem. C 2016, 120, 9764–9772. [Google Scholar] [CrossRef]
  61. Chen, L.; Huang, R.; Yin, S.F.; Luo, S.L.; Au, C.T. Flower-like Bi2O2CO3: Facile synthesis and their photocatalytic application in the treatment of dye-containing wastewater. Chem. Eng. J. 2012, 193–194, 123–130. [Google Scholar] [CrossRef]
  62. Habisreutinger, S.N.; Schmidt-Mende, L.; Stolarczyk, J.K. Photocatalytic reduction of CO2 on TiO2 and other semiconductors. Angew. Chem. Int. Ed. 2013, 52, 7372–7408. [Google Scholar] [CrossRef] [PubMed]
  63. Chen, L.; Jiang, D.; He, T.; Wu, Z.; Chen, M. In-situ ion exchange synthesis of hierarchical AgI/BiOI microsphere photocatalyst with enhanced photocatalytic properties. Cryst. Eng. Comm. 2013, 15, 7556–7563. [Google Scholar] [CrossRef]
  64. Naldoni, A.; Allieta, M.; Santangelo, S.; Marelli, M.; Fabbri, F.; Cappelli, S.; Bianchi, C.L.; Psaro, R.; Santo, V.D. Effect of nature and location of defects on bandgap narrowing in black TiO2 nanoparticles. J. Am. Chem. Soc. 2012, 134, 7600–7603. [Google Scholar] [CrossRef] [PubMed]
  65. Yu, J.; Ran, J. Facile preparaion and enhanced photocatalytic H2-production activity of Cu(OH)2 cluster modified TiO2. Energy Environ. Sci. 2011, 4, 1364–1371. [Google Scholar] [CrossRef]
  66. Furube, A.; Hashimoto, S. Insight into plasmonic hot-electron transfer and plasmon molecular drive: New dimensions in energy conversion and nanofabrication. NPG Asia Mater. 2017, 9, e454. [Google Scholar] [CrossRef] [Green Version]
  67. Miao, X.; Chen, M.M.; Chu, W.; Wu, P.; Tong, D.G. Mesoporous face-centered-cubic In4Ni Alloy nanorices: Superior catalysts for hydrazine dehydrogenation in aqueous solution. ACS Appl. Mater. Interfaces 2016, 8, 25268–25278. [Google Scholar] [CrossRef]
  68. Guo, F.; Zou, H.; Yao, Q.; Huang, B.; Lu, Z.-H. Monodispersed bimetallic nanoparticles anchored on TiO2-decorated titanium carbide MXene for efficient hydrogen production from hydrazine in aqueous solution. Renew. Energy 2020, 155, 1293–1301. [Google Scholar] [CrossRef]
Figure 1. (a) XRD of TiO2 and Ag-doped TiO2 and (b) Raman spectra of TiO2 and Ag-deposited TiO2.
Nanomaterials 13 02076 g001
Figure 2. SEM (a) and TEM (bd) images of Ag-modified TiO2 nanomaterial, (e,f) histograms for TiO2 (23 nm) and Ag0 (7 nm) nanoparticles.
Nanomaterials 13 02076 g002
Figure 3. DR UV-vis spectra of (a) TiO2 and TiO2-Ag samples, and the Tauc plot of (b) TiO2 and (c) Ag-modified TiO2 nanomaterial.
Nanomaterials 13 02076 g003
Figure 4. PL spectra of TiO2 and Ag-modified TiO2-nanomaterial.
Nanomaterials 13 02076 g004
Figure 5. Deconvoluted XPS spectra for TiO2 and Ag-modified TiO2 samples.
Nanomaterials 13 02076 g005
Figure 6. N2 adsorption–desorption isotherms for (a) TiO2 and (b) TiO2-Ag samples (inset pore size distribution pattern).
Nanomaterials 13 02076 g006
Figure 7. Decomposition of hydrazine with and without light radiation at 295 K.
Nanomaterials 13 02076 g007
Figure 8. Influence of reaction temperature (a) and Arrhenius plot for the H2 generation (b) in the absence of visible light.
Nanomaterials 13 02076 g008
Figure 9. Effects of pH (a,b) reusability of catalyst for H2 generation.
Nanomaterials 13 02076 g009
Scheme 1. Schematic representation of thermal decomposition of hydrazine over Ag-TiO2 composite.
Nanomaterials 13 02076 sch001
Figure 10. Volume of generated gas versus time plots for the Ag/TiO2-assisted degradation of hydrazine in presence of visible light.
Nanomaterials 13 02076 g010
Figure 11. Effects of temperature (a) and Arrhenius plot for the H2 generation (b) under visible light radiation.
Nanomaterials 13 02076 g011
Figure 12. (a) Photocatalytic H2 generation from hydrazine by using Ag-modified TiO2 with EDTA hole scavenger, (b) Different scavengers used during photocatalytic hydrazine decomposition over TiO2-Ag catalyst. Na2SO4.
Nanomaterials 13 02076 g012
Scheme 2. The hydrazine photocatalytic decomposition under visible light radiation over Ag-modified TiO2.
Nanomaterials 13 02076 sch002
Table 1. Values of rate constants for H2 generation from hydrazine by Ag-modified TiO2 with and without visible light.
Without Visible Light Radiation
Hydrazine (mol/L)Catalyst (g)pHTemperature (K)kobs (min−1)R2
1.0 × 10−20.09.5295No degradation
1.0 × 10−20.029.52950.0020.996
3.0 × 10−20.029.52950.0040.993
5.0 × 10−20.029.52950.0070.997
7.0 × 10−20.029.52950.0090.991
3.0 × 10−20.039.52950.0050.995
3.0 × 10−20.049.52950.0080.992
3.0 × 10−20.048.52950.0030.992
3.0 × 10−20.0210.52950.0060.992
3.0 × 10−20.0211.52950.0070.991
3.0 × 10−20.0412.52950.0080.992
3.0 × 10−20.029.53000.0060.996
3.0 × 10−20.029.53080.0070.994
3.0 × 10−20.029.53120.0090.994
3.0 × 10−20.029.53180.0170.998
Under Visible Light Radiation
5.0 × 10−30.029.52950.0090.995
1.0 × 10−20.029.52950.0120.992
3.0 × 10−20.029.52950.0180.998
5.0 × 10−20.029.52950.0250.996
7.0 × 10−20.029.52950.0420.991
3.0 × 10−20.039.52950.0320.993
3.0 × 10−20.038.52950.0270.993
3.0 × 10−20.049.52950.0620.995
3.0 × 10−20.0210.52950.0830.994
3.0 × 10−20.0211.52950.0930.991
3.0 × 10−20.0312.52950.0980.993
3.0 × 10−20.029.53000.0210.998
3.0 × 10−20.029.53090.0300.999
3.0 × 10−20.029.53120.0390.998
3.0 × 10−20.029.53180.0440.999
Table 2. Effects of water, oxygen, visible light, and TiO2-Ag on the dehydrogenation of hydrazine at 295 K in alkaline solution.
Reaction ConditionspHObservations
NH2-NH2 + water9.5No production of H2/N2, time = 1 h
NH2-NH2 + water + O29.5No production of H2/N2, time = 1 h
NH2-NH2 + water 9.5No production of H2/N2, time = 1 h
NH2-NH2 + water + visible light9.5No production of H2/N2, time = 1 h
NH2-NH2 + water + O2 + TiO29.5No production of H2/N2, time = 1 h
NH2-NH2 + water + O2 + TiO2-Ag9.5No production of H2/N2, time = 1 h
NH2-NH2 + water + O2 + TiO2-Ag + visible light9.5No production of H2/N2, time = 1 h
NH2-NH2 + water + TiO2-Ag9.545% H2/N2 production, time = 1 h, kobs = 0.007 min−1
NH2-NH2 + water + TiO2-Ag + visible light9.5100% H2/N2 production, time = 40 min, kobs = 0.025 min−1
Table 3. The catalytic activity of different catalysts for the decomposition of aqueous hydrazine.
CatalystActivation Energy at Different ConditionsReference
Ag0No decompositionPresent work
TiO2No decompositionPresent work
Ag-doped TiO2Ea = 57.3 kJ/mol in the darkPresent work
Ag-doped TiO2Ea = 34.4 kJ/mol under visible light Present work
In4NiEa = 38.9 kJ/mol in the dark[67]
Ni0.8Pt0.2/DT-Ti3C2TxEa = 64.3 kJ/mol in the dark[68]
Disclaimer/Publisher’s Note: The statements, opinions and data contained in all publications are solely those of the individual author(s) and contributor(s) and not of MDPI and/or the editor(s). MDPI and/or the editor(s) disclaim responsibility for any injury to people or property resulting from any ideas, methods, instructions or products referred to in the content.

