Abstract
Co1−xZnxFe2O4 nanoparticles (0 ≤ x ≤ 1) have been synthesized via a green sol–gel combustion method. The prepared samples were studied using X-ray diffraction measurements (XRD), transmission electron microscopy (TEM), Raman, and magnetic measurements. All samples were found to be single phases and have a cubic Fd-3m structure. EDS analysis confirmed the presence of cobalt, zinc, iron, and oxygen in all studied samples. Raman spectra clearly show that Zn ions are preferentially located in T sites for low Zn concentrations. Due to their high crystallinity, the nanoparticles show high values of the magnetization, which increases with the Zn content for x < 0.5. The magnetic properties are discussed based on Raman results. Co ferrite doped with 30% of Zn produced the largest SAR values, which increase linearly from 148 to 840 W/gMNPs as the H is increased from 20 to 60 kA/m.
1. Introduction
Magnetic materials with nanometer crystalline sizes are the focus of a large number of researchers due to their interesting changes on physical properties compared to that of their bulk correspondent. The physical properties of these materials can be easily tuned and depend strongly on the chemical composition, crystal structure, shape, and size of the nanoparticle, as well as the cation distribution [1,2]. Among these, cobalt ferrite with or without substitution on cobalt site is technologically important for applications in different fields: biomedicine, anti-cancer drugs, cellular therapy, active components in ferrofluids, magnetic refrigeration, information and energy storage media, sensors, switching devices, high frequency electric devices, recording heads, catalysis, magnetic cell separation, hyperthermia, antibacterial agents, permanent magnets, medical imaging, etc. [3,4,5,6,7,8,9,10,11,12,13,14,15].
CoFe2O4 presents high coercivity, high cubic magneto crystalline anisotropy, moderate saturation magnetization, large magnetostrictive coefficient, and low toxicity [16,17,18,19,20,21]. On the other hand, cobalt ferrite exhibit high mechanical stiffness and chemical stability.
The CoFe2O4, or (Co1−xFex)T(CoxFe2−x)OO4 structure, where x is the inversion parameter, presents a variable occupancy of tetrahedral (T) and octahedral sites (O). The structure changes from a normal spinel (x = 0) to an inverse spinel type (x = 1). In bulk state, the CoFe2O4 ferrite has a predominantly inverse-type spinel structure and crystallizes in a fcc-type lattice, space group . CoFe2O4 is ferrimagnetically ordered, with the magnetic moments of the atoms situated in T and O sublattices being antiparallelly aligned. Depending on the preparation method and the annealing temperature, Co2+ ions could resize in octahedral sites and will strongly influence the structural, magnetic, and electric properties [22,23,24].
ZnFe2O4 crystallize in a normal spinel structure with the Zn2+ ions located mainly in the T sites and Fe3+ ions located in O sites [16,25]. It was reported that the cobalt ferrite physical properties can be adjusted by the substitution with magnetic or non-magnetic ions. Li et al. have reported that the saturation magnetization of Co1−xZnxFe2O4 (prepared using the sol–gel method) increase when Zn ions concentration increases up to x = 0.4, followed by a large decrease for x > 0.5 [26]. The initial increase in the magnetization was explained by the preferential occupation of T sites by Zn2+. When the zinc concentration increases more, the exchange interactions between Fe3+ ions decrease due to the lack of magnetic neighbors and the saturation magnetization decreases. Later, Slatineanu et al. reported that on the same system, prepared by chemical co-precipitation method, the compound with x = 0.2 is optimum considering magnetic and dielectric properties [27]. Atif et al. has shown that the maximum value of the saturation magnetization on Co1−xZnxFe2O4 prepared by sol–gel method was obtained for x = 0.4 and was explained by the preferential occupation of T sites by Zn ions [28]. Tanaka et al. have prepared zinc ferrites by precipitation of the rapidly quenched oxides [29]. Small amounts of Zn and magnetite was found in the prepared samples. From Zn K-edge EXAFS studies, it was shown that some of the Zn2+ ions occupy octahedral sites together with the occupancy of tetrahedral sites by the Fe3+ ions.
Previously, we have studied the structural and magnetic properties of CoFe2O4 nanoparticles and CoFe2O4 @SiO2 @Au nanocomposites designed for magnetoplasmonic applications [30,31]. To check the Zn ion occupancy in the cobalt ferrite structure and to improve the values of saturation magnetization, we have prepared cobalt ferrites with Zn substitution at Co sites in very large concentration ranges. In this paper, we present our results on the influence of Zn on the structural and physical properties of cobalt ferrite. The Co1−xZnxFe2O4 nanoparticles have been synthesized via a green sol–gel combustion method. Chemical reduction, often used to produce nanoferrites, utilizes organic solvents. Risk-free chemicals, environmentally mild solvents and feasible materials are key factors to the application of green strategies [32,33]. The green synthesis of nanoparticles denotes a development above other methods, since it is simpler, easy to use, and the obtained nanoferrites are often more stable. The prepared samples were studied using X-ray diffraction measurements (XRD), transmission electron microscopy (TEM), scanning electron microscopy (SEM), Raman, and magnetic measurements. Raman spectra clearly show that Zn ions are preferentially located in T sites for low Zn concentrations. The magnetic properties are discussed based on Raman results.
2. Materials and Methods
2.1. Samples Preparation
Co1−xZnxFe2O4 (x = 0, 0.05, 0.1, 0.2, 0.3, 0.4, 0.5, 0.6, 0.7, 0.8, 0.9, 1) nanoparticles were synthesized via a green, sucrose, and pectin-based, sol–gel combustion method. The synthesis can be considered green as both the poly-condensation and chelating agents were molecules of vegetal origin. The sucrose used was extracted from sugar beets and the pectin used for the synthesis was extracted from citrus fruits. The reagents, Fe(NO3)3⸱9H2O (Iron(III) nitrate nonahydrate), Co(NO3)2⸱6H2O (Cobalt nitrate hexahydrate 97.7%), Zn(NO3)2 (Zinc nitrate hexahydrate 98%), were purchased from Alfa Aesar. All calculations were performed for 2 mmols of nanoparticles. Stoichiometric quantities of each precursor were weighed and dissolved in Milli-Q water under vigorous magnetic stirring at 60 °C. After 1 h, 14.9 mmols sucrose (≈5 g) was added to each solution. After the full homogenization, the pH of the solutions was lowered to approximately 2 using a 65% HNO3 solution. For each solution, one gram of pectin was weighed and slowly added to the mixture under magnetic stirring. This was performed in order to stop the pectin from agglomerating. After 20 more minutes of further stirring, the solutions were poured in ceramic capsules and placed on a sand bath at 240 °C for 24 h in order to evaporate the water and obtain the gel. The spongy, dried gel was then annealed in air at 700 °C for 2 h in order to decompose the organic part of the gel. A fine nanopowder was obtained.
2.2. Characterization
The crystal structure and crystallite sizes of Co1−xZnxFe2O4 nanoparticles were determined by XRD measurements, performed at ambient temperature, with a Bruker D8 Advance diffractometer. The intensities were measured from 20° to 80° in continuous mode with a step size of 0.03° and a counting rate of 5 s per scanning step. The lattice parameters were obtained by Rietveld refinement of XRD patterns using FullProf Suite Software [34]. The instrumental resolution function (IRF) was evaluated by fitting the diffraction pattern of an LaB6 NIST standard and recorded under the same experimental conditions as those used for measuring the ferrite nanoparticles, and the IRF data file was provided to the program in order to allow subsequent refinement of the diffraction pattern of the samples. The refinement was performed based on the Thompson–Cox–Hastings pseudo-Voigt functions for peaks profile and the refined parameters were the lattice parameter, oxygen position, zero-shift correction, background parameters, isotropic temperature factor, and peak shape parameters. The crystallite sizes were estimated using the Debye–Scherrer equation:
where β is the peak full width at half maximum (in radians) at the observed peak angle θ, k is the crystallite shape factor (was considered 0.9), and λ is the X-ray wavelength.
The morphology of the synthesized nanoparticles was investigated by transmission electron microscopy (TEM) and scanning electron microscopy (SEM) using a Hitachi HD2700 CFEG STEM at 200 kV with secondary electron imaging capability. The energy dispersive X-ray spectroscopy (EDS) measurements were performed in order to analyze the composition of the prepared nanocomposites.
Dry nanoparticles were resuspended in 0.5 mL of distilled water and sonicated for 10 s in an ultrasonic bath to obtain a suspension. From here, 10 μL were pipetted onto a quartz plate enabling firm and localized adhesion of the nanoparticles. Micro-Raman analysis was done after complete water evaporation. A Renishaw InVia Reflex confocal Raman microscope was used for structural analysis, using 100× objective (NA 0.9) and He-Ne laser emitting at 632.8 nm (full power 17 mW). The spectra were acquired from the nanoparticle aggregates about 5 μm large, with 60 s integration, 5 additive scans per spectrum, and 1.7 mW laser power. These conditions allowed the acquisition of Raman signal of sufficient intensity without causing phase transitions or fluorescence from the sample due to laser heat input [35]. At least 3 spectra were acquired from different points of each sample. Raman spectra were processed in Origin 8.5 software.
Magnetic measurements were performed in the 4.2–300 K temperature range and external magnetic fields up to 10 T by using a vibrating sample magnetometer from Cryogenic Limited London. The heating efficiency was evaluated using a commercially available magnetic hyperthermia system, the Easy Heat 0224 from Ambrell (Scottsville, NY, USA), equipped with an optical fiber temperature sensor (0.1 °C accuracy), providing alternating magnetic field (AMF) of fixed frequency (355 kHz) and variable amplitude (5–65 kA/m). Details about specific absorption rate (SAR) calculations are provided in the Supplementary Materials (Section S1).
3. Results
3.1. Morphology and Crystal Structure
The X-ray diffraction (XRD) measurements (Figure 1a) indicate that all samples are single phases and have a cubic Fd-3m structure. In order to determine the lattice parameters, Rietveld analysis was performed for all samples using FullProf software [34], as shown for Co0.7Zn0.3Fe2O4 in Figure 1b. The Rietveld analysis shows an almost linear increase in the lattice parameter/unit cell volume with the Zn content (Table 1), as expected considering the larger ionic radius of Zn, as compared with that of Co ions. The lattice parameter values and their Zn content dependence is close to that previously reported by other groups in a narrower concentration range [27,28,29] and opposite to ref. [26], where a decrease was shown with a minimum at x = 0.3 followed by a nonlinear increase with Zn content. The crystallinity of our samples is probably higher than in that case.
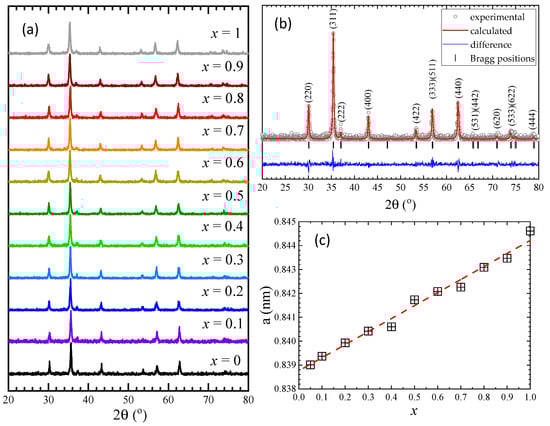
Figure 1.
(a) XRD patterns at room temperature of Co1−xZnxFe2O4 nanoparticles, (b) Rietveld refinement results for Co0.7Zn0.3Fe2O4, (c) The lattice parameter/unit cell volume dependence with Zn concentration for Co1−xZnxFe2O4.

Table 1.
Structural parameters and Rietveld agreement factors, such as weighted profile factor (Rwp), expected factor (Rexp), and goodness-of-fit (χ2), of Co1−xZnxFe2O4 nanoparticles.
The crystallite sizes, calculated using the Debye–Scherrer formula after subtracting the instrumental peak broadening, were found to be between 30 nm and 40 nm for all investigated Co1−xZnxFe2O4 samples.
The TEM investigations of the Co1−xZnxFe2O4 samples reveal that well-defined nanoparticles tend to agglomerate due to their significant magnetic interaction that competes with the much weaker electrostatic repulsion (Figure 2). The analysis of the TEM images shows the presence of nanoparticles of sizes between 15 nm and 70 nm, with a mean diameter close to the values obtained from XRD (Table 2), indicating that most of the Co1−xZnxFe2O4 nanoparticles are single crystals and have high crystallinity. One can see that the nanoparticles are highly polydisperse and the error bars of the dimensions obtained from TEM measurements indicate that the nanoparticles’ average diameters could be higher compared with the mean diameter obtained from XRD data.
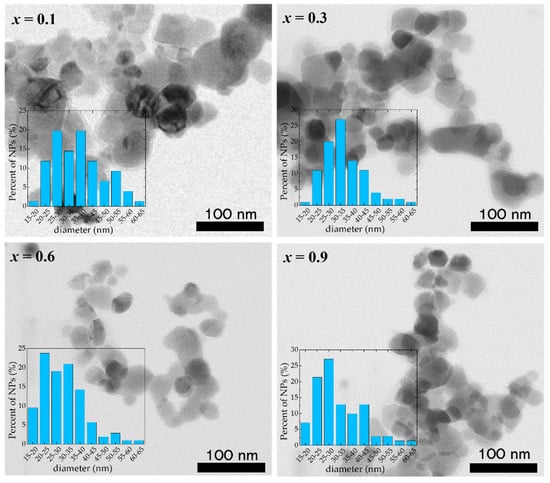
Figure 2.
TEM images of Co1−xZnxFe2O4 nanoparticles.
Table 2.
Average Co1−xZnxFe2O4 nanoparticles’ size determined from XRD and TEM investigations, and atomic elemental composition theoretically calculated and determined from EDS measurements.
Elemental analysis by EDS confirmed the presence of Co, Fe, Zn, and O elements in all studied samples. An example of the EDS spectra for Co0.4Zn0.6Fe2O4 nanoparticles is given in Figure 3. The EDS spectra indicate that there are no other impurities present in the nanoparticles. The elemental mapping for the sample with x = 0.6 is shown in Figure 4. One can see that the Co, Zn, Fe, and O elements are almost homogeneously distributed across the selected zone of the samples investigated. Similar results were obtained for all studied samples. The elemental abundances for the studied samples are listed in Table 2. These data show that the concentrations of Zn, Co, and Fe elements in the resulting product are in a close agreement with the expected stoichiometric ratio.
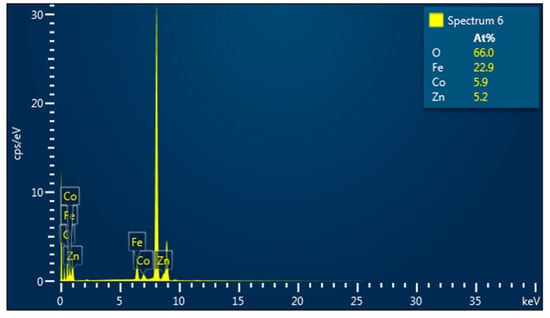
Figure 3.
EDS spectra for Co0.4Zn0.6Fe2O4 nanoparticles.
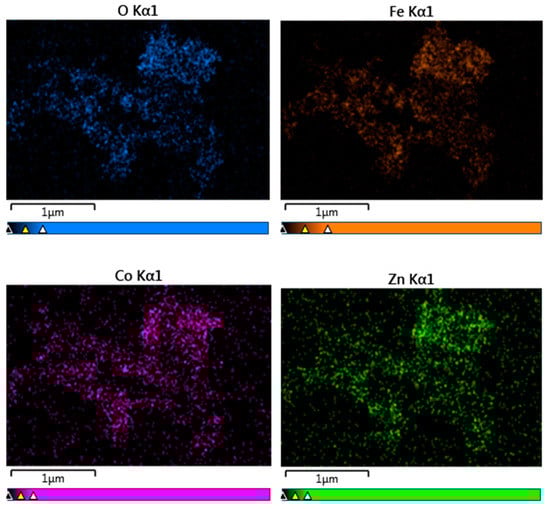
Figure 4.
Elemental mapping of Co0.4Zn0.6Fe2O4 nanoparticles.
3.2. Raman Spectra
Raman spectroscopy is a useful tool in analyzing the cation distribution in spinels. The cubic inverse/mixed ferrite structure gives rise to 39 normal vibrational modes, out of which 5 are Raman active: A1g, Eg, and 3T2g [36,37,38,39]. The Raman band configuration of iron oxides [35], face-centered cubic structure ferrites with Fd-3m symmetry, such as magnetite and maghemite [40] and doped ferrites [41,42,43,44,45], has been explored by several previous studies. Above 600 cm−1, the observed A1g Raman modes are due to the symmetric metal-O stretching vibrations at tetrahedral sites, while the lower T2g and Eg frequency modes are associated with metal-O vibrations at octahedral sites [46].
Figure 5 shows the Raman spectra recorded for Co1−xZnxFe2O4 nanoparticles as 0.05 ≤ x ≤ 0.9. The T2g(1) band is centered at about 180 cm−1, slightly lower than observed in magnetite (196 cm−1) and higher than in Mn-Zn-doped ferrites (170 cm−1) [44]. Above 200 cm−1, the Raman spectra of Co1−xZnxFe2O4 nanoparticles show several modes, located at about 310 cm−1, 350 cm−1, 470 cm−1, 560 cm−1, 610 cm−1, 650 cm−1, and 690 cm−1, that change in intensity with the Zn content. In order to assign the different contributions to the recorded spectra, the modes associated with Co, Zn, and Fe ions located in the tetrahedral and/or octahedral sites have been considered. In cobalt ferrite, the A1g modes located at about 620 cm−1 and 695 cm−1 were found to correspond to Co and Fe ions located at the tetrahedral site, while the T2g(3) modes, corresponding to the Fe and Co ions at the octahedral sites, are located at about 470 cm−1 and 575 cm−1 [41]. A detailed analysis of the Raman spectra in ZnFe2O4 revealed that the A1g broad peak around 650 cm−1 is the result of the overlapping of two signals centered around 641 cm−1 and 685 cm−1, which correspond to the modes inside ZnO4 and FeO4 units, while the T2g(3) modes due to the Fe and Zn ions are located at about 470 cm−1 and 510 cm−1 [46].
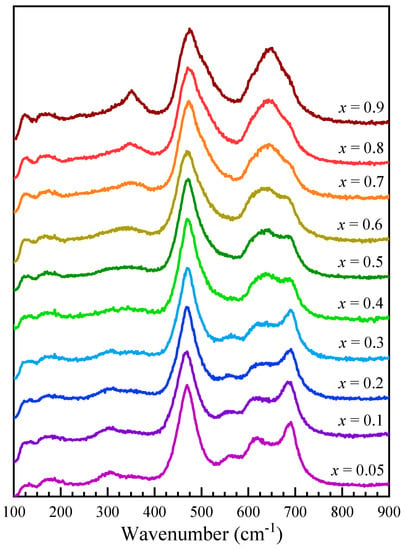
Figure 5.
Raman spectra of Co1−xZnxFe2O4 nanoparticles.
Raman spectroscopy analysis and spectra deconvolution was conducted primarily to explore if cation distribution between the tetrahedral and octahedral sites can be quantified. The movement of additional cation types to tetrahedral sites adds new components to the A1g band, the position of which is loosely correlated to respective ionic radius of the dopant [44]. Tetrahedrally coordinated zinc within ferrites exhibits a band in the 630–650 cm−1 range [44,45,46], well separated from the Co–O and Fe–O bands. Indeed, the fits show the three A1g components at 605–610 cm−1 representing Co–O, at 635–650 cm−1 representing Zn–O, and at 680–690 cm−1 representing Fe–O vibrations.
In order to analyze the cation distribution, the Raman spectra of Co1−xZnxFe2O4 nanoparticles were fitted with six components in the region between 380 cm−1 and 800 cm−1, which correspond to the Fe, Zn, and Co ions located in the tetrahedral and octahedral sites, with widths between 40 cm−1 and 70 cm−1. The fitting results indicate position shifts with only up to ± 10 cm−1, indicating the preservation of the general Co ferrite phase (Table 3).
Table 3.
Fitting results of the main Raman modes for Co1−xZnxFe2O4 nanoparticles.
The deconvolution of the Raman spectra, as shown for selected spectra in Figure 6, reveal that for low Zn content, the Zn ions substitute the Co2+ ions in the tetrahedral sites, as indicated by the decrease in the intensity of the peak located at about 610 cm−1, associated with the A1g mode of the CoO4 units. As the Zn content increases for x > 0.4, the contribution from the Zn ions in the octahedral sites at about 510 cm−1 increases. The changes in the intensities of the Raman modes attributed to the Fe ions in the tetrahedral sites (~680 cm−1) and octahedral sites (~470 cm−1) indicate changes in the inversion degree with the Co substitution by Zn.
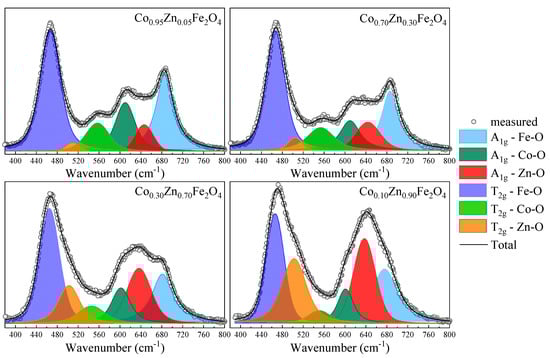
Figure 6.
Fitting results for Raman spectra of Co1−xZnxFe2O4 nanoparticles.
3.3. Magnetic Measurements
The saturation magnetization, , at 4 K of Co1−xZnxFe2O4 nanoparticles was determined from magnetic measurements in fields up to 10 T (Figure 7) using the approach to saturation law:
where a is the coefficient of magnetic hardness and is the Pauli type contribution.
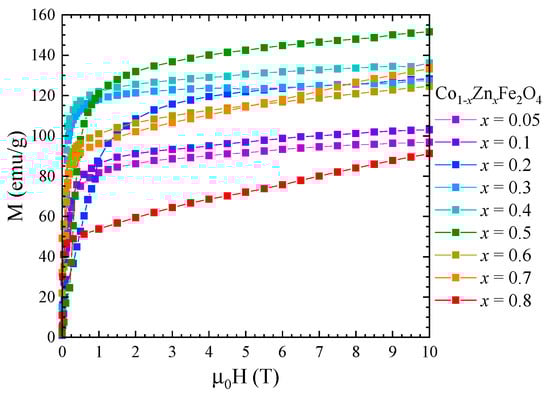
Figure 7.
Magnetization isotherms of Co1−xZnxFe2O4 nanoparticles recorded at 4 K.
One can see that the saturation magnetization increases at the beginning when Zn concentration increases with a maximum at x = 0.5, followed by a strong decrease in the higher Zn content—Figure 8. Previous studies reported a maximum value of the saturation magnetization for x = 0.2 [27] and x = 0.4 [26,28]. The fact that in our case the maximum saturation magnetization of about 5.8 µB was obtained at higher Zn content can be explained by the high quality and crystallinity of our samples. The initial increase in saturation magnetization with Zn doping level is attributed to the preferential substitution of Co2+ by nonmagnetic Zn2+ ions in the tetrahedral sites, in agreement with the Raman data. For x ≥ 0.5, the saturation magnetization decreases, which can be explained by the substitution of Co ions in the octahedral coordination, as indicated by the Raman spectra. The fact that there is no linear dependence of the saturation magnetization with the Zn content for either x < 0.5 or x > 0.5 is consequence of the changes in inversion degree with the concentration.
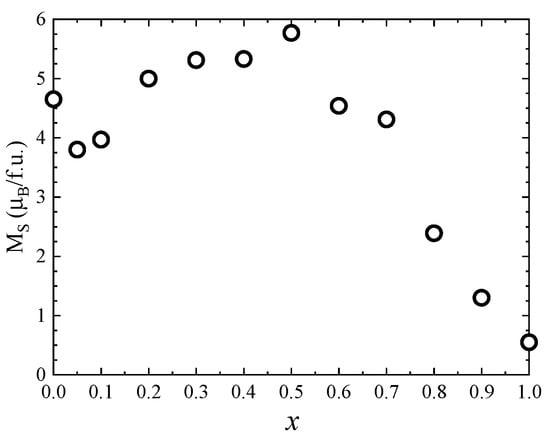
Figure 8.
Saturation magnetization of Co1−xZnxFe2O4 nanoparticles.
The magnetic properties of Co1−xZnxFe2O4 nanoparticles at room temperature were also investigated by recording the hysteresis loops between −4 T and 4 T (Figure 9). The coercive field has a maximum value of 0.05 T for x = 0.1 and decreases with the Zn content for x > 0.1. The magnetization values at 300 K in 4 T (Figure 10) show a similar behavior to that of the spontaneous magnetization at 4 K.
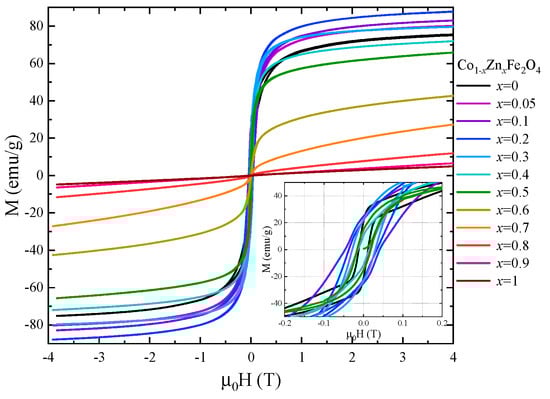
Figure 9.
Hysteresis loops recorded at room temperature for Co1−xZnxFe2O4 nanoparticles.
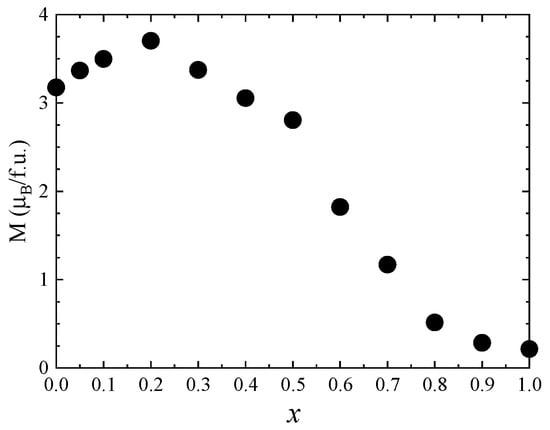
Figure 10.
The magnetization values in 4 T of Co1−xZnxFe2O4 nanoparticles at 300 K.
The magnetically induced heating capabilities of five samples were investigated in water at one certain concentration of 1 mgMNPs/mL. The Box–Lucas function was employed to fit the heating curves and the resulting parameters were used to evaluate the specific absorption rate (SAR) in watts per unit mass of MNPs (W/gMNPs). The SAR values were plotted as a function of the amplitude (H) of the applied AMF, ranging from 10 kA/m to 60 kA/m (step of 10 kA/m) at a fixed frequency of 355 kHz. The contribution from pure water at each H was measured and subtracted as the background. Figure 11 summarizes the obtained mean SAR values for the analyzed ferrite particles. The Co ferrites particles without Zn content present low SAR values compared with other studies [47,48,49]. At the H of 10 kA/m the SAR is 26 W/gMNPs, which increases with the increasing H, reaching a value of 113 W/gMNPs for the highest H of 60 kA/m used in the study. A Zn doping of 5% and 10% do not significantly influence the heating performances of Co ferrite particles, specifically for H between 10 and 40 kA/m. A clear increase in SAR values with Zn doping is observed only for the H of 50 and 60 kA/m. Excepting the field H = 10 kA/m, for the rest values of H (20–60 kA/m), the SAR values increase considerably for Co ferrite bearing a Zn doping of 20%. A SAR of 88 and 112 W/gMNPs is recorded at 20 and 30 kA/m, respectively, which is double that of the previous three samples. Starting with 40 kA/m, the SAR increment is faster, going up to 540 W/gMNPs for the highest H of 60 kA/m. The SAR evolution with H is typical of a hard sample [47]. It is worth mentioning that, for each H value, the SAR increased as the Zn doping level was increased. This behavior can be explained by considering the similar dependence of saturation magnetization on the Zn content [50].
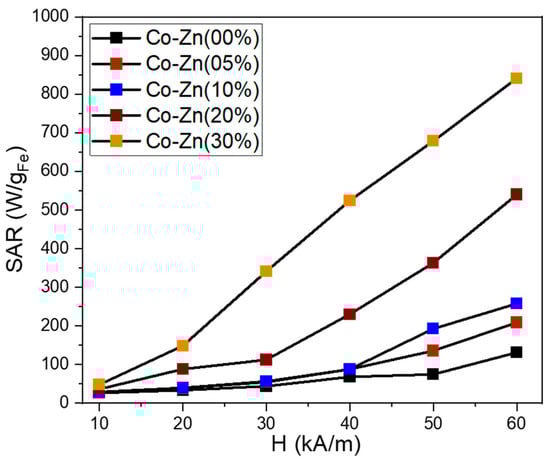
Figure 11.
Specific absorption rate (SAR) dependence on the magnetic field amplitude (H) for the five ferrite samples dispersed in water at a concentration of 1 mgMNPs/mL.
The magnetic characterization revealed that by further increasing the Zn content to 30%, both the Ms and Hc decreased. However, these particles exhibit the largest SAR values among all five samples. With respect to the previous sample (20% Zn content), the SAR values are enhanced by a factor that increase from 1.3 to 3 as the H is swept from 10 to 60 kA/m. It can be observed that the SAR values increase linearly from 148 to 840 W/gMNPs as the H is increased from 20 to 60 kA/m. This peculiar dependence of SAR with the applied H is in accordance with the evolution of magnetization that does not saturate and exhibits a slow positive slope as the external static magnetic field is increased. Due to its very good heating capabilities, this sample represents a good candidate for future in vitro magnetic hyperthermia experiments.
4. Conclusions
Highly crystalline Co1−xZnxFe2O4 nanoparticles (0 ≤ x ≤ 1), with average sizes between 30 nm and 40 nm, have been synthesized via a green sol–gel combustion method, as shown by XRD and TEM structural investigations. Elemental analysis by EDS confirmed the presence of Co, Fe, Zn, and O elements in all studied samples. Raman spectroscopy was employed in analyzing the cation distribution, since the Raman modes corresponding to the Fe, Zn, and Co ions located in the tetrahedral and octahedral sites are well separated in the region between 380 cm−1 and 800 cm−1. The deconvolution of the spectra indicates that for low Zn content (x < 0.4), the Zn ions preferentially substitute the Co2+ ions in the tetrahedral sites. Additionally, the changes in the intensities of the Raman modes attributed to the Fe ions in the tetrahedral sites and octahedral sites suggest changes in the inversion degree with the Co substitution by Zn. The magnetic properties of the investigated nanoparticles reflect the structural changes. Due to their high crystallinity, the nanoparticles show high values of the magnetization, which increases with the Zn content for x < 0.5, which can be explained by the substitution of Co ions in the tetrahedral sites. For higher Zn concentration, as the Zn ions replace Co in the octahedral sites, the total magnetization of the Co1−xZnxFe2O4 nanoparticles decreases.
The increase in the Zn doping level led to an increase in the heating performances of Co ferrite. With respect to the undoped sample, an SAR enhancement by a factor between 4.5 and 9 over the H range between 20 and 60 kA/m was detected for 30% Zn content.
In the future, we propose to do in vitro hyperthermia experiments and to cover these nanoparticles with a BaTiO3 shell in order to test the possibility of controlling the shell electric polarization with the magnetic field while keeping in mind possible applications in cancer treatment.
Supplementary Materials
The following are available online at https://www.mdpi.com/article/10.3390/nano13010189/s1, the details of magnetic measurements and specific absorption rate (SAR) calculations are provided in the supplementary materials. Reference [51] are cited in the supplementary materials.
Author Contributions
Conceptualization, R.T., R.D. and E.B.; investigation, A.S., R.B., G.S., R.D., R.H., L.B.-T., F.N. and C.I.; resources, R.B., A.S. and R.T.; formal analysis, A.S., R.B., G.S., R.D., R.H., L.B.-T., F.N. and C.I.; writing—original draft preparation, A.S., R.B., C.I., R.T. and R.D.; writing—review and editing R.D. and R.T.; visualization, R.D. and R.T.; supervision, R.D., R.T. and E.B.; project administration, R.T. and E.B.; funding acquisition, E.B. and R.T. All authors have read and agreed to the published version of the manuscript.
Funding
This research received no external funding.
Data Availability Statement
Not applicable.
Conflicts of Interest
The authors declare no conflict of interest.
References
- Ibrahim, K.; Saeed, K. Khan Idrees Nanoparticles: Properties, applications and toxicities. Arab. J. Chem. 2019, 12, 908–931. [Google Scholar] [CrossRef]
- Jeevanandam, J.; Barhoum, A.; Chan, Y.S.; Dufresne, A.; Danquah, M.K. Review on nanoparticles and nanostructured materials: History, sources, toxicity and regulations. Beilstein J. Nanotechnol. 2018, 9, 1050–1074. [Google Scholar] [CrossRef] [PubMed]
- Sagayaraj, R.; Aravazhi, S.; Chandrasekaran, G. Review on structural and magnetic properties of (Co–Zn) ferrite nanoparticles. Int. Nano Lett. 2021, 11, 307–319. [Google Scholar] [CrossRef]
- Thakur, P.; Chahar, D.; Taneja, S.; Bhalla, N.; Thakur, A. A review on MnZn ferrites: Synthesis, characterization and applications. Ceram. Int. 2020, 46, 15740–15763. [Google Scholar] [CrossRef] [PubMed]
- Balanov, V.A.; Kiseleva1, A.P.; Krivoshapkina, E.F.; Kashtanov, E.A.; Gimaev, R.R.; Zverev, V.I.; Krivoshapkin, P.V. Synthesis of (Mn(1−x)Znx)Fe2O4 nanoparticles for magnetocaloric applications. J. Sol.-Gel. Sci. Technol. 2020, 95, 795–800. [Google Scholar] [CrossRef]
- Krishna, V.D.; Wu, K.; Perez, A.M.; Wang, J.P. Giant magnetoresistance-based biosensor for detection of influenza A virus. Front. Microbiol. 2016, 7, 400. [Google Scholar] [CrossRef] [PubMed]
- Srinivasan, Y.S.; Kishore, M.; Paknikar, K.M.; Bodas, D.; Gajbhiye, V. Applications of cobalt ferrite nanoparticles in biomedical nanotechnology. Nanomedicine 2018, 13, 10. [Google Scholar] [CrossRef]
- Kazemi, M.; Ghobadi, M.; Mirzaie, A. Cobalt ferrite nanoparticles (CoFe2O4 MNPs) as catalyst and support: Magnetically recoverable nanocatalysts in organic synthesis. Nanotechnol. Rev. 2018, 7, 43–68. [Google Scholar] [CrossRef]
- Nayeem, F.; Parveez, A.; Chaudhuri, A.; Sinha, R.; Khader, S.A. Effect of Zn+2 doping on structural, dielectric and electrical properties of cobalt ferrite prepared by auto combustion method. Mater. Today Proc. 2017, 4, 12138–12143. [Google Scholar] [CrossRef]
- Xi, G.; Xi, Y. Effects on magnetic properties of different metal ions substitution cobalt ferrite synthesis by sol-gel auto-combustion route using used batteries. Mater. Lett. 2016, 164, 444–448. [Google Scholar] [CrossRef]
- Iacovita, C.; Florea, A.; Scorus, L.; Pall, E.; Dudric, R.; Moldovan, A.I.; Stiufiuc, R.; Tetean, R.; Lucaciu, C.M. Hyperthermia, Cytotoxicity, and Cellular Uptake Properties of Manganese and Zinc Ferrite Magnetic Nanoparticles Synthesized by a Polyol-Mediated Process. Nanomaterials 2019, 9, 1489. [Google Scholar] [CrossRef] [PubMed]
- Tatarchuk, T.R.; Paliychuk, N.D.; Bououdina, M.; Al-Najar, B.; Pacia, M.; Macyk, W.; Shyichuk, A. Effect of cobalt substitution on structural, elastic, magnetic and optical properties of zinc ferrite nanoparticles. J. Alloys Comp. 2018, 731, 1256–1266. [Google Scholar] [CrossRef]
- Naik, M.M.; Naik, H.B.; Nagaraju, G.; Vinuth, M.; Vinu, K.; Viswanath, R. Green synthesis of zinc doped cobalt ferrite nanoparticles: Structural, optical, photocatalytic and antibacterial studies. Nano-Struct. Nano-Objects 2019, 19, 100322. [Google Scholar] [CrossRef]
- Chakradhary, V.K.; Ansari, A.; Akhtar, M.J. Design, synthesis and testing of high coercivity cobalt doped nickel ferrite nanoparticles for magnetic applications. J. Magn. Magn. Mater. 2019, 469, 674–680. [Google Scholar] [CrossRef]
- Dippong, T.; Levei, E.A.; Cadar, O. Recent Advances in Synthesis and Applications of MFe2O4 (M = Co, Cu, Mn, Ni, Zn) Nanoparticles. Nanomaterials 2021, 11, 1560. [Google Scholar] [CrossRef]
- Kaur, H.; Singh, A.; Kumar, A.; Ahlawat, D.S. Structural, thermal and magnetic investigations of cobalt ferrite doped with Zn2+ and Cd2+ synthesized by auto combustion method. J. Magn. Magn. Mater. 2019, 474, 505–511. [Google Scholar] [CrossRef]
- Xiong, Q.Q.; Tu, J.P.; Shi, S.J.; Liu, X.Y.; Wang, X.L.; Gu, C.D. Ascorbic acid-assisted synthesis of cobalt ferrite (CoFe2O4) hierarchical flower-like microspheres with enhanced lithium storage properties. J. Power Sources 2014, 256, 153–159. [Google Scholar] [CrossRef]
- Torkian, S.; Ghasemi, A.; Razavi, R.S. Cation distribution and magnetic analysis of wideband microwave absorptive CoxNi1−xFe2O4 ferrites. Ceram. Int. 2017, 43, 6987–6995. [Google Scholar] [CrossRef]
- Mahala, C.; Sharma, M.D.; Basu, M. 2D nanostructures of CoFe2O4 and NiFe2O4: Efficient oxygen evolution catalyst. Electrochim. Acta 2018, 273, 462–473. [Google Scholar] [CrossRef]
- Manikandan, A.; Sridhar, R.; Arul, S.A.; Ramakrishna, S. A simple aloe vera plant-extracted microwave and conventional combustion synthesis: Morphological, optical, magnetic and catalytic properties of CoFe2O4 nanostructures. J. Molec. Struct. 2014, 1076, 188–200. [Google Scholar] [CrossRef]
- Li, X.; Sun, Y.; Zong, Y.; Wei, Y.; Liu, X.; Li, X.; Peng, Y.; Zheng, X. Size-effect induced cation redistribution on the magnetic properties of well-dispersed CoFe2O4 nanocrystals. J. Alloy Comp. 2020, 841, 155710. [Google Scholar] [CrossRef]
- Nlebedim, I.C.; Snyder, J.E.; Moses, A.J.; Jiles, D.C. Dependence of the magnetic and magnetoelastic properties of cobalt ferrite on processing parameters. J. Magn. Magn. Mater. 2010, 322, 3938–3942. [Google Scholar] [CrossRef]
- Muhammad, A.; Sato-Turtelli, R.; Kriegisch, M.; Grössinger, R.; Kubel, F.; Konegger, T. Large enhancement of magnetostriction due to compaction hydrostatic pressure and magnetic annealing in CoFe2O4. J. App. Phys. 2012, 111, 013918. [Google Scholar] [CrossRef]
- Köseoğlu, Y.; Alan, F.; Tan, M.; Yilgin, R.; Öztürk, M. Low temperature hydrothermal synthesis and characterization of Mn doped cobalt ferrite nanoparticles. Ceram. Int. 2012, 38, 3625–3634. [Google Scholar] [CrossRef]
- Dippong, T.; Levei, E.A.; Cadar, O. Investigation of Structural, Morphological and magnetic properties of MFe2 O4 (M = Co, Ni, Zn, Cu, Mn) obtained by thermal decomposition. Int. J. Mol. Sci. 2022, 23, 8483. [Google Scholar] [CrossRef]
- Wang, L.; Li, F.-S. Structural and magnetic properties of Co1−xZnxFe2O4 nanoparticles. Chin. Phys. B 2008, 17, 1858. [Google Scholar] [CrossRef]
- Slatineanu, T.; Iordan, A.R.; Oancea, V.; Palamaru, M.N.; Dumitru, I.; Constantin, C.P.; Caltun, O.F. Magnetic and dielectric properties of Co–Zn ferrite. Mater. Sci. Eng. B 2013, 178, 1040–1047. [Google Scholar] [CrossRef]
- Atif, M.; Asghar, M.W.; Nadeem, M.; Khalid, W.; Ali, Z.; Badshah, S. Synthesis and investigation of structural, magnetic and dielectric properties of zinc substituted cobalt ferrites. J. Phys. Chem. Solids 2018, 123, 36–42. [Google Scholar] [CrossRef]
- Tanaka, K.; Makita, M.; Shimizugawa, Y.; Hirao, K.; Soga, N. Structure and high magnetization of rapidly quenched zinc ferrite. J. Phys. Chem. Solids 1998, 59, 1611–1618. [Google Scholar] [CrossRef]
- Bortnic, R.; Szatmari, A.; Souca, G.; Hirian, R.; Dudric, R.; Barbu-Tudoran, L.; Toma, V.; Tetean, R.; Burzo, E. New Insights into the Magnetic Properties of CoFe2O4@SiO2@Au Magnetoplasmonic Nanoparticles. Nanomaterials 2022, 12, 942. [Google Scholar] [CrossRef]
- Burzo, E.; Tetean, R. New nsights on the Spin Glass Behavior in Ferrites Nanoparticles. Nanomaterials 2022, 12, 1782. [Google Scholar] [CrossRef] [PubMed]
- Liu, S.; Tao, D.; Zhang, L. Cellulose scaffold: A green template for the controlling synthesis of magnetic inorganic nanoparticles. Powder Technol. 2012, 217, 502–509. [Google Scholar] [CrossRef]
- Hermosa, G.C.; Liao, C.S.; Wu, H.S.; Wang, S.F.; Liu, T.Y.; Jeng, K.S.; Lin, S.S.; Chang, C.F.; Sun, A.A. Green Synthesis of Magnetic Ferrites (Fe3O4, CoFe2O4, and NiFe2O4) Stabilized by Aloe Vera Extract for Cancer Hyperthermia Activities. IEEE Trans. Magn. 2022, 58, 5400307. [Google Scholar] [CrossRef]
- Rietveld, H.M. A profile refinement method for nuclear and magnetic structures. J. Appl. Crystallogr. 1969, 2, 65. [Google Scholar] [CrossRef]
- De Faria, D.L.A.; Venâcio Silva, S.; de Oliveira, M.T. Raman Microspectroscopy of Some Iron Oxides and Oxyhydroxide. J. Raman Spectrosc. 1997, 28, 873. [Google Scholar] [CrossRef]
- Graves, P.R.; Johnston, C.; Campaniello, J.J. Raman scattering in spinel structure ferrites. Mater. Res. Bull. 1988, 23, 1651–1660. [Google Scholar] [CrossRef]
- Wang, Z.; Lazor, P.; Saxena, S.K.; O’Neill, H.S.C. High pressure Raman spectroscopy of ferrite MgFe2O4. Mater. Res. Bull. 2002, 37, 1589–1602. [Google Scholar] [CrossRef]
- de Wijs, G.A.; Fang, C.M.; Kresse, G. First-principles calculation of the phonon spectrum of MgAl2O4 spinel. Phys. Rev. B 2002, 65, 094305. [Google Scholar] [CrossRef]
- Lazzeri, M.; Thibaudeau, P. Ab initio Raman spectrum of the normal and disordered MgAl2O4 spinel. Phys. Rev. B 2006, 74, 140301. [Google Scholar] [CrossRef]
- Chourpa, I.; Douziech-Eyrolles, L.; Ngaboni-Okassa, L.; Fouquenet, J.F.; Cohen-Jonathan, S.; Souce, M.; Marchais, H.; Dubois, P. Molecular composition of iron oxide nanoparticles, precursors for magnetic drug targeting, as characterized by confocal Raman microspectroscopy. Analyst 2005, 130, 1395–1403. [Google Scholar] [CrossRef]
- Chandramohan, P.; Srinivasan, M.P.; Velmurugan, S.; Narasimhan, S.V. Cation distribution and particle size effect on Raman spectrum of CoFe2O4. J. Solid State Chem. 2011, 184, 89–96. [Google Scholar] [CrossRef]
- Thota, S.; Kashyap, S.C.; Sharma, S.K.; Reddy, V.R. Micro Raman, Mossbauer and magnetic studies of manganese substituted zinc ferrite nanoparticles: Role of Mn. Phys. Chem. Solid 2015, 91, 136. [Google Scholar] [CrossRef]
- Testa-Anta, M.; Ramos-Docampo, M.A.; Comesaña-Hermo, M.; Rivas-Murias, B.; Salgueiriño, V. Raman spectroscopy to unravel the magnetic properties of iron oxide nanocrystals for bio-related applications. Nanoscale Adv. 2019, 1, 2086–2103. [Google Scholar] [CrossRef]
- Nekvapil, F.; Bunge, A.; Radu, T.; Cinta Pinzaru, S.; Turcu, R. Raman spectra tell us so much more: Raman features and saturation magnetization for efficient analysis of manganese zinc ferrite nanoparticles. J. Raman Spectrosc. 2020, 51, 959–968. [Google Scholar] [CrossRef]
- Nekvapil, F.; Bortnic, R.A.; Leoştean, C.; Barbu-Tudoran, L.; Bunge, A. Characterization of the lattice transitions and impurities in manganese and zinc doped ferrite nanoparticles by Raman spectroscopy and x-ray diffraction (XRD). Anal. Lett. 2022, 56, 42–52. [Google Scholar] [CrossRef]
- Galinetto, P.; Albini, B.; Bini, M.; Mozzati, M. Raman spectroscopy in Zinc Ferrites Nanoparticles. In Raman Spectroscopy; IntechOpen: London, UK, 2018. [Google Scholar] [CrossRef]
- Iacovita, C.; Stiufiuc, G.F.; Dudric, R.; Vedeanu, N.; Tetean, R.; Stiufiuc, R.I.; Lucaciu, C.M. Saturation of Specific Absorption Rate for Soft and Hard Spinel Ferrite Nanoparticles Synthesized by Polyol Process. Magnetochemistry 2020, 6, 23. [Google Scholar] [CrossRef]
- Mameli, V.; Musinu, A.; Ardu, A.; Ennas, G.; Peddis, D.; Niznansky, D.; Sangregorio, C.; Innocenti, C.; Nguyen, T.K.; Cannas, C. Studying the effect of Zn-substitution on the magnetic and hyperthermic properties of cobalt ferrite nanoparticles. Nanoscale 2016, 8, 10124–10137. [Google Scholar] [CrossRef]
- Sathya, A.; Guardia, P.; Brescia, R.; Silvestri, N.; Pugliese, G.; Nitti, S.; Manna, L.; Pellegrino, T. CoxFe3−xO4 Nanocubes for Theranostic Applications: Effect of Cobalt Content and Particle Size. Chem. Mater. 2016, 28, 1769–1780. [Google Scholar] [CrossRef]
- Albino, M.; Fantechi, E.; Innocenti, C.; López-Ortega, A.; Bonanni, V.; Campo, G.; Pineider, F.; Gurioli, M.; Arosio, P.; Orlando, T.; et al. Role of Zn2+ Substitution on the Magnetic, Hyperthermic, and Relaxometric Properties of Cobalt Ferrite Nanoparticles. J. Phys. Chem. C 2019, 123, 6148–6157. [Google Scholar] [CrossRef]
- Iacovita, C.; Stiufiuc, R.; Radu, T.; Florea, A.; Stiufiuc, G.; Dutu, A.; Mican, S.; Tetean, R.; Lucaciu, C.M. Polyethylene glycol mediated synthesis of cubic iron oxide nanoparticles with high heating power. Nanoscale Res. Lett. 2015, 10, 1–16. [Google Scholar] [CrossRef]


Disclaimer/Publisher’s Note: The statements, opinions and data contained in all publications are solely those of the individual author(s) and contributor(s) and not of MDPI and/or the editor(s). MDPI and/or the editor(s) disclaim responsibility for any injury to people or property resulting from any ideas, methods, instructions or products referred to in the content. |
© 2022 by the authors. Licensee MDPI, Basel, Switzerland. This article is an open access article distributed under the terms and conditions of the Creative Commons Attribution (CC BY) license (https://creativecommons.org/licenses/by/4.0/).