Article

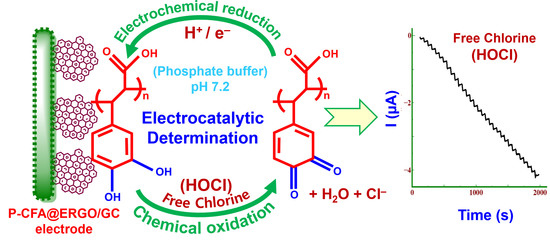
Poly(caffeic acid) Redox Couple Decorated on Electrochemically Reduced Graphene Oxide for Electrocatalytic Sensing Free Chlorine in Drinking Water

School of Chemical Engineering, Yeungnam University, Gyeongsan 38541, Gyeongbuk, Republic of Korea
*
Author to whom correspondence should be addressed.
These authors contributed equally to this work.
Nanomaterials 2023, 13(1), 151; https://doi.org/10.3390/nano13010151
Submission received: 4 October 2022 / Revised: 26 November 2022 / Accepted: 16 December 2022 / Published: 28 December 2022

Abstract

:
Regular water quality measurements are essential to the public water supply. Moreover, selective free chlorine (disinfectant) level monitoring without an interfering agent is necessary. The present work aimed to fabricate poly(caffeic acid) (p-CFA) coated on an electrochemically reduced graphene oxide (ERGO) surface for the selective detection of free chlorine. Electron microscopy and various spectroscopic techniques confirmed the p-CFA@ERGO/glassy carbon (GC) electrode. The p-CFA@ERGO/GC coated probe surface coverage was calculated to be 4.75 × 10⁻¹¹ mol cm−2. The p-CFA@ERGO/GC showed superior catechol/o-quinone oxidation/reduction peaks for electrocatalytic free chlorine determination. The performance of the developed sensor electrode was outstanding, with an extensive range of free chlorine detection (20 μM to 20 mM), high sensitivity (0.0361 µA µM−1), and low detection limit (0.03 µM). The p-CFA@ERGO/GC capability of the realist water samples, such as the tested commercial and tap water, yielded a good range of recovery (from 98.5% to 99.9%). These values align with the standard N,N′-diethyl-p-phenylenediamine reagent method results.

Graphical Abstract

1. Introduction

The quality of drinking water is a primary concern due to the many variables influencing human health. Chlorine is generally applied as a sanitizing agent in water process industries to regulate pathogenic microbes, particularly Cryptosporidium and Escherichia coli. Bleaching powder contains chlorine and is an effective oxidizing species for deodorizing and preparing different organic reagents [1]. The variable oxidation states of Cl2 compounds are used to sterilize polluted surroundings and drinking water [2]. Typically, sodium hypochlorite (NaOCl) is used for water purification in wastewater, swimming pool water, and drinking water sanitizer and purification [3]. The NaOCl and chlorine (Cl2) hydrolysis reaction mechanisms are presented below.
NaOCl → Na+ + OCl
Cl2 + H2O → HOCl + HCl
HOCl ⇌ OCl + H+
Hypochlorous acid (HOCl) dissociates to OCl (hypochlorite anion) and H+ (proton) at a pKa of 7.53. These OCl and HOCl species are called free chlorine [4]. Hypochlorous acid ionization depends mainly on the pH of the medium. In water with pH < 7.5, HOCl species exist in the majority, and HOCl/OCl is found over a pH range of 6–9. This variation is essential for water sterilization because HOCl is a stronger sanitizer than OCl [4]. HOCl/OCl is used as an oxidizing reagent for versatile organic functional group transformation and microorganism eradication in water [5,6].
According to the World Health Organization’s advice, the maximum limit of free chlorine allowed concentration in drinking water is 5 mg L−1 [7]. Beyond this concentration, various health disorders are possible, such as cancer, cardiovascular diseases, atherogenesis, neurodegenerative, and rheumatoid arthritis diseases [8]. In addition, it is a potential cause of anemia and central nervous system problems [9]. Hence, it is necessary to systematically monitor the free chlorine concentration in the water supply chain to the consumer or public municipal water source. Currently, various methods are used for free chlorine detections, such as potentiometry [10], chromatography [11], spectrophotometry [12], colorimetric methods [13], and chemiluminescence [14], respectively. In contrast, the electroanalytical approach has attracted increasing attention as a simple procedure that does not require a skilled person. In addition, it provides a rapid response, good sensitivity, and excellent selectivity. Recent reports of the boron-doped diamond electrode [15], graphite electrode [16], Au microelectrode [17], polymelamine on screen-printed carbon substrate [18], polydopamine-graphene oxide modified electrode [19], poly-Mn porphyrin-nano gold film-electrode [20], Prussian blue film-surfactant-assisted electrode [21], and Si chips covered with Au thin film-coated electrode [22] have been applied for the electrochemical detection of HOCl/OCl in water samples. These modified electrodes have limitations, such as OCl and oxygen reduction potential overlapped upon the electrochemical process, expensive electrode materials, high operating potential, and narrow concentration range detection.
Caffeic acid (CFA, Scheme 1), or 3,4-dihydroxycinnamic acid, is a familiar and naturally occurring phenolic derivative compound. CFA is a solid yellow substance containing acrylic and phenolic functional moiety. CFA is a useful synthon for biosynthesis, such as lignin, a major constituent of plants and biomass of its residues [23]. CFA contains the reduced and oxidized forms of the o-hydroquinone/o-quinone redox couple used effectively as electrode materials for electrocatalytic applications [24]. The poly-caffeic acid (p-CFA)-coated GC electrode offered an excellent stable redox peak current (Scheme 2). The redox couple revealed the two-electron two-proton p-CFA reaction process [24]. Recently, CFA-coated electrodes have been used for the determination of various analytes such as acetaminophen [25], ascorbic acid [26], glutathione [27], uric acid [28], dopamine [29], epinephrine [30], and nicotinamide adenine dinucleotide [24]. The benefit of p-CFA as an electrode material is its o-quinone redox probe that facilitates the electron transfer reaction between the target analyte and electrode. The p-CFA-coated electrode revealed the commensurate electrocatalytic current and peak potential; however, it limits its electron transfer rate and the sensitivity of the analyte [25]. The peak current of electrochemically reduced graphene oxide is incorporated into the GC surface before polymer deposition on a bare substrate to better understand the p-CFA electrode reaction.
Graphene has attracted considerable attention over the last decades because of its physicochemical properties, such as electronic conductivity, surface area, thermal/chemical stability, mechanical strength, and room temperature electron mobility [31,32]. The aforementioned properties of graphene are promising for versatile applications, such as batteries [33], refractive index sensors [34], sensors [35,36,37,38,39], solar cells [40], supercapacitors [41,42], and fuel cells [43]. The graphene oxide (GO) electrochemical reduction method is a fascinating approach because of the fast and environmentally friendly way to reduce GO synthesis, which is beneficial for electrochemical sensor applications [35,36,37]. Combining the polymer–graphene composites offers an excellent polymer redox couple with carbon material with good electronic conductivity suitable for a target biomolecule selective sensor using an electrochemical method [19,44]. Electrochemically reduced graphene oxide (ERGO) provides an excellent microenvironment for the electrochemical polymerization of monomers. In addition, polymer growth on the ERGO surface prevents agglomeration [19,44]. The present work aimed to assemble p-CFA/ERGO-coated GC electrode preparation. The obtained p-CFA@ERGO/GC composite electrode was applied to the innovative electrocatalytic determination of free chlorine in drinking and tap water samples with an extensive concentration range.

2. Materials and Methods

2.1. Materials

Sodium hypochlorite, graphite, mono, and di-sodium hydrogen phosphate (NaH2PO4 and Na2HPO4) were received from Alfa Aesar, Haverhill, MA, USA. The phosphate buffer was 0.2 M (PB, pH 7.2) and was prepared by mixing NaH2PO4 and Na2HPO4. All aqueous solutions were prepared using deionized (DI) water. The HOCl/OCl stock solution was prepared using 14% (v/v) commercial hypochlorite. Before beginning the experiments, a new, free chlorine stock solution was prepared every day. The concentrations were confirmed spectrophotometrically with a wavelength (λmax) of 289 nm. Caffeic acid was acquired from Aldrich. The GC (1 mm thick) plates were received from Alfa Aesar to ensure p-CFA and ERGO synthesis using Raman spectroscopy, field emission scanning electron microscopy (FESEM), and X-ray photoelectron spectroscopy (XPS).

2.2. Characterization

The p-CFA and ERGO surface morphology were characterized by field emission scanning electron microscopy (FESEM) (Hitachi S4800, Tokyo, Japan). Raman spectroscopy (Horiba France SAS XploRA PLUS, Lille, France) was performed with excitation at 532 nm. The surface functional moiety was verified by X-ray photoelectron spectroscopy (XPS) (Thermo Scientific K-Alpha, Boston, MA, USA). Electrochemical analyses were conducted on a galvanostat/potentiostat (Metrohm Autolab PGSTAT302N, Utrecht, The Netherlands). A conventional cell setup (three-electrode) was used for all the electrochemical experiments. The GC, saturated calomel (SCE) electrode, and platinum wire were used for the working, reference, and counter electrodes. The electrochemical experiments were conducted in an N2 atmosphere at room temperature (RT).

2.3. Fabrication of p-CFA@ERGO/GC

GO was synthesized using the Hummers’ approach [35,45]. Scheme 1 represents a schematic drawing of the p-CFA polymerization on the ERGO-coated GC electrode. First, the GC surface was polished with an emery sheet and alumina slurries in sizes of 1.0, 0.3, and 0.05 μm in range and washed. A 1 mg GO per mL sample of the ethanol solution dispersed using 5 μL (5%) Nafion® as a binder was mixed and sonicated for 20 min to produce the suspension [46]. Subsequently, the GO suspension was spread over the GC surface and allowed to dry at RT. The gained GO/GC was reduced electrochemically within the voltage range of 0.0 to −1.5 V with a sweep rate of 50 mV s−1. The obtained electrode is indicated as the ERGO/GC. The CFA electropolymerization was carried out on the ERGO/GC surface, with the sweeps ranging from +0.10 to +0.90 V at a sweep rate of 20 mV s−1 in 2 mM monomer concentration in pH 4.0 (0.2 M PBS) solution [27]. The ERGO and p-CFA coatings were confirmed; similar procedures were conducted on the GC plate surface for the Raman, XPS, and FESEM studies of different modified electrodes, such as GO/GC, ERGO/GC, and p-CFA@ERGO/GC.

3. Results and Discussion

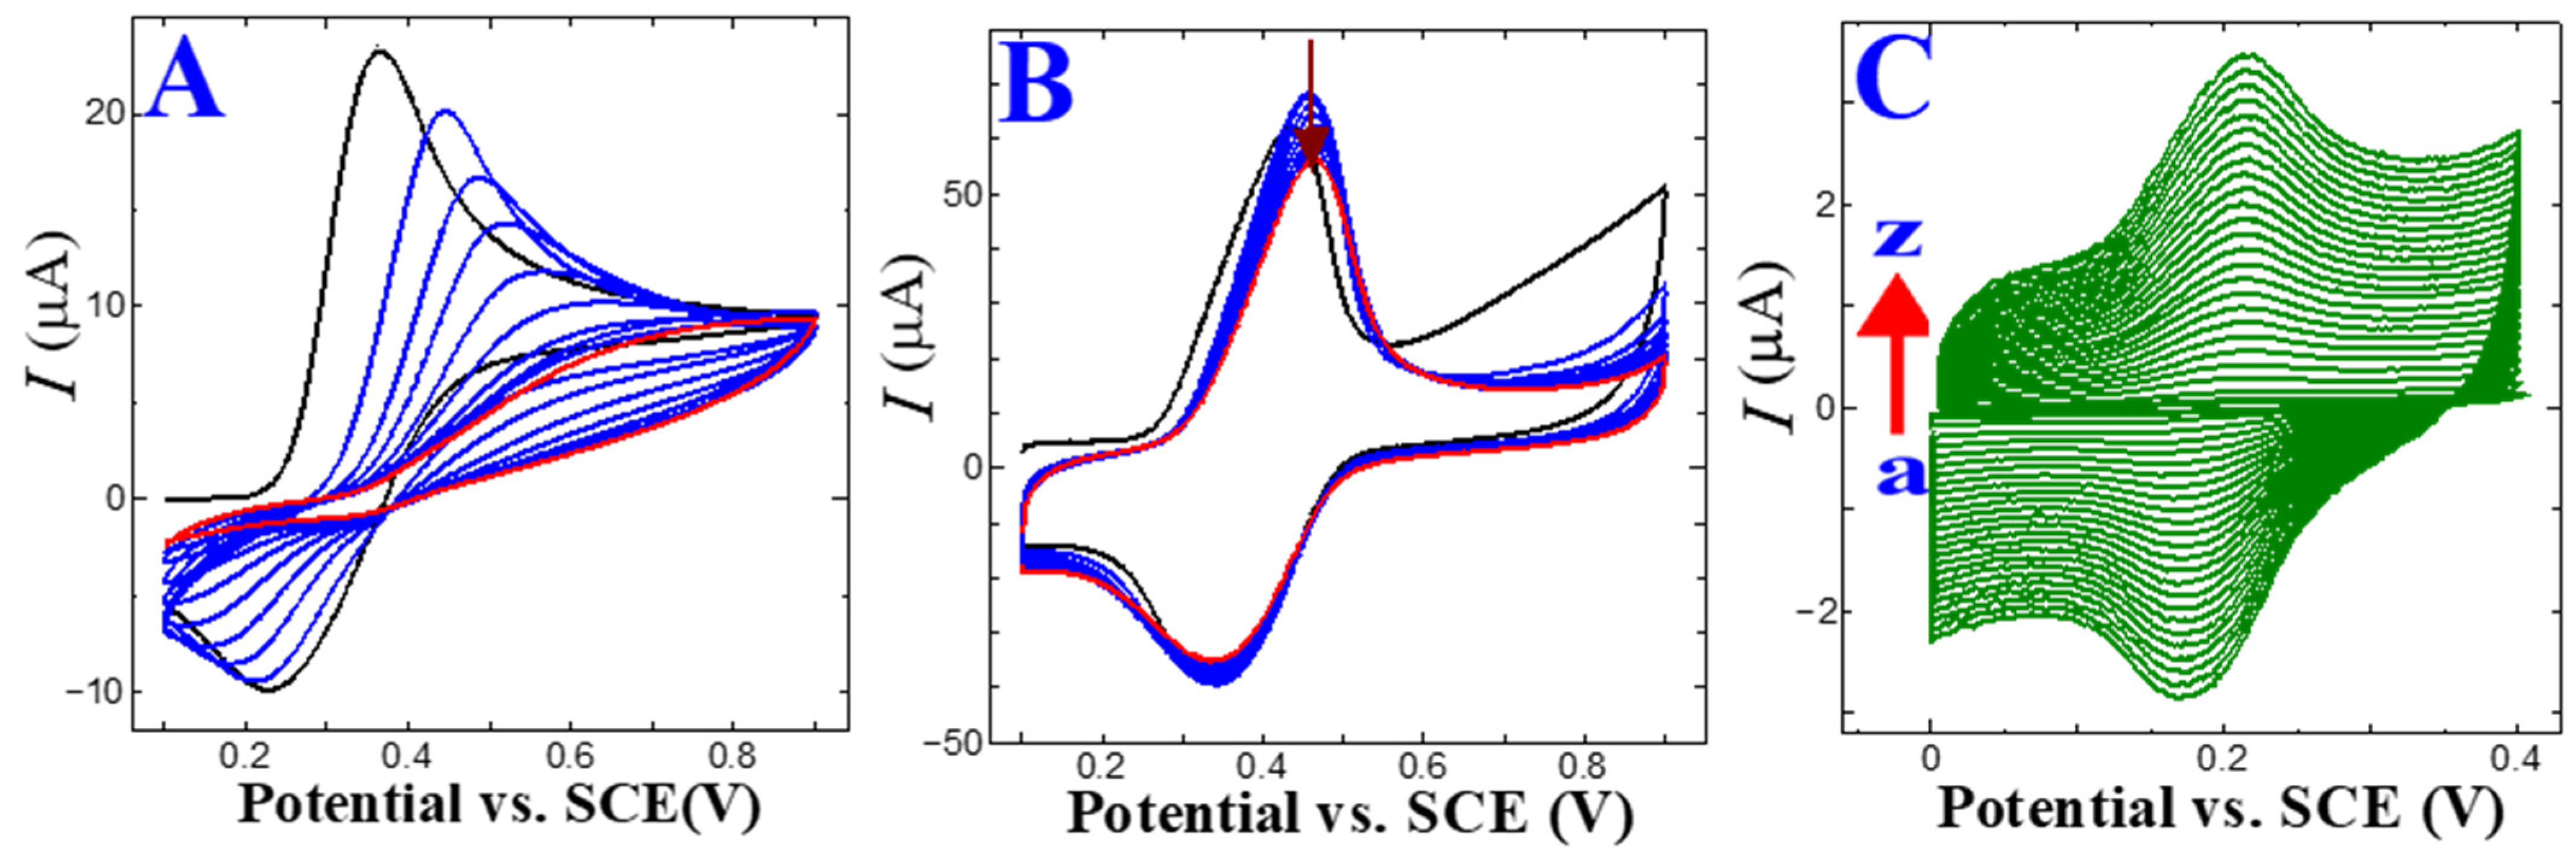
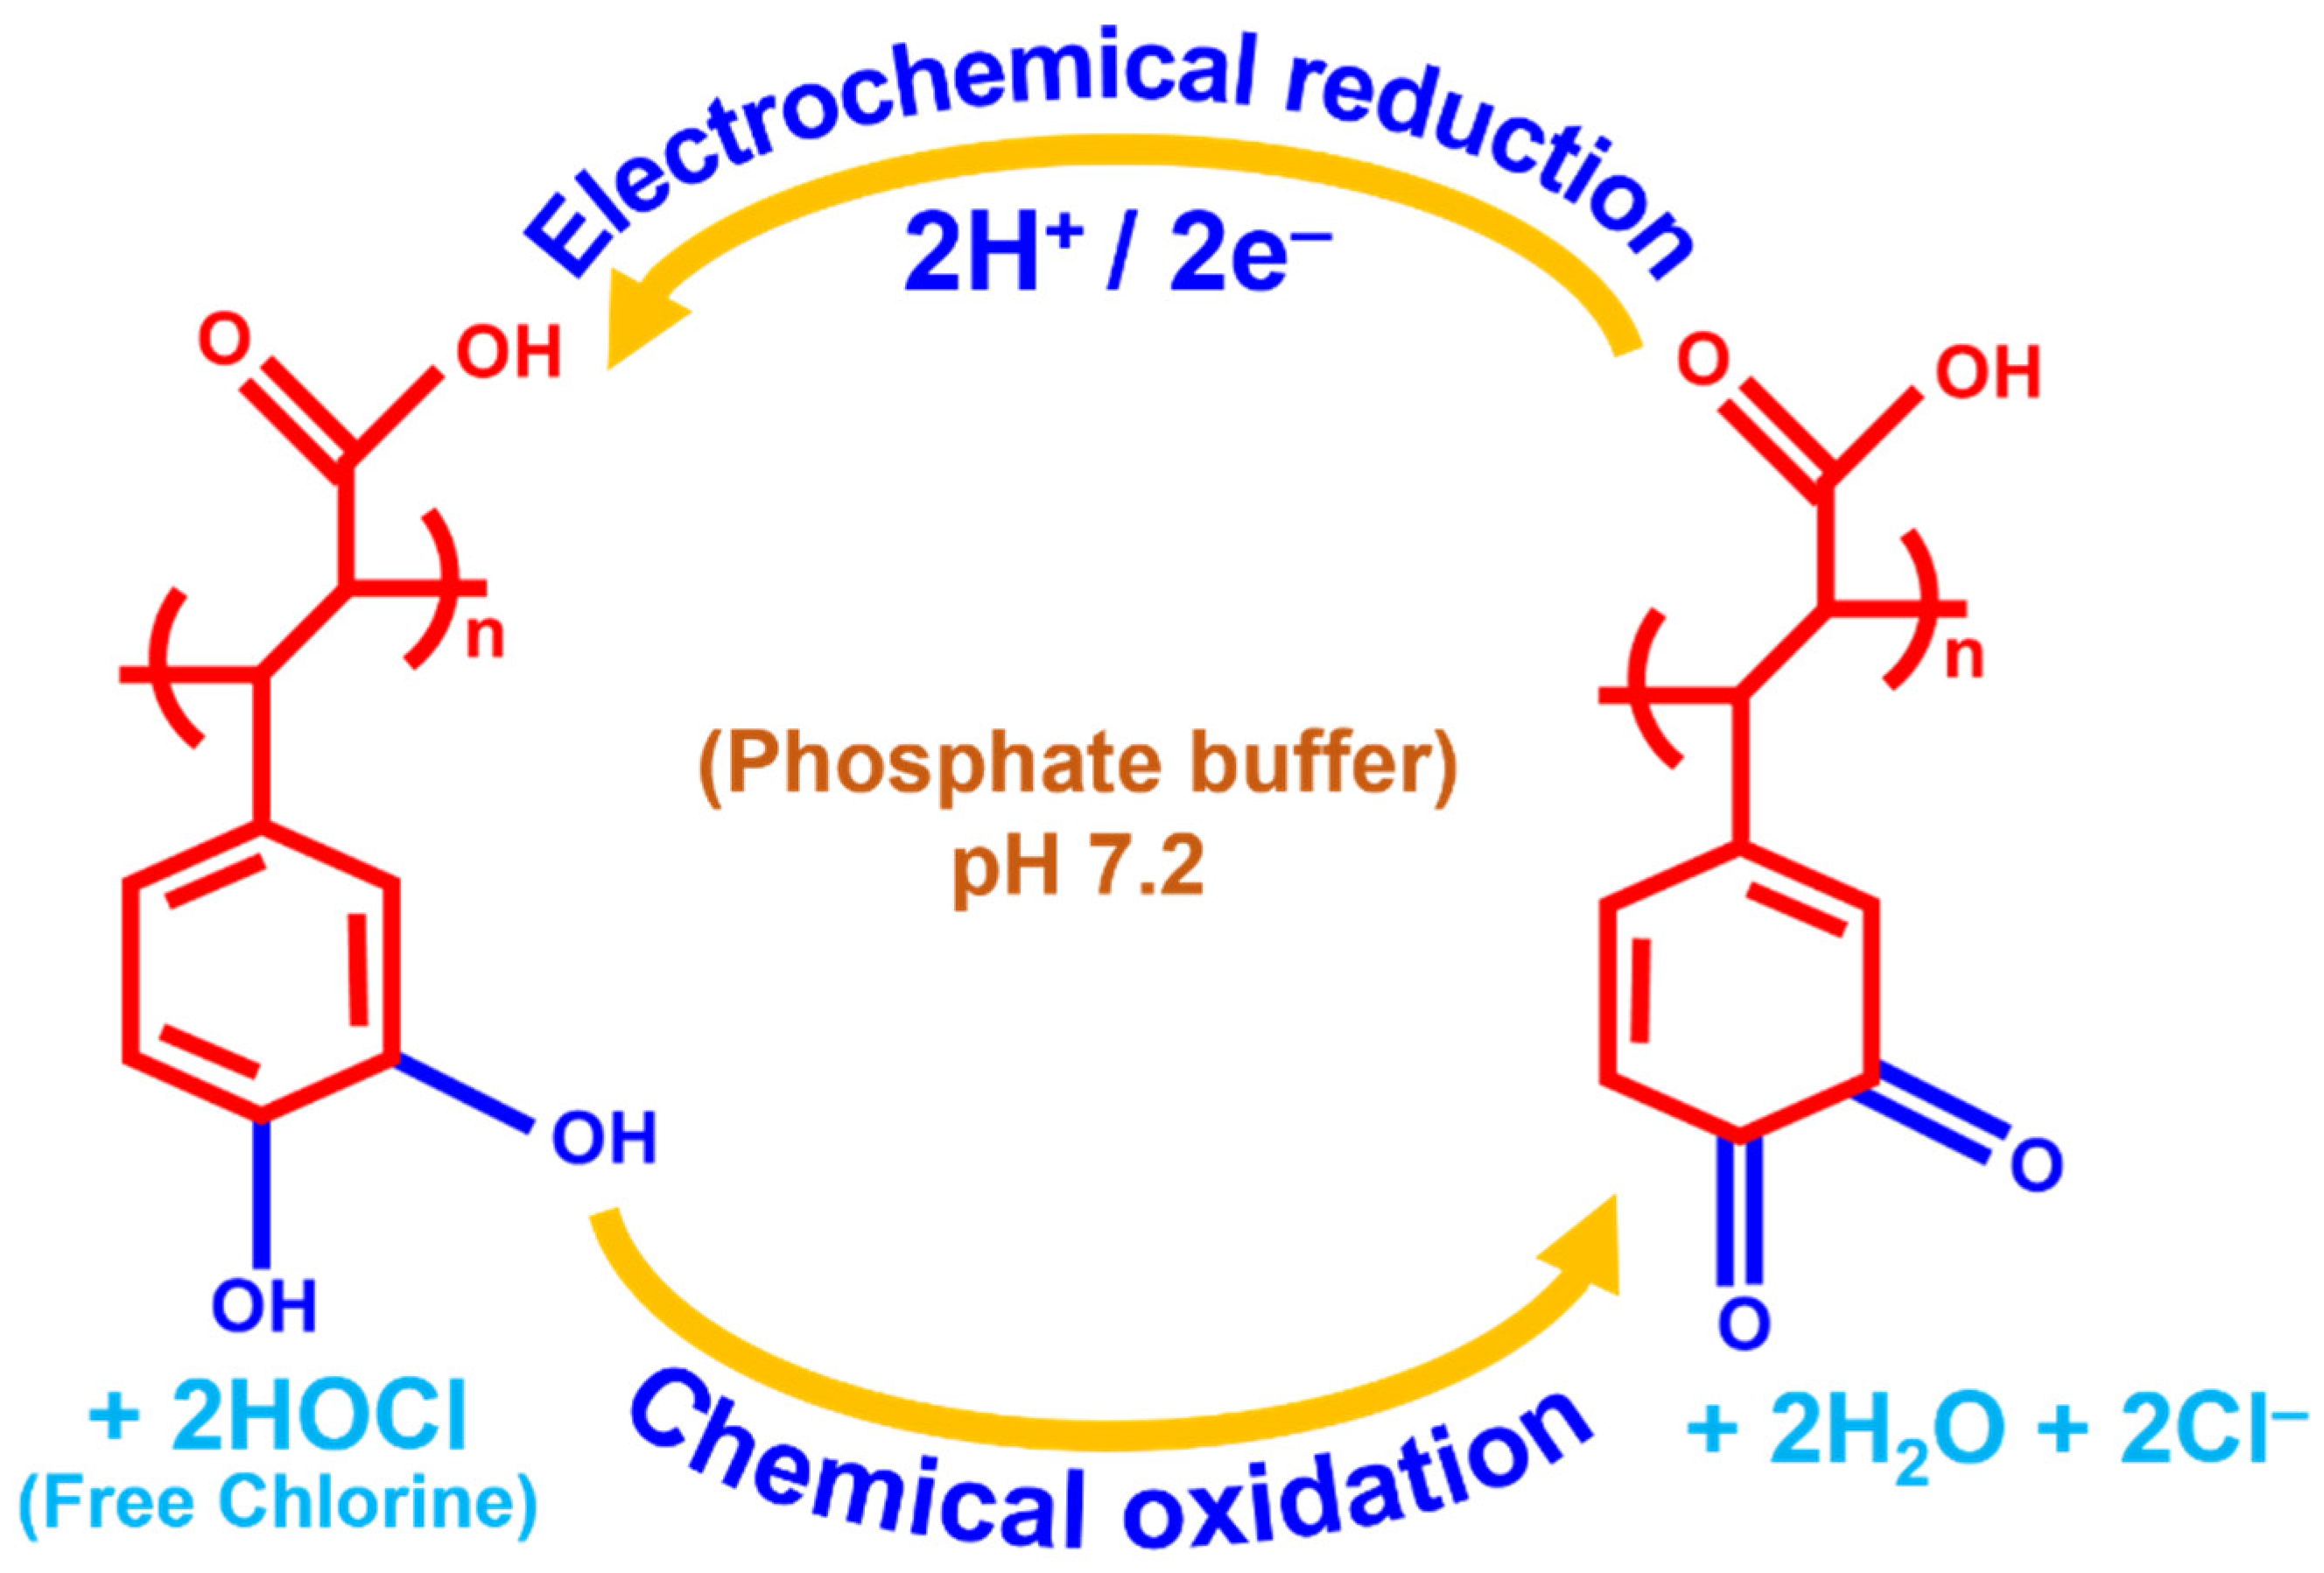
3.1. GO Electrochemical Reduction and p-CFA Formation Mechanism on the ERGO Surface

The GO/GC electrode underwent cyclic voltammetry (CV) cycles of 15 repeats to eradicate the functional oxygen moieties on the GO. The first CV trace peaked at −1.3 V, indicating a reduction in the oxygen functional groups contained in the GO [35,36]. In the second CV curve, a trace of the decreasing peak current revealed the removal of oxygen functional groups. The third scan diminished the CV trace, indicating that the GO was almost reduced to ERGO. Here, the aromatic skeleton of graphene was restored on the GC because of the removal of oxygen functional groups by the electro-reduction of the GO.
Furthermore, a potentiodynamic CFA electropolymerization was performed in pH 4 (PBS 0.2 M) supporting electrolyte medium on the bare GC and ERGO/GC electrode. The bare GC surface CFA electropolymerization CV trace revealed a lower current response than the ERGO/GC, and peak potential shifted towards the positive direction. The p-CFA/GC showed an unstable anodic and cathodic peak potential (Figure 1A). The p-CFA electropolymerization on ERGO/GC shows a high peak current and well-defined redox couple (Figure 1B) [27]. These results were attributed to the GO electro-reduction process. Some unreduced hydroxyl groups might have interacted with the carboxylic/carbonyl groups of CFA. In addition, the p-CFA@ERGO composite displayed a higher peak current than the p-CFA/GC coated electrode, indicating the excellent conductivity of the ERGO substrates (Figure 1B).

3.2. p-CFA@ERGO/GC Electrochemical Study

Figure 1C shows the CV traces acquired in the p-CFA@ERGO/GC-coated electrode at pH 7.2 (PB 0.2 M). The corresponding p-CFA redox peaks yielded an anodic peak (Epa) at +0.2 V and a cathodic peak (Epc) of +0.14 V, respectively. The τ peak was attributed to the p-CFA catechol group oxidization as an o-quinone form, which reduced the Epc reduction process to the initial status (catechol group) [27]. The p-CFA coated ERGO/GC surface coverage (τ) was calculated to estimate the effective charge (Q) present in polymer film development according to the below Equation (4):
τ = Q n F A
where Q, n, A, and F are the charges of the CV trace area (integrated), the number of electrons contributing to the p-CFA redox reaction, the GC area (geometric, 0.0707 cm2), and Faraday constant 96,485 C mol−1, respectively. The estimated τ for the p-CFA@ERGO/GC-coated electrode was 4.75 × 10⁻¹¹ mol cm−2. The calculated τ for the p-CFA/ERGO-coated electrode indicates the construction of a thin polymer layer. The p-CFA@ERGO/GC electrode kinetic process was identified using different sweep rate studies in pH 7.2 (0.2 M PBS). The sweep rate was increased from 5 to 600 mV s−1, and the oxidation/reduction peak current gradually increased, showing that the p-CFA affords an excellent redox couple (Figure 1C). The peak current versus scan rate plot of the p-CFA@ERGO/GC-coated electrode revealed a linear increase in current with an increasing sweep, which ensured that the electrode underwent a surface-confined reaction (R2 = 0.999) (Figure S1).

3.3. Electron Microscopic Study of the Modified Electrode

Figure 2a–d shows the FESEM of GO/GC, ERGO/GC, and p-CFA@ERGO/GC-plated surface coating and morphology ensured with sequential modifications. The GO-coated GC surface revealed a wavy/crumpled sheet-like structure, whereas reduced GO (ERGO) showed an intense wrinkled sheet-like morphology (Figure 2a,b) [34,35,36,45]. This behavior was attributed to the surface tension, edge instability, and two-dimensional sheet strain upon GO preparation and conversion to ERGO. In addition, the p-CFA@ERGO/GC-coated plate exhibited the cluster-like surface microstructure of polymer grown on the ERGO (Figure 2c,d). The basal and edge plane defects favor CFA monomer interaction and polymer deposition on the carbon surface because ERGO contains some unreduced oxygen groups [19]. Figure 2d shows FESEM images of p-CFA@ERGO with high magnification, confirming that p-CFA had an even distribution of polymer particles over the ERGO surface.

3.4. X-ray Photoelectron and Raman Spectra Studies

XPS is generally used to find the oxidation state of elements and characterize surface changes. The electro-reduction of GO was ensured using an XPS study, and Figure 3A (a and b) shows their GO and ERGO survey spectra on GC plates. Figure 3A (a–d) presents the survey spectra of different coatings on the GC plate electrodes: GO, ERGO, p-CFA@ERGO, and p-CFA. In the survey, the trace showed the two peaks of C 1 s (sp2 carbon) and O 1 s (–O–, –OH, COOH functional groups) at 285 and 531 eV, respectively [34,45]. The carbon/oxygen ratio is vital to validating the graphite oxidation through an exfoliation reaction. The carbon/oxygen peak intensity ratio for GO and ERGO was 1.4 and 2.11. The high C/O ratio value of the ERGO highlights the removal of the functional oxygen moiety upon the electro-reduction of GO [45]. This study confirmed the successful electro-reduction of GO. Figure 3B–E shows the deconvoluted high-resolution XPS spectra of GO, ERGO, p-CFA@ERGO, and the p-CFA-coated GC plate. The C 1 s region, deconvoluted into five envelopes at 284.6, 285.8, 286.0, 288.5, and 291.6 eV, was assigned to C–C, C–O–C/C–OH, C=O, COOH, and COO–, respectively. The ERGO’s C(OH) and other oxygen groups showed low areas under the GO envelopes, which confirmed the successful electro-reduction of the as-prepared GO (Figure 3B,C). On the other hand, the C–OH area under the envelope of the p-CFA@ERGO composite electrode revealed a 20% higher value. Hence, the p-CFA contains catechol (–OH, COOH) groups and an effective polymer film on the ERGO. The p-CFA coating on the bare GC electrode surface was tested with a controlled experiment. The results are displayed in Figure 3E. p-CFA/GC shows that the region envelopes’ binding energies at 284.6, 285.0, 286.3, 288.6, and 291.4 eV correspond to the –C–C–, C–O–C/C–OH, C=O, –COOH, and –COO–. These binding energies resemble the positions with the p-CFA@ERGO region, which ensures the p-CFA ability to form on carbon and ERGO substrates. Table S1 lists the detailed functional groups of each sample, binding energy, and area of the deconvoluted envelopes.
The electro-reduction of GO to ERGO was confirmed by Raman spectra, widely used to evaluate carbon materials’ order and disorder levels. Figure 3F (a–c) displayed the Raman spectra of the GO/GC, ERGO/GC, and p-CFA@ERGO/GC plate-coated materials. Carbon-based materials generally reveal two significant D and G peaks. The D and G peaks were attributed to the A1g symmetry breathing mode k-point (phonons) and E2g (phonon) mode sp2 carbons, respectively. The GO-coated electrode revealed two bands at 1594 cm−1 and 1351 cm−1, ascribed to the G (graphitic) and D (defect) peaks, respectively (Figure 3F (a)). Similarly, the ERGO-coated electrode also showed the G and D bands at 1587 and 1344 cm−1, respectively (Figure 3F (b)). The D band intensity increased compared to the GO. This result also guaranteed the GO presence on the bare GC surface and electro-reduction reaction. The G band peaks shift to a low wavenumber, indicating a basal plane defect, increasing and restoring the aromatic graphene skeleton structure [35,36,47]. The polymer-coated p-CFA@ERGO/GC electrode revealed G and D bands at 1564 and 1344 cm−1. The ID/IG ratio provides information about the surface modification of carbon-based materials, such as chemical changes or disorders [47]. The measured ID/IG values were 0.81, 1.33, and 1.0, corresponding to the GO/GC, ERGO/GC, and p-CFA@ERGO/GC electrodes, respectively. The high ID/IG ratio of the ERGO indicates the aromatic skeleton structure regeneration as an sp2 graphene backbone. Moreover, the p-CFA@ERGO peak intensity ID/IG ratio decreased to 1.0, which is lower than the ERGO/GC electrode, indicating the recovery of the polymer catechol aromatic unit on ERGO [48]. Table S2 lists the GO, ERGO, and p-CFA@ERGOs’ G and D peak assignments and the ID/IG values. The average crystalline (La) size of the carbon-based materials was estimated by the ID/IG ratio value using Equation (5) [38]:
L a nm = 2.4 × 10 10   λ l 4 I D I G 1
where λ and La are the laser wavelength (nm) and the average crystalline size, respectively. The calculated values of La for the GO/GC, ERGO/GC, and p-CFA@ERGO/GC-coated electrodes were 22.8, 13.9, and 19.2 nm, respectively. The decreasing average crystallite size from GO to ERGO indicates a decrease in sp domain size due to the electro-reduction in GO. After the p-CFA coating on ERGO, the La value increased owing to the p-CFA aromatic moiety.

3.5. Electrochemical Impedance Spectroscopy (EIS)

Electrochemical impedance spectroscopy (EIS) is a sensitive technique for examining the changes in the electrode probe. Figure 4 shows the EIS results for different electrodes in the 5 mM ferro-/ferricyanide ([Fe(CN)6]4−/3−)-containing 0.1 M potassium chloride-supporting electrolyte within a range frequency of 0.01 to 100 kHz. The x-axis intercept point of the Nyquist plots at the high-frequency section relates to the electron transfer-controlled process. In the medium frequency semicircle, the diameter of the circle portion was attributed to the charge-transfer (Rct) resistance, representing the surface-changed electrode electron transfer rate. The linear portion at low frequency was attributed to the diffusion-controlled rate determination [25,49]. The estimated Rct values were 148, 800, 164, and 350 Ω, representing the bare GC, p-CFA/GC, ERGO/GC, and p-CFA@ERGO/GC-coated electrodes (Figure 4). The charge transfer values of p-CFA/GC and p-CFA@ERGO/GC were higher than the bare GC electrode. This result was attributed to the p-CFA negative charge hydroxyl and carboxylic group with ferro/ferri redox probe repulsion. Similarly, ERGO/GC showed a higher Rct than the bare GC, representing the repulsive nature of the unreduced −OH group with the ferro/ferri-probe. The ERGO/GC shows a lower Rct than the p-CFA and p-CFA@ERGO electrodes, highlighting the ERGO’s conductive nature. In contrast, p-CFA@ERGO/GC showed a comparably high Rct, confirming an increase in the repulsive nature after the p-CFA modification. This is because the hydroxyl groups of p-CFAs and unreduced hydroxyl groups of the ERGO are combined with the repulsive impact with the ferro/ferri-probe. Therefore, the electrocatalytic method using the p-CFA@ERGO/GC probe may be suitable for free chlorine determination.

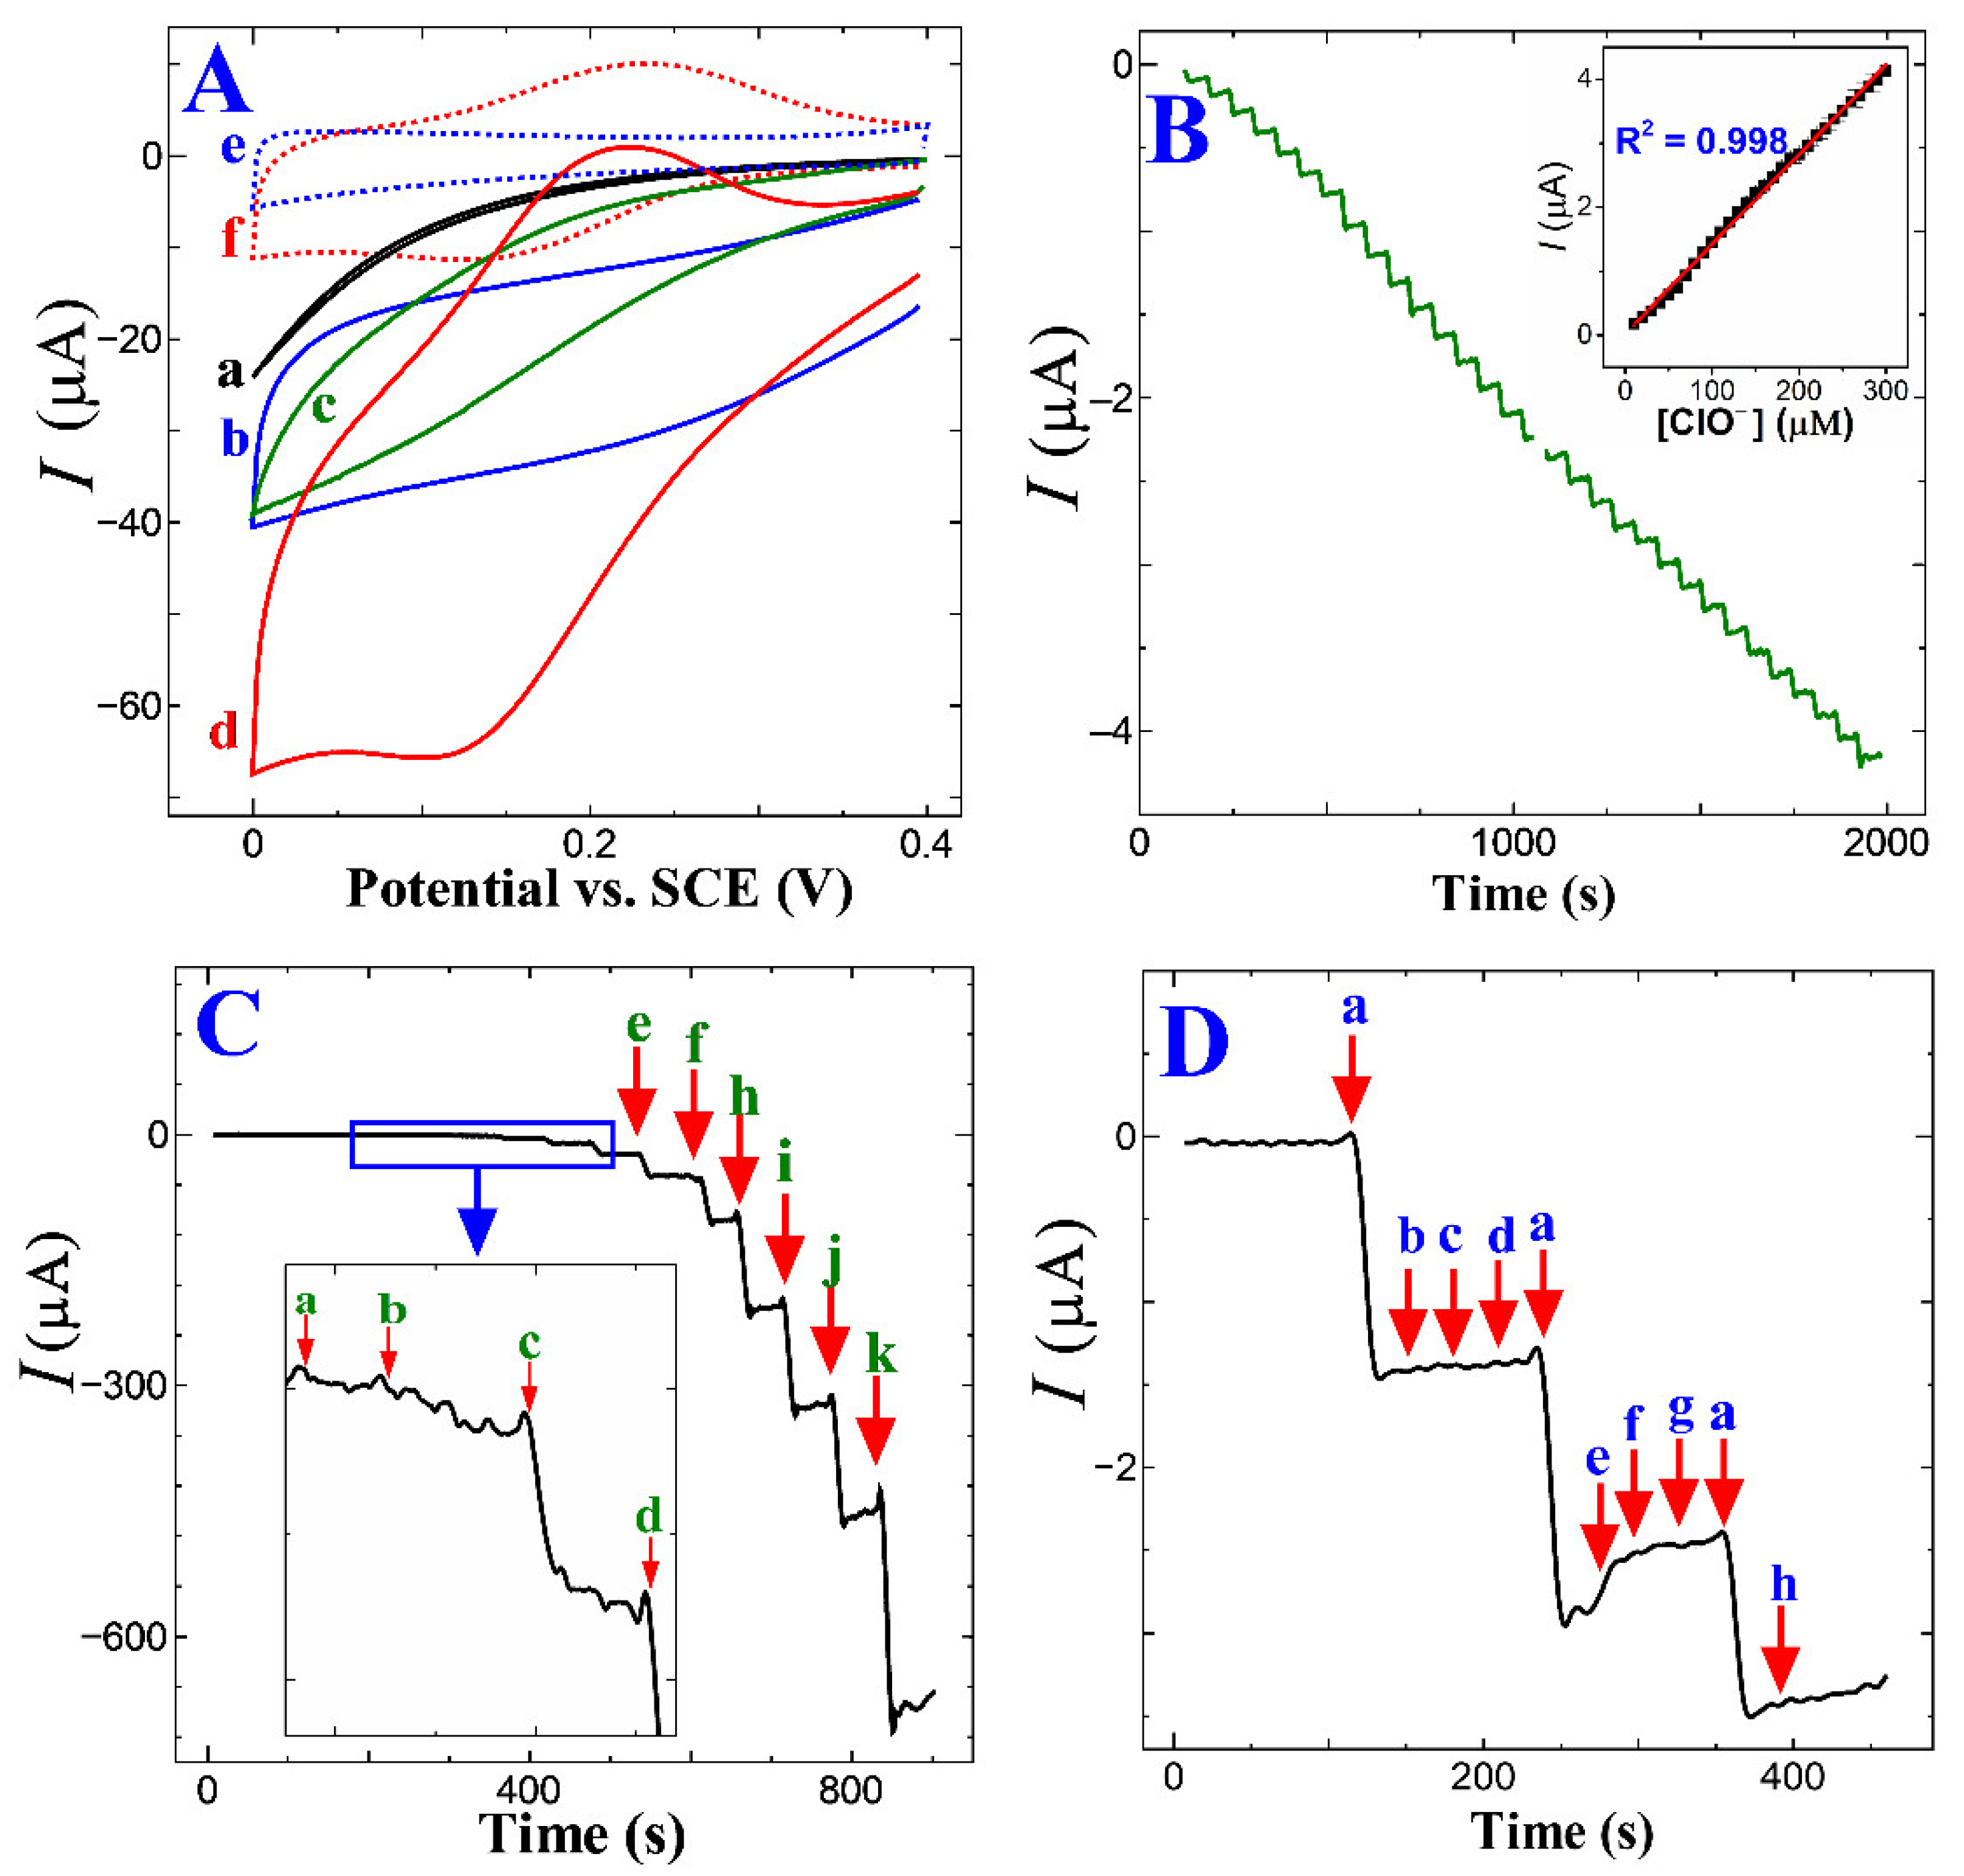
3.6. Electrocatalytic Free Chlorine Determination

Figure 5A shows the CV trace response of the GC, ERGO/GC, p-CFA/GC, and p-CFA@ERGO/GC-coated electrode in a pH 7.2 (PBS 0.2 M) medium absence and the presence of free chlorine. The bare GC and ERGO showed no significant free chlorine (5 mM) reduction peaks; however, only an increase in the background current was observed (Figure 5A (a and b)). The p-CFA/GC and p-CFA@ERGO/GC probes revealed an increasing free chlorine reduction current, indicating that an electrocatalytic reduction occurred. The p-CFA@ERGO/GC electrode-free chlorine reduction peak current response was 12.4-, 2.0-, and 2.7 times higher than that of the bare GC, ERGO/GC, and p-CFA/GC, respectively. Compared to the CV trace of p-CFA/GCs, p-CFA@ERGO/GC observed well-defined anodic and cathodic peaks at potentials of +0.21 and +0.17 V, respectively. Because p-CFA catechol oxidized the two-electron and two-proton product of o-quinone with this process, the quinoid structure offered a delocalized electron that effectively transferred with the ERGO conductive substrate, unlike the bare GC-coated p-CFA electrode. The p-CFA@ERGO/GC electrocatalytic sensor is explained as follows: first, catechol moiety hydroxyl groups are chemically oxidized by free chlorine, producing the o-quinone, water, and chloride ions.
In the next step, o-quinone is reduced electrochemically using a 2e/2H+ addition that repeatedly regenerates the catechol hydroxyl moiety. Scheme 2 represents a better understanding of the electrocatalytic mechanism. As produced, the o-quinone electrochemical reduction reaction current response was monitored. The developed sensor mechanism supported earlier literature reports of hypochlorous acid/OCl reduced by catechol and chemically converted to o-quinone [50]. Kumar et al. electrochemically synthesized a polydopamine/graphene electrode using a similar dopamine hydroxyl group for o-quinone product conversion, which also supports the present electrode mechanism [19]. The p-CFA/ERGO composite electrode provided a high current that reduced graphene oxide, making it a facile microenvironment for the redox polymer with target-free chlorine (Figure 5A (d and f)).

3.7. Chronoamperometric Detection of Free Chlorine

Figure 5B shows the optimized experimental conditions p-CFA@ERGO/GC caused to chronoamperometry (i-t) curve performance in a pH 7.2 (0.2 M PBS) medium with a free chlorine operating reduction potential of +0.17 V. The free chlorine reduction peak current increased steadily on each successful 10 µM injection. Free chlorine additions at every one-minute interval increased the current, which was stabilized within three seconds. The linear increment of the free chlorine concentration from 10.0 µM to 300.0 µM increased the current versus concentration plot (Figure 5B inset) and found a correlation coefficient of 0.998. The proposed p-CFA@ERGO/GC electrode widespread free chlorine concentration detection ability was tested from the 20 µM to 20 mM range and obtained an excellent linearity coefficient of 0.9895 (Figure 5C and Figure S2). The slope showed a superior sensitivity of 0.0361 µA µM−1. The lowest detection limit (LOD) was estimated using the following equation: LOD = 3σ/m, because σ is the standard deviation of the current response at a blank PBS solution, and m refers to the slope of the calibration trace. The calculated LOD of free chlorine for p-CFA@ERGO/GC was 0.03 µM. As developed, sensor electrode performance, such as the pH of the supporting electrolyte, operating potential, linear range, sensitivity, and LOD, were compared in the previous reports (Table 1). In earlier studies, the innovative p-CFA@ERGO composite electrode revealed a comprehensive concentration-free chlorine sensing capability and low LOD [15,16,17,18,19,20]. The compatible interfacial interaction between polymer and graphene confers superior electrochemical performance. ERGO contains some unreduced oxygen functional groups that interact with the caffeic acid −OH by intermolecular interaction, which reinforces the p-CFA uptake on the electrode surface. Thus, the p-CFA@ERGO composite electrode emphasized the high surface coverage that offered wide-range free chlorine detection, comparable sensitivity, low LOD, and storage stability.

3.8. Selectivity, Storage Stability, and Reproducibility Test

The p-CFA@ERGO composite electrode selectivity/tolerance test was conducted with typical water samples containing ions such as sulfite (SO42−), carbonate (CO32−), sodium chloride (NaCl), and sulfite (SO32−), urea, ethanol, and nitrate (NO3) (Figure 5D). The i-t current tolerability of the p-CFA@ERGO electrode with 10 µM free chlorine was measured by adding each 1 mM of all interfering ions, obtaining no significant current alteration of the target analyte. This observation showed that the proposed electrode has excellent interfering ion tolerability. Here, only sulfite ions showed a slight change in current in the presence of free chlorine. Long-term storage capability was tested for p-CFA@ERGO/GC after thirty days of a five-set of chronoamperometry with the 10 µM analyte. The measured relative standard deviation (RSD) was 5.5% (n = 5). The free-chlorine detection repeatability was tested with five p-CFA@ERGO/GC electrodes, getting 4.2% RSD. The five p-CFA@ERGO/GC set electrode fabricated and examined the free chlorine detection with the same concentration obtained RSD was 4.5%, indicating the outstanding reproducibility of the proposed electrode.

3.9. Realistic Drinking and Tap Water Sensors

The real-time applicability of the as-fabricated p-CFA@ERGO/GC electrode was substantiated by measuring the free chlorine concentration in water samples. The model sample, such as tap water and commercial drinking water, was collected, and the pH of the samples was adjusted to 7.2 using a 0.2 M PBS solution. The commercial drinking and tap water samples containing free chlorine levels were tested by the standard addition method. Table 2 lists the obtained recovery values. The recovery values of free chlorine in commercial (drinking) and tap waters were 98.5 and 99.9%. The obtained recovery values were satisfactory in realistic water sample analysis. The present sensor electrode performance was validated using the well-known N,N′-diethyl-p-phenylenediamine (DPD) reagent colorimetric technique. The present sensor electrode revealed that free chlorine measurements in commercial (drinking) and tap waters were 9.9, 19.9, 9.85, and 19.95 µM. These values agree with the regular DPD colorimetric results of 10.1, 19.8, 9.9, and 20.40 µM. This study proved that the assembled p-CFA@ERGO/GC composite electrode might be suitable for real-time free chlorine detection in water samples.

4. Conclusions

The potentiodynamic method was used for poly(caffeic acid) deposition on the electro-reduced graphene oxide/glassy carbon electrode surface. FESEM, Raman, XPS, and EIS confirmed the successful fabrication of polymer/ERGO. The poly(caffeic acid)/ERGO composite electrode containing a catechol/o-quinone redox probe was applied to the electrocatalytic water disinfectant agents, such as free chlorine sensors, as the obtained p-CFA@ERGO/GC sensor electrode revealed an outstanding free chlorine detection range (20 µM to 20 mM), sensitivity (0.0361 µA µM−1), and the lowest LOD value (0.03 µM). Finally, p-CFA@ERGO/GC was applied successfully to measure the commercial and tap water samples and found good recoveries from 98.5% to 99.9%. These results are satisfactory with the DPD method, and the results agree that the proposed p-CFA@ERGO/GC might be suitable for future free chlorine sensor probes.

Supplementary Materials

The following are available online at https://www.mdpi.com/article/10.3390/nano13010151/s1. Figure S1. Plot of the anodic peak current vs. scan rate; Figure S2. Amperometric i-t calibration plot; Table S1. Measured binding energies and areas for standard chemical states of carbon C 1 s region of XPS; Table S2. ID/IG and C/O ratios obtained from the Raman and XPS spectra.

Author Contributions

Conceptualization, S.K.; methodology, S.K.; validation, S.K., D.R.K., W.K.K., Y.R.L. and J.-J.S.; formal analysis, S.K.; investigation, S.K. and D.R.K.; resources, J.-J.S.; data curation, S.K. and D.R.K.; writing—original draft preparation, S.K. and D.R.K.; writing—review and editing, J.-J.S.; visualization, S.K., D.R.K., G.D. and J.-J.S.; supervision, J.-J.S.; project administration, J.-J.S.; funding acquisition, J.-J.S. All authors have read and agreed to the published version of the manuscript.

Funding

The Priority Research Centers Program (NRF-2014R1A6A1031189) and the Regional University Superior Scientist Research Program (NRF-2020R1I1A3073981) funded by the National Research Foundation (NRF) of the Republic of Korea (Ministry of Education).

Data Availability Statement

The data presented in this study are available in the lab research notebook in Yeungnam University.

Conflicts of Interest

The authors declare no conflict of interest.

References

  1. White, G.C. Handbook of Chlorination, 2nd ed.; Van Nostrand Reinhold Co., Inc.: New York, NY, USA, 1986. [Google Scholar]
  2. Sobsey, M.D.; Handzel, T.; Venczel, L. Chlorination and safe storage of household drinking water in developing countries to reduce waterborne disease. Water Sci. Technol. 2003, 47, 221–228. [Google Scholar] [CrossRef] [PubMed] [Green Version]
  3. Sharma, A.K.; Anupam, K.; Swaroop, V.; Lal, P.S.; Bist, V. Pilot scale soda-anthraquinone pulping of palm oil empty fruit bunches and elemental chlorine free bleaching of resulting pulp. J. Clean. Prod. 2015, 106, 422–429. [Google Scholar] [CrossRef]
  4. Ordeig, O.; Mas, R.; Gonzalo, J.; Del Campo, F.J.; Muñoz, F.J.; de Haro, C. Continuous Detection of Hypochlorous Acid/Hypochlorite for Water Quality Monitoring and Control. Electroanalysis 2005, 17, 1641–1648. [Google Scholar] [CrossRef]
  5. Skarzewski, J.; Siedlecka, R. Synthetic Oxidations with Hypochlorites. A review. Org. Prep. Proced. Int. 1992, 24, 623–647. [Google Scholar] [CrossRef]
  6. Rutala, W.A.; Weber, D.J. Uses of inorganic hypochlorite (bleach) in health-care facilities. Clin. Microbiol. Rev. 1997, 10, 597–610. [Google Scholar] [CrossRef]
  7. World Health Organization. Guidelines for Drinking-Water Quality—Recommendations, 2nd ed.; WHO: Geneva, Switzerland, 1993; Volume 1. [Google Scholar]
  8. Pattison, D.I.; Davies, M.J. Evidence for Rapid Inter- and Intramolecular Chlorine Transfer Reactions of Histamine and Carnosine Chloramines:  Implications for the Prevention of Hypochlorous-Acid-Mediated Damage. Biochemistry 2006, 45, 8152–8162. [Google Scholar] [CrossRef]
  9. U.S. Environmental Protection Agency U.S. Environmental Protection Agency. Available online: https://www.epa.gov/dwreginfo/drinking-water-regulations (accessed on 20 September 2022).
  10. Soldatkin, A.P.; Gorchkov, D.V.; Martelet, C.; Jaffrezic-Renault, N. New enzyme potentiometric sensor for hypochlorite species detection. Sens. Actuators B Chem. 1997, 43, 99–104. [Google Scholar] [CrossRef]
  11. Wakigawa, K.; Gohda, A.; Fukushima, S.; Mori, T.; Niidome, T.; Katayama, Y. Rapid and selective determination of free chlorine in aqueous solution using electrophilic addition to styrene by gas chromatography/mass spectrometry. Talanta 2013, 103, 81–85. [Google Scholar] [CrossRef]
  12. Leggett, D.J.; Chen, N.H.; Mahadevappa, D.S. Rapid determination of residual chlorine by flow injection analysis. Analyst 1982, 107, 433–441. [Google Scholar] [CrossRef]
  13. Eaton, A.D.; Clesceri, L.S.; Greenberg, A.E.; Franson, M.A.H. Standard Methods for the Examination of Water and Wastewater, 20th ed.; American Public Health Association: Washington, DC, USA, 1998. [Google Scholar]
  14. Szili, M.; Kasik, I.; Matejec, V.; Nagy, G.; Kovacs, B. Poly(luminol) based sensor array for determination of dissolved chlorine in water. Sens. Actuators B Chem. 2014, 192, 92–98. [Google Scholar] [CrossRef]
  15. Murata, M.; Ivandini, T.A.; Shibata, M.; Nomura, S.; Fujishima, A.; Einaga, Y. Electrochemical detection of free chlorine at highly boron-doped diamond electrodes. J. Electroanal. Chem. 2008, 612, 29–36. [Google Scholar] [CrossRef]
  16. Kolnel, A.S.; Pathiratne, S.S.S.; Jayasena, E.M.C.M. Linear sweep voltammetric determination of free chlorine in waters using graphite working electrodes. J. Natl. Sci. Found. 2008, 36, 7. [Google Scholar] [CrossRef]
  17. Olivé-Monllau, R.; Orozco, J.; Fernández-Sánchez, C.; Baeza, M.; Bartrolí, J.; Jimenez-Jorquera, C.; Céspedes, F. Flow injection analysis system based on amperometric thin-film transducers for free chlorine detection in swimming pool waters. Talanta 2009, 77, 1739–1744. [Google Scholar] [CrossRef] [PubMed]
  18. Senthilkumar, K.; Zen, J.-M. Free chlorine detection based on EC’ mechanism at an electroactive polymelamine-modified electrode. Electrochem. Commun. 2014, 46, 87–90. [Google Scholar] [CrossRef]
  19. Kumar, D.R.; Kesavan, S.; Nguyen, T.T.; Hwang, J.; Lamiel, C.; Shim, J.-J. Polydopamine@electrochemically reduced graphene oxide-modified electrode for electrochemical detection of free-chlorine. Sens. Actuators B Chem. 2017, 240, 818–828. [Google Scholar] [CrossRef]
  20. Thiagarajan, S.; Wu, Z.-Y.; Chen, S.-M. Amperometric determination of sodium hypochlorite at poly MnTAPP-nano Au film modified electrode. J. Electroanal. Chem. 2011, 661, 322–328. [Google Scholar] [CrossRef]
  21. Salazar, P.; Martín, M.; García-García, F.J.; González-Mora, J.L.; González-Elipe, A.R. A novel and improved surfactant-modified Prussian Blue electrode for amperometric detection of free chlorine in water. Sens. Actuators B Chem. 2015, 213, 116–123. [Google Scholar] [CrossRef]
  22. Campo, F.J.D.; Ordeig, O.; Muñoz, F.J. Improved free chlorine amperometric sensor chip for drinking water applications. Anal. Chim. Acta 2005, 554, 98–104. [Google Scholar] [CrossRef]
  23. Boerjan, W.; Ralph, J.; Baucher, M. Lignin Biosynthesis. Annu. Rev. Plant Biol. 2003, 54, 519–546. [Google Scholar] [CrossRef]
  24. Zare, H.R.; Golabi, S.M. Caffeic acid modified glassy carbon electrode for electrocatalytic oxidation of reduced nicotinamide adenine dinucleotide (NADH). J. Solid State Electrochem. 2000, 4, 87–94. [Google Scholar] [CrossRef]
  25. Li, T.; Xu, J.; Zhao, L.; Shen, S.; Yuan, M.; Liu, W.; Tu, Q.; Yu, R.; Wang, J. Au nanoparticles/poly(caffeic acid) composite modified glassy carbon electrode for voltammetric determination of acetaminophen. Talanta 2016, 159, 356–364. [Google Scholar] [CrossRef] [PubMed]
  26. Li, N.B.; Ren, W.; Luo, H.Q. Simultaneous voltammetric measurement of ascorbic acid and dopamine on poly(caffeic acid)-modified glassy carbon electrode. J. Solid State Electrochem. 2008, 12, 693–699. [Google Scholar] [CrossRef]
  27. Lee, P.T.; Ward, K.R.; Tschulik, K.; Chapman, G.; Compton, R.G. Electrochemical Detection of Glutathione Using a Poly(caffeic acid) Nanocarbon Composite Modified Electrode. Electroanalysis 2014, 26, 366–373. [Google Scholar] [CrossRef]
  28. Ren, W.; Luo, H.Q.; Li, N.B. Simultaneous voltammetric measurement of ascorbic acid, epinephrine and uric acid at a glassy carbon electrode modified with caffeic acid. Biosens. Bioelectron. 2006, 21, 1086–1092. [Google Scholar] [CrossRef] [PubMed]
  29. Li, N.B.; Ren, W.; Luo, H.Q. Caffeic Acid-Modified Glassy Carbon Electrode for the Simultaneous Determination of Epinephrine and Dopamine. Electroanalysis 2007, 19, 1496–1502. [Google Scholar] [CrossRef]
  30. Ren, W.; Luo, H.Q.; Li, N.B. Electrochemical Behavior of Epinephrine at a Glassy Carbon Electrode Modified by Electrodeposited Films of Caffeic Acid. Sensors 2006, 6, 80–89. [Google Scholar] [CrossRef] [Green Version]
  31. Chen, D.; Feng, H.; Li, J. Graphene Oxide: Preparation, Functionalization, and Electrochemical Applications. Chem. Rev. 2012, 112, 6027–6053. [Google Scholar] [CrossRef]
  32. El-Kady, M.F.; Shao, Y.; Kaner, R.B. Graphene for batteries, supercapacitors and beyond. Nat. Rev. Mater. 2016, 1, 16033. [Google Scholar] [CrossRef]
  33. Tang, C.; Li, B.-Q.; Zhang, Q.; Zhu, L.; Wang, H.-F.; Shi, J.-L.; Wei, F. CaO-Templated Growth of Hierarchical Porous Graphene for High-Power Lithium–Sulfur Battery Applications. Adv. Funct. Mater. 2016, 26, 577–585. [Google Scholar] [CrossRef]
  34. Shangguan, Q.; Chen, Z.; Yang, H.; Cheng, S.; Yang, W.; Yi, Z.; Wu, X.; Wang, S.; Yi, Y.; Wu, P. Design of Ultra-Narrow Band Graphene Refractive Index Sensor. Sensors 2022, 22, 6483. [Google Scholar] [CrossRef]
  35. Kesavan, S.; Abraham John, S. Stable determination of paracetamol in the presence of uric acid in human urine sample using melamine grafted graphene modified electrode. J. Electroanal. Chem. 2016, 760, 6–14. [Google Scholar] [CrossRef]
  36. Kesavan, S.; Raj, M.A.; John, S.A. Formation of electrochemically reduced graphene oxide on melamine electrografted layers and its application toward the determination of methylxanthines. Anal. Biochem. 2016, 496, 14–24. [Google Scholar] [CrossRef] [PubMed]
  37. Rafighi, P.; Tavahodi, M.; Haghighi, B. Fabrication of a third-generation glucose biosensor using graphene-polyethyleneimine-gold nanoparticles hybrid. Sens. Actuators B Chem. 2016, 232, 454–461. [Google Scholar] [CrossRef]
  38. Kesavan, S.; John, S.A. A novel approach to fabricate stable graphene layers on electrode surfaces using simultaneous electroreduction of diazonium cations and graphene oxide. RSC Adv. 2016, 6, 62876–62883. [Google Scholar] [CrossRef]
  39. Zhang, Z.; Cai, R.; Long, F.; Wang, J. Development and application of tetrabromobisphenol A imprinted electrochemical sensor based on graphene/carbon nanotubes three-dimensional nanocomposites modified carbon electrode. Talanta 2015, 134, 435–442. [Google Scholar] [CrossRef]
  40. Marchezi, P.E.; Sonai, G.G.; Hirata, M.K.; Schiavon, M.A.; Nogueira, A.F. Understanding the Role of Reduced Graphene Oxide in the Electrolyte of Dye-Sensitized Solar Cells. J. Phys. Chem. C 2016, 120, 23368–23376. [Google Scholar] [CrossRef]
  41. Kumar, D.R.; Nguyen, T.T.; Lamiel, C.; Shim, J.-J. Layered 2-D Bi2Se3 nanosheets intercalated by Ni(OH)2 and their supercapacitor performance. Mater. Lett. 2016, 165, 257–262. [Google Scholar] [CrossRef]
  42. Sahoo, S.; Shim, J.-J. Facile Synthesis of Three-Dimensional Ternary ZnCo2O4/Reduced Graphene Oxide/NiO Composite Film on Nickel Foam for Next Generation Supercapacitor Electrodes. ACS Sustain. Chem. Eng. 2017, 5, 241–251. [Google Scholar] [CrossRef]
  43. Vinothkannan, M.; Kannan, R.; Kim, A.R.; Kumar, G.G.; Nahm, K.S.; Yoo, D.J. Facile enhancement in proton conductivity of sulfonated poly (ether ether ketone) using functionalized graphene oxide—Synthesis, characterization, and application towards proton exchange membrane fuel cells. Colloid Polym. Sci. 2016, 294, 1197–1207. [Google Scholar] [CrossRef]
  44. Kesavan, S.; Kumar, D.R.; Lee, Y.R.; Shim, J.-J. Determination of tetracycline in the presence of major interference in human urine samples using polymelamine/electrochemically reduced graphene oxide modified electrode. Sens. Actuators B Chem. 2017, 241, 455–465. [Google Scholar] [CrossRef]
  45. Hummers, W.S.; Offeman, R.E. Preparation of Graphitic Oxide. J. Am. Chem. Soc. 1958, 80, 1339. [Google Scholar] [CrossRef]
  46. Liu, Y.; Gao, L.; Sun, J.; Wang, Y.; Zhang, J. Stable Nafion-functionalized graphene dispersions for transparent conducting films. Nanotechnology 2009, 20, 465605. [Google Scholar] [CrossRef] [PubMed]
  47. Raj, M.A.; John, S.A. Fabrication of Electrochemically Reduced Graphene Oxide Films on Glassy Carbon Electrode by Self-Assembly Method and Their Electrocatalytic Application. J. Phys. Chem. C 2013, 117, 4326–4335. [Google Scholar] [CrossRef]
  48. Ahmed, M.S.; Han, H.S.; Jeon, S. One-step chemical reduction of graphene oxide with oligothiophene for improved electrocatalytic oxygen reduction reactions. Carbon 2013, 61, 164–172. [Google Scholar] [CrossRef]
  49. Fletcher, S.; Black, V.J.; Kirkpatrick, I. A universal equivalent circuit for carbon-based supercapacitors. J. Solid State Electrochem. 2014, 18, 1377–1387. [Google Scholar] [CrossRef] [Green Version]
  50. Kim, J.; Kim, Y. A water-soluble sulfonate-BODIPY based fluorescent probe for selective detection of HOCl/OCl in aqueous media. Analyst 2014, 139, 2986–2989. [Google Scholar] [CrossRef]
Scheme 1. Schematic diagram of p-CFA@ERGO/GC free chlorine sensor electrode assembly.
Nanomaterials 13 00151 sch001
Scheme 2. p-CFA@ERGO/GC is a possible electrocatalytic free chlorine sensing mechanism.
Nanomaterials 13 00151 sch002
Figure 1. CV trace of electrochemical CFA (2 mM) polymerization at a scan rate of 20 mV s−1 and pH 4.0 (0.2 M PBS) on (A) bare glassy carbon and (B) ERGO/GC (black line: first cycle, blue lines: second to ninth cycles, red line: 10th cycle). (C) CV trace of a p-CFA@ERGO/GC-coated electrode at various scan rates from 5 to 600 mV s−1.
Nanomaterials 13 00151 g001
Figure 2. FESEM images of (a) GO/GC, (b) ERGO/GC, and (c,d) p-CFA@ERGO/GC low and high magnifications.
Nanomaterials 13 00151 g002
Figure 3. (A) XPS survey (a) GO/GC, (b) ERGO/GC, (c) p-CFA@ERGO/GC, and (d) p-CFA/GC, (BE) C 1s region envelopes of (B) GO/GC, (C) ERGO/GC, (D) p-CFA@ERGO/GC, and (E) p-CFA/GC, (F) Raman spectra of (a) GO/GC, (b) ERGO/GC, (c) p-CFA@ERGO/GC.
Nanomaterials 13 00151 g003
Figure 4. Electrochemical impedance spectroscopy of (a) bare GC, (b) p-CFA/GC, (c) ERGO/GC, and (d) p-CFA@ERGO/GC-modified electrodes in 0.1 M KCl containing 5 mM [Fe(CN)6]4−/3−.
Nanomaterials 13 00151 g004
Figure 5. (A) CV trace on (a) bare GC, (b) ERGO, (c) p-CFA, and (d) p-CFA@ERGO/GC in 5 mM free chlorine and absence of analytes (e) ERGO/GC and (f) p-CFA@ERGO/GC at a scan rate of 50 mV s−1 in PBS 7.2 (0.2 M); (B) Chronoamperometric i–t trace for every minute successive 10 μM free chlorine addition on the p-CFA@ERGO/GC and applied operating voltage at +0.17 V (inset: corresponding current vs. free chlorine concentration); (C) wide-range chronoamperometry free chlorine measurement from (a) 20, (b) 50, (c) 100, (d) 200, (e) 500, (f) 1000, (g) 2000, (h) 5000, (i) 7000, (j) 10000, and (k) 20000 μM, and (D) p-CFA@ERGO/GC selectivity test with 10 µM free chlorine in (a) pure water and in the presence of 1 mM of other interfering ions such as (b) SO42−, (c) CO32−, (d) Cl, (e) SO32−, (f) urea, (g) ethanol, and (h) NO3.
Nanomaterials 13 00151 g005
Table 1. p-CFA@ERGO/GC free chlorine sensing performance compared with previous reports.
ElectrodepHApplied Potential (V)Type of
Reaction
Linear Range
(μM)
Sensitivity
(μA μM−1)
Detection Limit
(μM)
Ref.
Graphite electrode10+1.03Oxidation19.4–583019.4[16]
BDD electrode a8+1.40Oxidation0.39–19400.0380.16[15]
Polymelamine/SPCE b7+0.125EC10–70000.0585.5[18]
Au microelectrode5.5+0.35Reduction3.89–97.170.0120.39[17]
Polydopamine/ERGO/GC7.2+0.15EC9.9–215.20.00710.044[19]
polyMnTAPP-Au/GC c10.4−0.15Reduction24–10,70024.0[20]
p-CFA@ERGO/GC7.2+0.17EC’20–20,0000.03610.030This work
a Boron-doped diamond electrode; b Screen printed electrode; c Poly manganese tetra (o-amino phenyl) porphyrin; EC’: Electrocatalytic reaction.
Table 2. Determination of free chlorine in drinking and tap water samples using the p-CFA@ERGO/GC-modified electrode (the values were obtained from five samples (n = 5) for each water).
SamplesFree Chlorine Concentration
before Addition (µmol L−1)
Electrochemical MethodDPD Method
Added
(µmol L−1)
Found
(µmol L−1)
Recovery (RSD)
(%)
Added
(µmol L−1)
Found
(µmol L−1)
Recovery
(RSD)
(%)
Drinking water-10109.999.0 (1.428)1010.1101 (2.562)
Drinking water-202019.999.5 (0.683)2019.899.0 (1.241)
Tap water-10.50109.8598.5 (0.117)109.999.0 (0.354)
Tap water-20.562019.9599.9 (2.177)2020.40102 (1.935)
Disclaimer/Publisher’s Note: The statements, opinions and data contained in all publications are solely those of the individual author(s) and contributor(s) and not of MDPI and/or the editor(s). MDPI and/or the editor(s) disclaim responsibility for any injury to people or property resulting from any ideas, methods, instructions or products referred to in the content.

