


The Cytotoxic Effectiveness of Thiourea-Reduced Graphene Oxide on Human Lung Cancer Cells and Fungi

 , and
, and 
Abstract
1. Introduction
2. Materials and Methods
2.1. Synthesis of GO
2.2. Synthesis of T-rGO
2.3. Characterization
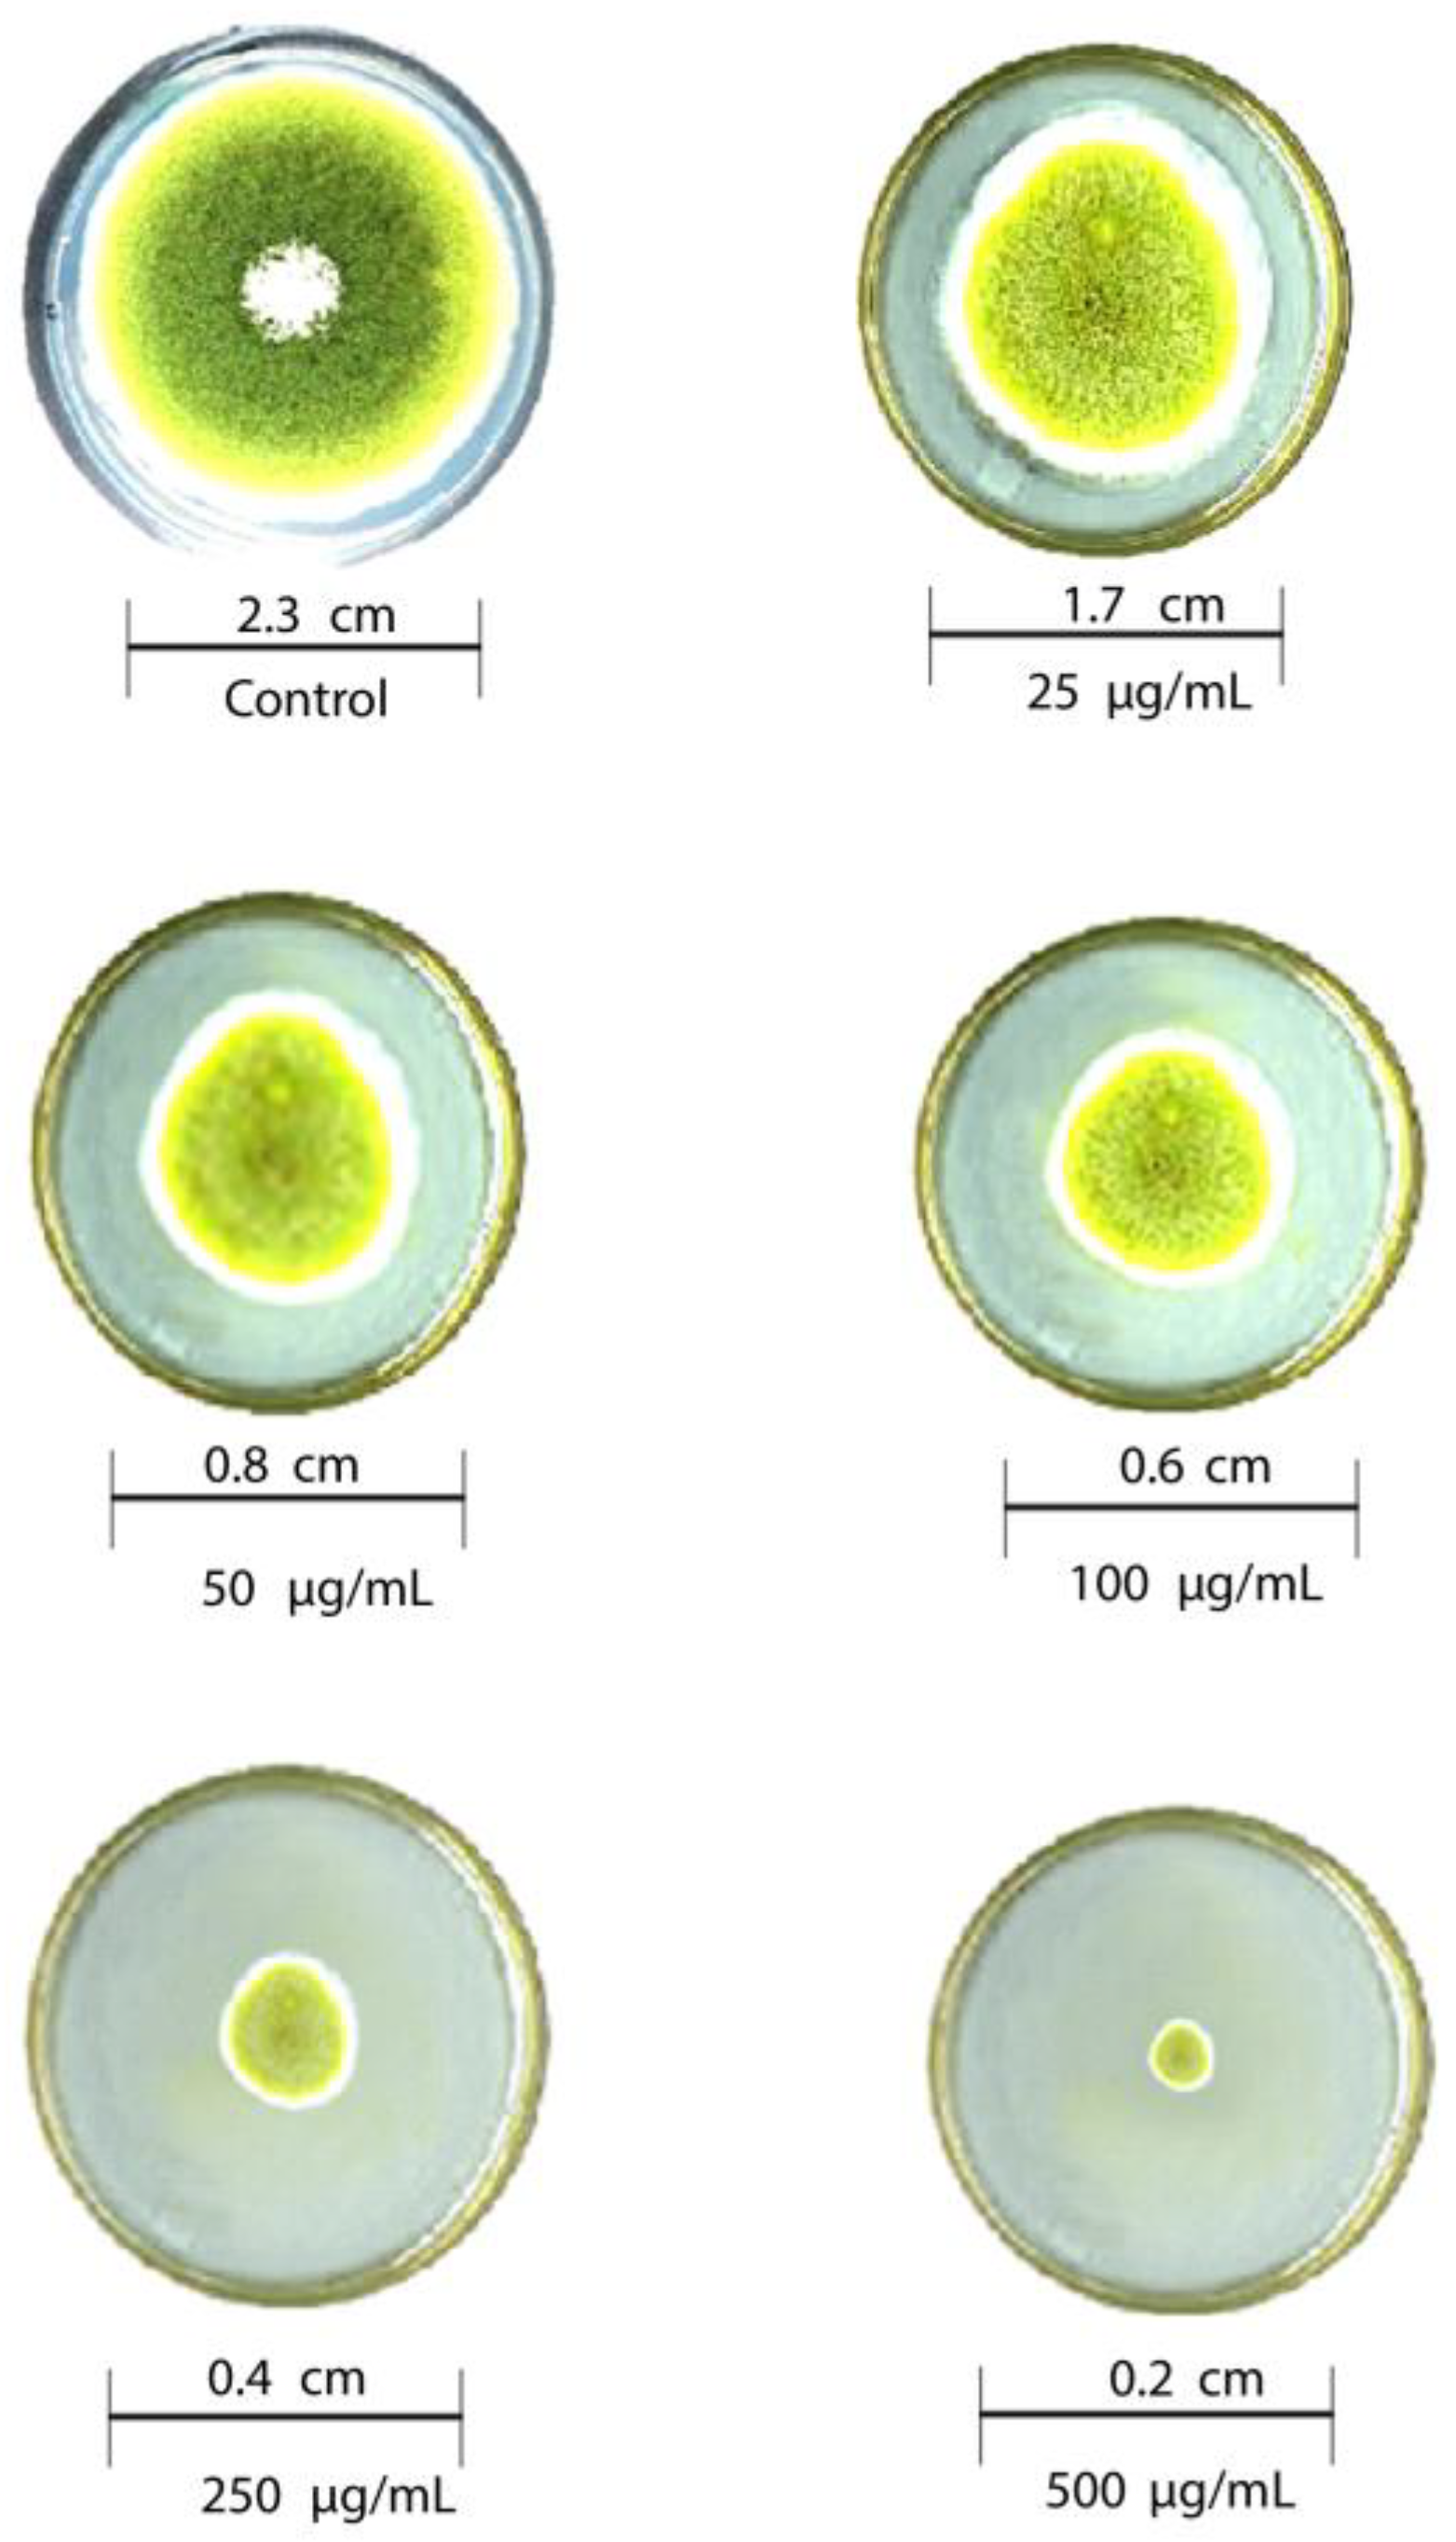
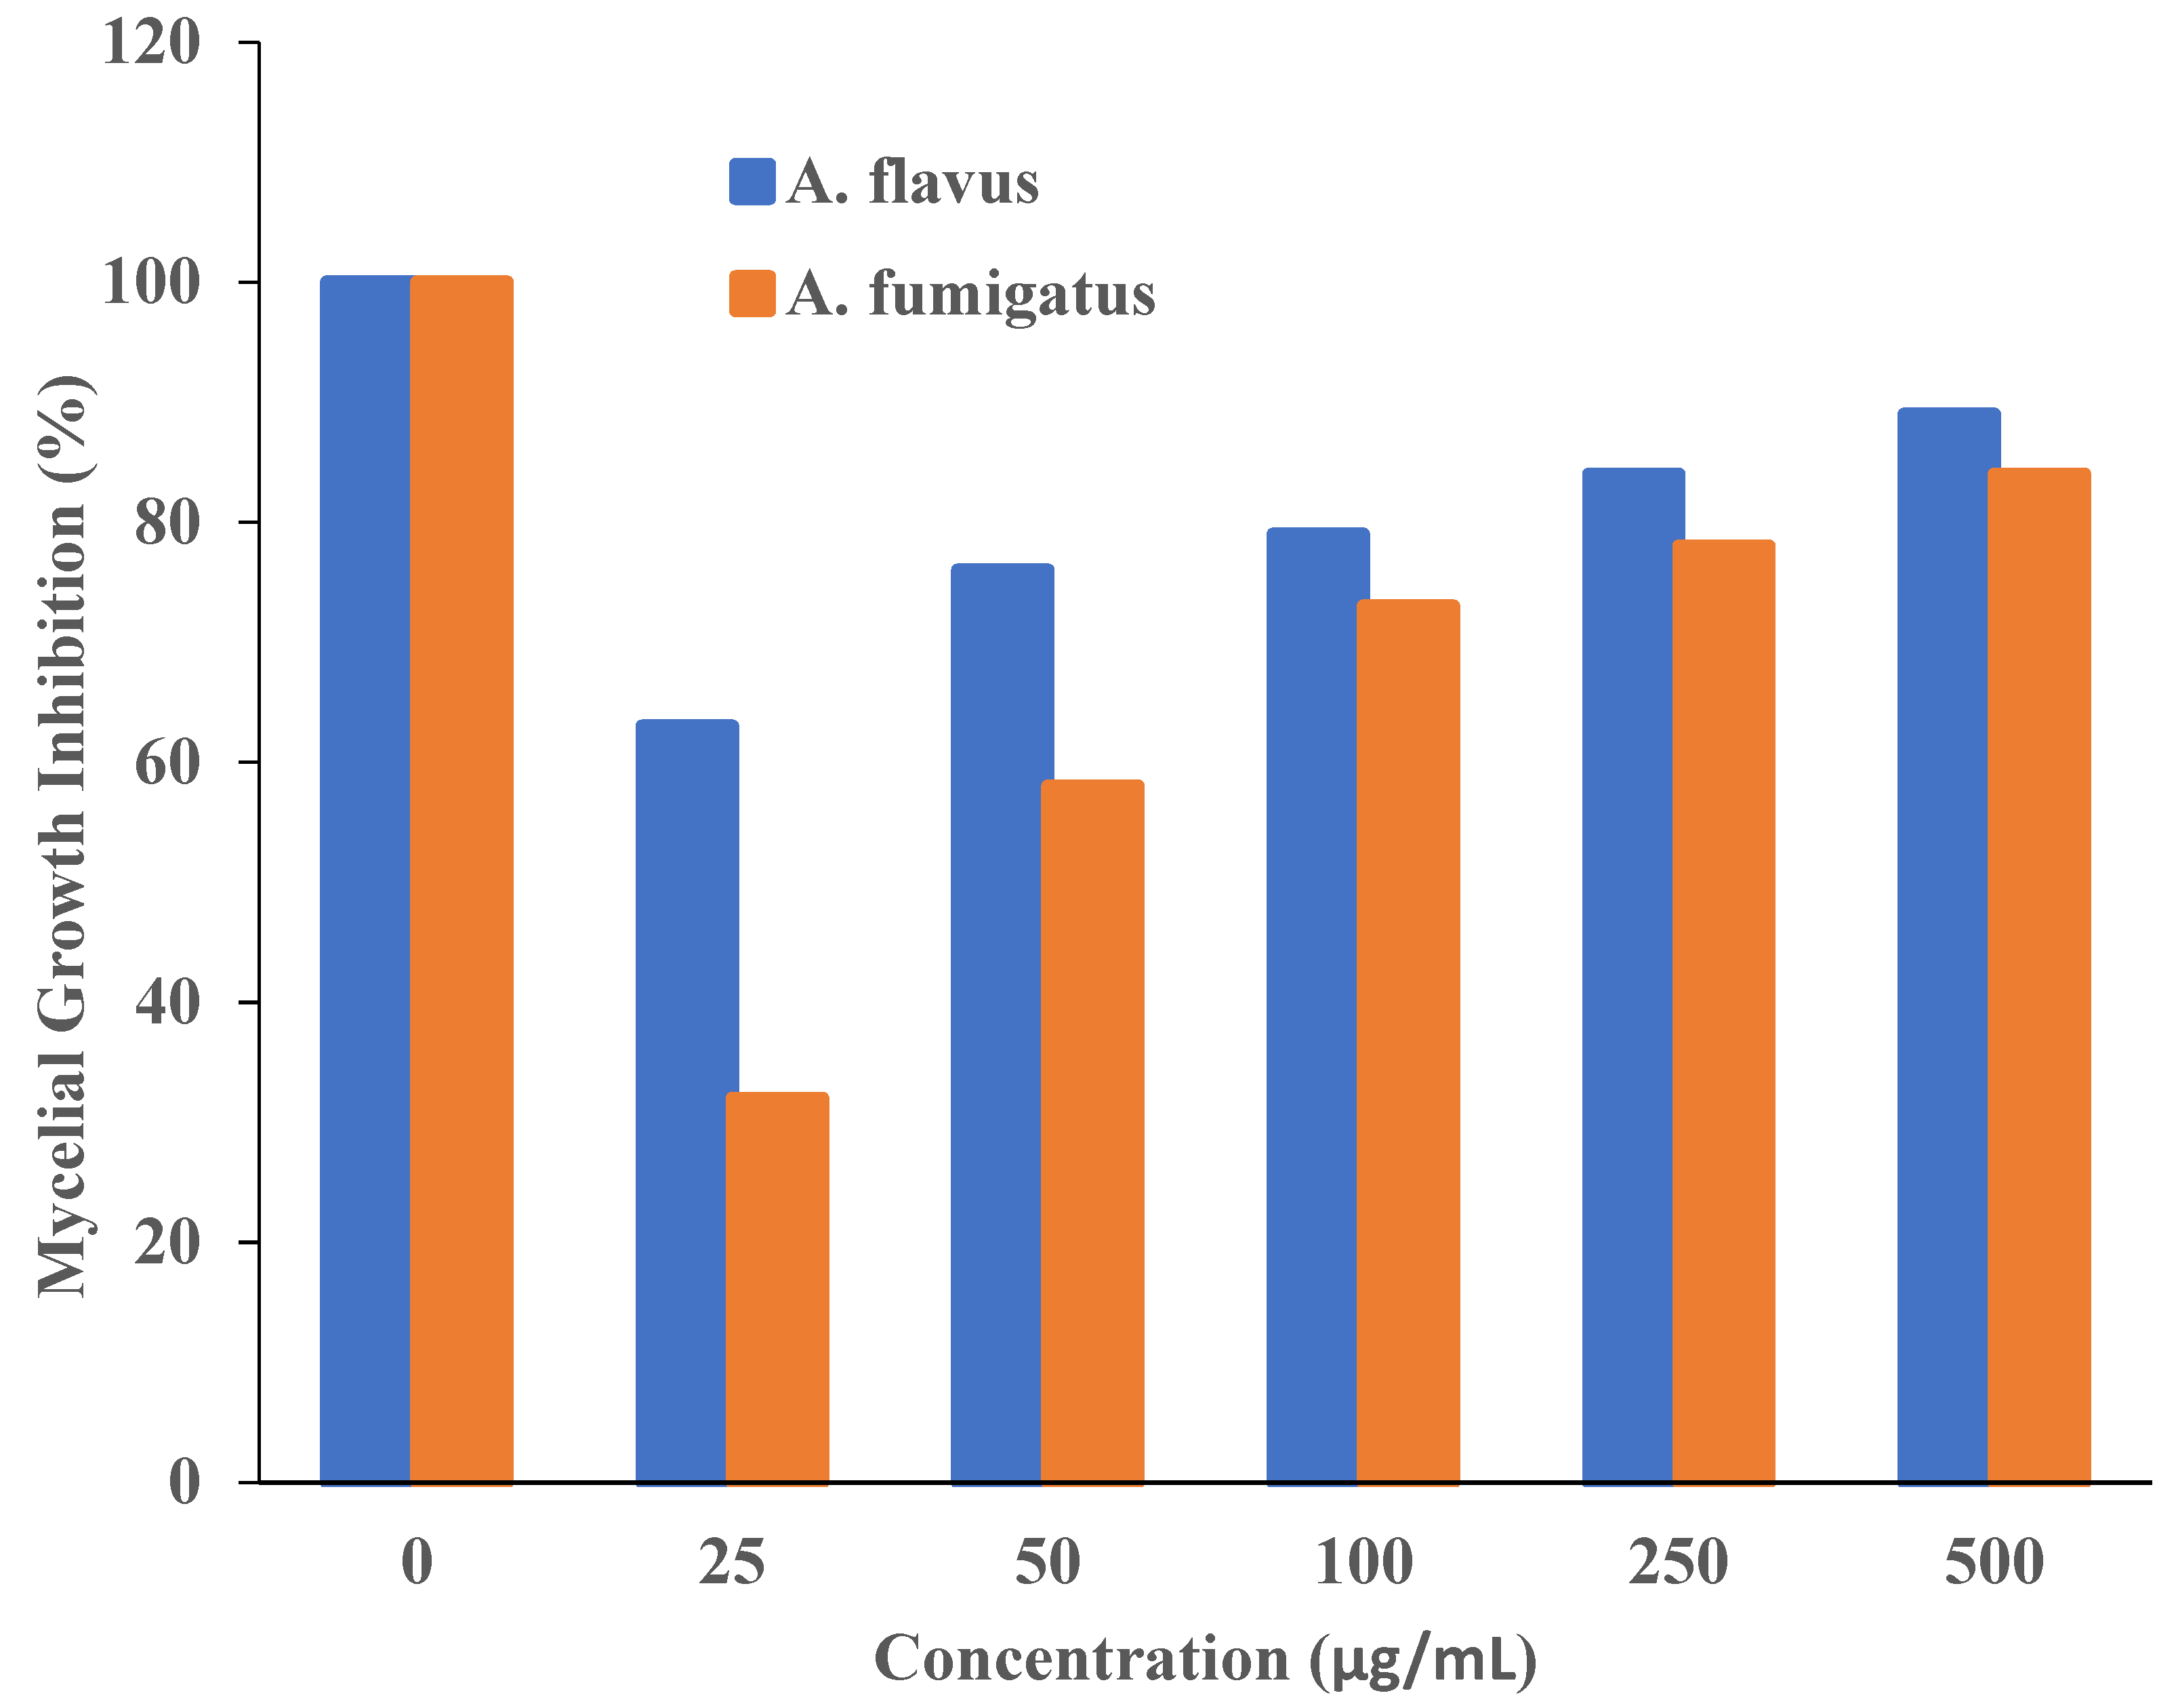
2.4. Antifungal Assay
2.5. Cell Line and Culture
2.6. Culturing of Cells and Their Treatment with GO and T-rGO
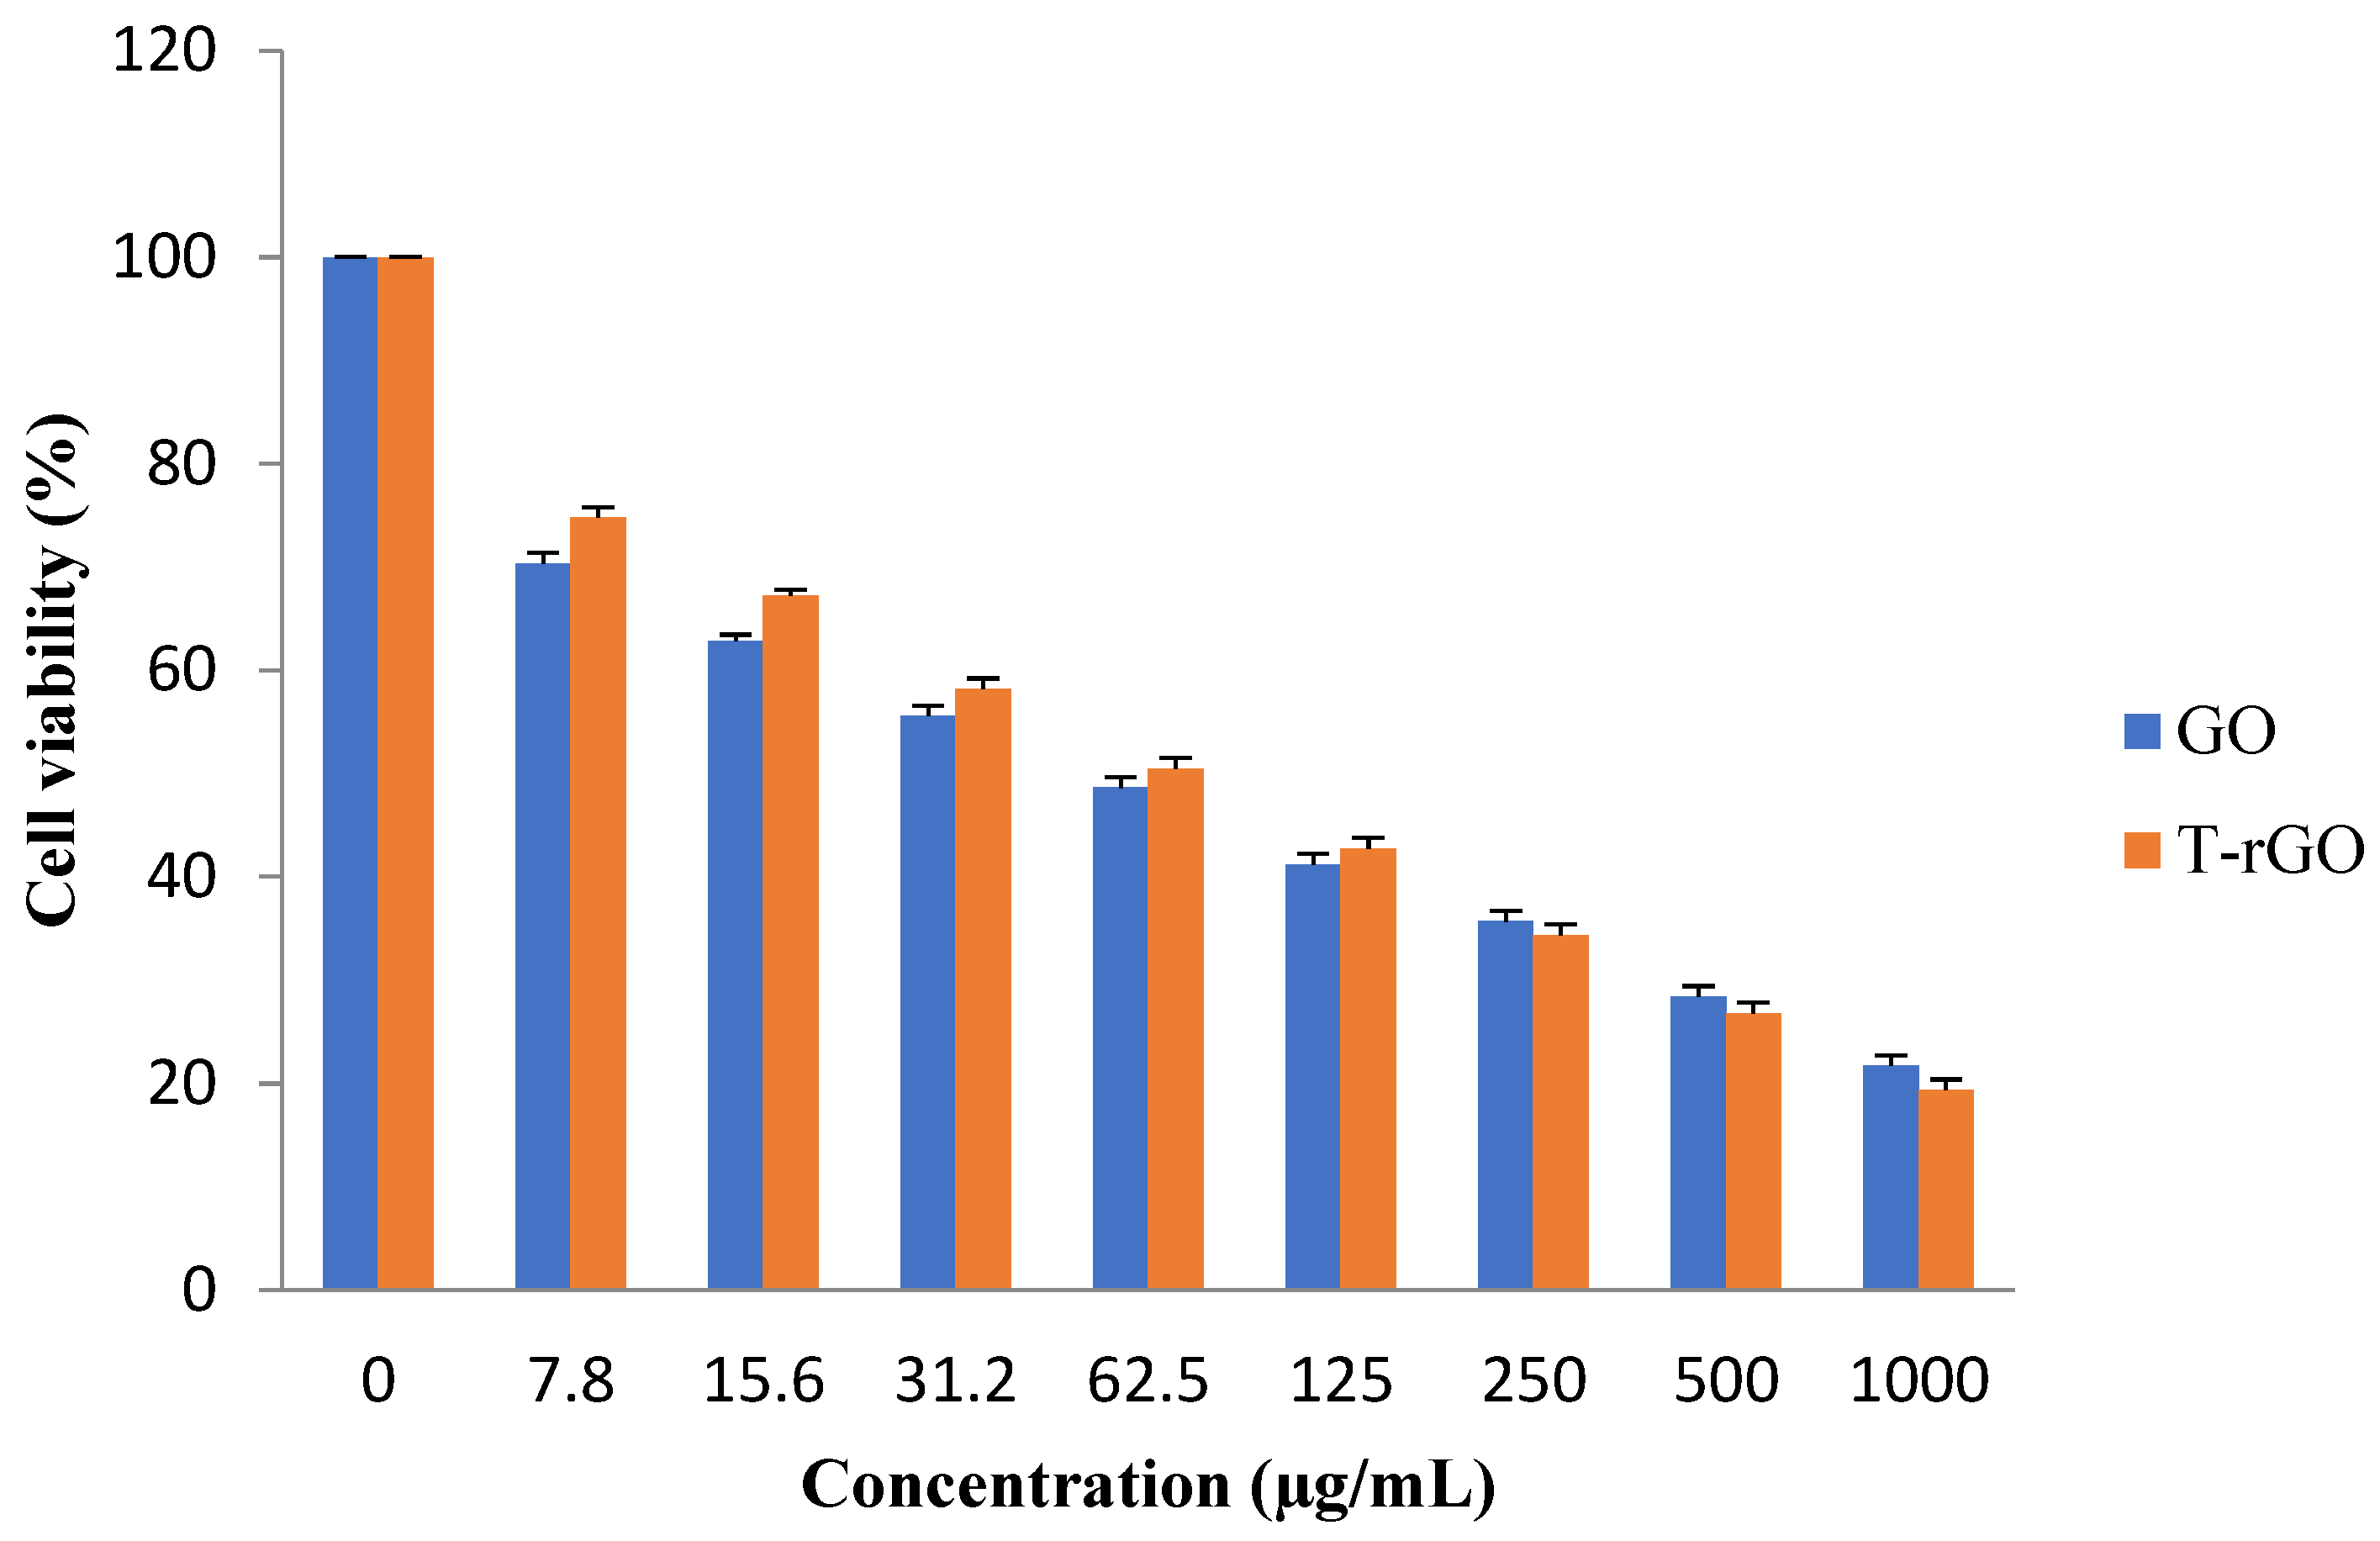
2.7. WST-8 Cell Viability Test
2.8. Cell Cycle Arrest Examination
2.9. DNA Fragmentation
2.10. Cell Morphology
3. Results and Discussion
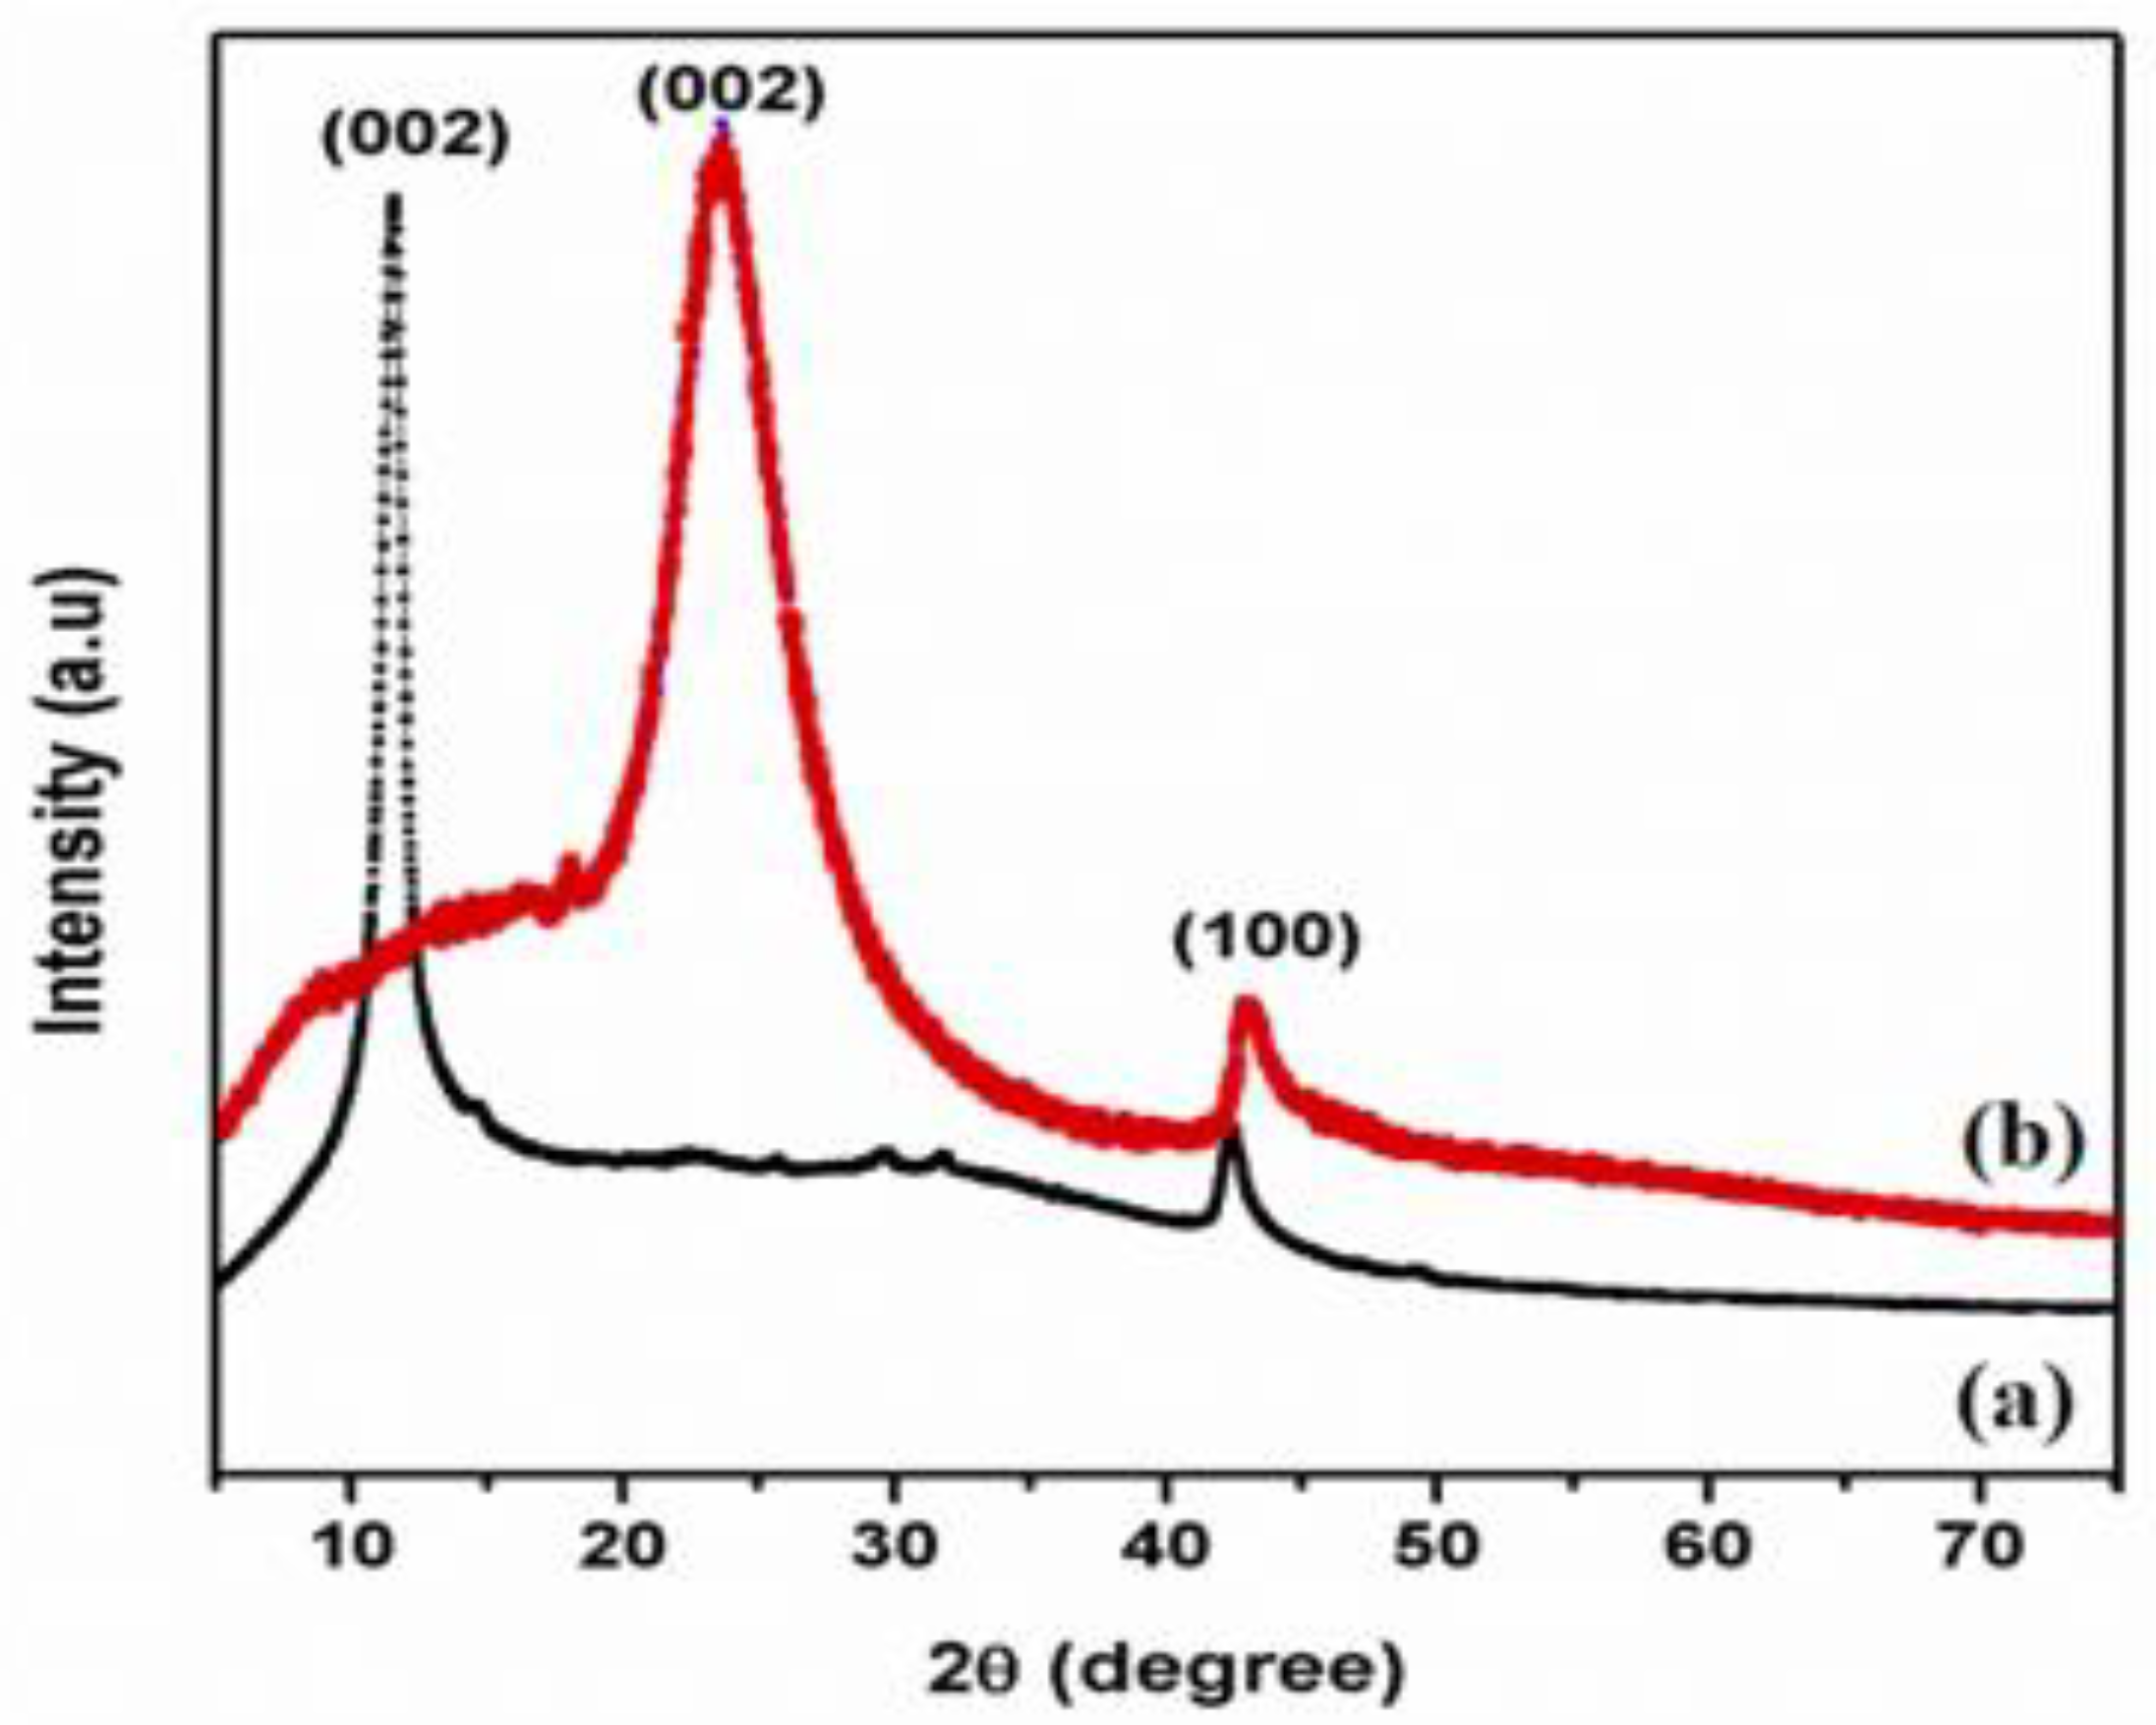
3.1. XRD Analysis
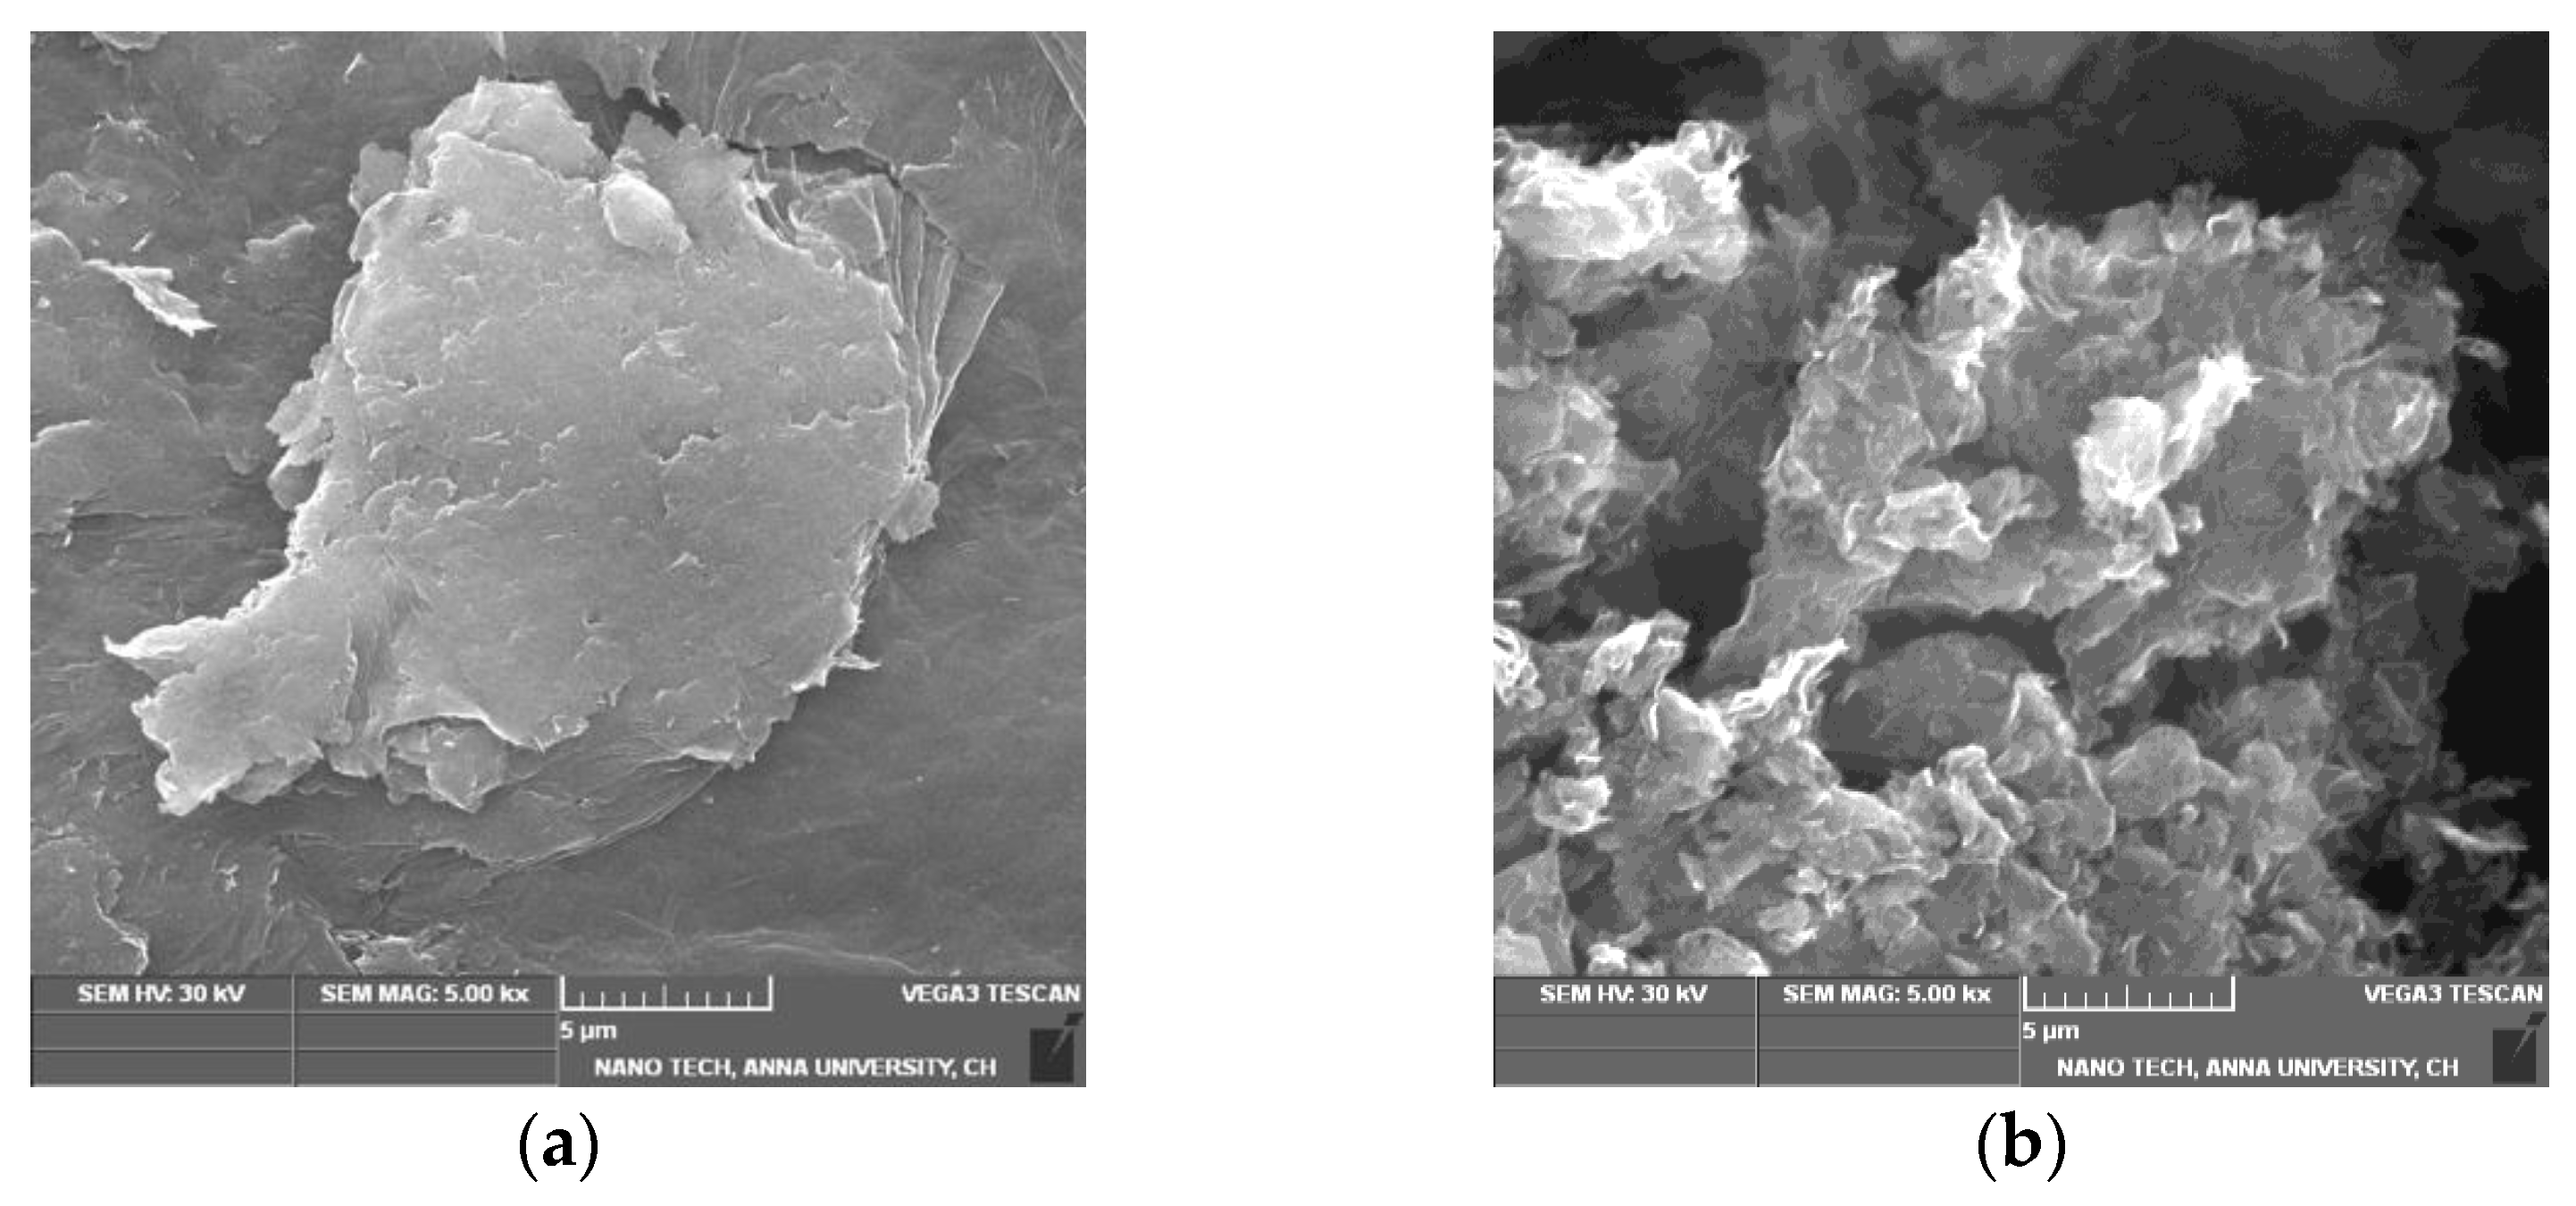
3.2. SEM Analysis
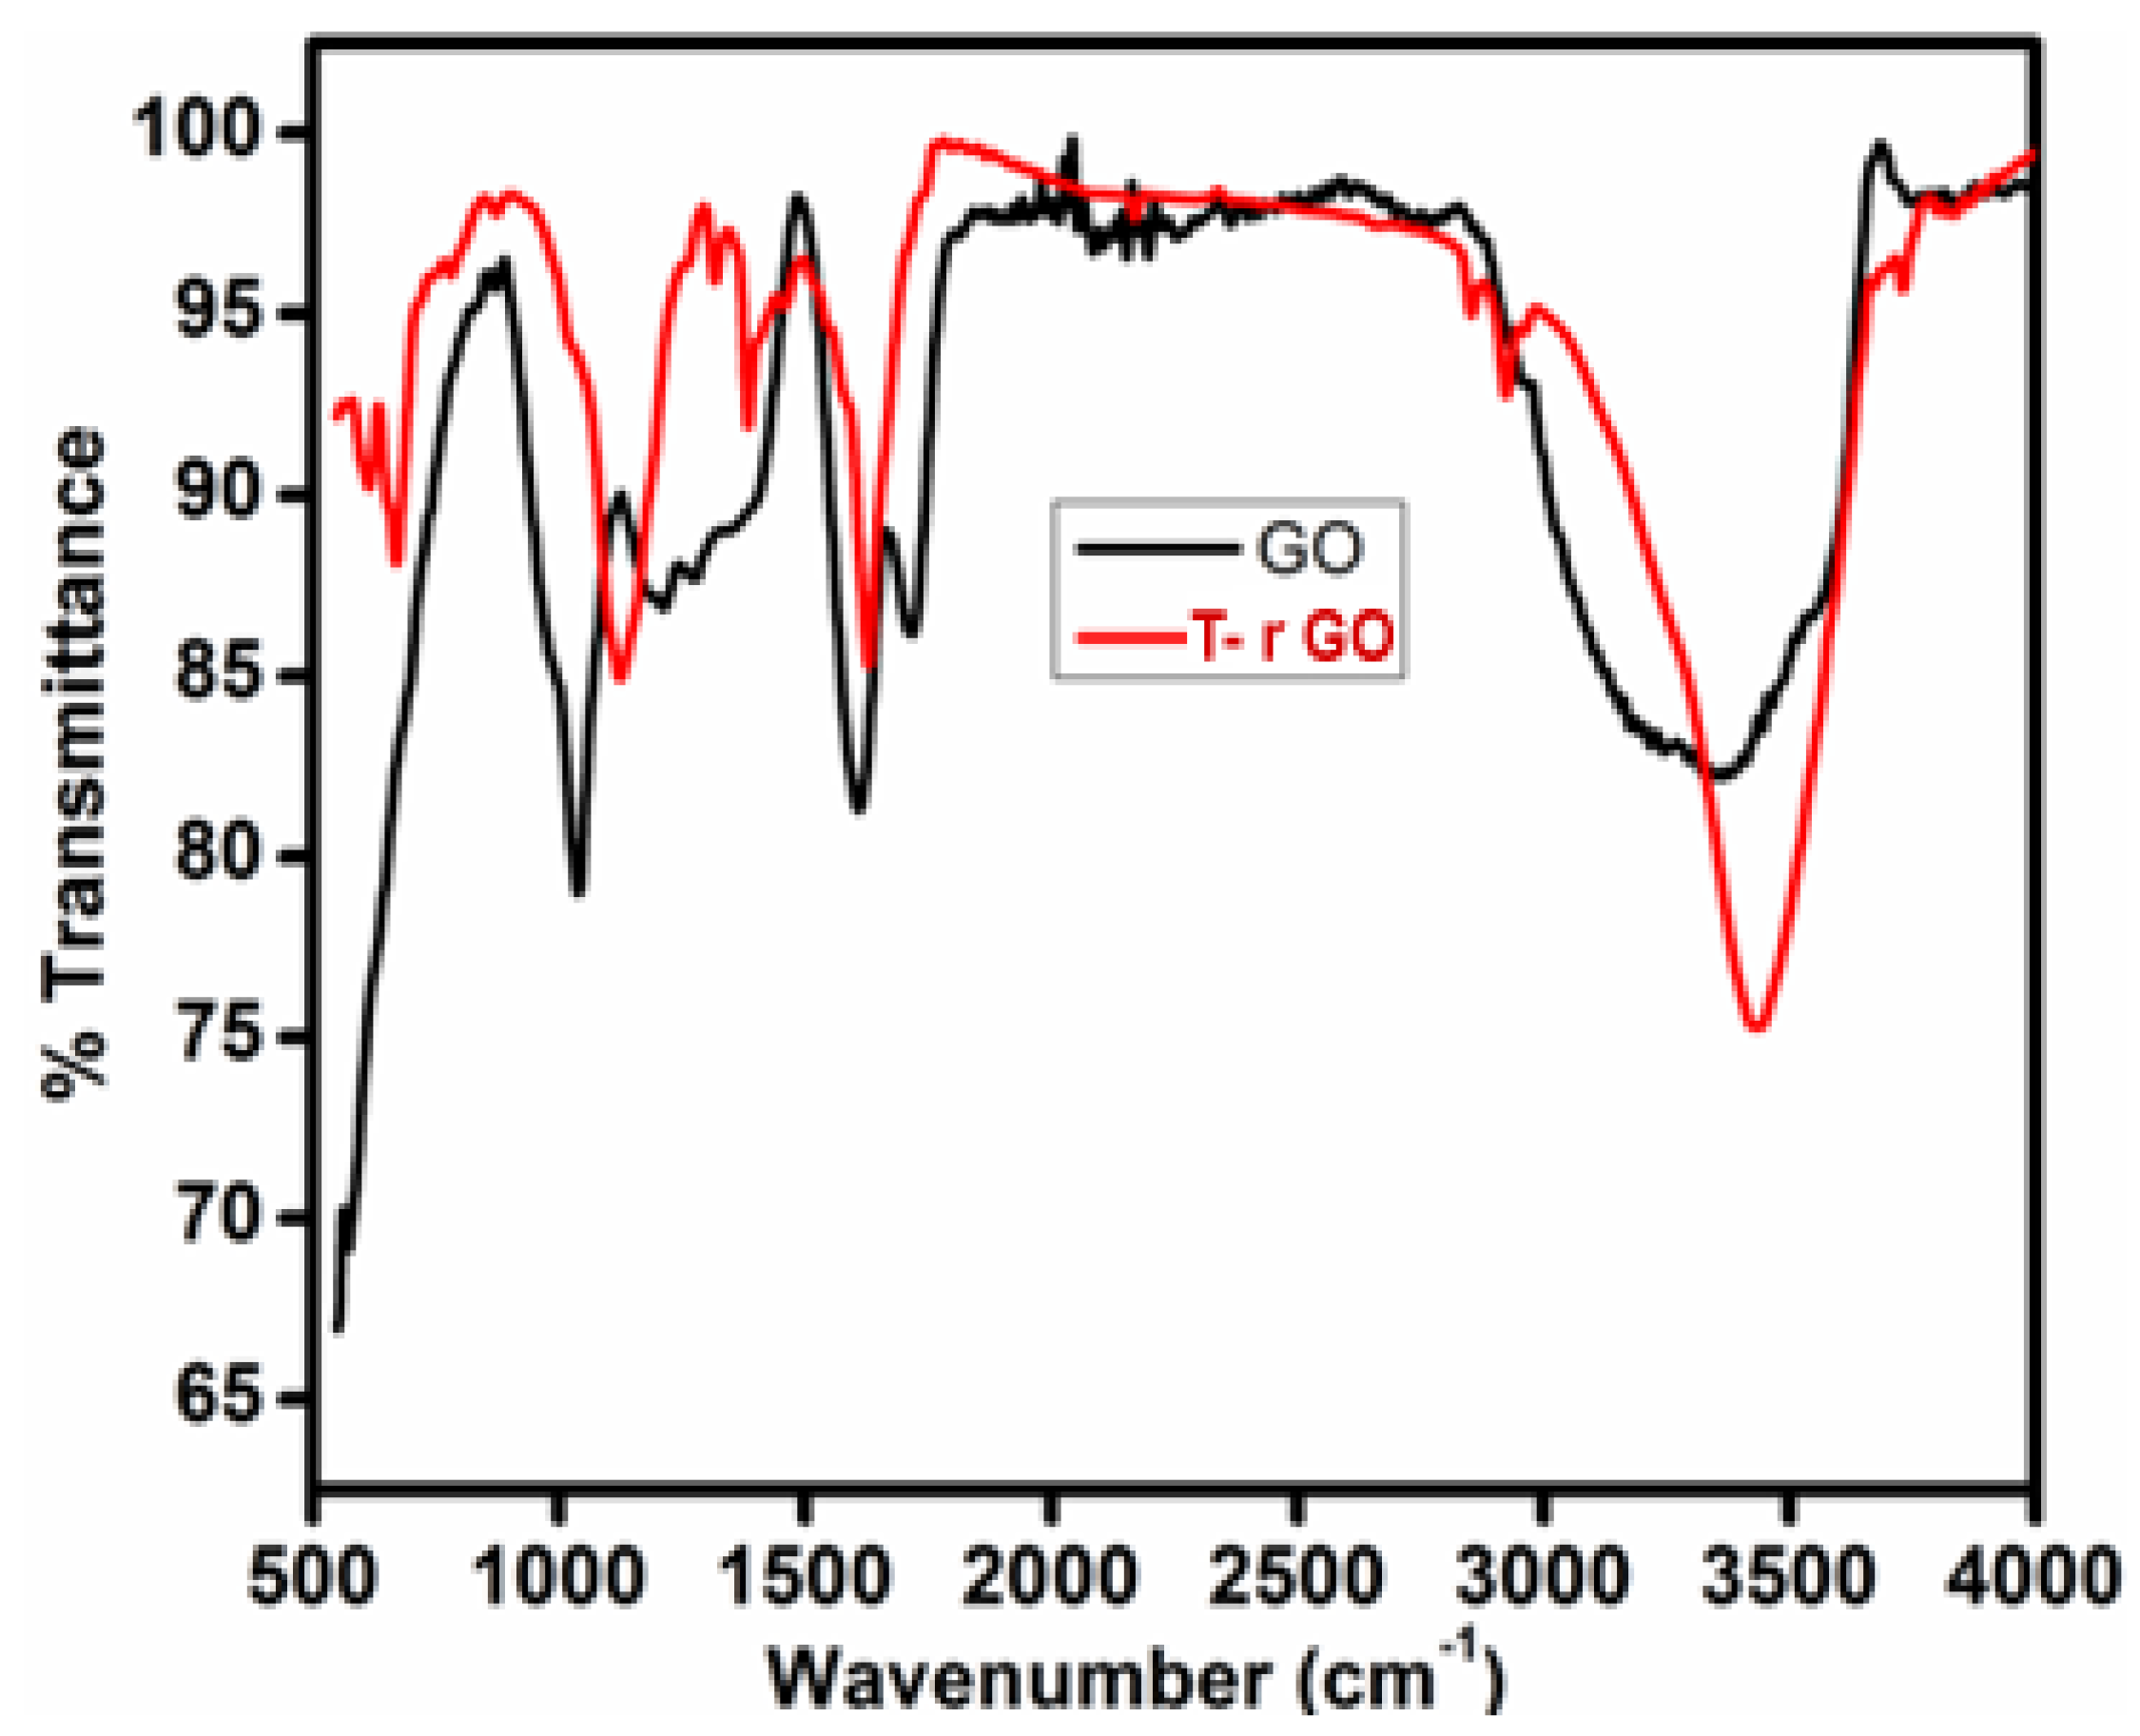
3.3. FTIR Analysis
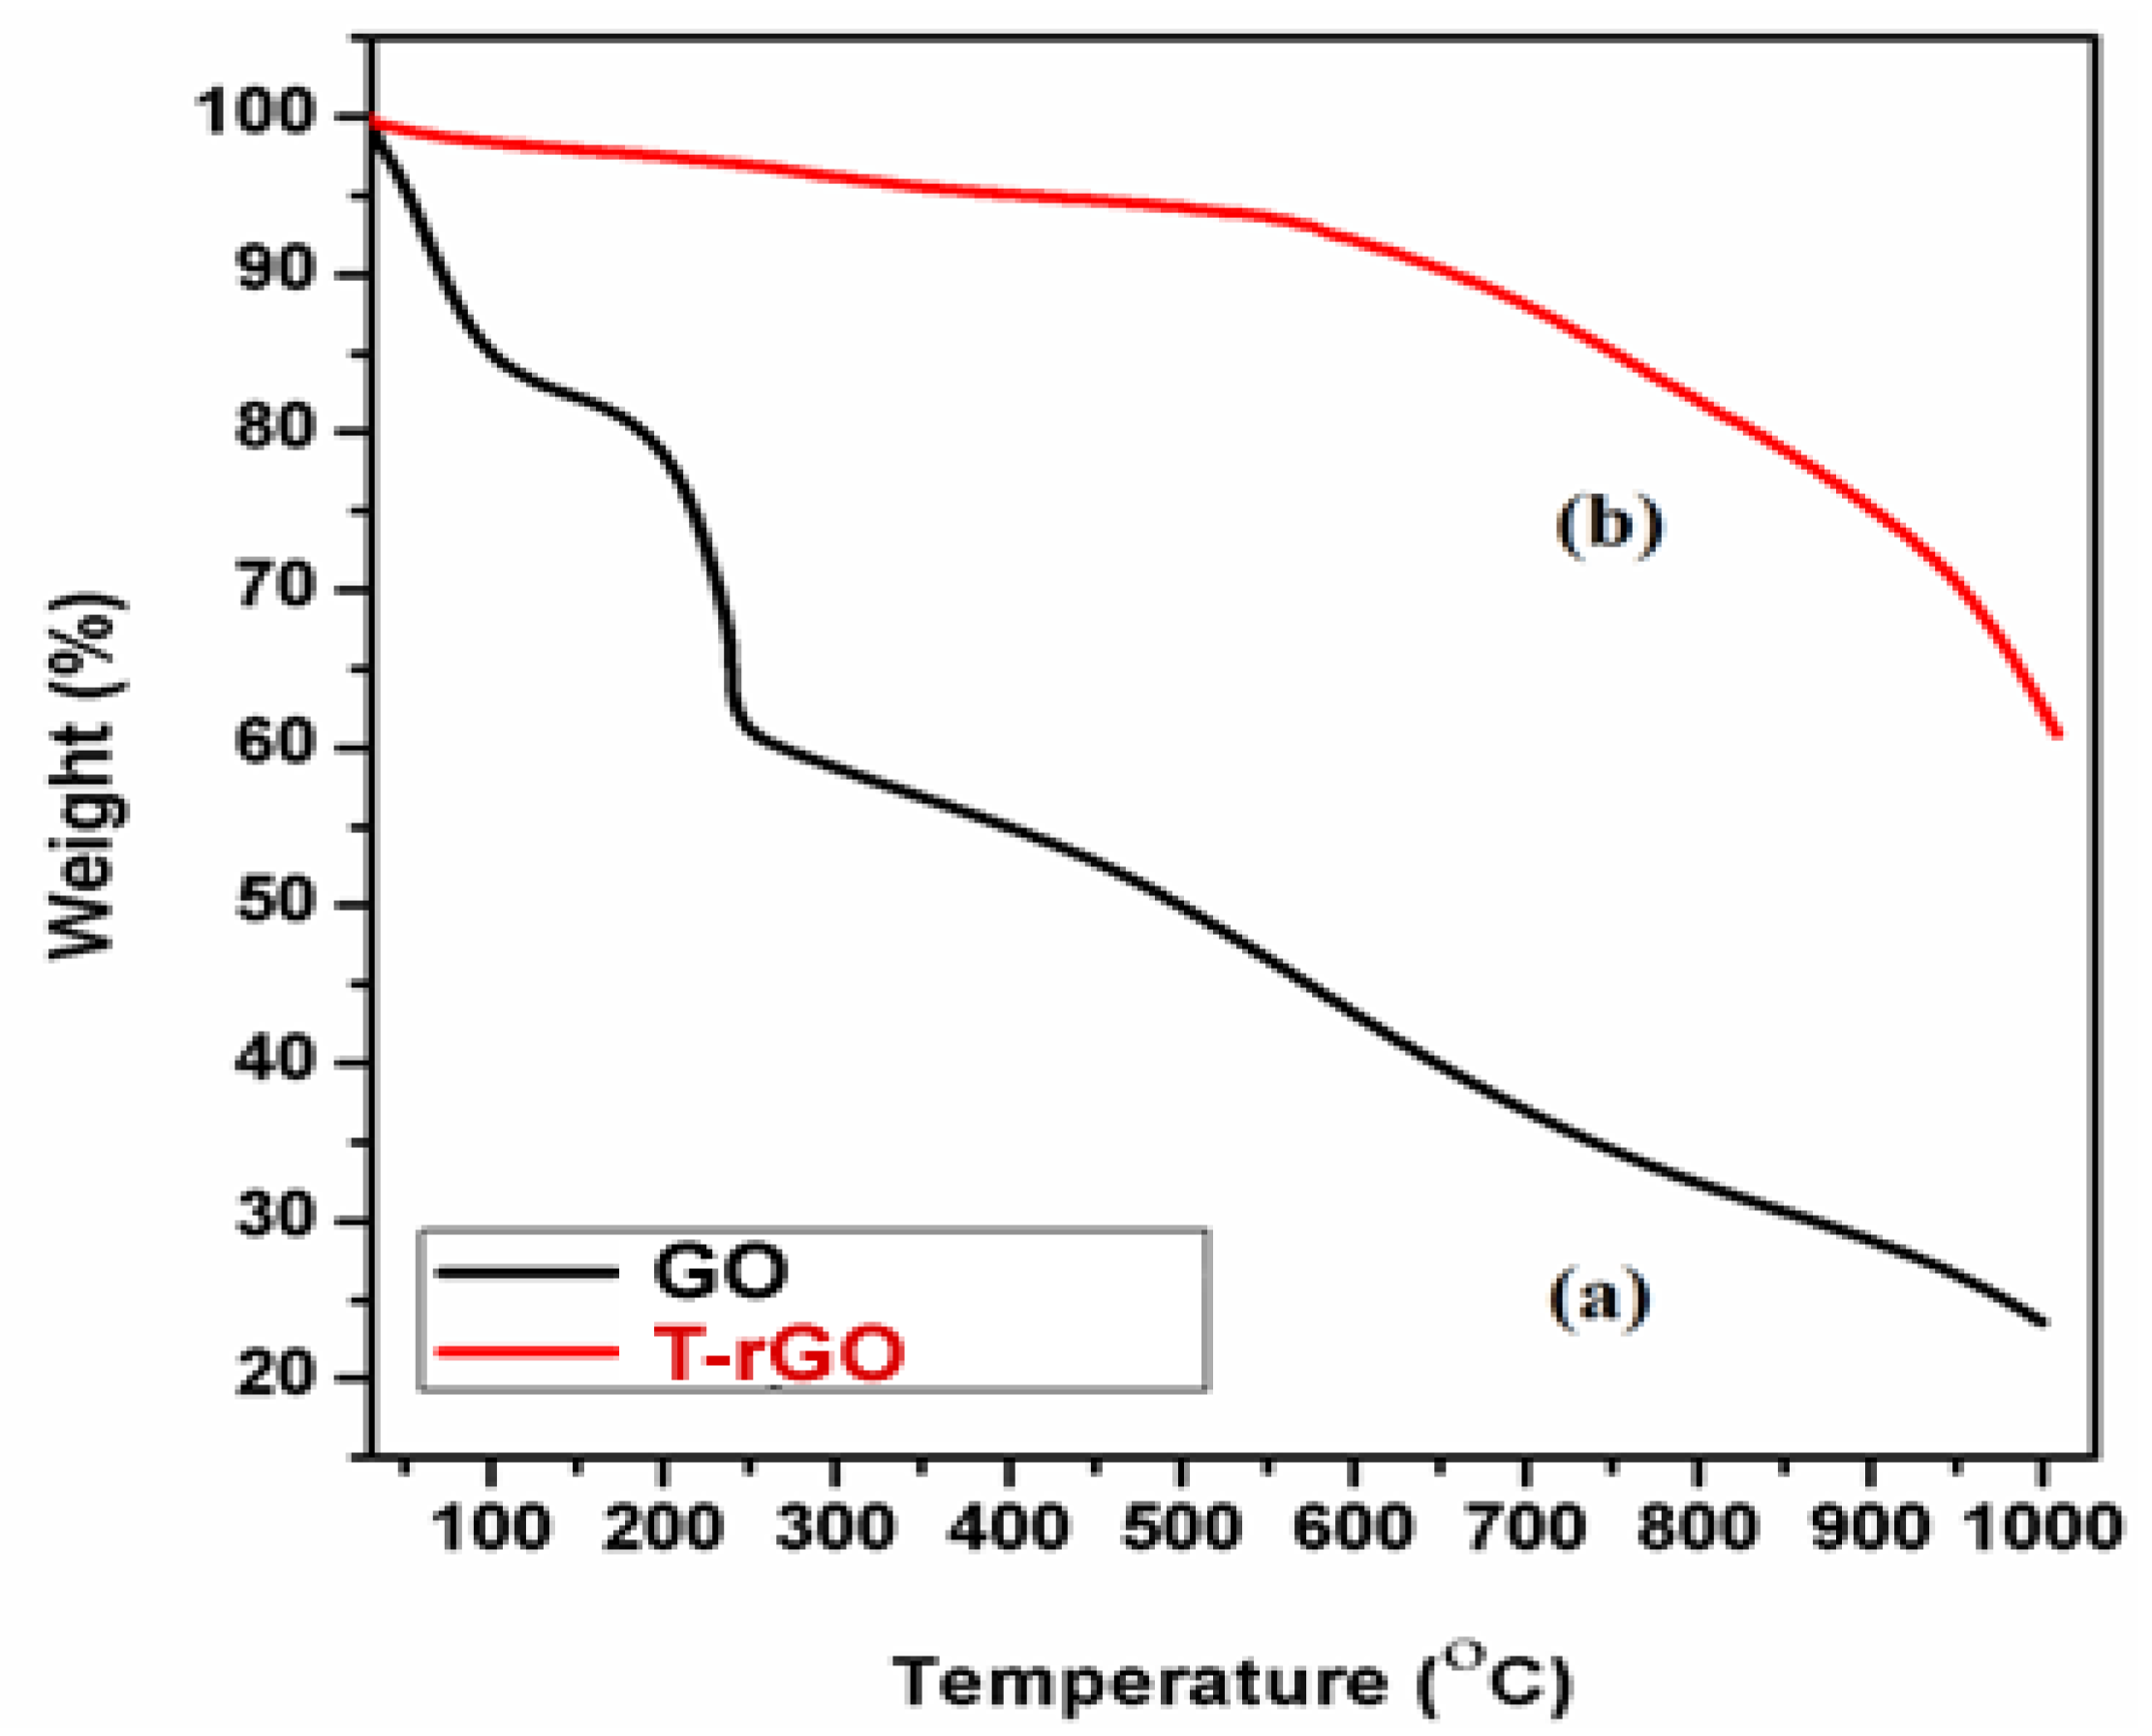
3.4. Thermal Analysis
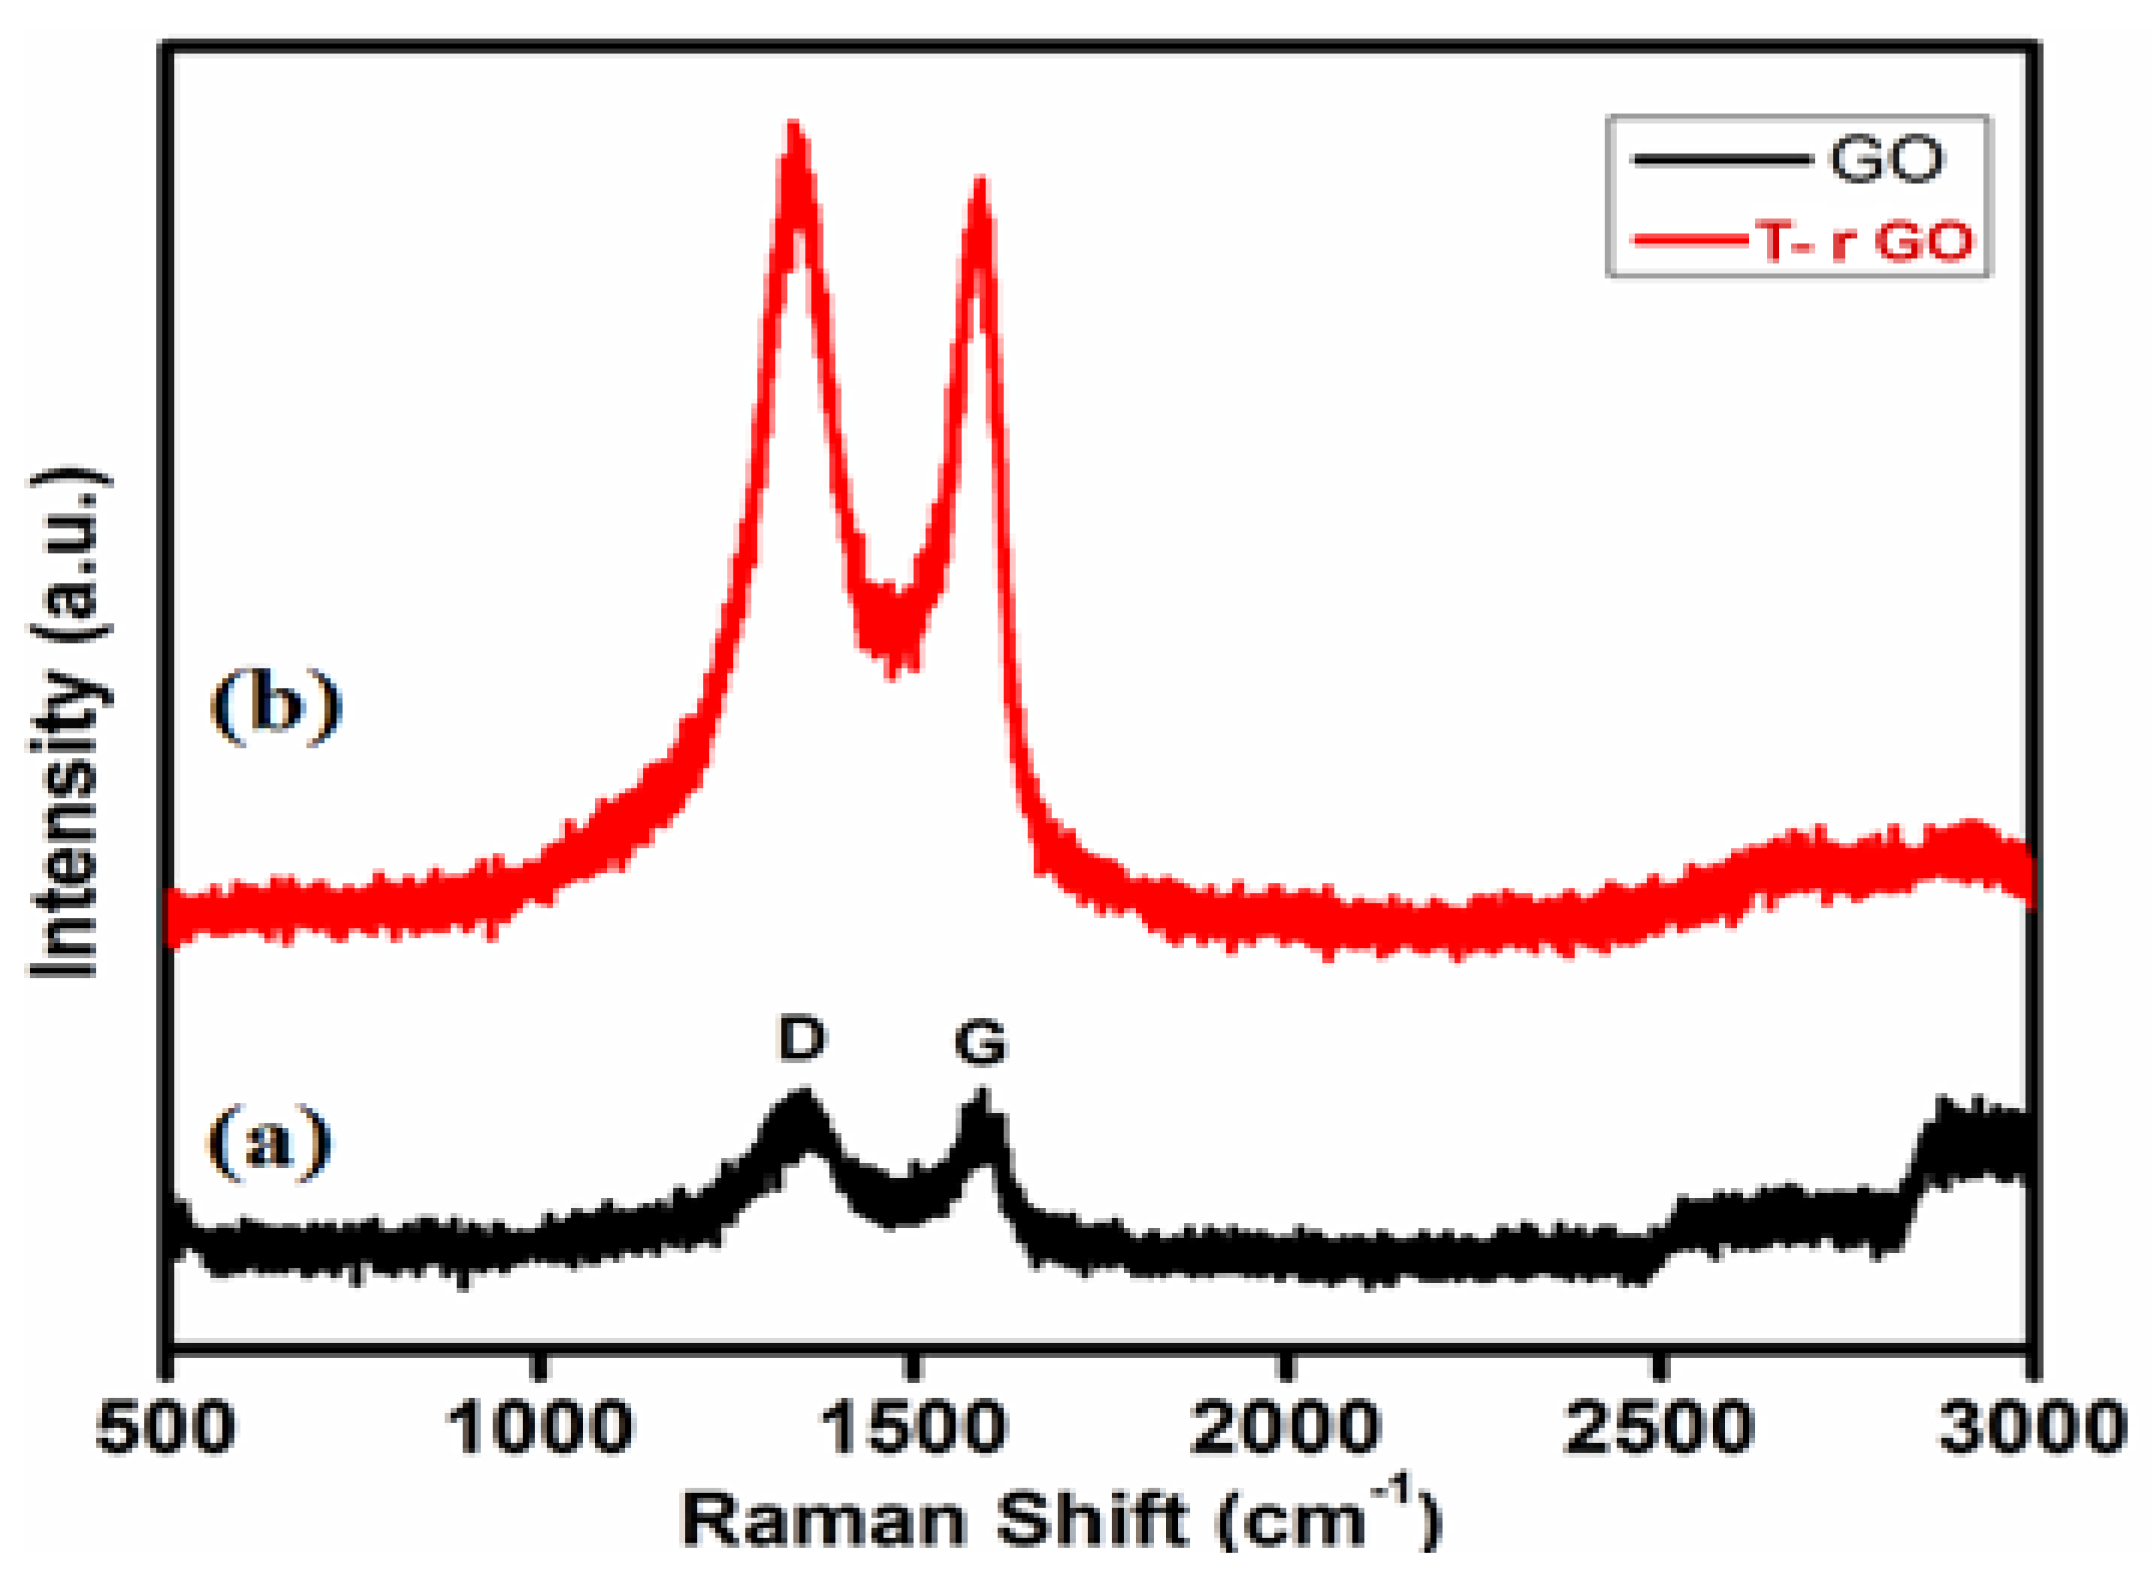
3.5. Raman Spectral Analysis
3.6. Antifungal Activity of Reduced Graphene Oxide Nanosheets
3.7. Effect of GO and T-rGO on A549 Human Lung Cancer Cells
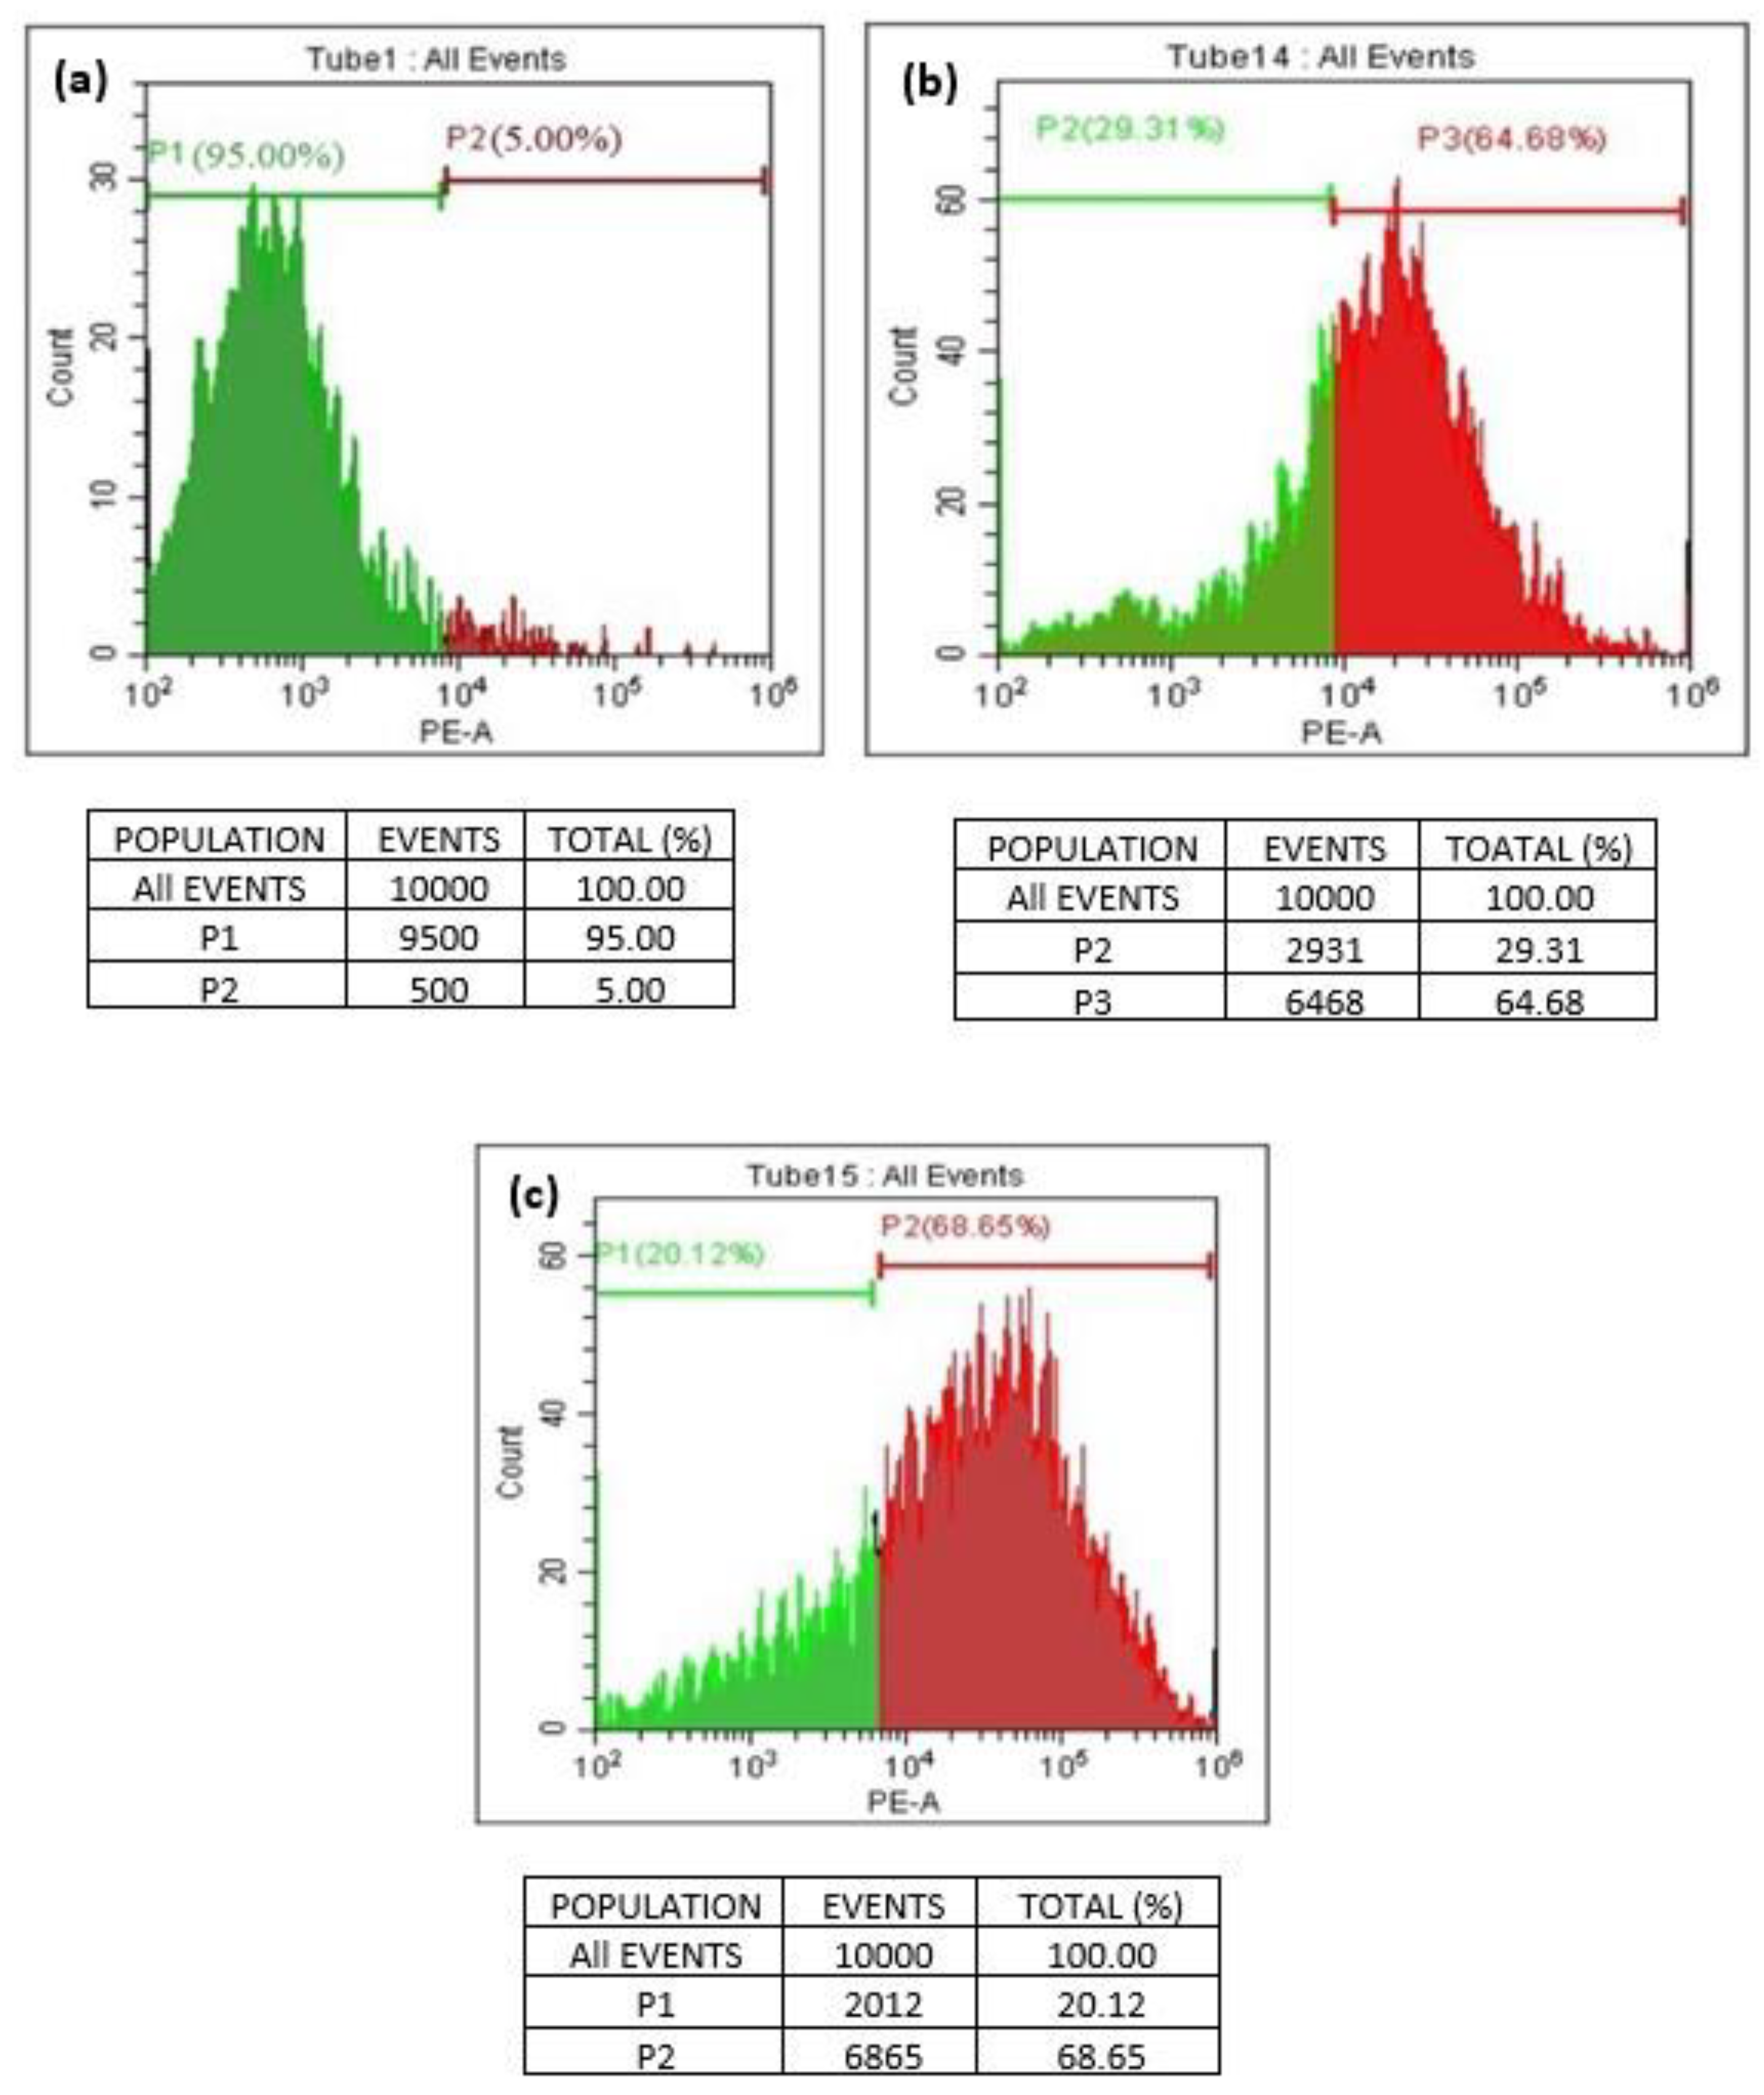
3.8. Graphene-Induced Apoptosis in A549 Human Lung Cancer Cell Line
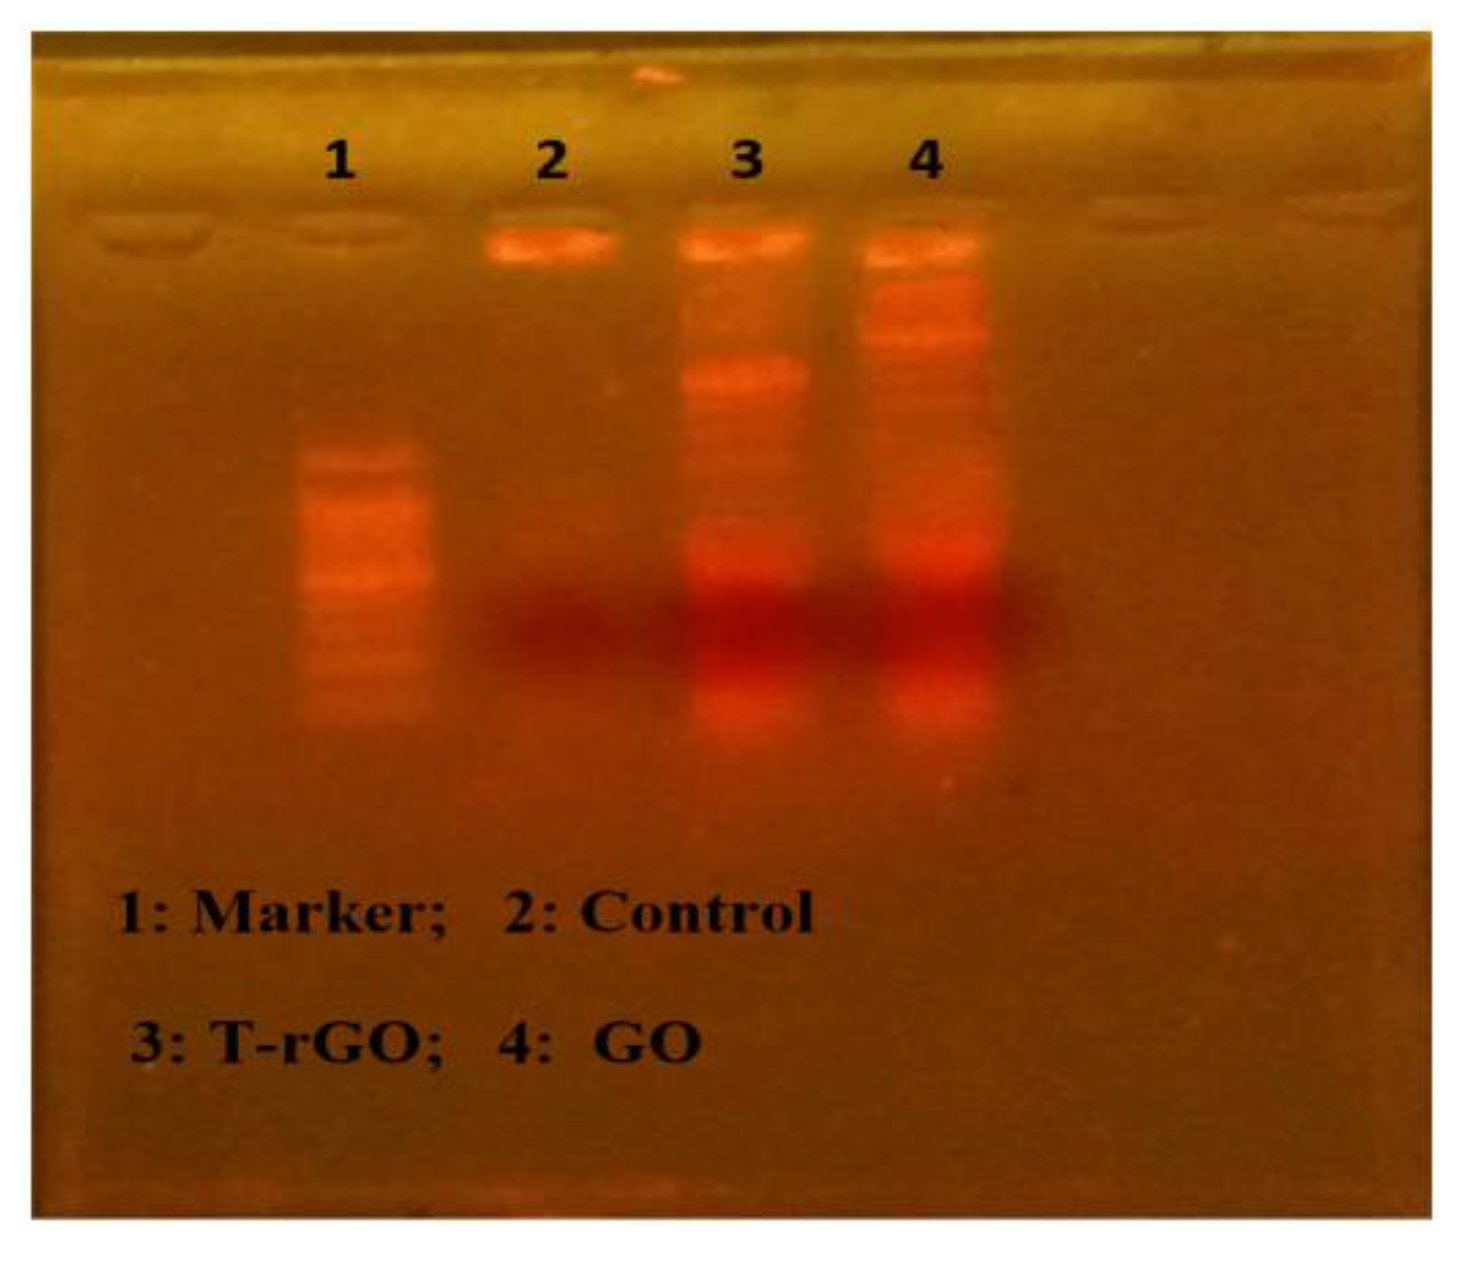
3.9. DNA Laddering
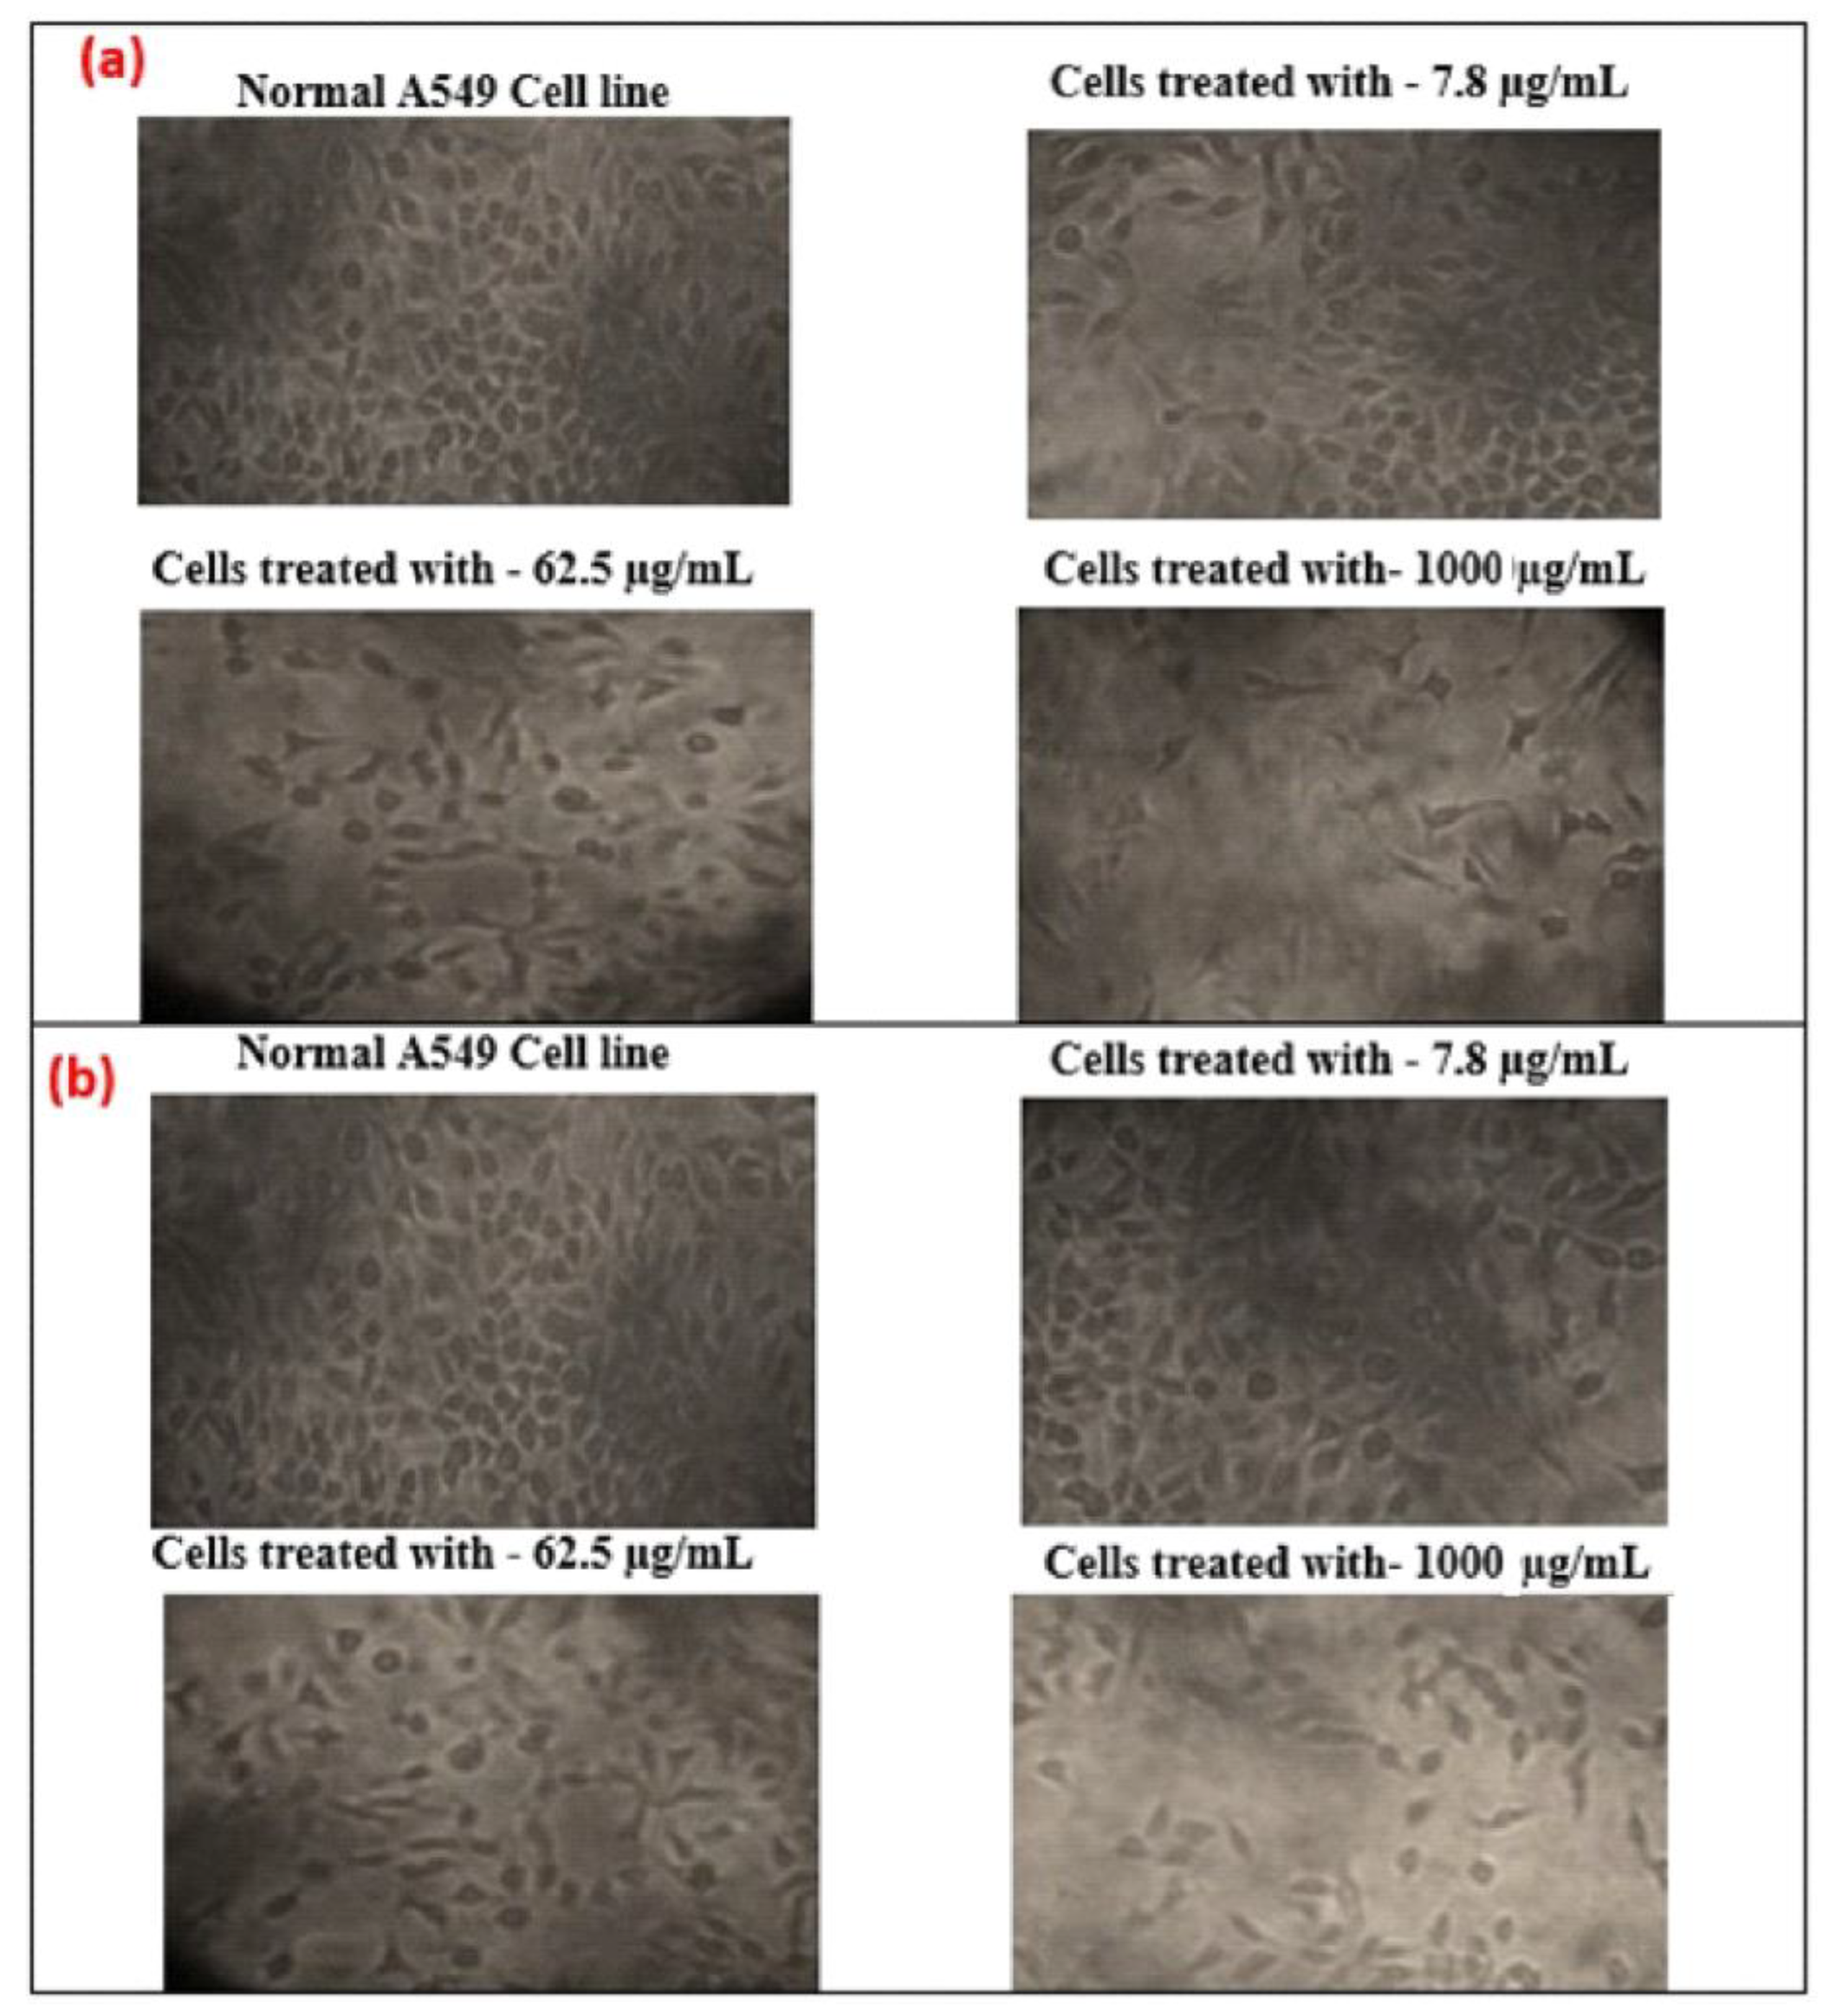
3.10. Cell Morphology
4. Conclusions
Author Contributions
Funding
Institutional Review Board Statement
Informed Consent Statement
Data Availability Statement
Acknowledgments
Conflicts of Interest
References
- Katsnelson, M.I. Graphene: Carbon in two dimensions. Mater. Today 2007, 10, 20–27. [Google Scholar] [CrossRef]
- Geim, A.K. Graphene: Status and Prospects. Science 2009, 324, 1530–1534. [Google Scholar] [CrossRef]
- Novoselov, K.S.; Geim, A.K.; Morozov, S.V.; Jiang, D.; Zhang, Y.; Dubonos, S.V.; Grigorieva, I.V.; Firsov, A.A. Electric field effect in atomically thin carbon films. Science 2004, 306, 666–669. [Google Scholar] [CrossRef] [PubMed]
- Zhu, C.; Han, T.Y.-J.; Duoss, E.B.; Golobic, A.M.; Kuntz, J.; Spadaccini, C.M.; Worsley, M.A. Highly compressible 3D periodic graphene aerogel microlattices. Nat. Commun. 2015, 6, 6962. [Google Scholar] [CrossRef] [PubMed]
- Geim, A.K.; Novoselov, K.S. The rise of graphene. Nat. Mater. 2007, 6, 183–191. [Google Scholar] [CrossRef] [PubMed]
- Lekshmi, G.; Tamilselvi, R.; Geethalakshmi, R.; Kirupha, S.; Bazaka, O.; Levchenko, I.; Bazaka, K.; Mandhakini, M. Multifunctional oil-produced reduced graphene oxide—Silver oxide composites with photocatalytic, antioxidant, and antibacterial activities. J. Colloid. Interface Sci. 2022, 608, 294–305. [Google Scholar] [CrossRef]
- Krishna, K.V.; Ménard-Moyon, C.; Verma, S.; Bianco, A. Graphene-based nanomaterials for nanobiotechnology and biomedical applications. Nanomedicine 2013, 8, 1669–1688. [Google Scholar] [CrossRef]
- Bitounis, D.; Ali-Boucetta, H.; Hong, B.H.; Min, D.-H.; Kostarelos, K. Prospects and Challenges of Graphene in Biomedical Applications. Adv. Mater. 2013, 25, 2258–2268. [Google Scholar] [CrossRef]
- Kostarelos, K.; Novoselov, K. Graphene devices for life. Nat. Nanotechnol. 2014, 9, 744–745. [Google Scholar] [CrossRef]
- Sattari, S.; Adeli, M.; Beyranvand, S.; Nemati, M. Functionalized Graphene Platforms for Anticancer Drug Delivery. Int. J. Nanomed. 2021, 16, 5955–5980. [Google Scholar] [CrossRef]
- Melucci, M.; Durso, M.; Zambianchi, M.; Treossi, E.; Xia, Z.-Y.; Manet, I.; Giambastiani, G.; Ortolani, L.; Morandi, V.; De Angelis, F.; et al. Graphene–organic hybrids as processable, tunable platforms for pH-dependent photoemission, obtained by a new modular approach. J. Mater. Chem. 2012, 22, 18237–18243. [Google Scholar] [CrossRef]
- Siafaka, P.; Okur, N.; Karavasm, E.; Bikiaris, D. Surface modified multifunctional and stimuli responsive nanoparticles for drug targeting: Current status and uses. Int. J. Mol. Sci. 2016, 17, 1440. [Google Scholar] [CrossRef] [PubMed]
- Singh, V.; Joung, D.; Zhai, L.; Das, S.; Khondaker, S.I.; Seal, S. Graphene based materials: Past, present and future. Prog. Mater. Sci. 2011, 56, 1178–1271. [Google Scholar] [CrossRef]
- He, Y.; Chen, W.; Gao, C.; Zhou, J.; Li, X.; Xie, E. An overview of carbon materials for flexible electrochemical capacitors. Nanoscale 2013, 5, 8799–8820. [Google Scholar] [CrossRef] [PubMed]
- Jariwala, D.; Sangwan, V.K.; Lauhon, L.J.; Marks, T.J.; Hersam, M.C. Carbon nanomaterials for electronics, optoelectronics, photovoltaics, and sensing. Chem. Soc. Rev. 2013, 42, 2824–2860. [Google Scholar] [CrossRef]
- Feng, L.; Wu, L.; Qu, X. New Horizons for Diagnostics and Therapeutic Applications of Graphene and Graphene Oxide. Adv. Mater. 2012, 25, 168–186. [Google Scholar] [CrossRef]
- Ma, J.; Jiang, Y.; Shen, L.; Ma, H.; Sun, T.; Lv, F.; Liu, Y.; Liu, J.; Zhu, N. Oil-water self-assembly engineering of Prussian blue/quantum dots decorated graphene film for wearable textile biosensors and photoelectronic unit. Chem. Eng. J. 2022, 427, 131824. [Google Scholar] [CrossRef]
- Bi, S.; Zhao, T.; Luo, B. A graphene oxide platform for the assay of biomolecules based on chemiluminescence resonance energy transfer. Chem. Commun. 2012, 48, 106–108. [Google Scholar] [CrossRef]
- Hu, Y.; Li, F.; Han, D.; Wu, T.; Zhang, Q.; Niu, L.; Bao, Y. Simple and label-free electrochemical assay for signal-on DNA hybridization directly at undecorated graphene oxide. Anal. Chim. Acta 2012, 753, 82–89. [Google Scholar] [CrossRef]
- Croitoru, A.-M.; Moroșan, A.; Tihăuan, B.; Oprea, O.; Motelică, L.; Trușcă, R.; Nicoară, A.I.; Popescu, R.-C.; Savu, D.; Mihăiescu, D.E.; et al. Novel Graphene Oxide/Quercetin and Graphene Oxide/Juglone Nanostructured Platforms as Effective Drug Delivery Systems with Biomedical Applications. Nanomaterials 2022, 12, 1943. [Google Scholar] [CrossRef]
- Ang, P.K.; Li, A.; Jaiswal, M.; Wang, Y.; Hou, H.W.; Thong, J.T.L.; Lim, C.T.; Loh, K.P. Flow Sensing of Single Cell by Graphene Transistor in a Microfluidic Channel. Nano Lett. 2011, 11, 5240–5246. [Google Scholar] [CrossRef] [PubMed]
- Aparicio-Collado, J.; García-San-Martín, N.; Molina-Mateo, J.; Cabanilles, C.T.; Quiles, V.D.; Serrano-Aroca, A.; i Serra, R.S. Electroactive calcium-alginate/polycaprolactone/reduced graphene oxide nanohybrid hydrogels for skeletal muscle tissue engineering. Colloids Surf. B Biointerfaces 2022, 214, 112455. [Google Scholar] [CrossRef] [PubMed]
- Aravena, R.; Besoain, X.; Riquelme, N.; Salinas, A.; Valenzuela, M.; Oyanedel, E.; Barros, W.; Olguin, Y.; Madrid, A.; Alvear, M.; et al. Antifungal Nanoformulation for Biocontrol of Tomato Root and Crown Rot Caused by Fusarium oxysporum f. sp. radicis-lycopersici. Antibiotics 2021, 10, 1132. [Google Scholar] [CrossRef] [PubMed]
- Hu, X.; Mu, L.; Wen, J.; Zhou, Q. Covalently synthesized graphene oxide-aptamer nanosheets for efficient visible-light photocatalysis of nucleic acids and proteins of viruses. Carbon 2012, 50, 2772–2781. [Google Scholar] [CrossRef]
- Kim, S.; Ryoo, S.-R.; Na, H.-K.; Kim, Y.-K.; Choi, B.-S.; Lee, Y.; Kim, D.-E.; Min, D.-H. Deoxyribozyme-loaded nano-graphene oxide for simultaneous sensing and silencing of the hepatitis C virus gene in liver cells. Chem. Commun. 2013, 49, 8241–8243. [Google Scholar] [CrossRef]
- Jang, H.; Ryoo, S.-R.; Kim, Y.-K.; Yoon, S.; Kim, H.; Han, S.W.H.; Choi, B.; Kim, D.; Min, D. Discovery of Hepatitis C Virus NS3 Helicase Inhibitors by a Multiplexed, High-Throughput Helicase Activity Assay Based on Graphene Oxide. Angew. Chem. Int. Ed. 2013, 52, 2340–2344. [Google Scholar] [CrossRef]
- Bousiakou, L.G.; Qindeel, R.; Al-Dossary, O.M.; Kalkani, H. Synthesis and characterization of graphene oxide (GO) sheets for pathogen inhibition: Escherichia coli, Staphylococcus aureus and Pseudomonas aeruginosa. J. King Saud Univ.-Sci. 2022, 34, 102002. [Google Scholar] [CrossRef]
- Choi, Y.-J.; Gurunathan, S.; Kim, J.-H. Graphene Oxide–Silver Nanocomposite Enhances Cytotoxic and Apoptotic Potential of Salinomycin in Human Ovarian Cancer Stem Cells (OvCSCs): A Novel Approach for Cancer Therapy. Int. J. Mol. Sci. 2018, 19, 710. [Google Scholar] [CrossRef]
- Kumari, S.; Sharma, P.; Yadav, S.; Kumar, J.; Vij, A.; Rawat, P.; Kumar, S.; Sinha, C.; Bhattacharya, J.; Srivastava, C.M.; et al. A Novel Synthesis of the Graphene Oxide-Silver (GO-Ag) Nanocomposite for Unique Physiochemical Applications. ACS Omega 2020, 5, 5041–5047. [Google Scholar] [CrossRef]
- Ríos, D.; Valderrama, J.A.; Quiroga, G.; Michea, J.; Salas, F.; Duarte, E.; Venegas-Casanova, E.A.; Jara-Aguilar, R.; Navarro-Retamal, C.; Calderon, P.B.; et al. Antifungal Activity and In Silico Studies on 2-Acylated Benzo- and Naphthohydroquinones. Molecules 2022, 27, 3035. [Google Scholar] [CrossRef]
- Aceituno, V.C.; Ahn, S.; Simu, S.Y.; Wang, C.; Mathiyalagan, R.; Yang, D.C. Silver nanoparticles from Dendropanax morbifera Léveille inhibit cell migration, induce apoptosis, and increase generation of reactive oxygen species in A549 lung cancer cells. Vitr. Cell. Dev. Biol.-Anim. 2016, 52, 1012–1019. [Google Scholar] [CrossRef] [PubMed]
- Liao, K.-H.; Lin, Y.-S.; Macosko, C.W.; Haynes, C.L. Cytotoxicity of Graphene Oxide and Graphene in Human Erythrocytes and Skin Fibroblasts. ACS Appl. Mater. Interfaces 2011, 3, 2607–2615. [Google Scholar] [CrossRef] [PubMed]
- Gurunathan, S.; Han, J.W.; Eppakayala, V.; Kim, J.-H. Green synthesis of graphene and its cytotoxic effects in human breast cancer cells. Int. J. Nanomed. 2013, 8, 1015–1027. [Google Scholar] [CrossRef]
- Anitha, A.; Deepagan, V.; Rani, V.D.; Menon, D.; Nair, S.; Jayakumar, R. Preparation, characterization, in vitro drug release and biological studies of curcumin loaded dextran sulphate–chitosan nanoparticles. Carbohydr. Polym. 2011, 84, 1158–1164. [Google Scholar] [CrossRef]
- Wyllie, A.H. Glucocorticoid-induced thymocyte apoptosis is associated with endogenous endonuclease activation. Nature 1980, 284, 555–556. [Google Scholar] [CrossRef]
- Wyllie, A.; Kerr, J.; Currie, A. Cell Death: The Significance of Apoptosis. Int. Rev. Cytol. 1980, 68, 251–306. [Google Scholar] [CrossRef]
- Sangiliyandi, G.; Yun-Jung, C.; Eunsu, K.; Jae, W.H.; Jin, H.-K.; Jung, H.P.; Deug, N. Reduced graphene oxide-silver nanoparticle nanocomposite: A potential anticancer nanotherapy. Int. J. Nanomed. 2015, 10, 6257–6276. [Google Scholar]
- Tienne, L.G.P.; Candido, L.D.S.; Cruz, B.D.S.M.D.; Gondim, F.F.; Ribeiro, M.P.; Simão, R.A.; Marques, M.D.F.V.; Monteiro, S.N. Reduced graphene oxide synthesized by a new modified Hummer’s method for enhancing thermal and crystallinity properties of Poly(vinylidene fluoride). J. Mater. Res. Technol. 2022, 18, 4871–4893. [Google Scholar] [CrossRef]
- Albers, P.W.; Leich, V.; Ramirez-Cuesta, A.J.; Cheng, Y.; Hönig, J.; Parker, S.F. The characterisation of commercial 2D carbons: Graphene, graphene oxide and reduced graphene oxide. Mater. Adv. 2022, 3, 2810–2826. [Google Scholar] [CrossRef]
- Elbasuney, S.; Yehia, M.; Ismael, S.; Al-Hazmi, N.E.; El-Sayyad, G.S.; Tantawy, H. Potential Impact of Reduced Graphene Oxide Incorporated Metal Oxide Nanocomposites as Antimicrobial, and Antibiofilm Agents Against Pathogenic Microbes: Bacterial Protein Leakage Reaction Mechanism. J. Clust. Sci. 2022, 1–18. [Google Scholar] [CrossRef]
- Zhang, W.; Xu, H.; Xie, F.; Ma, X.; Niu, B.; Chen, M.; Zhang, H.; Zhang, Y.; Long, D. General synthesis of ultrafine metal oxide/reduced graphene oxide nanocomposites for ultrahigh-flux nanofiltration membrane. Nat. Commun. 2022, 13, 471. [Google Scholar] [CrossRef] [PubMed]
- Scaria, J.; Nidheesh, P.V. Magnetite–reduced graphene oxide nanocomposite as an efficient heterogeneous Fenton catalyst for the degradation of tetracycline antibiotics. Environ. Sci. Water Res. Technol. 2022, 8, 1261–1276. [Google Scholar] [CrossRef]
- Rahmani, M.H.; Dehghani, A.; Bahlakeh, G.; Ramezanzadeh, B. Introducing GO-based 2D-platform modified via phytic acid molecules decorated by zeolite imidazole ZIF-9 MOFs for designing multi-functional polymeric anticorrosive system; DFT-D computations and experimental studies. J. Mol. Liq. 2022, 364, 119945. [Google Scholar] [CrossRef]
- Farivar, F.; Yap, P.L.; Karunagaran, R.; Losic, D. Thermogravimetric Analysis (TGA) of Graphene Materials: Effect of Particle Size of Graphene, Graphene Oxide and Graphite on Thermal Parameters. C 2021, 7, 41. [Google Scholar] [CrossRef]
- Choi, E.-Y.; Han, T.H.; Hong, J.; Kim, J.E.; Lee, S.H.; Kim, H.W.; Kim, S.O. Noncovalent functionalization of graphene with end-functional polymers. J. Mater. Chem. 2010, 20, 1907–1912. [Google Scholar] [CrossRef]
- Zhang, Y.; Chen, L.; Xu, Z.; Li, Y.; Zhou, B.; Shan, M.; Wang, Z.; Guo, Q.; Qian, X. Preparing graphene with notched edges and nanopore defects by γ-ray etching of graphite oxide. Mater. Lett. 2012, 89, 226–228. [Google Scholar] [CrossRef]
- Fu, D.; Han, G.; Chang, Y.; Dong, J. The synthesis and properties of ZnO–graphene nano hybrid for photodegradation of organic pollutant in water. Mater. Chem. Phys. 2012, 132, 673–681. [Google Scholar] [CrossRef]
- Hulder, G.W. Magical Mushrooms Mischievous Molds; Princeton University: Princeton, NJ, USA, 1998; Volume 7, p. 7. [Google Scholar]
- Liu, S.; Zeng, T.H.; Hofmann, M.; Burcombe, E.; Wei, J.; Jiang, R.; Kong, J.; Chen, Y. Antibacterial Activity of Graphite, Graphite Oxide, Graphene Oxide, and Reduced Graphene Oxide: Membrane and Oxidative Stress. ACS Nano 2011, 5, 6971–6980. [Google Scholar] [CrossRef]
- Rasooli, I.; Rezaei, M.B.; Allameh, A. Growth inhibition and morphological alterations of Aspergillus niger by essential oils from Thymus eriocalyx and Thymus x-porlock. Food Control 2006, 17, 359–364. [Google Scholar] [CrossRef]
- Soliman, K.; Badeaa, R. Effect of oil extracted from some medicinal plants on different mycotoxigenic fungi. Food Chem. Toxicol. 2002, 40, 1669–1675. [Google Scholar] [CrossRef]
- Schoffelmeer, E.; Klis, F.; Sietsma, J.; Cornelissen, B. The Cell Wall of Fusarium oxysporum. Fungal Genet. Biol. 1999, 27, 275–282. [Google Scholar] [CrossRef] [PubMed]
- He, L.; Liu, Y.; Mustapha, A.; Lin, M. Antifungal activity of zinc oxide nanoparticles against Botrytis cinerea and Penicillium expansum. Microbiol. Res. 2011, 166, 207–215. [Google Scholar] [CrossRef] [PubMed]
- Seonwoo, H.; Choung, H.-W.; Park, S.; Choi, K.S.; Jang, K.-J.; Kim, J.; Lim, K.-T.; Kim, Y.; Garg, P.; Pandey, S.; et al. Reduced graphene oxide-incorporated calcium phosphate cements with pulsed electromagnetic fields for bone regeneration. RSC Adv. 2022, 12, 5557–5570. [Google Scholar] [CrossRef] [PubMed]
- Yaghoubi, F.; Motlagh, N.S.H.; Naghib, S.M.; Haghiralsadat, F.; Jaliani, H.Z.; Moradi, A. A functionalized graphene oxide with improved cytocompatibility for stimuli-responsive co-delivery of curcumin and doxorubicin in cancer treatment. Sci. Rep. 2022, 12, 1959. [Google Scholar] [CrossRef]
- Zhang, J.; Cao, H.-Y.; Wang, J.-Q.; Wu, G.-D.; Wang, L. Graphene Oxide and Reduced Graphene Oxide Exhibit Cardiotoxicity Through the Regulation of Lipid Peroxidation, Oxidative Stress, and Mitochondrial Dysfunction. Front. Cell Dev. Biol. 2021, 9, 616888. [Google Scholar] [CrossRef]


Disclaimer/Publisher’s Note: The statements, opinions and data contained in all publications are solely those of the individual author(s) and contributor(s) and not of MDPI and/or the editor(s). MDPI and/or the editor(s) disclaim responsibility for any injury to people or property resulting from any ideas, methods, instructions or products referred to in the content. |
© 2022 by the authors. Licensee MDPI, Basel, Switzerland. This article is an open access article distributed under the terms and conditions of the Creative Commons Attribution (CC BY) license (https://creativecommons.org/licenses/by/4.0/).
Share and Cite
Vimalanathan, B.; Vijaya, J.J.; Mary, B.C.J.; Mary, R.N.; Km, M.; Jayavel, R.; Abumousa, R.A.; Bououdina, M. The Cytotoxic Effectiveness of Thiourea-Reduced Graphene Oxide on Human Lung Cancer Cells and Fungi. Nanomaterials 2023, 13, 149. https://doi.org/10.3390/nano13010149
Vimalanathan B, Vijaya JJ, Mary BCJ, Mary RN, Km M, Jayavel R, Abumousa RA, Bououdina M. The Cytotoxic Effectiveness of Thiourea-Reduced Graphene Oxide on Human Lung Cancer Cells and Fungi. Nanomaterials. 2023; 13(1):149. https://doi.org/10.3390/nano13010149
Chicago/Turabian StyleVimalanathan, Babu, J. Judith Vijaya, B. Carmel Jeeva Mary, Ruby Nirmala Mary, Mohamed Km, Ramasamy Jayavel, Rasha A. Abumousa, and Mohamed Bououdina. 2023. "The Cytotoxic Effectiveness of Thiourea-Reduced Graphene Oxide on Human Lung Cancer Cells and Fungi" Nanomaterials 13, no. 1: 149. https://doi.org/10.3390/nano13010149
APA StyleVimalanathan, B., Vijaya, J. J., Mary, B. C. J., Mary, R. N., Km, M., Jayavel, R., Abumousa, R. A., & Bououdina, M. (2023). The Cytotoxic Effectiveness of Thiourea-Reduced Graphene Oxide on Human Lung Cancer Cells and Fungi. Nanomaterials, 13(1), 149. https://doi.org/10.3390/nano13010149