Abstract
In this paper, mesoporous CuO with a novel architecture was synthesized through a conventional hydrothermal approach followed by a facile sintering procedure. HR-TEM analysis found that mesoporous CuO with an interconnected pore structure has exposed high-energy crystal planes of (002) and (200). Theoretical calculations indicated that the high-energy crystal planes have superior adsorption capacity for H+ ions, which is critical for the excellent adsorption and remarkable photocatalytic activity of the anionic dye. The adsorption capacity of CuO to methyl orange (MO) at 0.4 g/L was approximately 30% under adsorption equilibrium conditions. We propose a state-changing mechanism to analyze the synergy and mutual restraint relation among the catalyst CuO, H+ ions, dye and H2O2. According to this mechanism, the degradation rate of MO can be elevated 3.5 times only by regulating the MO ratio in three states.
1. Introduction
Efficient and thorough treatment of organic contaminants in wastewater has been a great challenge in the field of environmental protection. For removing dye contaminants in wastewater, one of the green and sustainable technologies is photocatalysis driven by solar energy, in which the photocatalytic reactions occur on the surface of an illuminated semiconductor where photo-generated electrons and holes are formed. Generally, titanium dioxide (TiO2) [1,2,3,4,5] and zinc oxide (ZnO) [6,7,8,9,10] have been undoubtedly demonstrated to be the popular photocatalysts for the oxidative decomposition of many organic compounds under UV irradiation; however, unfortunately, their wide band gaps (~3.2 eV) [10,11] limit further applications in the visible regions (λ > 400 nm).
Cupric oxide (CuO) is a narrow band gap semiconductor (1.2–1.7 eV) that can be considered a promising photocatalyst directly excited by visible light [12,13,14,15]. However, such a narrow band gap easily leads to a rapid recombination of photogenerated electrons and holes, hence resulting in short-lived carriers unless oxidants that can be reduced to other radicals by combining photogenerated electrons are added. Therefore, CuO is employed for the photocatalytic decomposition of organic pollutants, usually in the presence of H2O2 [16,17,18], which is the simplest oxidant that can easily generate hydroxyl radicals (·OH) on self-decomposition over CuO catalysts. Generally, it is commonly agreed that the degradation of organic dyes takes place primarily on and near the catalyst surface [19,20], so we believe that larger surface areas mean better catalytic performance. Based on this opinion, many researchers are focused on developing novel structures and improving the surface areas of the catalysts to further enhance their performance [21,22,23]. In fact, the advanced catalytic activities can mainly result not only from the larger surface areas but also from the more active surface sites of the catalysts [24,25].
In this work, we use a thermodecomposition method to fabricate mesoporous CuO architecture similar to our previous work [26], which is a promising approach to produce mesoporous oxides at a relatively low cost. The process includes a traditional hydrothermal method and a facile sintering procedure. Thin blocks of copper nitrate hydroxide (Cu2(NO3)(OH)3) can be prepared via hydrothermal method. The subsequent sintering procedure would yield an interesting result. This process is similar to that of the formation of pores in bread during the baking procedure. The sintering processtakes advantage of the formation and escape of gases during thermal decomposition, forcing the uniform rearrangement of CuO nanocrystals Finally, a hierarchical copper oxide with interconnected pores can be obtained, which demonstrates excellent adsorption capacity and high photocatalystic activity for methyl orange (MO).
Herein, it is more noteworthy that a peculiar dye release phenomenon was observed after the adsorption–desorption equilibrium of MO that has not attracted the attention of other researchers thus far. The simulation results show that the exposed polar surface of the CuO crystal has a large surface energy and excellent adsorption ability for H+ ions. We proposed a state-changing mechanism and analyzed the adsorption, desorption and photocatalytic degradation of MO on the CuO surface. The change in the MO state (from State I to State II) caused by the temporary consumption of H+ ions is a key factor leading to the noteworthy release of MO molecules from the CuO surface. Based on this mechanism, the degradation rate can be increased 3.5 times by adjusting the proportion of MO in the three states.
2. Experimental
2.1. Materials
Methyl orange was purchased from Shanghai Aladdin Bio-Chem Technology Co., Ltd. Hydrogen peroxide (30%) was supplied by Tianjin Tianli Chemical Reagent Co., Ltd. (China). Copper nitrate (Cu(NO3)2·3H2O), urea (CO(NH2)2) and all other reagents were supplied by Sinopharm Chemical Reagent Co., Ltd. (China).
2.2. Synthesis of Mesoporous CuO
Mesoporous CuO architecture was synthesized using a conventional hydrothermal approach followed by a facile sintering procedure. First, Cu2(NO3)(OH)3 with perfect crystallinity was obtained via the hydrothermal method. In a typical procedure, 1.208 g Cu(NO3)2·3H2O and 0.300 g CO(NH2)2 were dissolved in 50 ml of distilled water. After stirring for 10 min, the whole homogeneous mixture was then transferred into a 100 mL Teflon-lined stainless steel autoclave and incubated at 120 °C for 5 hours. After the hydrothermal reaction, the as-formed precipitate was centrifuged, washed with deionized water and dried at 70 °C to obtain green powders as an initial product of Cu2(NO3)(OH)3. Second, initial products of Cu2(NO3)(OH)3 were further calcined in air at 400 °C for 1 hour to obtain mesoporous CuO.
2.3. Characterization
The crystalline structures and morphologies of the as-prepared samples were characterized by using an X-ray diffractometer (XRD, Bruker D8 Advance, Germany) with Cu Kα rays (λ = 1.5406 Å) and scanning electron microscopy (SEM, HITACH SU8010, Japan). High-resolution images and electron diffraction patterns of the samples were obtained via transmission electron microscopy (TEM, JEM-2100HR, Japan). The surface area of the mesoporous CuO was measured using Brunauer–Emmett–Teller (BET, TristarⅡ3020, America).
The optical properties of CuO and the concentration of MO aqueous solution were analyzed using a UV–Vis spectrophotometer (UV2600, Japan). The adsorption of MO molecules on the CuO surface was detected using a Fourier transform infrared spectrophotometer (FT-IR, Nicolet 6700, America).
2.4. Computational Details
All calculations were based on density functional theory (DFT), using the Vienna ab initio Simulation Package (VASP) code [27]. The exchange and correlation terms were described using the general gradient approximation (GGA) in the scheme of Perdew–Burke–Ernzerhof (PBE) [28]. Core electrons were described by pseudopotentials generated from the projector augmented wave method [29], and valence electrons were expanded in a plane-wave basis set with an energy cutoff of 490 eV. The Monkhorst–Pack k-points grid [30] of 8×10×8 was used for structure relaxation. Both the positions of all ions and the unit cell parameters were relaxed to minimize the atomic forces and the total energy with a force convergence < 0.01 eV/Å. The calculated equilibrium lattice constants, a = 4.63 Å, b = 3.45 Å, c = 5.11 Å, α = γ= 90°, and β = 99.04°, compared well with the experimental values. The slab model was used to simulate the surfaces of CuO, where the slabs were separated by a vacuum region of 15 Å in the z direction. The adsorption energy was defined as: Ead = Eall − Esurface − EH, where Eall and Esurface are the energies for adsorption configurations and surfaces, respectively, and EH is the energy of an isolated H atom.
2.5. Adsorption Property
To evaluate the adsorption property of mesoporous CuO, a series of experiments were performed in MO solutions with different pH values. After adding CuO powder (10 mg) to MO solution (25 ml, 10 mg/L) and fully adsorbing in the dark, each adsorption spectra of MO solution was measured.
The adsorption capacity (%) was calculated according to the following formula
where A0 and Aads are the initial and saturated absorbances of the MO solution at 464 nm, respectively.
In particular, for the initial acidic MO solution (pH < 3.1), the position of the maximum absorption peak appears at 505 nm. However, when CuO was added, the maximum absorption peak of the adsorbed saturated MO solution would return to 464 nm due to the strong adsorption ability of CuO on H+ ions. Therefore, in this paper, the absorbance of the neutral solution was chosen as A0, which had the same concentration with the initial acidic MO solution.
2.6. Photocatalytic Activity
The photocatalytic activity of mesoporous CuO was evaluated through the degradation of MO under a tungsten lamp. In a typical experiment, as-prepared CuO samples (40 mg) were divided into two equal parts, and each sample was dispersed in MO solution (10 mg/L, 50 ml) with initial pH values of 2.5 and 7.0. Before photocatalysis, 1 mL H2O2 (5%) was added to the MO solution, and then the mixture was stirred by magnetic stirring immediately and exposed to a 200 W tungsten lamp with a light intensity of 10 mW/cm2 at the surface of the dye solution. At a given time interval, approximately 4 ml of the mixture was removed and immediately centrifuged. The corresponding absorption spectra were determined using UV–visible absorption spectroscopy.
The absorbance value of 464 nm was selected to calculate the degradation efficiency and removal rate of MO in the solution. The removal rate of MO was calculated as follows: removal rate (%) = (C0 − Ct)/C0 × 100%, where C0 and Ct represent the concentration of MO at the reaction carried out at 0 and t times, respectively.
3. Results and Discussion
3.1. Structural Characteristics Analysis
Figure 1 shows the XRD patterns of the as-prepared samples. It can be seen from Figure 1a that the sample obtained from the first procedure has fine crystallinity, and all diffraction peaks were good with the monoclinic single crystal Cu2(NO3)(OH)3 (PDF# 54-0747) index. In Figure 1b, the calcined sample has sharp characteristic peaks at 35.6°, 38.7° and 38.9°, which are indexed to the (002), (111) and (200) lattice planes of monoclinic CuO, respectively. No characteristic peaks of Cu2(NO3)(OH)3 are observed, indicating complete conversion to CuO after the secondary calcination procedure as the following reaction.
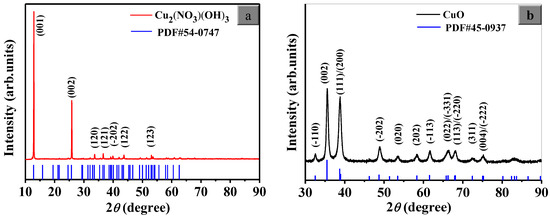
Figure 1.
XRD patterns of (a) Cu2(NO3)(OH)3 and (b) CuO.
In addition, since it is known from the reaction that heating promotes the decomposition of Cu2(NO3)(OH)3 into NO2, O2 and H2O(g) gasses, we can infer that the following sintering procedure yields interesting results. Because of the formation and the escape of these gasses, which act as templates, the crystalline particles of CuO may be forced to rearrange consistently, and many pores will be left in the internal crystal. This inference can be confirmed by the following SEM images and TEM images shown in Figure 2. Obviously, the surface is very smooth as well as the interior (marked as red circle in Figure 2a) for Cu2(NO3)(OH)3 samples, while a large number of pores are present on the surface of the calcined samples (Figure 2b). After calcination, the morphology of the sample remained largely unchanged except for the formation of pores, which were not only on the surface but also on the inside of the CuO sample (Figure 2c), with an average pore size of approximately 20–30 nm. Figure 2d shows the N2 adsorption–desorption isotherm and the BJH pore size distribution plots (inset) of porous CuO samples, with a BET surface area value of 15.28 m2/g and a BJH desorption average pore width of 25.58 nm. The size of 25.58 nm indicates that the material we prepared belongs to the mesoporous structure. The high specific surface area of 15.28 m2/g may lead to more surface active sites, which facilitate the adsorption of dye molecules in solution. Therefore, the porous nanostructure of the catalyst may provide more accessible surface areas to increase the active reaction sites, which facilitate their application in catalysts.
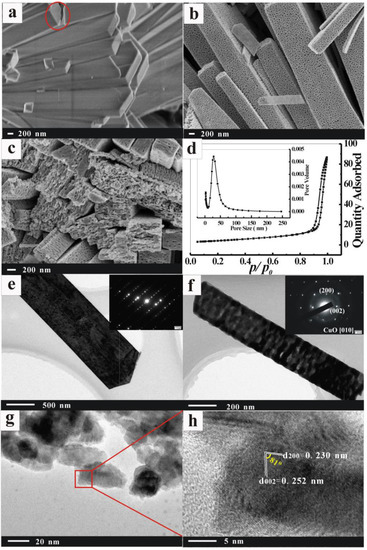
Figure 2.
FESEM images of (a) Cu2(NO3)(OH)3 and (b,c) CuO. (d) The N2 adsorption–desorption isotherm together with the BJH pore size distribution plots (inset) of CuO sample. TEM images and SAED patterns (inset) of (e) Cu2(NO3)(OH)3 and (f) CuO. (g,h) HR-TEM images of CuO.
Figure 2e–h present the TEM images, selected area electron diffraction (SAED) patterns and high-resolution transmission electron microscopy (HR-TEM) images of the prepared samples. Clearly, typical mesoporous features are observed in sintered samples, while perfect monocrystalline architecture is observed in nonsintered samples. Furthermore, as shown in Figure 2f, the orientation of all crystal particles in the sintered sample is similar, indicating that the arrangement of crystal particles during sintering is consistent. The SAED patterns (insert in Figure 2f) are very consistent with the results in Figure 2f. The HR-TEM image in Figure 2h shows the CuO crystalline lattice fringes with interplanar spacings of 0.252 nm and 0.230 nm, corresponding to the (002) and (200) facets of monocline CuO, respectively. Of particular note is the interfacial angle of 81° indicated in Figure 2h, which is the same as the theoretical value of the angle between (002) and (200) (81.2°), indicating that the as-prepared CuO samples expose (002) and (200) high-energy crystal surfaces. This preferred orientation is of particular interest, as high-energy facets may possess superior adsorption properties.
3.2. The Adsorption Capability of Mesoporous CuO
According to the literature [31,32,33,34], the acidity of the system has a significant effect on the degradation of MO. In other words, H+ ions can alter the surface properties of catalysts or participate in degradation reactions [35]. To better understand the role of H+ ions during the catalytic process, the adsorption of H+ ions on the surface of CuO was studied using first-principles calculations. The calculated results are summarized in Table 1, and the typical calculation models are shown in Figure 3.

Table 1.
The adsorption energy obtained using the first-principles calculation.
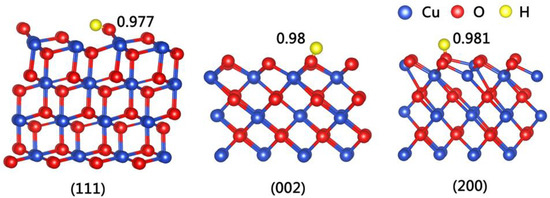
Figure 3.
The geometric structures of H atom on various surfaces of CuO crystal.
It is evident that the exposed polar surfaces of CuO crystals, such as (200) and (002), have high surface energy and superior adsorption capacity to H+ ions. We know that MO is a polar molecule that exists in solution in the form of anionic salts. It is generally accepted that the catalytic process is mainly related to the adsorption and desorption of MO molecules on the surface of the catalyst [36,37]. Thus, a high adsorption capacity of MO on the catalyst surface is conducive to improving the efficiency of photocatalytic degradation. Therefore, it can be inferred that the concentration of H+ ions on the surface plays an important role in the adsorption of MO and directly determines the adsorption capacity of MO.
To investigate the effect of initial pH on MO adsorption, a series of experiments were performed under the same conditions (50 ml solution containing 20 mg CuO and 10 mg/L MO), in addition to pH value differences (pH = 2–11). The point of zero charge (pHpzc) on the surface of CuO is reported [38,39,40] at 7.4–7.8; that is, when the pH value < pHpzc, the adsorption point on the surface of CuO is positively charged. This will facilitate the electrostatic adsorption of anionic molecules on the surface of CuO. As shown in Figure 4, the adsorption of MO on the surface of CuO strongly depended on the pH values, and clearly, the acidic solution is a benefit for its adsorption. The adsorption capacity (%) reached a maximum of 29.46% at pH = 2.5 while there were much lower values in basic (pH = 7.0, 2.83%) or alkaline solutions. XRD, TEM and theoretical analysis confirm that the crystal planes (200) and crystal planes (002) with large adsorption energy H+ ions are exposed, causing the adsorption of H+ on the mesoporous copper oxide surface.
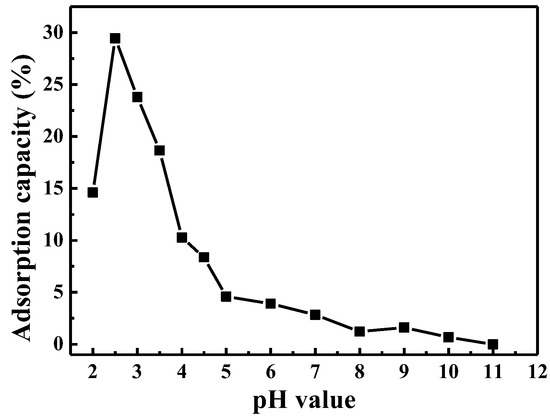
Figure 4.
Effect of initial pH value on the adsorption of MO (MO: 10 mg/L, 50 mL; CuO: 20 mg).
In our study, the adsorption behavior of H+ ions on the CuO surfaces was also evidenced by experimental phenomena. As shown in Figure 5, the position of the maximum adsorption peaks varies with the color of the solution. It is well known that the structural change of MO can cause color changes in the solution, and the acidity of the solution is one of the major contributors (MO is mainly in the red quinine structure when pH < 3.1 and in the yellow azo structure when pH > 4.4). Clearly, once CuO powders are added to an acidic MO solution (pH = 2.5), the color of the solution changes from red to yellow, and the pH value changes from 2.5 to 5.2 correspondingly.
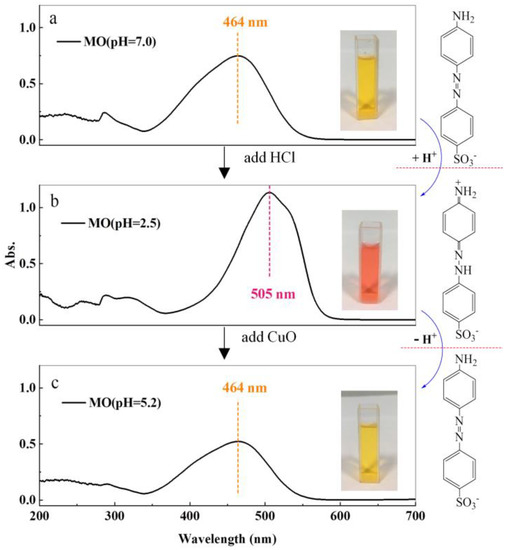
Figure 5.
Changes of maximum adsorption peak and color in MO solution and evolution of MO molecular structure under H+ ions. (a) MO solution with pH = 7.0. (b) MO solution with pH = 2.5. (c) The results of MO supernatant after H+ adsorption on CuO surface.
Based on the above results, in acidic systems, the surfaces of CuO should be positively charged due to the adsorption of a large amount of H+ ions (here named CuO(H) surfaces), which further leads to the electrostatic adsorption of MO (anionic dyes) onto the CuO(H) surfaces. In alkaline conditions, there are fewer H+ ions for CuO trapping and tiny amounts of MO are adsorbed on the surface of CuO. In addition, the adsorption capacity of MO increases with decreasing pH and increases dramatically under acidic conditions, as shown in Figure 4. The adsorption of MO on the surface of copper oxide is further illustrated by infrared spectroscopy (Figure S1). Notably, when the pH is below 2.5, the dissolution of CuO must be considered due to the strong acidity of the system. Based on these results, MO solution with pH = 2.5 was selected as the study group, and pH = 7.0 was selected as the comparison group.
3.3. The Roles of H+ Ions and H2O2
The adsorption and degradation of MO on the surface of copper oxide are analyzed in pH = 7.0 and pH = 2.5 systems. As shown in Figure 6, Figure 6A,B refer to the adsorption equilibrium processes of MO on the CuO surfaces in pH = 7.0 and pH = 2.5 systems, respectively. Figure 6C represents the process of adding 5% H2O2 (1 mL) after CuO + MO solution (pH = 2.5) reaches the adsorption–desorption equilibrium.
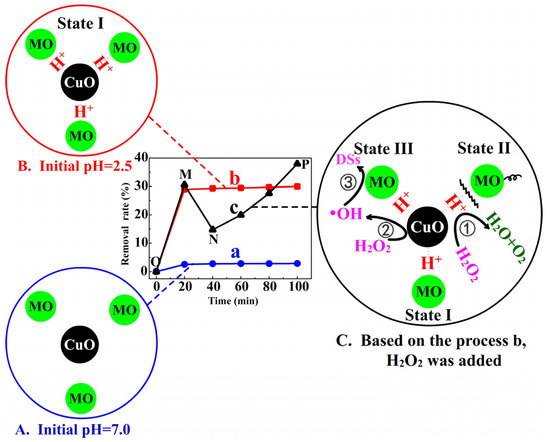
Figure 6.
The state-changing schematic diagram of MO molecules on the catalyst surface in MO + CuO + H2O2 system. (A) CuO + neutral MO solution. (B) CuO + MO solution (pH = 2.5). (C) When CuO + MO solution (pH = 2.5) reached adsorption–desorption equilibrium, H2O2 was added. (MO: 10 mg/L, 50 mL; CuO: 20 mg; H2O2: 5%, 1 mL).
In Figure 6A with the solution pH = 7.0, only a small amount of H+ ions can be adsorbed by CuO, and correspondingly, a very small amount of MO molecules were adsorbed on the surface of CuO through electrostatic adsorption. Therefore, the removal rate (%) of MO in the solution of this system was only 2.83% (according to curve a), and the vast majority of MO molecules are distributed in the solution.
In Figure 6B with an initial pH = 2.5, a large number of H+ ions were adsorbed on the CuO surface. Subsequently, the anionic MO molecules are well adsorbed by electrostatic attraction. After 20 min, the removal rate (%) reached a saturation value of 29.46% (according to curve b).
However, in Figure 6C, when H2O2 was added (point M in curve c) to the adsorption-saturated system B, the removal rate (%) dropped rapidly to 14.75% within 20 min after the addition ( process in curve c) and then increased gradually ( process).
We propose a state-changing mechanism of MO to explain the above experimental results. In system C, three states of MO should be presented simultaneously on or near the CuO surface, and we mark them as State I, State II and State III. Here, State I represents the simple absorbed MO molecules on the CuO surfaces by electrostatic adsorption, and States II and III are the MO molecules that are changed from State I due to the addition of H2O2. The relevant reactions that occurred on the CuO surfaces during the process can be expressed as follows:
- reaction ①:
- reaction ②
- reaction ③
where the subscript CuO represents the corresponding component adsorbed on the CuO surface. According to Equation (3), H+(CuO) ions are despoiled by H2O2(CuO) molecules from the surfaces of CuO resulting in a decrease in the H+(CuO) concentration, which leads to the vast release of MO from the CuO surfaces due to the weakening of electrostatic adsorption to form desorbed MO (State II). Although H+ ions are reproduced in reaction ① in Figure 6C, the process of MO readsorption to State I is slower than that of MO release. Meanwhile, plenty of gasses can be observed as soon as H2O2 is added to the system, and we believe that H2O2 molecules are decomposed with the help of H+(CuO) ions and Cu2+/Cu+ [41,42]. The catalytic decomposition of H2O2(CuO) can generate ·OH (or ·OOH and ·O2− ) radicals [43,44,45,46] (Equation (4), Fenton-like reaction), which can further degrade MO(CuO) molecules into degradation species (DSs) (Equation (5)). Here, we define these degraded MO(CuO) molecules as State III.
In our study, as shown in curve c in Figure 6, MO(CuO) molecules are presented only as State I during the process, while the addition of H2O2 changes this situation, and they are presented as three kinds of states. For the process of curve c, the existence states of MO are dominated mainly by State II, which leads to a declining removal rate (%), and the adsorption (State I) and release (State II) of MO(CuO) reach equilibrium again at the N point. The degradation of MO(CuO) molecules acting as State III mainly occurs in the following process ().
Clearly, H+ ions play a key role in the adsorption/desorption of MO. The emergence of MO(CuO) molecules as State I achieved with H+ ions is necessary for the following degradation reaction. In essence, however, MO(CuO) molecules as State III are the targets for effective degradation in the presence of the H2O2 system. Concurrently, the addition of H2O2 will also consume H+(CuO) ions, causing the release of MO(CuO), that is, resulting in the appearance of MO molecules as State II. The locations of the degradation reaction (reactions ② and ③ in Figure 6C) are the effective adsorption positions of mesoporous CuO.
3.4. The Optical Properties of CuO
To confirm the absorption of CuO in the visible range, the obtained samples were tested using UV diffuse reflectance spectroscopy. Figure 7 shows the UV–Vis absorption spectra of mesoporous CuO. It can be seen from the results that CuO has good absorption in the visible region. The optical band gap of mesoporous copper oxide is estimated to be 1.39 eV by extrapolation from the linear part of the Tauc curve.
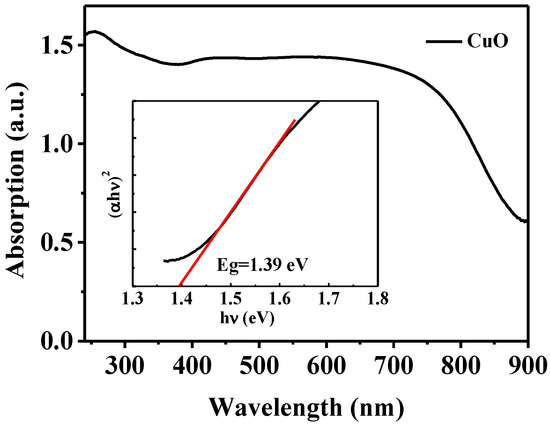
Figure 7.
The UV–Vis absorption spectra and Tauc plot of mesoporous CuO.
3.5. Photocatalytic Degradation of MO
As illuminated above, H+ ions play a key role in the adsorption process. High adsorption of MO on the CuO surfaces is conducive to improving the efficiency of photocatalytic degradation. Additionally, the addition time of H2O2 is important, which will cause the state changing of MO molecules on the CuO surfaces.
To test the roles of H+ and H2O2, we designed two series of catalytic degradation experiments with two different ways of H2O2 addition. The first series is the orderly addition of CuO and H2O2 in the pH = 2.5 and pH = 7.0 systems, in which H2O2 is added after the saturated adsorption of MO on the CuO surfaces, and the second series is that CuO and H2O2 are added simultaneously in the pH = 2.5 and pH = 7.0 systems under light irradiation.
Figure 8a shows that the C/C0 decreased to a value of 0.72 in the first 20 min when only CuO was added to the pH = 2.5 system. However, it increased noticeably and rapidly with the addition of H2O2 due to State II formation. During the second 20 min (), the quantity of State I decreased and that of State II increased gradually, and they reached an equilibrium state at the A1 point. Thereafter, the C/C0 decreased gradually owing to the main degradation of State III. In the pH = 7.0 system, C/C0 decreased slightly during the initial 40 min (), which is in deep contrast with that of the pH = 2.5 system. This is because the concentration of H+ ions is too low in the pH = 7.0 system, which results in a very small proportion of the generation of State II. Therefore, State III plays a direct role in the reduction of C/C0 during the process for the pH = 7.0 system.
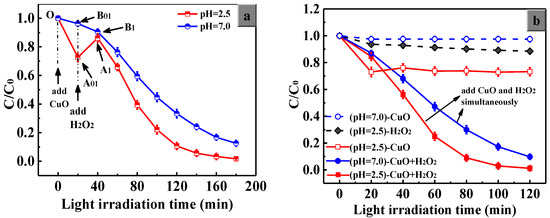
Figure 8.
The catalytic performance of the porous CuO powders in the degradation of MO with different initial pH values: CuO and H2O2 were added (a) orderly, (b) simultaneously under light irradiation.
Figure 8b shows the results of the simultaneous addition of CuO and H2O2 under light. When CuO or H2O2 was added alone, the system reached adsorption saturation or indicated a low degradation efficiency. However, when CuO and H2O2 are added at the same time, there is a synergistic effect between them, and finally the MO in the solution can be degraded continuously and rapidly. Since the release and readsorption process of MO molecules did not occur in Figure 8b, the C/C0 value decreased quickly over time.
The kinetics of MO degradation in the presence of CuO and H2O2 under the same ambient conditions were studied. To better analyze the difference between the two ways of adding H2O2, the results of the two experiments and their first-order kinetics in the degradation of MO with different pH values were compared, as shown in Figure 9. The kinetic expression can be presented as follows [47]:
where C0 is the initial concentration of the MO and Ct is the concentration at a given reaction time.
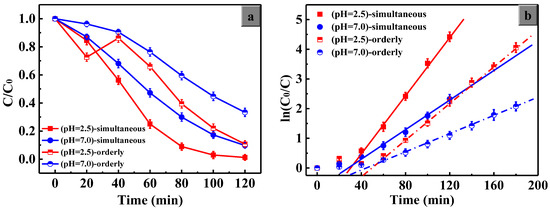
Figure 9.
The comparison of catalytic behaviors for CuO under light irradiation with different ways of adding H2O2. (a) C/C0 of MO vs. time; (b) first-order kinetic plot of ln(C0/C) vs. time.
The apparent first-order rate constant, can be determined from Langmuir–Hinshelwood kinetics at low initial dye concentrations, where K is the adsorption equilibrium constant of the dye and its intermediates and k is the reaction rate constant. In the linear fitting, one thing to note is that the initial data points are not considered within the data range of the linear fitting, because their adsorption states have not reached adsorption equilibrium. The plot shows an excellent linear correlation, suggesting that the degradation reaction of MO follows first-order kinetics. The parameters of the linear fitting are given in Table 2.
Table 2.
The parameters of the linear fitting in Figure 9b.
Based on our state-changing mechanism of MO and the results shown in Figure 8 and Figure 9, the adsorption and degradation of MO on the CuO catalyst with the help of H+ ions and H2O2 can be understood as follows:
3.5.1. The Synergistic Effect of H2O2 and CuO
Figure 8b indicates that few MO molecules were degraded when only H2O2 was added, and a simple adsorption process of MO can occur on the CuO surfaces (State I) when only CuO powders are added. MO molecules can be degraded efficiently only when H2O2 and CuO powders are both present in the system. Some research [48,49,50] found that the acidic system had an obvious advantage for enhancing the degradation efficiency. However, there are few detailed explanations for this synergistic effect of H2O2 and CuO in the acidic system. In our study, we propose the state-changing mechanism to explain this phenomenon well.
3.5.2. The Positive Effect of H+ Ions on the Catalytic Behavior of CuO
Clearly, the degradation efficiency in the pH = 2.5 system is significantly superior to that in the pH = 7.0 system due to the violent adsorption of H+ ions on the CuO surface, which promotes the effective adsorption of MO molecules on the CuO surface by electrostatic interactions. The high effective adsorption means more active surface sites of porous CuO, which contribute to the degradation of the MO molecules. Additionally, during the process shown in Figure 8a, the added H2O2 despoils H+ ions on the CuO surface, causing the release of MO molecules (State II), which results in the disturbance of the electrostatic adsorption equilibrium between MO and CuO. It takes at least 20 min to achieve a new adsorption equilibrium of MO molecules between State I and State II.
3.5.3. The Advantage of Simultaneous Addition of CuO and H2O2
In the pH = 2.5 system, it is obvious that the two ways of adding H2O2 influence the catalytic behaviors of CuO. It can be seen from Figure 8a,b that it took 180 min for the degradation efficiency to exceed 98% for orderly addition (Figure 8a) and only 120 min for simultaneous addition (Figure 8b). Similar results can be observed in the pH = 7.0 system.
The apparent rate constant can also reflect the catalytic performance of materials directly. As shown in Figure 9b and Table 2, in the pH = 2.5 system, the kapp value is 4.9 × 10⁻² under the simultaneous addition condition; however, it is only 3.0 × 10⁻² under the orderly addition condition. For the pH = 7.0 system, the kapp values are 2.4 × 10⁻² and 1.4 × 10⁻², respectively. All the data indicate that the simultaneous addition of H2O2 and CuO into the MO acidic solution is helpful for photocatalytic degradation. The data show that the reaction rate of degradation can be improved by approximately 1.7 times only by changing the ways of adding H2O2.
Comparing the results of group (pH = 2.5)-simultaneous and group (pH = 7.0)-orderly, the kapp value is elevated 3.5 times only by regulating the proportion of MO in the three states. Based on our state-changing mechanism, we believe that the different proportions of the three states of MO are the main reasons for the difference in the degradation process.
In the case of orderly addition in acidic solution, based on Equation (3), a large amount of H2O2 is consumed due to the mass adsorption of MO before H2O2 is added, thus decreasing the generation rate of State III with the decreased amount of H2O2. However, the simultaneous addition may effectively improve the situations of State I and State II, which can greatly improve the catalytic activity of CuO.
3.6. The Stability and Reusability of CuO
In addition to high catalytic activity, the catalyst must also have excellent stability and reusability in successive applications. Mesoporous CuO was investigated for MO degradation by performing recycling experiments under the same conditions. As shown in Figure 10, only a slight decrease in the catalytic activity is observed after 4 consecutive cycles, which illustrates the high durability of the catalyst under visible light.
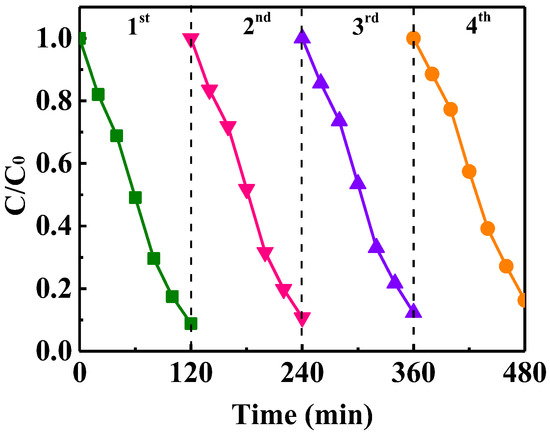
Figure 10.
Consecutive runs of the catalytic activity of mesoporous CuO for MO degradation.
3.7. Photocatalytic Mechanism
The band structure and band potentials of the photocatalyst have a great influence on photocatalytic performance. The positions of the conduction band (ECB) and valence band (EVB) are estimated using empirical formulas [51]:
where χ is the geometric mean of the absolute electronegativity of the constituent atoms. For CuO, χ is 5.812 eV. Ee (approximately 4.5 eV) is the energy of free electrons on the hydrogen scale. Eg is the energy band-gap, which was estimated to be 1.39 eV according to the UV–Vis spectra. Therefore, ECB and EVB are 0.62 and 2.01 (eV vs. NHE) for CuO, respectively.
Based on the above analysis, the band-gap structure of CuO and a photocatalytic mechanism are illustrated in Figure 11. Under light irradiation, the photogenerated electrons can be excited from the VB to the CB, and the holes with strong oxidation remain in the VB. The MO molecules adsorbed on the surface of CuO would be oxidized into CO2 and H2O by the holes in the VB. H2O2 could also be oxidized to ·O2−. On the other hand, H2O2 can trap electrons in the CB and ·OH would be formed. In addition, the redox chain reaction between Cu2+/Cu+ and H2O2 can produce H2O, O2 and ·OH. Since the CB position of CuO is 0.62 eV, which is lower than that of O2/·O2− (−0.046 eV vs. NHE), photo-generated electrons on the CB cannot reduce O2 to ·O2−. Finally, OH and ·O2− produced from H2O2 and photogenerated holes in the VB can degrade MO molecules into CO2 and H2O.
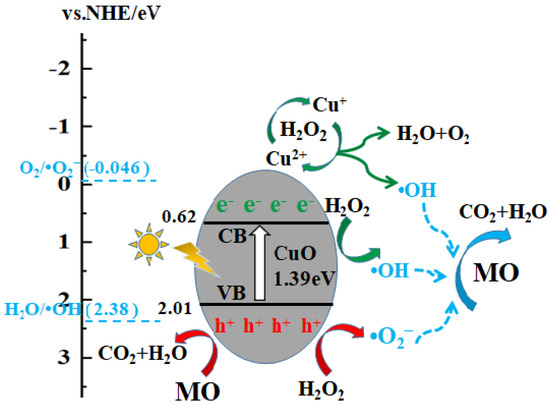
Figure 11.
Band-gap structure of CuO and photocatalytic mechanism.
4. Conclusions
In our current work, mesoporous CuO with novel architecture was obtained using a conventional hydrothermal approach followed by a facile sintering procedure. Mesoporous CuO has a strong adsorption capacity for methyl orange under acidic conditions. We propose a state-changing mechanism to analyze the adsorption/desorption of MO on the CuO surface under the action of H+ ions and H2O2. The reaction rate of degradation was elevated 3.5 times by regulating the proportion of MO in the three states. In addition, degradation experiments show that mesoporous CuO exhibits excellent photocatalytic activity and high durability under visible light.
Supplementary Materials
The following supporting information can be downloaded at: https://www.mdpi.com/article/10.3390/nano13010142/s1, Figure S1: (a) Comparison of infrared spectra of CuO before and after MO adsorption. (b) and (c) Local enlarged views of the blue and red dotted areas in Figure (a). “fresh CuO” represents the original CuO sample. “CuO-MO”represents CuO powder adsorbed a certain amount of MO molecules. “used CuO”represents the CuO powder after the complete photocatalytic degradation of surface MO.
Author Contributions
Conceptualization, J.N. and J.L.; methodology, J.N.; software, Z.W.; validation, L.H. and H.Z.; formal analysis, H.Y. (Huiyu Yang); investigation, F.H.; resources, H.L.and C.G.; data curation, J.N.; writing—original draft preparation, J.N.; writing—review and editing, C.G.; visualization, J.L.; supervision, H.Y. (Haiyang Yang); project administration, T.Q.; funding acquisition, J.N.and H.L. All authors have read and agreed to the published version of the manuscript.
Funding
This research was funded by Xiaogan Natural Science Project, grant number XGKJ2021010008. The APC was funded by Doctoral Research Initiation Fund of Hubei Engineering University.
Data Availability Statement
Data sharing is not applicable to this article.
Acknowledgments
We thank Liu Yuliang for his help and discussion on TEM testing. We also thank Binlin Chen and Huixin Wang for their participation in this study.
Conflicts of Interest
The authors declare no conflict of interest.
References
- Ochiai, T.; Fujishima, A. Photoelectrochemical Properties of TiO2 Photocatalyst and Its Applications for Environmental Purification. J. Photochem. Photobiol. C-Photochem. Rev. 2012, 13, 247–262. [Google Scholar] [CrossRef]
- Al-Mamun, M.R.; Kader, S.; Islam, M.S.; Khan, M.Z.H. Photocatalytic Activity Improvement and Application of UV-TiO2 Photocatalysis in Textile Wastewater Treatment: A Review. J. Environ. Chem. Eng. 2019, 7, 103248. [Google Scholar] [CrossRef]
- Wang, C.-C.; Wang, X.; Liu, W. The Synthesis Strategies and Photocatalytic Performances of TiO2/MOFs Composites: A State-of-the-Art Review. Chem. Eng. J. 2020, 391, 123601. [Google Scholar] [CrossRef]
- Yang, X.; Chen, Z.; Zhao, W.; Liu, C.; Qian, X.; Zhang, M.; Wei, G.; Khan, E.; Ng, Y.H.; Ok, Y.S. Recent Advances in Photodegradation of Antibiotic Residues in Water. Chem. Eng. J. 2021, 405, 126806. [Google Scholar] [CrossRef]
- Qi, K.; Cheng, B.; Yu, J.; Ho, W. A Review on TiO2-Based Z-Scheme Photocatalysts. Chin. J. Catal. 2017, 38, 1936–1955. [Google Scholar] [CrossRef]
- Anwer, H.; Mahmood, A.; Lee, J.; Kim, K.-H.; Park, J.-W.; Yip, A.C.K. Photocatalysts for Degradation of Dyes in Industrial Effluents: Opportunities and Challenges. Nano Res. 2019, 12, 955–972. [Google Scholar] [CrossRef]
- Saad, A.M.; Abukhadra, M.R.; Abdel-Kader Ahmed, S.; Elzanaty, A.M.; Mady, A.H.; Betiha, M.A.; Shim, J.-J.; Rabie, A.M. Photocatalytic Degradation of Malachite Green Dye Using Chitosan Supported ZnO and Ce–ZnO Nano-Flowers under Visible Light. J. Environ. Manag. 2020, 258, 110043. [Google Scholar] [CrossRef]
- Smaali, A.; Berkani, M.; Merouane, F.; Le, V.T.; Vasseghian, Y.; Rahim, N.; Kouachi, M. Photocatalytic-Persulfate- Oxidation for Diclofenac Removal from Aqueous Solutions: Modeling, Optimization and Biotoxicity Test Assessment. Chemosphere 2021, 266, 129158. [Google Scholar] [CrossRef]
- Karimi-Maleh, H.; Kumar, B.G.; Rajendran, S.; Qin, J.; Vadivel, S.; Durgalakshmi, D.; Gracia, F.; Soto-Moscoso, M.; Orooji, Y.; Karimi, F. Tuning of Metal Oxides Photocatalytic Performance Using Ag Nanoparticles Integration. J. Mol. Liq. 2020, 314, 113588. [Google Scholar] [CrossRef]
- Moussa, H.; Girot, E.; Mozet, K.; Alem, H.; Medjahdi, G.; Schneider, R. ZnO Rods/Reduced Graphene Oxide Composites Prepared via a Solvothermal Reaction for Efficient Sunlight-Driven Photocatalysis. Appl. Catal. B Environ. 2016, 185, 11–21. [Google Scholar] [CrossRef]
- Nolan, M.; Iwaszuk, A.; Lucid, A.K.; Carey, J.J.; Fronzi, M. Design of Novel Visible Light Active Photocatalyst Materials: Surface Modified TiO2. Adv. Mater. 2016, 28, 5425–5446. [Google Scholar] [CrossRef] [PubMed]
- Wang, L.; Zhou, Q.; Zhang, G.; Liang, Y.; Wang, B.; Zhang, W.; Lei, B.; Wang, W. A Facile Room Temperature Solution-Phase Route to Synthesize CuO Nanowires with Enhanced Photocatalytic Performance. Mater. Lett. 2012, 74, 217–219. [Google Scholar] [CrossRef]
- Novikova, A.A.; Moiseeva, D.Y.; Karyukov, E.V.; Kalinichenko, A.A. Facile Preparation Photocatalytically Active CuO Plate-like Nanoparticles from Brochantite. Mater. Lett. 2016, 167, 165–169. [Google Scholar] [CrossRef]
- Kuz’menko, A.B.; van der Marel, D.; van Bentum, P.J.M.; Tishchenko, E.A.; Presura, C.; Bush, A.A. Infrared Spectroscopic Study of CuO: Signatures of Strong Spin-Phonon Interaction and Structural Distortion. Phys. Rev. B 2001, 63, 094303. [Google Scholar] [CrossRef]
- Siavash Moakhar, R.; Hosseini-Hosseinabad, S.M.; Masudy-Panah, S.; Seza, A.; Jalali, M.; Fallah-Arani, H.; Dabir, F.; Gholipour, S.; Abdi, Y.; Bagheri-Hariri, M.; et al. Photoelectrochemical Water-Splitting Using CuO-Based Electrodes for Hydrogen Production: A Review. Adv. Mater. 2021, 33, 2007285. [Google Scholar] [CrossRef]
- Sharma, K.; Raizada, P.; Hosseini-Bandegharaei, A.; Thakur, P.; Kumar, R.; Thakur, V.K.; Nguyen, V.-H.; Singh, P. Fabrication of Efficient CuO/Graphitic Carbon Nitride Based Heterogeneous Photo-Fenton like Catalyst for Degradation of 2, 4 Dimethyl Phenol. Process Saf. Environ. Protect. 2020, 142, 63–75. [Google Scholar] [CrossRef]
- Zhu, G.; Jin, Y.; Ge, M. Simple Preparation of a CuO@gamma-Al2O3 Fenton-like Catalyst and Its Photocatalytic Degradation Function. Environ. Sci. Pollut. Res. 2022, 29, 68636–68651. [Google Scholar] [CrossRef]
- Sohrabnezhad, S.; Takas, M.E. Synthesis and Characterization of Porous Clay Heterostructure Intercalated with CuO Nanoparticles as a Visible Light-Driven Photocatalyst. J. Iran. Chem. Soc. 2019, 16, 45–55. [Google Scholar] [CrossRef]
- Zhang, G.; Zhang, X.; Meng, Y.; Pan, G.; Ni, Z.; Xia, S. Layered Double Hydroxides-Based Photocatalysts and Visible-Light Driven Photodegradation of Organic Pollutants: A Review. Chem. Eng. J. 2020, 392, 123684. [Google Scholar] [CrossRef]
- Kormann, C.; Bahnemann, D.W.; Hoffmann, M.R. Photolysis of Chloroform and Other Organic Molecules in Aqueous TiO Sub 2 Suspensions. Environ. Sci. Technol. (USA) 1991, 25, 3. [Google Scholar] [CrossRef]
- Cao, F.; Wang, T.; Ji, X. Enhanced Visible Photocatalytic Activity of Tree-like ZnO/CuO Nanostructure on Cu Foam. Appl. Surf. Sci. 2019, 471, 417–424. [Google Scholar] [CrossRef]
- Liu, Q.; Sun, J.; Han, D.; Liu, X.; Gao, X.; Jiang, Y.; Xie, K. Highly Efficient Photocatalytic Removal of Methylene Blue by Lamellar Structured Nanocrystalline and Amorphous CuO. Mater. Lett. 2020, 276, 128217. [Google Scholar] [CrossRef]
- Rao, M.P.; Wu, J.J.; Asiri, A.M.; Anandan, S. Photocatalytic Degradation of Tartrazine Dye Using CuO Straw-Sheaf-like Nanostructures. Water Sci. Technol. 2017, 75, 1421–1430. [Google Scholar] [CrossRef] [PubMed]
- Gao, P.; Yang, Y.; Yin, Z.; Kang, F.; Fan, W.; Sheng, J.; Feng, L.; Liu, Y.; Du, Z.; Zhang, L. A Critical Review on Bismuth Oxyhalide Based Photocatalysis for Pharmaceutical Active Compounds Degradation: Modifications, Reactive Sites, and Challenges. J. Hazard. Mater. 2021, 412, 125186. [Google Scholar] [CrossRef] [PubMed]
- Vidyasagar, D.; Gupta, A.; Balapure, A.; Ghugal, S.G.; Shende, A.G.; Umare, S.S. 2D/2D Wg-C3N4/g-C3N4 Composite as “Adsorb and Shuttle” Model Photocatalyst for Pollution Mitigation. J. Photochem. Photobiol. A-Chem. 2019, 370, 117–126. [Google Scholar] [CrossRef]
- Lei, J.F.; Li, L.B.; Du, K.; Ni, J.; Zhang, S.F.; Zhao, L.Z. Thermo-Catalytic Decomposition of Formaldehyde: A Novel Approach to Produce Mesoporous ZnO for Enhanced Photocatalytic Activities. Nanotechnology 2014, 25, 255701. [Google Scholar] [CrossRef]
- Kresse, G.; Furthmüller, J. Efficient Iterative Schemes for Ab Initio Total-Energy Calculations Using a Plane-Wave Basis Set. Phys. Rev. B 1996, 54, 11169–11186. [Google Scholar] [CrossRef]
- Perdew, J.P.; Burke, K.; Ernzerhof, M. Generalized Gradient Approximation Made Simple. Phys. Rev. Lett. 1996, 77, 3865–3868. [Google Scholar] [CrossRef]
- Kresse, G.; Joubert, D. From Ultrasoft Pseudopotentials to the Projector Augmented-Wave Method. Phys. Rev. B 1999, 59, 1758–1775. [Google Scholar] [CrossRef]
- Monkhorst, H.J.; Pack, J.D. Special Points for Brillouin-Zone Integrations. Phys. Rev. B 1976, 13, 5188–5192. [Google Scholar] [CrossRef]
- Wang, S.; Zhao, C.; Dejun, W.; Wang, Y.; Liu, F. ˙OH-Initiated Heterogeneous Oxidation of Methyl Orange Using an Fe–Ce/MCM-41 Catalyst. RSC Adv. 2016, 6, 18800–18808. [Google Scholar] [CrossRef]
- Mondal, M.; Halder, M.; Pradhan, S.K. Nanoplate like Heterostructured BiOBr/BiBr/FeBr2 Nanocomposites with Enhanced Photocatalytic Activity for Wastewater Treatment by Removing Organic Dyes: Interfacial Consecutive Dual Z Scheme Electron Transfer. J. Environ. Chem. Eng. 2022, 10, 107240. [Google Scholar] [CrossRef]
- Vaez, Z.; Javanbakht, V. Synthesis, Characterization and Photocatalytic Activity of ZSM-5/ZnO Nanocomposite Modified by Ag Nanoparticles for Methyl Orange Degradation. J. Photochem. Photobiol. A-Chem. 2020, 388, 112064. [Google Scholar] [CrossRef]
- Li, L.; Sun, X.; Xian, T.; Gao, H.; Wang, S.; Yi, Z.; Wu, X.; Yang, H. Template-Free Synthesis of Bi2O2CO3 Hierarchical Nanotubes Self-Assembled from Ordered Nanoplates for Promising Photocatalytic Applications. Phys. Chem. Chem. Phys. 2022, 24, 8279–8295. [Google Scholar] [CrossRef] [PubMed]
- Hu, Y.; Guo, T.; Ye, X.; Li, Q.; Guo, M.; Liu, H.; Wu, Z. Dye Adsorption by Resins: Effect of Ionic Strength on Hydrophobic and Electrostatic Interactions. Chem. Eng. J. 2013, 228, 392–397. [Google Scholar] [CrossRef]
- Segal, S.R.; Suib, S.L.; Foland, L. Decomposition of Pinacyanol Chloride Dye Using Several Manganese Oxide Catalysts. Chem. Mater. 1997, 9, 2526–2532. [Google Scholar] [CrossRef]
- Chen, W.-Y.; Wang, C.-P.; Chen, P.-C.; Lin, K.-Y.A.; Ghosh, S.; Huang, C.-W.; Nguyen, V.-H. Perovskite Zinc Titanate Photocatalysts Synthesized by the Sol–Gel Method and Their Application in the Photocatalytic Degradation of Emerging Contaminants. Catalysts 2021, 11, 854. [Google Scholar] [CrossRef]
- Prajapati, A.K.; Mondal, M.K. Comprehensive Kinetic and Mass Transfer Modeling for Methylene Blue Dye Adsorption onto CuO Nanoparticles Loaded on Nanoporous Activated Carbon Prepared from Waste Coconut Shell. J. Mol. Liq. 2020, 307, 112949. [Google Scholar] [CrossRef]
- Rashad, M.; Al-Aoh, H.A. Promising Adsorption Studies of Bromophenol Blue Using Copper Oxide Nanoparticles. DWT 2019, 139, 360–368. [Google Scholar] [CrossRef]
- Fatima, B.; Siddiqui, S.I.; Ahmed, R.; Chaudhry, S.A. Preparation of Functionalized-CuO Nanoparticles Using Brassica Rapa Leave Extract for Water Purification. DWT 2019, 164, 192–205. [Google Scholar] [CrossRef]
- Deka, P.; Hazarika, A.; Deka, R.C.; Bharali, P. Influence of CuO Morphology on the Enhanced Catalytic Degradation of Methylene Blue and Methyl Orange. RSC Adv. 2016, 6, 95292–95305. [Google Scholar] [CrossRef]
- Bandara, J.; Kiwi, J.; Pulgarin, C.; Peringer, P.; Pajonk, G.-M.; Elaloui, A.; Albers, P. Novel Cyclic Process Mediated by Copper Oxides Active in the Degradation of Nitrophenol: Implications for the Natural Cycle. Environ. Sci. Technol. 1996, 30, 1261–1267. [Google Scholar] [CrossRef]
- Ahmed, Y.; Yaakob, Z.; Akhtar, P. Degradation and Mineralization of Methylene Blue Using a Heterogeneous Photo-Fenton Catalyst under Visible and Solar Light Irradiation. Catal. Sci. Technol. 2016, 6, 1222–1232. [Google Scholar] [CrossRef]
- Yin, Y.; Lv, R.; Li, X.; Lv, L.; Zhang, W. Exploring the Mechanism of ZrO2 Structure Features on H2O2 Activation in Zr-Fe Bimetallic Catalyst. Appl. Catal. B-Environ. 2021, 299, 120685. [Google Scholar] [CrossRef]
- Qian, X.; Ren, M.; Fang, M.; Kan, M.; Yue, D.; Bian, Z.; Li, H.; Jia, J.; Zhao, Y. Hydrophilic Mesoporous Carbon as Iron(III)/(II) Electron Shuttle for Visible Light Enhanced Fenton-like Degradation of Organic Pollutants. Appl. Catal. B-Environ. 2018, 231, 108–114. [Google Scholar] [CrossRef]
- Chen, F.; Guo, J.; Meng, D.; Wu, Y.; Sun, R.; Zhao, C. Strong Pyro-Electro-Chemical Coupling of Elbaite/H2O2 System for Pyrocatalysis Dye Wastewater. Catalysts 2021, 11, 1370. [Google Scholar] [CrossRef]
- Sharma, S.K.; Bhunia, H.; Bajpai, P.K. Photocatalytic Decolorization Kinetics and Mineralization of Reactive Black 5 Aqueous Solution by UV/TiO2 Nanoparticles. CLEAN–Soil Air Water 2012, 40, 1290–1296. [Google Scholar] [CrossRef]
- Pourshirband, N.; Nezamzadeh-Ejhieh, A. An Efficient Z-Scheme CdS/g-C3N4 Nano Catalyst in Methyl Orange Photodegradation: Focus on the Scavenging Agent and Mechanism. J. Mol. Liq. 2021, 335, 116543. [Google Scholar] [CrossRef]
- Ma, X.; Zhou, Y.; Gu, S.; Mei, S.; Zhu, G.; Yu, M.; Wu, Y.; Ping, Y.; Hong, K.; Zhang, J.; et al. Degradation of Hexavalent Chromium and Methyl Orange by the Synergistic System of Graphitic Carbon Nitride and Electron Beam Irradiation. Chemosphere 2022, 287, 132228. [Google Scholar] [CrossRef]
- Xu, D.; Zhang, Y.; Cheng, F.; Dai, P. Efficient Removal of Dye from an Aqueous Phase Using Activated Carbon Supported Ferrihydrite as Heterogeneous Fenton-like Catalyst under Assistance of Microwave Irradiation. J. Taiwan Inst. Chem. Eng. 2016, 60, 376–382. [Google Scholar] [CrossRef]
- Xu, Y.; Schoonen, M.A.A. The Absolute Energy Positions of Conduction and Valence Bands of Selected Semiconducting Minerals. Am. Mineral. 2000, 85, 543–556. [Google Scholar] [CrossRef]


Disclaimer/Publisher’s Note: The statements, opinions and data contained in all publications are solely those of the individual author(s) and contributor(s) and not of MDPI and/or the editor(s). MDPI and/or the editor(s) disclaim responsibility for any injury to people or property resulting from any ideas, methods, instructions or products referred to in the content. |
© 2022 by the authors. Licensee MDPI, Basel, Switzerland. This article is an open access article distributed under the terms and conditions of the Creative Commons Attribution (CC BY) license (https://creativecommons.org/licenses/by/4.0/).