Article

Mechanism-Enhanced Active Attapulgite-Supported Nanoscale Zero-Valent Iron for Efficient Removal of Pb2+ from Aqueous Solution

1
School of Environmental and Municipal Engineering, Lanzhou Jiaotong University, Lanzhou 730070, China
2
Key Laboratory of Yellow River Water Environment in Gansu Province, Lanzhou Jiaotong University, Lanzhou 730070, China
3
College of Chemistry and Chemical Engineering, Ningxia Normal University, Guyuan 756000, China
*
Author to whom correspondence should be addressed.
Nanomaterials 2022, 12(9), 1591; https://doi.org/10.3390/nano12091591
Submission received: 5 April 2022 / Revised: 29 April 2022 / Accepted: 4 May 2022 / Published: 7 May 2022

Abstract

:
In this study, attapulgite-supported nano zero-valent iron (nZVI@ATP) was synthesized by a liquid-phase reduction method using active attapulgite (ATP) as raw material, and used for Pb2+ remediation in aqueous solution. To understand the mechanism of Pb2+ removal, various techniques were used to characterize nZVI@ATP. The results showed that spherical nZVI particles were uniformly dispersed on the surface of ATP, and the agglomeration of nZVI particles was significantly weakened. The adsorption performance of nZVI@ATP for Pb2+ was greatly improved compared with that of ATP ore, in which the Fe/ATP mass ratio of 1:2 was the best loading ratio. Under the conditions of a temperature of 25 °C and a pH of 5.00, the initial concentration of Pb2+ was 700 mg/L, and the Pb2+ removal rate of nZVI@ATP was 84.47%. The adsorption of nZVI@ATP to Pb2+ was mainly a spontaneous endothermic reaction of heterogeneous surfaces, and the adsorption rate of nZVI@ATP to Pb2+ was proportional to pH in the range of 2–5.5. The presence of Na+, Mg2+, and Ca2+ can inhibit the removal of Pb2+, and Ca2+ has the strongest inhibition effect on the removal of Pb2+. The removal mechanism of Pb2+ by nZVI@ATP obtained from SEM-EDS, BET, XRD, FTIR and XPS included reduction, precipitation, and the formation of complexes.

Graphical Abstract

1. Introduction

With the rapid increase in China’s industrial production, a large number of heavy metal elements are entering the water through the electroplating, mining, metallurgy, leather, and industries, resulting in their content exceeding the standard, seriously polluting China’s water environment. In addition, human activities such as the use of pesticides and fertilizers, domestic garbage disposal, and vehicle transportation also directly or indirectly increase the heavy metal content in water bodies [1]. Lead (Pb) is one of the most toxic industrial metals, and is used in making lead-based coatings, painting products, pigments, solder, armor, insecticides, and lead–acid batteries [2,3]. The main sources of Pb pollution are lead dust, lead slag, and lead-containing wastewater produced by lead mining, battery manufacturing, metal smelting, and oil painting industries [4]. Pb in the environment is difficult to degrade, and once it enters the environment, will result in long-term toxicity, presenting a potential threat to humans, as it can cause serious harm to the central nervous system, immune system, blood system, and skeletal system after entering the human body [5].
In recent decades, nanoscale zero-valent iron (nZVI) has been found to be a promising approach for heavy metal remediation [6]. Among the various approaches, nZVI stands out due to its unique structure and properties, and has become one of the most widely used nanomaterials in the environment, as well as currently being the most studied nanotechnology [7,8]. nZVI is prone to corrosion, and eventually has a “core–shell” structure with a dense Fe0 core in the inner layer and a thin amorphous shell in the outer layer. The shell is thought to be a mixed Fe2+/Fe3+ oxide phase, which is formed due to the spontaneous oxidation of Fe0 in the environment [9,10]. Nanoscale zero-valent iron (nZVI) has high surface energy and reactivity, and the physicochemical properties of nZVI and its reducing ability enable it to be applied to the rapid decontamination of many water-phase pollutants [11,12]. However, the removal effect of nZVI in the practical treatment of heavy metal pollution is not ideal, which can be attributed to the following points: (1) agglomeration: due to the existence of high surface energy and a strong internal magnetic effect, the agglomeration of nZVI particles is serious, which reduces the mobility of nZVI particles in water and the effective contact area with pollutants [13]; (2) easy aging: nZVI is highly reactive, and its structure and chemical properties will change over time in the natural environment, gradually corroding even in the anaerobic water environment [14]; (3) poor electron selectivity: as a strong reducing agent, nZVI acts with the target pollutant, and most of the electrons are not effectively transmitted to the reaction group, but rather to the hydrogen ions or dissolved oxygen in the aqueous phase, degrading its reducibility, and resulting in a reduction of effective electron utilization [15]. To avoid the agglomeration of nZVI particles and to improve the stability and mobility of nZVI, various modifications have been carried out, including by means of the surface modification method, the metal doping method, and the solid loading method.
Effective application of nZVI requires an appropriate support medium for fixation and dispersion. For this purpose, materials with high surface-to-volume ratios, such as activated carbon, graphite, and clay, have been extensively used in the field of pollution remediation as nZVI support materials [16,17,18]. ATP is a kind of hydrated magnesium-rich silicate clay mineral; it has a specific crystal structure and special surface charge distribution characteristics, and has strong adsorption and ion exchange performance [19]. Natural ATP has broad application prospects in the treatment of heavy metal pollution in water because of its rich mineral resources, easy access, low cost, non-toxicity, and wide application range [20]. ATP has a specific needle structure, good dispersion ability, and high mechanical properties, which can be used as an excellent solid negative carrier. Loading nZVI on ATP is expected to disperse nZVI particles, increase the contact area with heavy metals, and solve the problem of easy agglomeration of nZVI. Based on the understanding of attapulgite’s unique structure and adsorption properties, scholars at home and abroad have carried out in-depth research on attapulgite as a cheap natural adsorbent material. Yin et al. applied ATP and sepiolite to remove Pb2+, and the removal rate of Pb2+ by ATP was 81.5% [21]. Xu et al. studied the adsorption of Pb2+ and Cu2+ in aqueous solution before and after amino-modified ATP, and the adsorption results showed that the adsorption capacity of Pb2+ by modified composite material was superior to that of Cu2+ in unary and binary systems [22]. Huang et al. removed Pb2+ from the water after purification, high-temperature calcination, and hydrothermal loading of ATP, the saturated adsorption capacity of Pb2+ by the three modified ATP was 43.5, 53.9, and 127.6 mg/g, respectively [23]. The results show that ATP is an excellent adsorbent for water treatment, especially when loaded with nZVI [24,25].
In this study, low-cost Gansu ATP was selected as the carrier, and ATP was acid-treated and supported with zero-valent iron nanoparticles using the liquid-phase reduction method. The influence of factors such as pH value, coexisting cation, and temperature change on the adsorption of Pb2+ by nZVI@ATP was studied. The adsorption kinetics model, isothermal adsorption model, and the Van ‘t Hoff equation were used to explore the adsorption performance of nZVI@ATP on Pb2+ in water, and the adsorption mechanism was explored in combination with the changes of the apparent morphology, elemental composition, phase composition, and functional groups of the modified materials before and after adsorption.

2. Materials and Methods

2.1. Materials

Anhydrous ethanol (C2H5OH, ≥99.7%), ferrous sulfate heptahydrate (FeSO4·7H2O, ≥99.0%), nitric acid (HNO3), lead nitrate (Pb(NO3)2, ≥99.0%), sodium borohydride(NaBH4, ≥98.0%), sodium hydroxide (NaOH, ≥96.0%) and hydrochloric acid (HCl) were all purchased from Sinopharm Chemical Reagents Co., Ltd. (Shanghai, China). Sodium nitrate (NaNO3, ≥99.0%) was purchased from Tianjin Damao Chemical Reagent Factory (Tianjin, China). ATP raw ore used in this experiment came from Gansu Hanxing Environmental Protection Technology Co., Ltd. (Lanzhou, China). After crushing and grinding the ATP raw ore, pass through a 200-mesh sieve to obtain ATP powder, which is bagged for later use.

2.2. Preparation of nZVI@ATP

ATP was treated with 3 mol/L hydrochloric acid before use, stirred for 3 h at 1000 r/min with an electric stirrer at room temperature, and then treated with ultrasonic wave for 1 h. After standing for some time, the supernatant was dumped, and the lower sediment was washed with ultra-pure water until it was neutral. Finally, it was dried at 80 °C in the oven and ground through a 200-mesh sieve to obtain the pretreated ATP, which was sealed and stored for later use.
nZVI@ATP was prepared by the liquid-phase reduction method. It was synthesized by dissolving 27.802 g FeSO4·7H2O in 100 mL of deionized water and a certain amount of pickling ATP was added according to the mass ratio of ferric soil 3:1, 2:1, 1:1, 1:2, and 1:3, respectively. The mixture was stirred for 2 h under the protection of N2 to make it fully mixed, then 100 mL anhydrous ethanol was added and stirred for 30 min. NaBH4 solution was then dropped and stirred for 15 min after dropping to ensure the full reaction of NaBH4 and Fe2+. All the above reaction processes were carried out in an N2 atmosphere. Then, the solution was centrifuged, the supernatant was discarded and cleaned with anaerobic deionized water and anaerobic anhydrous ethanol successively and separated by centrifuge. The black solid obtained was dried in a vacuum drying oven and sifted through 200 mesh to obtain nZVI@ATP, which was vacuum-sealed and stored in the freezer layer for use. ATP does not need to be added in the preparation of pure nZVI, and the other steps are the same as nZVI@ATP. Black solid particles of nZVI are produced after reduction according to the following reaction.
Fe 2 + + 2 BH 4 + 6 H 2 O Fe 0 + 2 B ( OH ) 3 + 7 H 2

2.3. Characterization of Adsorbents

The structure and surface morphology of ATP and nZVI@ATP before and after adsorption were analyzed by scanning electron microscopy (SEM) (GeminiSEM500, Carl Zeiss AG, Jena, Germany) and X-ray energy spectroscopy (EDS) (X-max ExtremeX, Oxford Instruments, Abingdon, UK). The FTIR spectra of ATP and nZVI@ATP were collected by Fourier-transform infrared spectroscopy (FTIR) (Vertex70, Bruker, Karlsruhe, Germany). FTIR samples were prepared by KBr compression method (1–2 mg sample, 100–120 mg KBr). Both samples and KBr were dried and ground to particle size less than 2 μm. Thin slices were prepared by hydraulic press with scanning wave number ranging from 4000 to 400 cm−1. X-ray diffraction (XRD) (Rigaku, Rigaku Corporation, Tokyo, Japan) was used to analyze the crystal structure and composition of the samples. XRD radiation type is Cu-Kɑ, wavelength is 0.15416 nm, scanning range is (−3)–145°. Zeta potential values of acid-washed ATP and nZVI@ATP were measured by Zeta potential tester (Zeta) (Nano-ZS90, Malvern Company, Malvern, UK). The surface chemistry of samples was carried out using an X-ray photoelectron spectroscopy (XPS) (Kratos AXIS Ultra DLD, Kratos, Manchester, UK). All XPS spectra were calibrated (C1s = 284.4 eV) and compared with the NIST X-ray photoelectron spectroscopy database (https://srdata.nist.gov/xps/Default.aspx, accessed on 9 April 2022). The specific surface areas and pore size of the adsorbents were analyzed by a specific surface area and porosity analyzer (BET) (ASAP2020, Micromeritics Instruments, Norcross, GA, USA) using the Barret-Joyner-Halenda (BJH) adsorption model and the t-plot micropore model.

2.4. Batch Experiments

Pb2+ removal by different materials was examined by adding 0.03 g ATP, nZVI, and nZVI@ATP with different mass ratios in 30 mL Pb2+ solution (700 mg/L), respectively. All heavy metal solutions in the experiment were supported by 0.01 mol/L NaNO3. The pH of the solution was adjusted to 5.0 by HNO3 and NaOH, the solution was shaken at 298 K and 220 rmp for 24 h. At a predetermined time, the mixed solution was filtered through a 0.45 μm filter membrane. The concentration of Pb was analyzed by a flame atomic absorption spectroscopy (TAS-990, Beijing Puxi, Beijing, China). The effect of pH was determined by adjusting the initial pH of Pb2+ solution (700 mg/L) from 2 to 5.5 with HNO3 and NaOH in the presence of nZVI@ATP (1 g/L). Pseudo-first-order kinetic model, pseudo-second-order kinetic model, and intra-particle diffusion model were used to analyze the adsorption kinetics, the optimal adsorption time was obtained, and the rate control steps of the process were determined. Anaerobic Pb2+ solution with an initial concentration of 550–950 mg/L at pH 5.0 ± 0.2, at 298 K, 308 K, and 318 K, the adsorption isotherm experiments of nZVI@ATP on Pb2+ were carried out. Langmuir, Freundlich and Temkin models were used to analyze the adsorption data. The influence of the coexistence of Na+, Ca2+, and Mg2+ on the adsorption of Pb2+ was studied by a single factor experiment with 0–10 mmol/L cations added into the initial concentration of 700 mg/L Pb2+ solution.

3. Results and Discussion

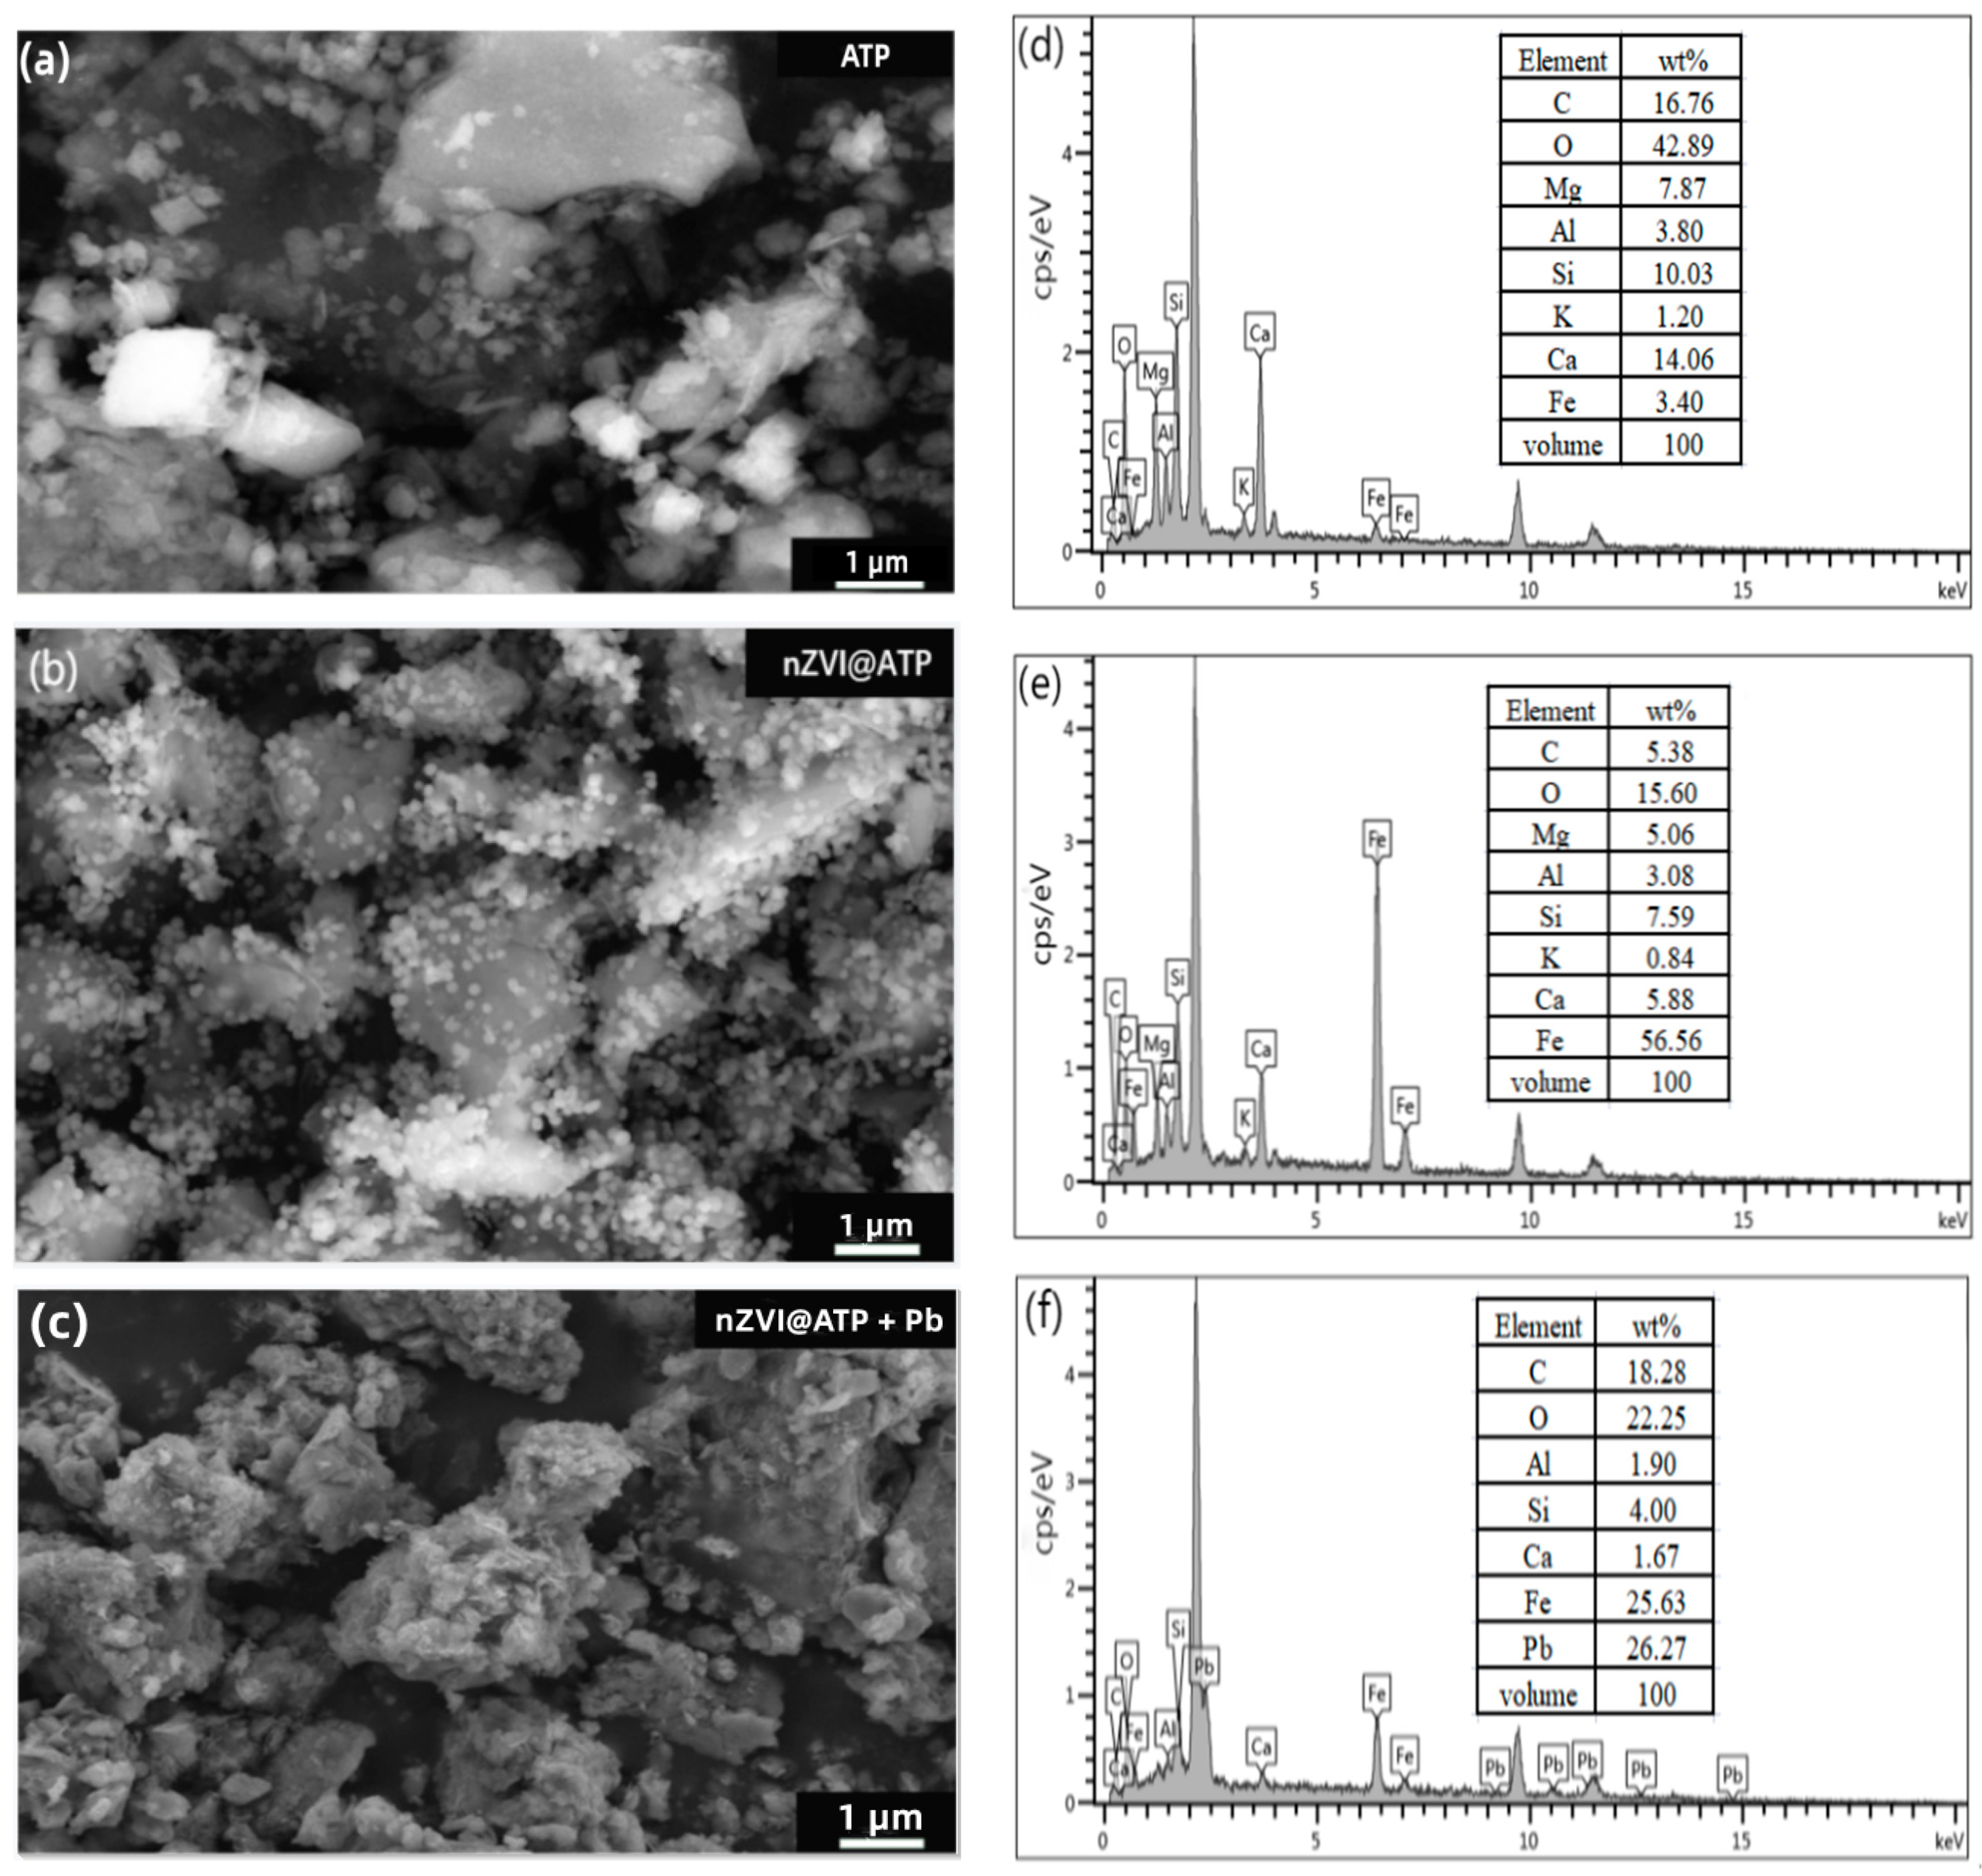
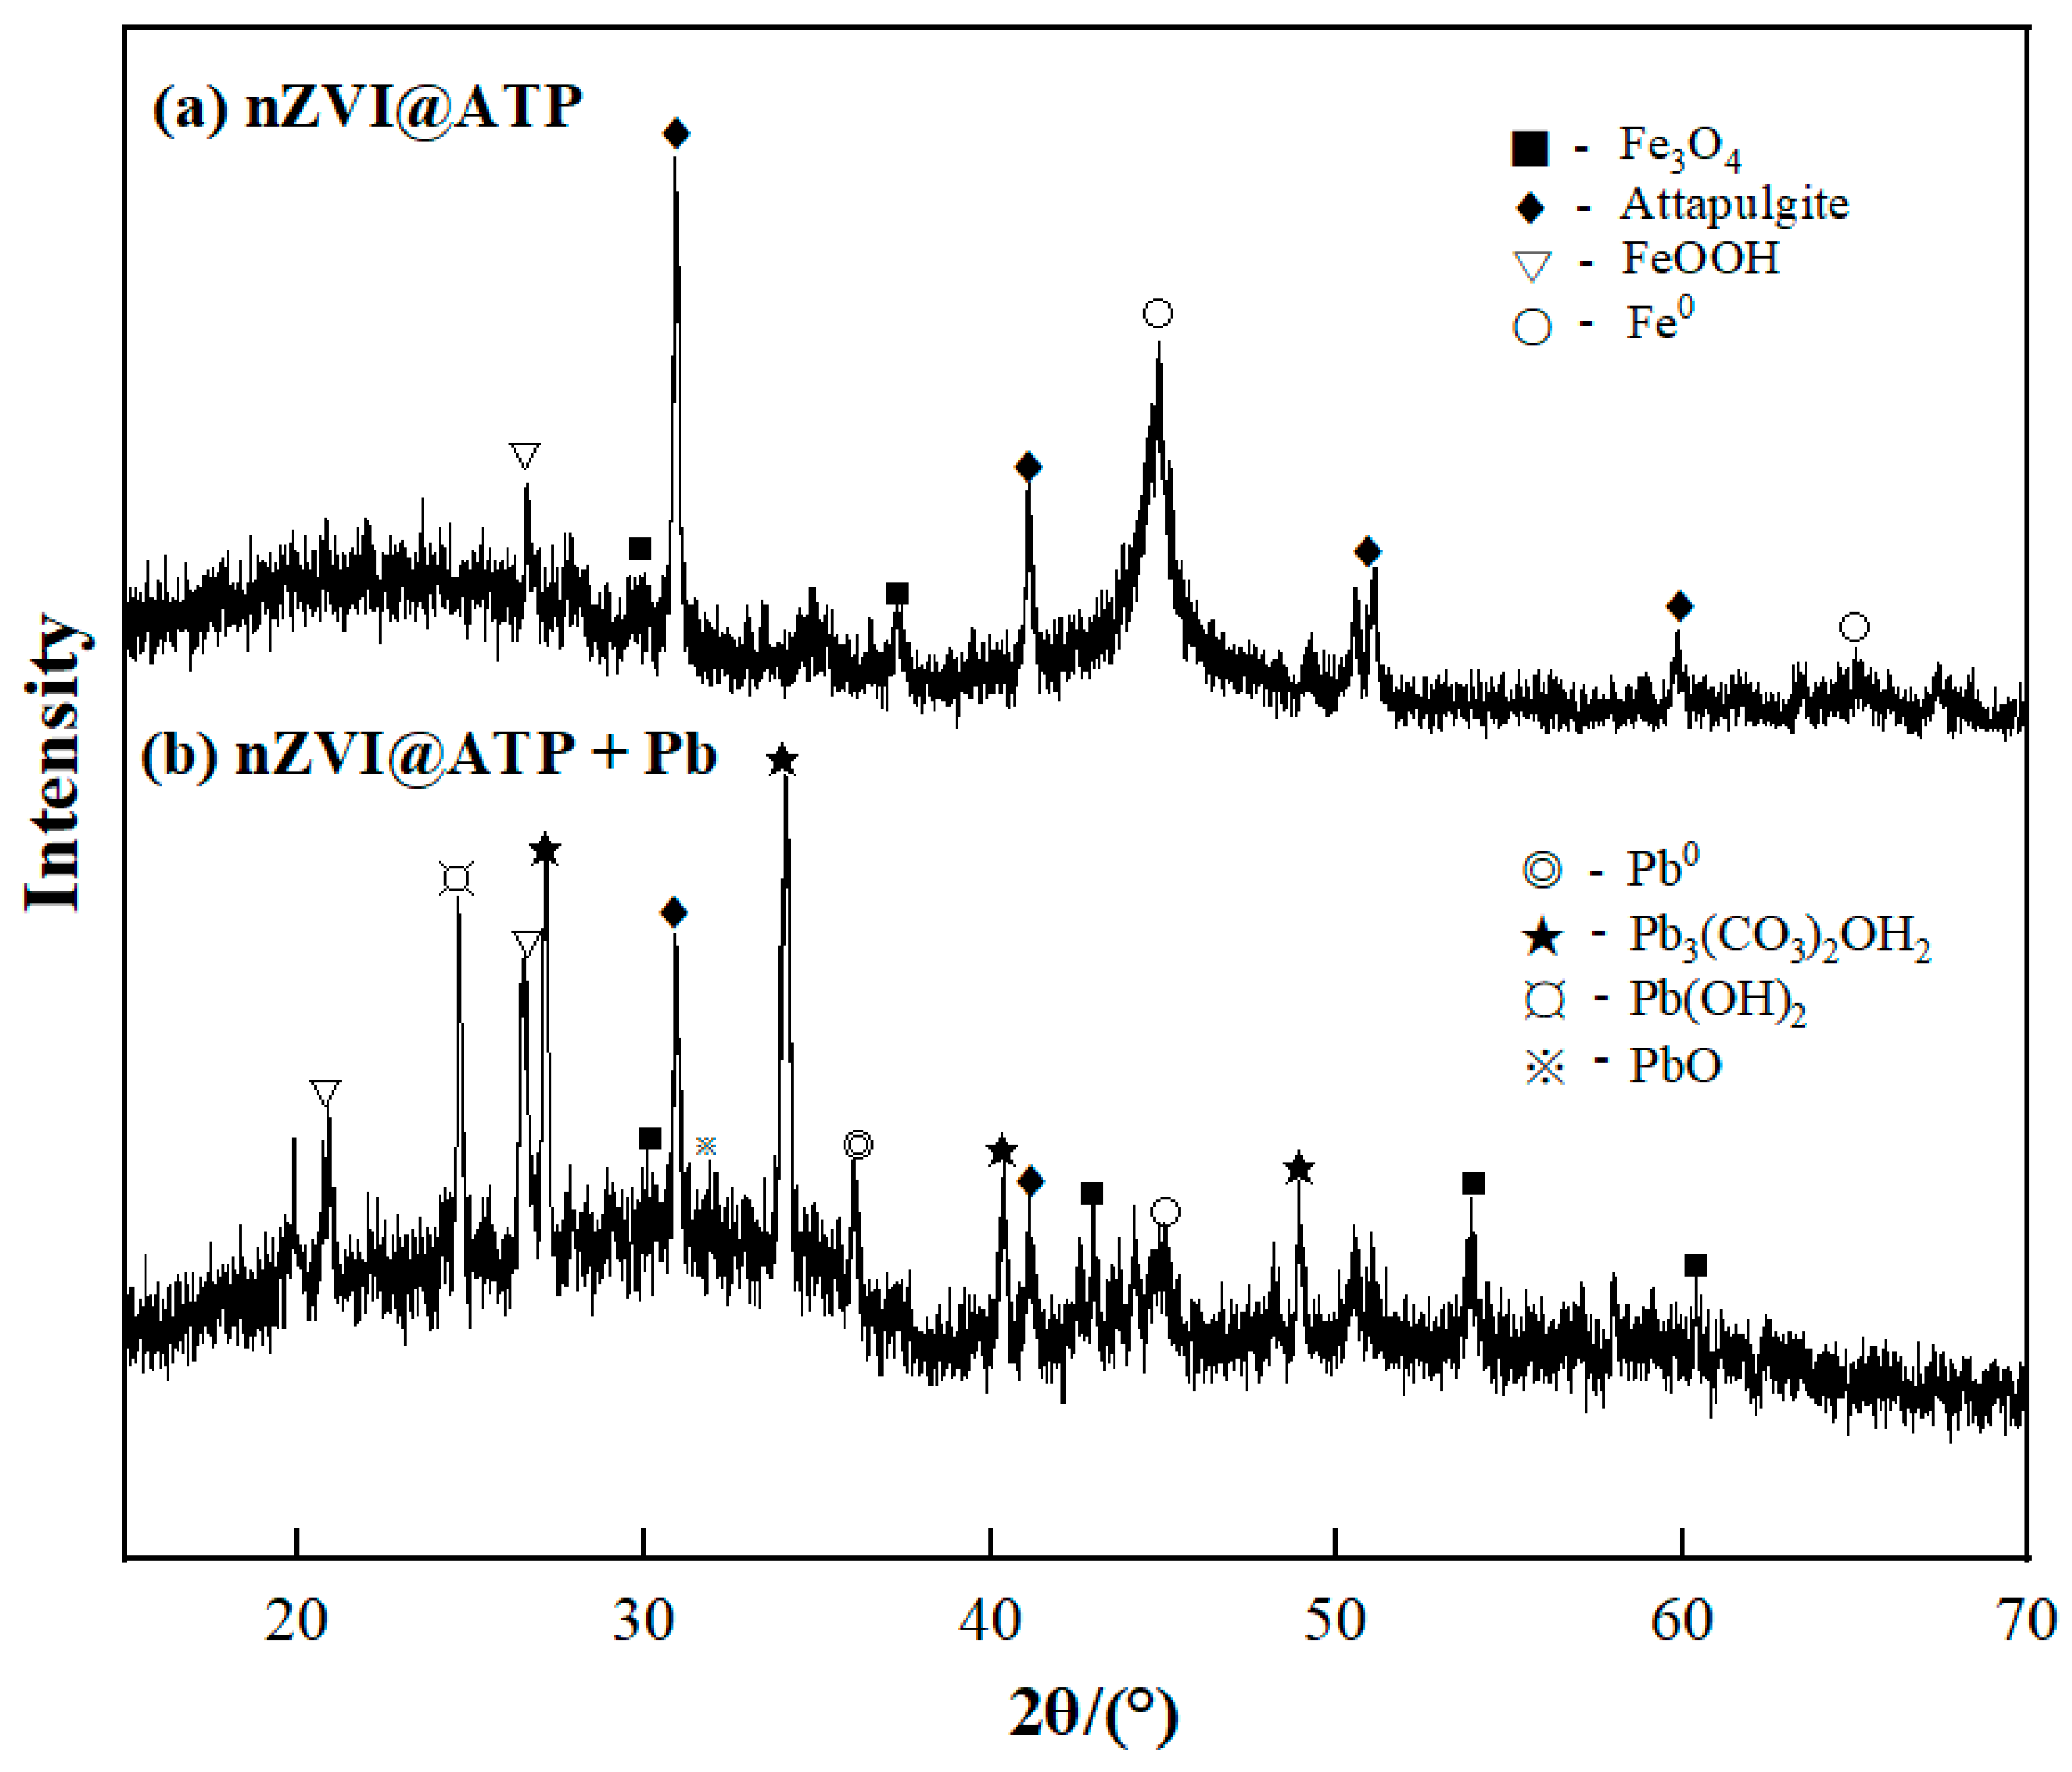
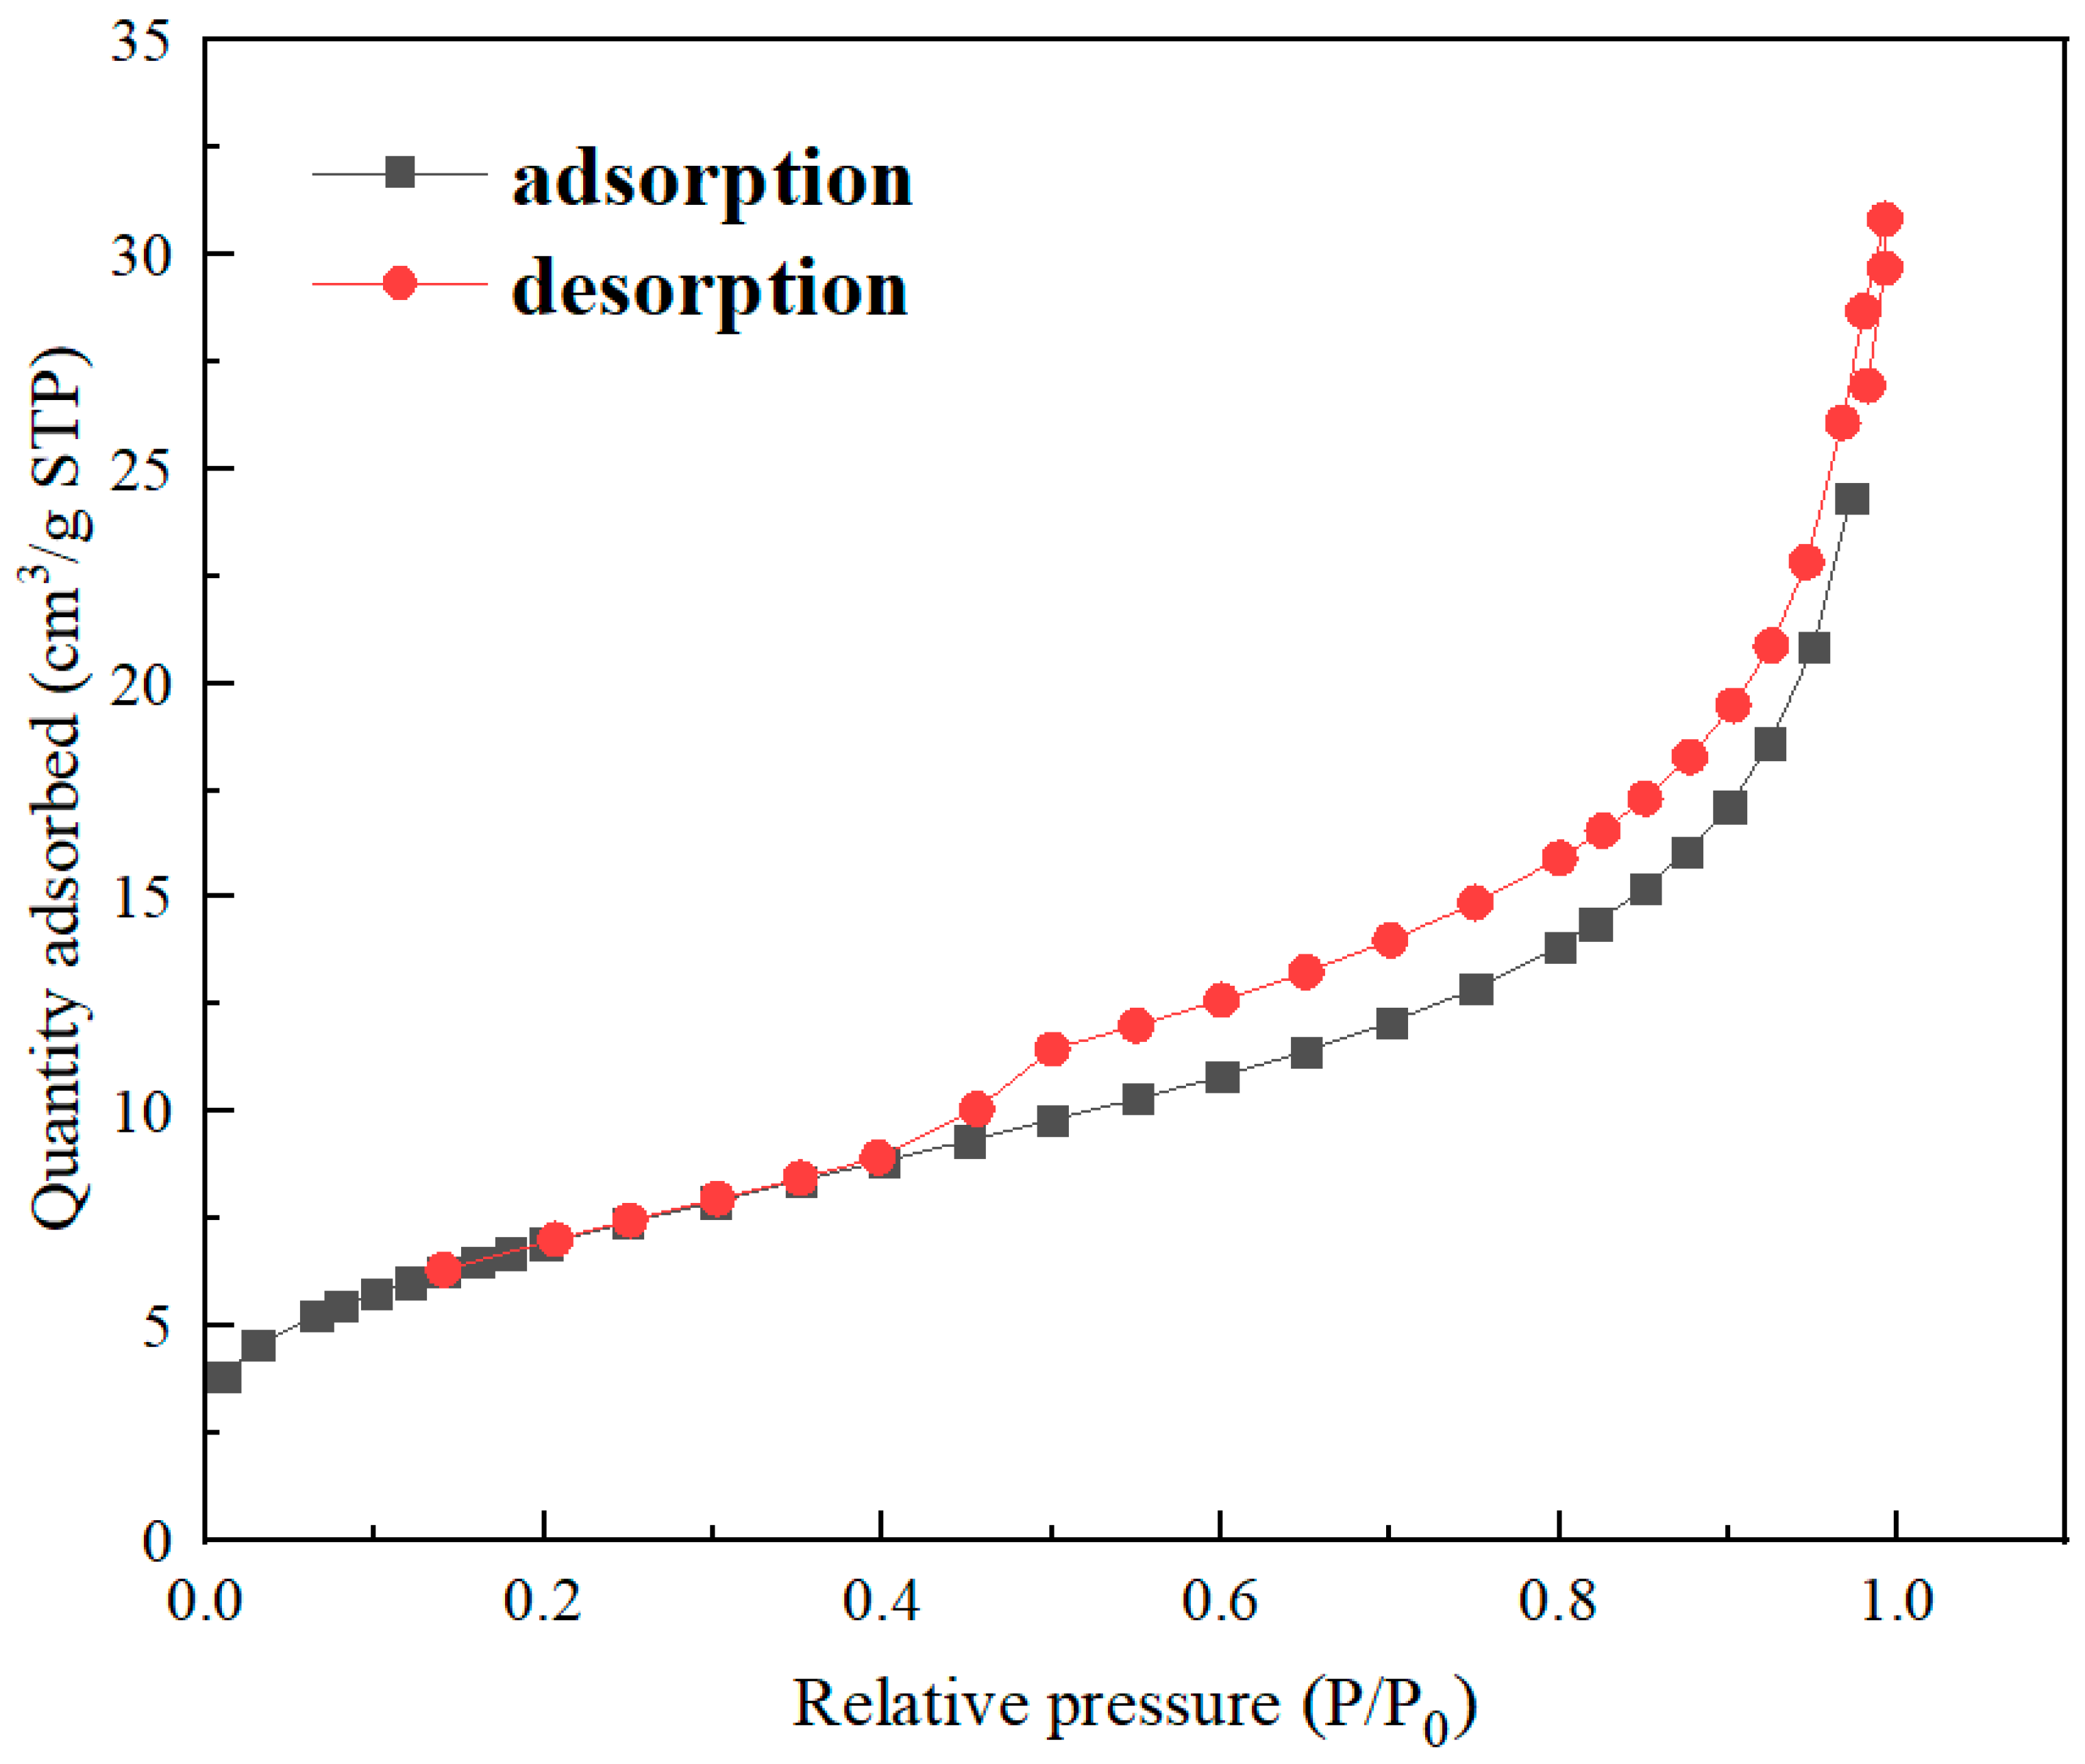
3.1. Characterizations of Materials

According to the SEM images of nZVI@ATP before and after Pb2+ adsorption (Figure 1a–c), it can be found that spherical nZVI particles were dispersed and arranged on the surface of ATP before adsorption. After the adsorption of Pb2+, the morphology of nZVI@ATP changed greatly; the surface became rough, and nZVI particles could hardly be observed; instead, a large number of flocculent precipitates and some fine particles appeared, and the pore size became smaller, which was due to the chemical reaction between nZVI@ATP and Pb2+ and the reaction between Fe0 and water, resulting in the change of the microscopic morphology of nZVI@ATP. The EDS diagram in Figure 1d–f is the composition diagram of nZVI@ATP before and after the adsorption of Pb2+. It can be found that no Pb element was present in the diffraction peaks of nZVI@ATP before the reaction. After the reaction of nZVI@ATP with Pb2+, multiple diffraction peaks of the Pb element appeared, and the mass percentage reached 26.27%, indicating that Pb2+ had been successfully adsorbed onto the surface of nZVI@ATP. The XRD patterns of nZVI@ATP before and after Pb2+ adsorption are shown in Figure 2. In the XRD spectra of nZVI@ATP before the reaction, the peak value at 2θ = 44.86° represents the appearance of Fe0, indicating Fe0 formed on the ATP surface. The peak value at 2θ = 26.58 (FeOOH) indicates that iron oxide was also detected, meaning that Fe0 particles were partially oxidized during preparation or preservation. After adsorption, the characteristic peak of Fe0 (○) at 2θ = 44.86° weakens obviously, and the characteristic peak disappears at 2θ = 65°, indicating that Fe0 participates in the reaction, resulting in the reduction of its content. Meanwhile, the characteristic peak of FeOOH (▽) at 2θ = 26.58° significantly enhanced, and the characteristic peak of Fe3O4(■) appears at 2θ = 43.05° and 53.41°, both of which were transformed from Fe0. The sharp new diffraction peak at 2θ = 36.4° is attributed to the characteristic peak of Pb0 (◎), indicating that a reduction reaction occurred during the adsorption process, and part of Pb2+ is reduced to Pb0 by Fe0. The characteristic peaks at 2θ = 24.64° and 2θ = 31.9° correspond to the characteristic peaks of Pb(OH)2 (¤) and PbO (※), respectively, indicating that Fe0 will be oxidized or corroded to Fe2+ and further oxidized to Fe3+ during the adsorption process, and at the same time, OH was generated, and Pb(OH)2 precipitates were generated by the reaction with Pb2+, part of Pb(OH)2 was unstable in solution, and dehydration formed PbO [26]. The characteristic peaks at 2θ = 27.17°, 34.09°, and 40.34° are attributed to Pb3(CO3)2OH2(★), which is the product of the reaction of Pb(OH)2 with CO32− [26].
The specific surface area of nZVI@ATP was measured by bet-N2 surface area analyzer, as shown in Table 1. The specific surface area (BET) and pore size of nZVI@ATP were 25.413 m2·g−1 and 7.229 nm, respectively, which is smaller than the BET of nZVI (20–60 m2/g) [27]. By analyzing the N2 adsorption–desorption isotherm curve in Figure 3, nZVI@ATP showed a type IV(a) isotherm (short platform, only inflection point). A comprehensive analysis of isotherms, BJH model, and T-plot micropore model showed that the pore structure of nZVI@ATP was mesoporous (2–50 nm).

3.2. Effect of Different Materials and Nanoscale Zero-Valent Iron Loading on Pb2+ Removal

After pickling, the removal rate of Pb2+ by ATP was 52.72%. In the acidification process, part of H+ was able to react with carbonate minerals in ATP, and part of H+ directly replaced cations in ATP. Soluble metal oxides and calcium carbonate impurities blocked the ATP pores and inside could be removed in large quantities, and the internal pores could be cleared by pickling, improving the pore size and porosity of ATP [28].
The removal rate of Pb2+ by nZVI@ATP increased first and then decreased with decreasing Fe in the ratio Fe/ATP. As shown in Figure 4, the adsorption performance was best when Fe/ATP was 1:1 and 1:2, and the removal rate was 85.15% and 84.47%, respectively, which was also higher than that of pure nZVI (78.18%). Pure nZVI particles tend to agglomerate, which limits their contact opportunities with pollutants and cannot give full play to their adsorption properties, resulting in waste of adsorption sites. However, when loaded on ATP, the agglomeration phenomenon of nZVI could be improved due to the spatial barrier effect of ATP, and the removal rate could be increased. However, due to the limited spatial barrier effect of ATP, excessive nZVI would cover the surface of ATP and continue to aggregate into long chains, which inhibit the transfer process of heavy metal ions on the surface, resulting in a reduced removal rate. The high ratio of Fe/ATP was not conducive to the removal of heavy metals by nZVI@ATP. Since the removal rate of Pb2+ was not significantly different between Fe/ATP ratios of 1:1 and 1:2, the adsorption effect was better than that of pure nZVI, and when the ratio of Fe/ATP was 1:2, the iron content was only 1/3 of the iron in pure nZVI, the cost advantage was significant, and the adsorption characteristics and reaction mechanism were studied based on the subsequent experiments. Table 2 compares the adsorption performance of different adsorbents. The adsorption performance of nZVI@ATP on Pb2+ is higher than that of the other adsorbents mentioned above. Therefore, it can be seen that nZVI@ATP has important potential in removing Pb2+ from water.

3.3. Sorption Kinetics and Isotherms (Adsorption Properties)

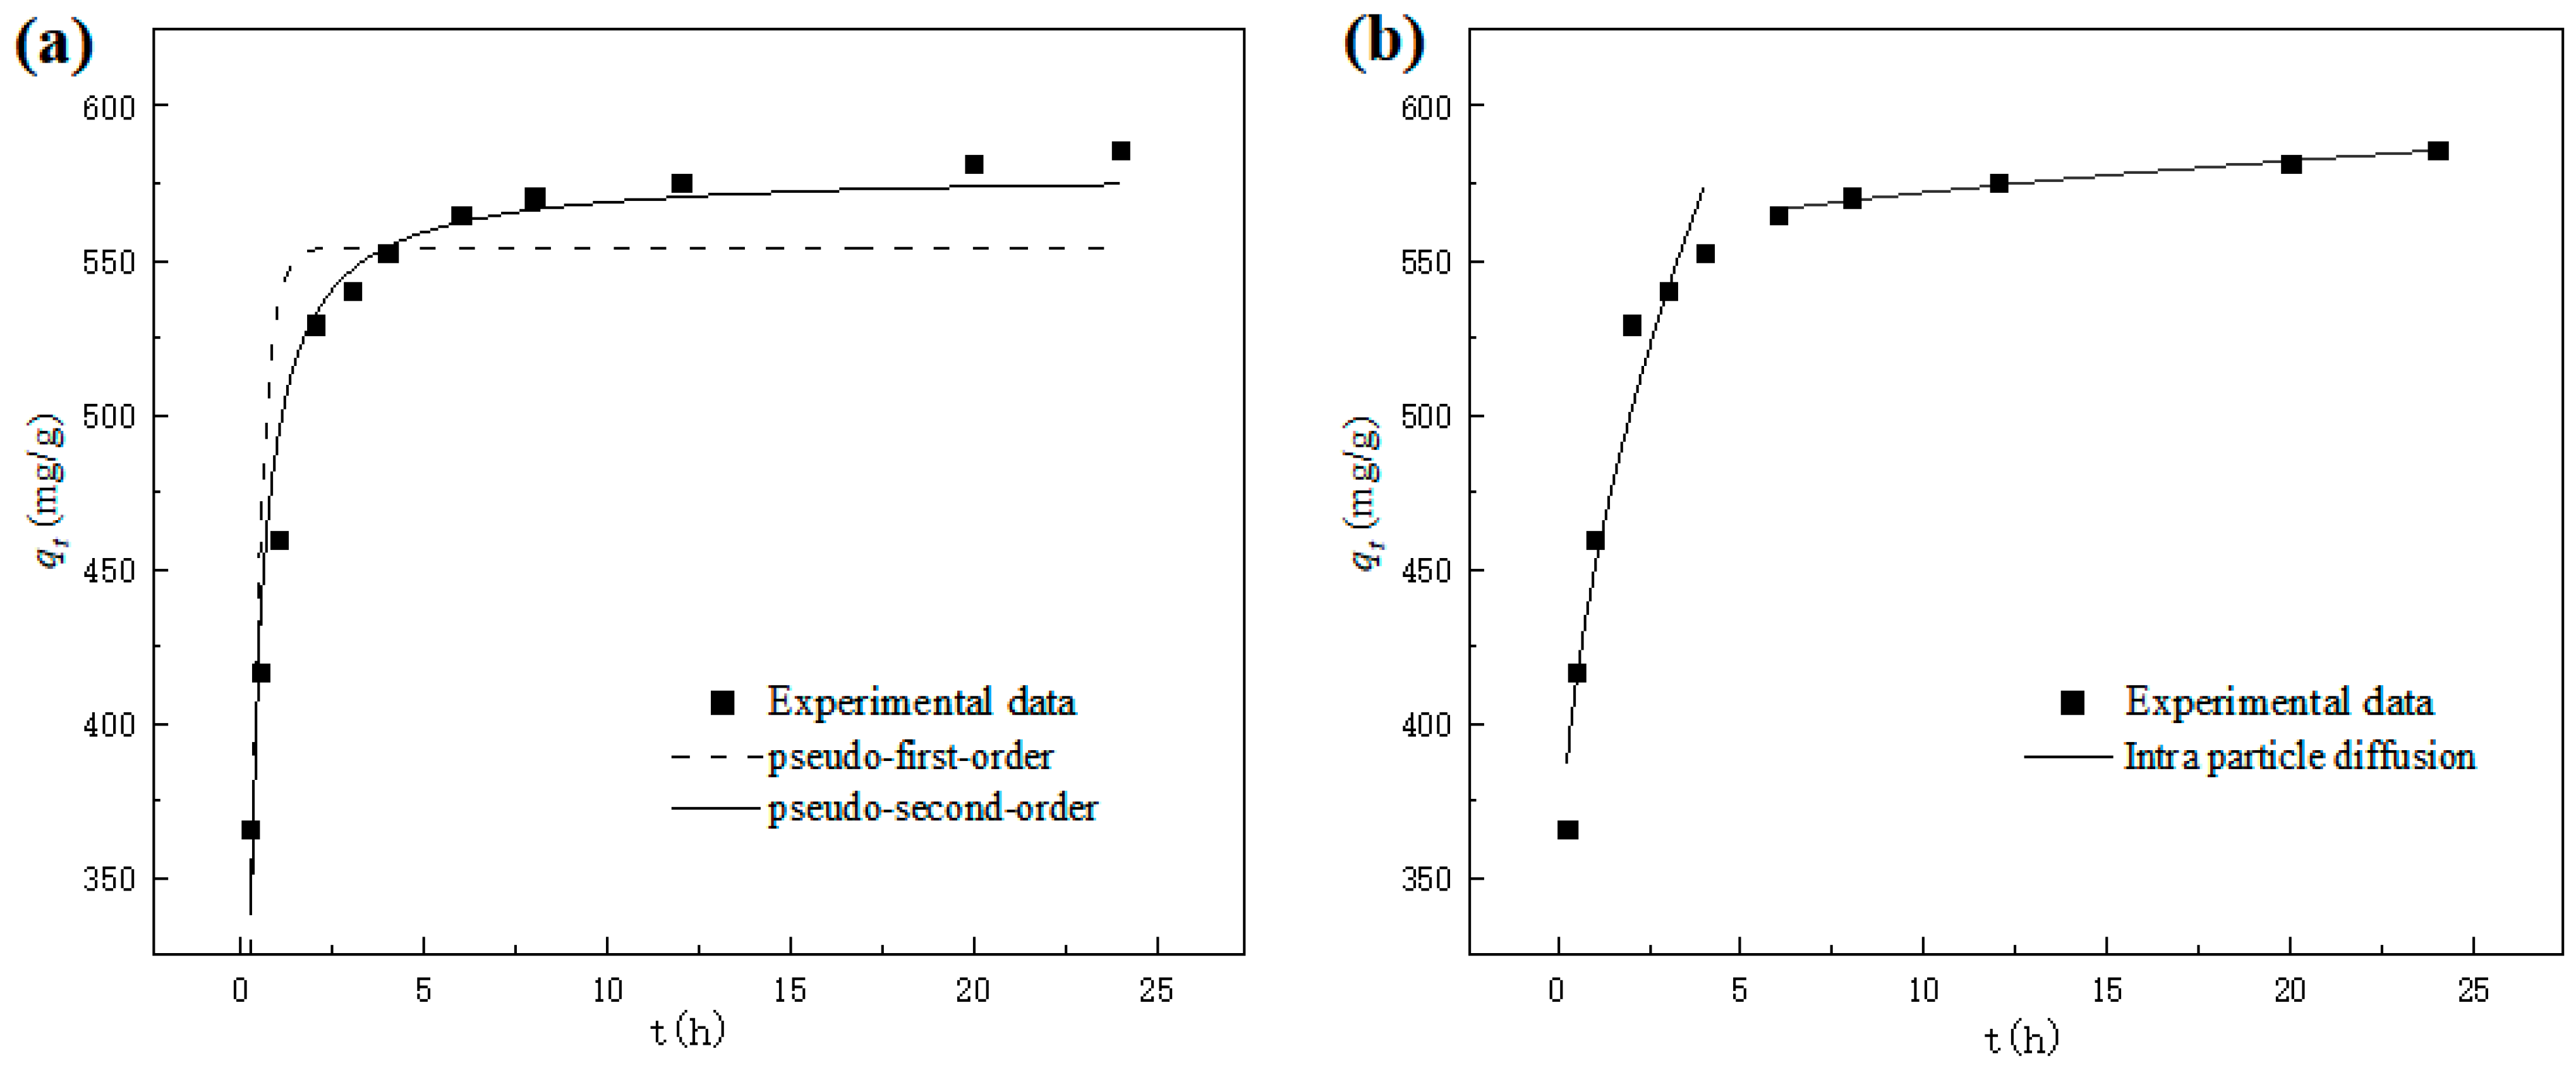
3.3.1. Sorption Kinetics

The influence of adsorption time on the adsorption capacity (qt) of nZVI@ATP for Pb2+ is shown in Figure 5. It is obvious that the adsorption capacity of nZVI@ATP on Pb2+ increases rapidly within 0–2 h and can reach more than 90% of the equilibrium adsorption capacity. After 2 h reaction, the growth rate of adsorption capacity slowed down until the adsorption equilibrium was reached (about 12 h). This is because at the initial stage of adsorption, a large number of vacant sites on the surface of nZVI@ATP are conducive to the adsorption of Pb2+, and the mass transfer force generated under the concentration difference of Pb2+ promotes the rapid diffusion of Pb2+ to nZVI@ATP, which has a good chance of being attached to the adsorption site. As the reaction progresses, the number of vacant adsorption sites on the surface of nZVI@ATP gradually decreases, and the mass transfer driving force caused by the concentration difference of Pb2+ decreases. Pb2+ must overcome greater resistance to enter the interior of nZVI@ATP, and combined with the adsorption site, results in a decrease in the adsorption rate, an increase in adsorption capacity, and gradual saturation.
The dynamic model was used to fit the experimental data, and the results are shown in Figure 5a. Table 3 presents the fitting parameters. The pseudo-second-order kinetic fitting parameter R2 was 0.9614, much higher than the pseudo-first-order kinetic fitting curve R1, and the theoretical equilibrium adsorption capacity qm2 obtained by the model fitting was 578.77 mg/g, with a relative deviation of only 1.16% from the experimental results, indicating that the pseudo-second-order kinetic fitting model was more suitable for the nZVI@ATP’s fitting curve of Pb2+.
Pseudo-first-order kinetic, pseudo-second-order kinetic, and intra-particle diffusion models are as follows:
d q t / d t = k 1 / ( q e q t )
d q t / d t = k 2 / ( q e q t ) 2
q t = k d t 1 / 2 + E i
qt—amount of heavy metals adsorbed at any time t (h) (mg/g)
qe—amount of heavy metals adsorbed at equilibrium (mg/g)
k1—pseudo-first-order rate constant (g/(mg·h))
k2—pseudo-second-order rate constant (g/(mg·h))
kd—intra-particle diffusion rate constant (mg/(g·h1/2))
Ei—intercept (mmol/g)
The adsorption process of nZVI@ATP on Pb2+ was similar to that of nZVI@ATP on Pb2+. The fitting results of the intra-particle diffusion model are shown in Figure 5b, and the fitting parameters are shown in Table 4. In the model, the whole adsorption process could be divided into two stages (surface adsorption stage and intra-particle diffusion stage), R12 < R22, the intra-particle diffusion stage fitted well, and the intra-particle diffusion stage was the main stage of nZVI@ATP adsorption of Pb2+. kd1 was much larger than kd2, E1 < E2, and both were not 0, reflecting that the boundary layer at the diffusion stage was larger and the mass transfer resistance was larger. In terms of the rate of the entire adsorption process, the diffusion rate within the particle had a greater influence, but it was not the only speed control step.

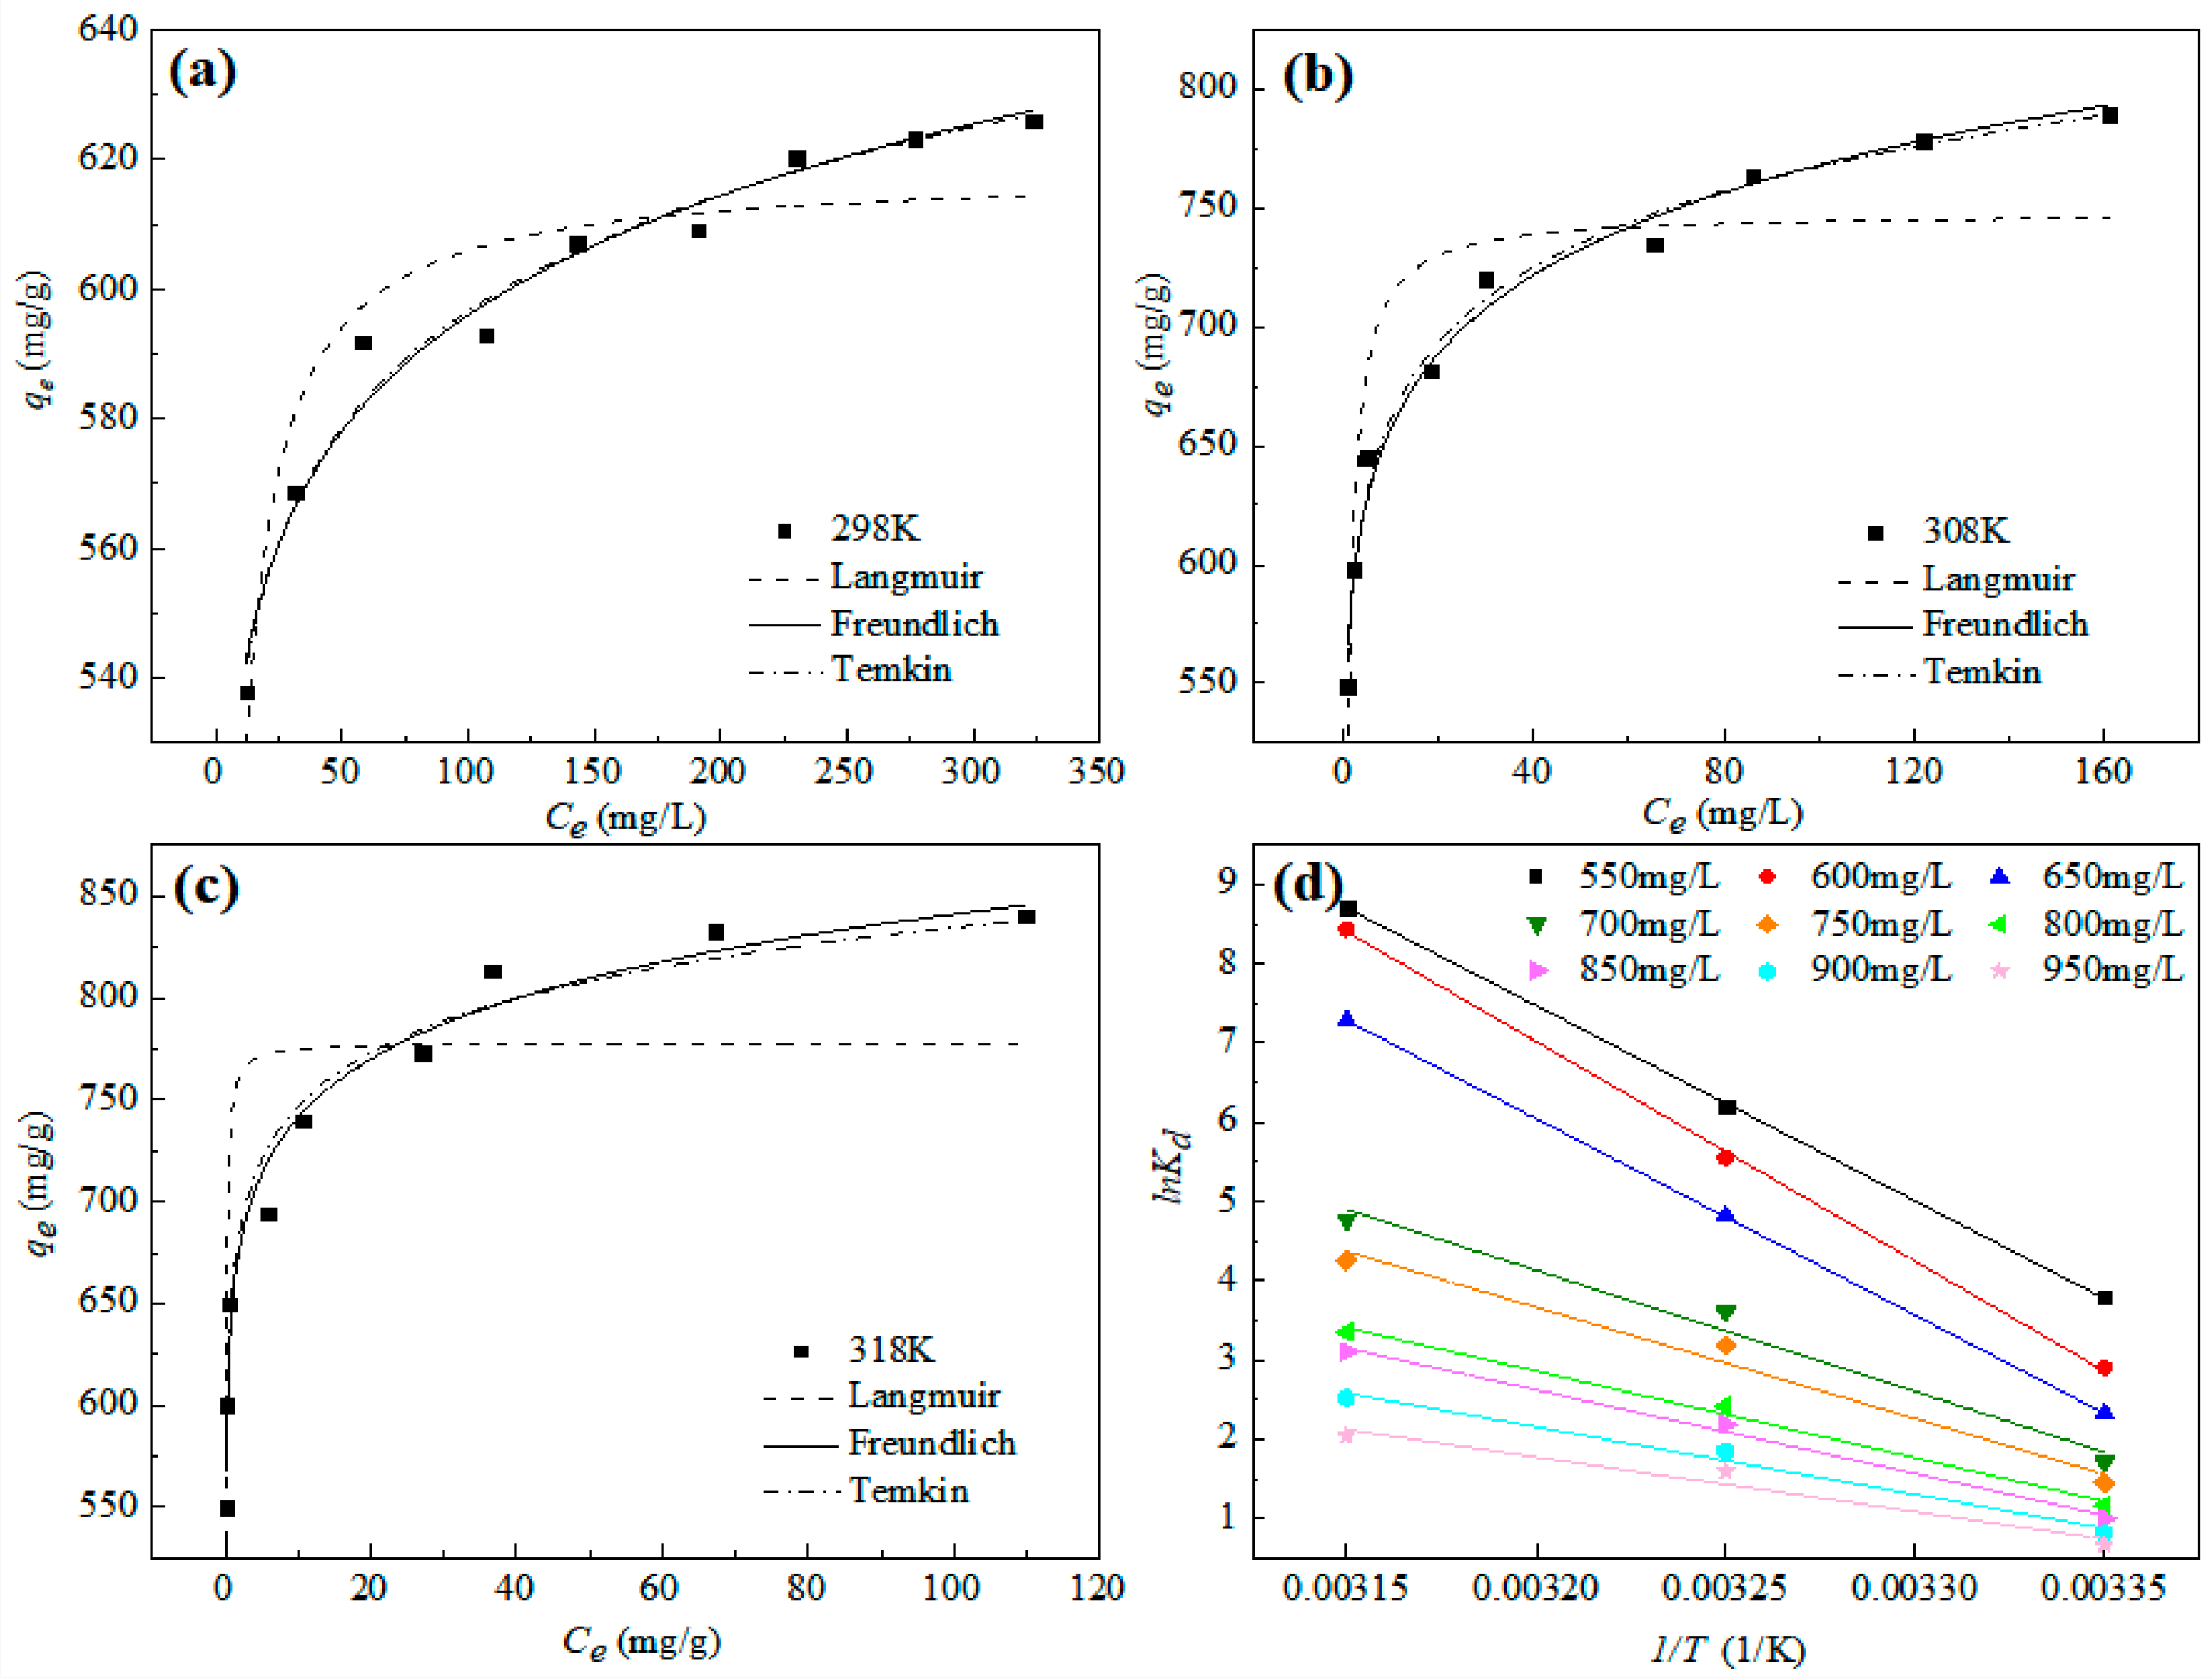
3.3.2. Adsorption Isotherms and Thermodynamic

Figure 6 shows the fitting curves of the Langmuir, Freundlich, and Temkin isothermal adsorption models for the adsorption of Pb2+ by nZVI@ATP at different initial concentrations, and the results are listed in Table 5. The Freundlich isothermal adsorption model has the largest correlation coefficient, followed by Temkin isothermal adsorption model, and Langmuir isothermal adsorption model has the worst fitting result, indicating that the adsorption of Pb2+ on nZVI@ATP could be described well by the Freundlich model. During the adsorption process, nZVI@ATP had multiple adsorption sites on its surface. The adsorption of Pb2+ was characterized by multilayer adsorption, and the adsorption strength of 1/n was between 0.0440 and 0.0680, indicating that the adsorption of Pb2+ by nZVI@ATP was easy to carry out.
Langmuir, Freundlich, and Temkin isothermal adsorption equations are shown in (5), (6), and (7), respectively.
q e = ( q m K L C e ) / ( 1 + K L C e )
q e = K F C e 1 n
q e = A l n K t C e
qe—amount of heavy metals adsorbed at equilibrium (mg/g);
qm—maximum adsorbed capacity (mg/g);
KL—Langmuir constant indicating the affinity of the binding sites for the heavy metal ions (L/mg);
KF—Freundlich adsorption coefficient (L/mg);
1 n —adsorption intensity (0.1 < nf < 1);
A, Kt—Temkin adsorption coefficient.
The thermodynamic formula of adsorption is as follows:
Δ G 0 = R T l n K d
Δ G 0 = Δ H 0 T Δ S 0
l n K d = Δ S 0 / R Δ H 0 / R T
R—the gas constant, 8.314 J/(mol K);
T—the absolute temperature, K;
ΔGo—Gibbs free energy change, kJ/mol;
ΔHo—enthalpy change, kJ/mol;
ΔSo—entropy change, J/(mol K);
Kd—the distribution coefficient of adsorption(mg/L).
The equation for calculating the apparent adsorption equilibrium constant Kd (mL/g)
K d = q e / C e
Kd—the distribution coefficient of adsorption (mL/g);
qe—amount of heavy metals adsorbed at equilibrium (mg/g);
Ce—the remained concentration (mg/L).
According to Equation (11), the adsorption equilibrium constant Kd at different initial concentrations and temperatures was calculated, and then linear fitting was carried out with 1/T as abscissa and lnKd as abscissa. The fitting results are shown in Figure 6d. The corresponding entropy change ∆S0 and enthalpy change ∆H0 were calculated according to the linear intercept and slope obtained by fitting, and the Gibbs free energy change ∆G0 was calculated by Equation (8) to discuss the influence of temperature on the adsorption process. Thermodynamic parameters are shown in Table 6.
As can be seen from Table 6, ∆G0 of nZVI@ATP’s adsorption of Pb2+ at different initial concentrations at different temperatures were all negative values, and the absolute value of ∆G0 increases with increasing temperature, indicating that the adsorption of Pb2+ by nZVI@ATP was spontaneous, and increases spontaneously with the increase in temperature, which promoted the adsorption reaction. It can provide more energy for Pb2+ to overcome the resistance caused by the diffusion electric double layer, and then be adsorbed on nZVI@ATP. ∆S0 and ∆H0 were both positive, indicating that the adsorption of nZVI@ATP to Pb2+ was an endothermic reaction with an increasing degree disorder at higher temperatures. Combined with the value of ∆H0 in Table 6, it can be concluded that the adsorption of Pb2+ by nZVI@ATP was mainly caused by chemical bond force, which again confirms the fitting results of the kinetic model.

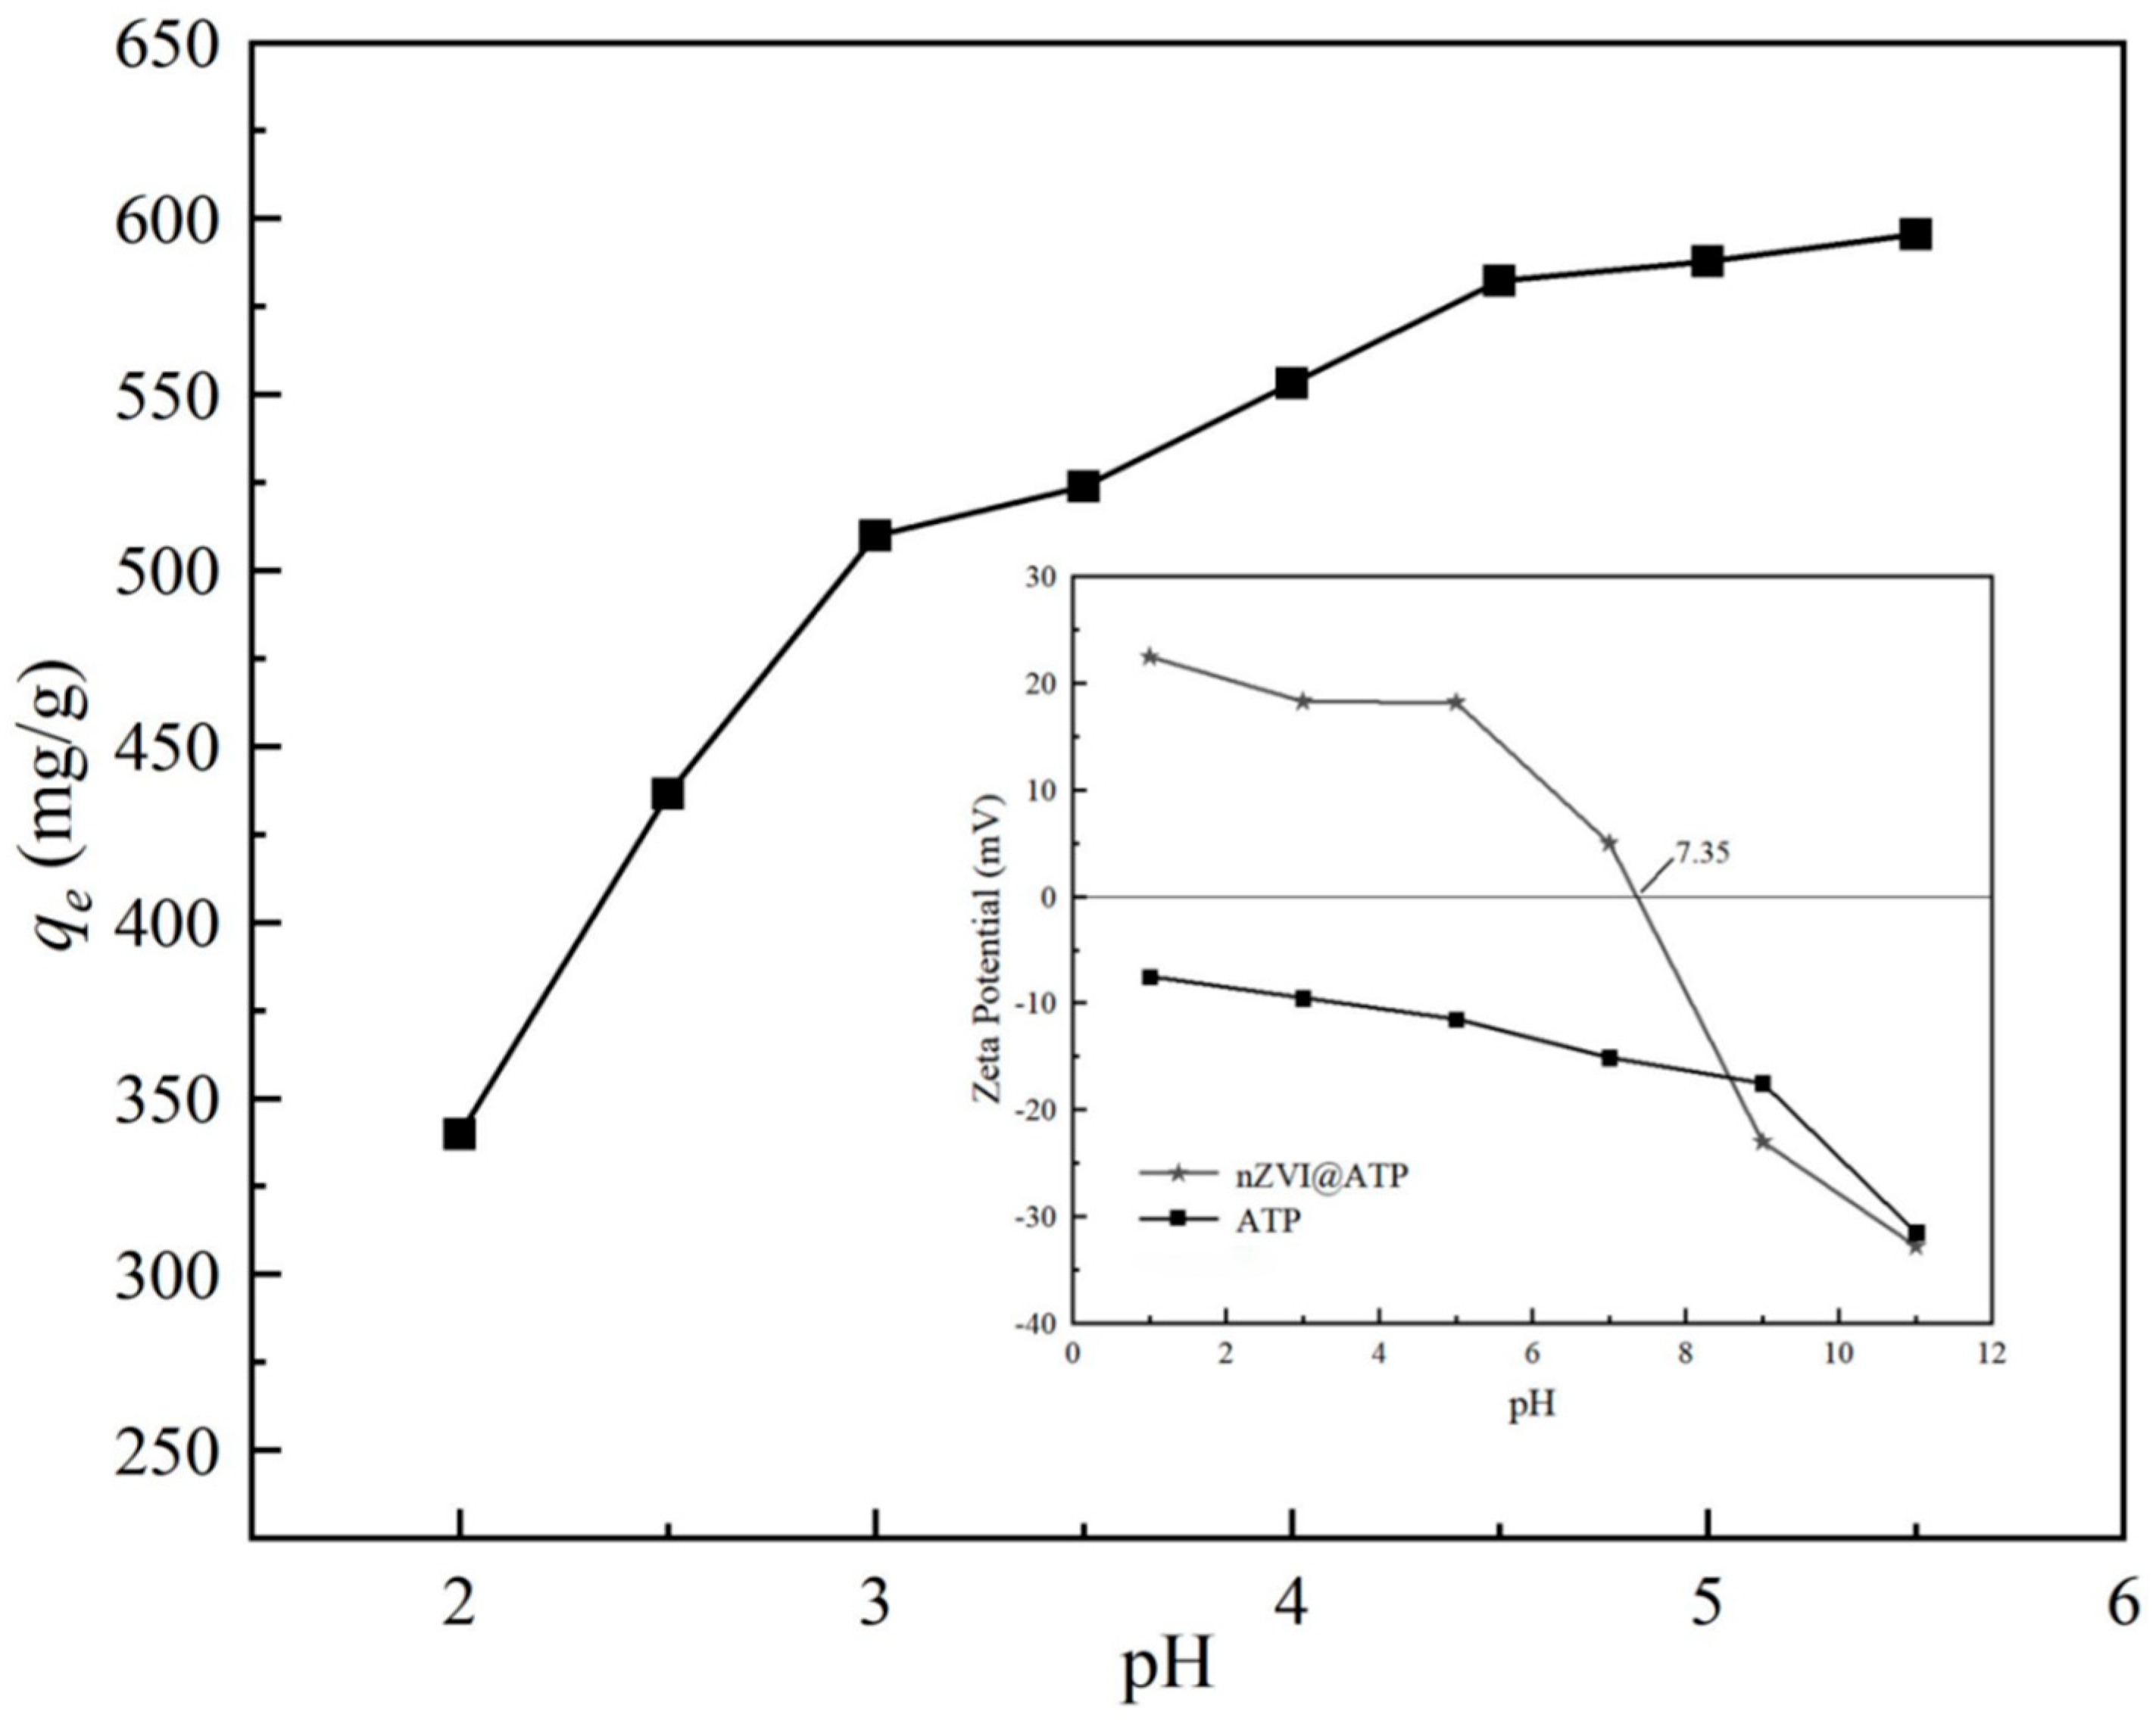
3.4. Effects of Solution pH on Pb2+ Removal Capacity

The pH value of the solution is a crucial factor for the adsorbent to remove Pb2+. At low pH, Pb mainly existed in the free state of Pb2+. When pH approaches 6, the concentration of hydroxyl (–OH) in the solution increases, leading to the precipitation of Pb(OH)2 on the surface of nZVI@ATP, affect the actual adsorption effect. Therefore, the initial pH value of the solution was set in the range of 2–5.5 when the adsorption performance of Pb2+ was studied in this experiment [33].
Figure 7 shows the change of adsorption capacity qe of nZVI@ATP to Pb2+ with pH. As can be seen from the figure, the adsorption capacity of nZVI@ATP on Pb2+ increased with increasing pH, and the adsorption trend was consistent with previous research results [34]. The adsorption capacity of the solution increased from 339.70 mg/g to 595. 50 mg/g in the pH range of 2–5.5. When pH < 3.0, the adsorption rate was less than 50%, then with the increase in pH, the adsorption rate increased to more than 85%, it can be seen that the solution pH has a direct impact on the adsorption of Pb2+ by nZVI@ATP, where strong acidic conditions are not conducive to the adsorption of Pb2+ by nZVI@ATP. The main reason is that under strong acid conditions, a large amount of H+ in the solution would compete with Pb2+ with a positive charge for vacant adsorption sites on nZVI@ATP, reducing the adsorption efficiency of nZVI@ATP. In addition, under strong acidic conditions, nano zero-valent iron would be rapidly corroded, affecting its reaction activity, resulting in poor adsorption performance. With increasing pH, the competitive effect decreased and the adsorption capacity of Pb2+ increased. In addition, the oxidation of Fe0 under weakly acidic conditions would generate a large amount of OH, improve the pH value of the solution, and promote the chemical precipitation of Pb2+ to be removed. This conclusion was confirmed in the subsequent XRD.

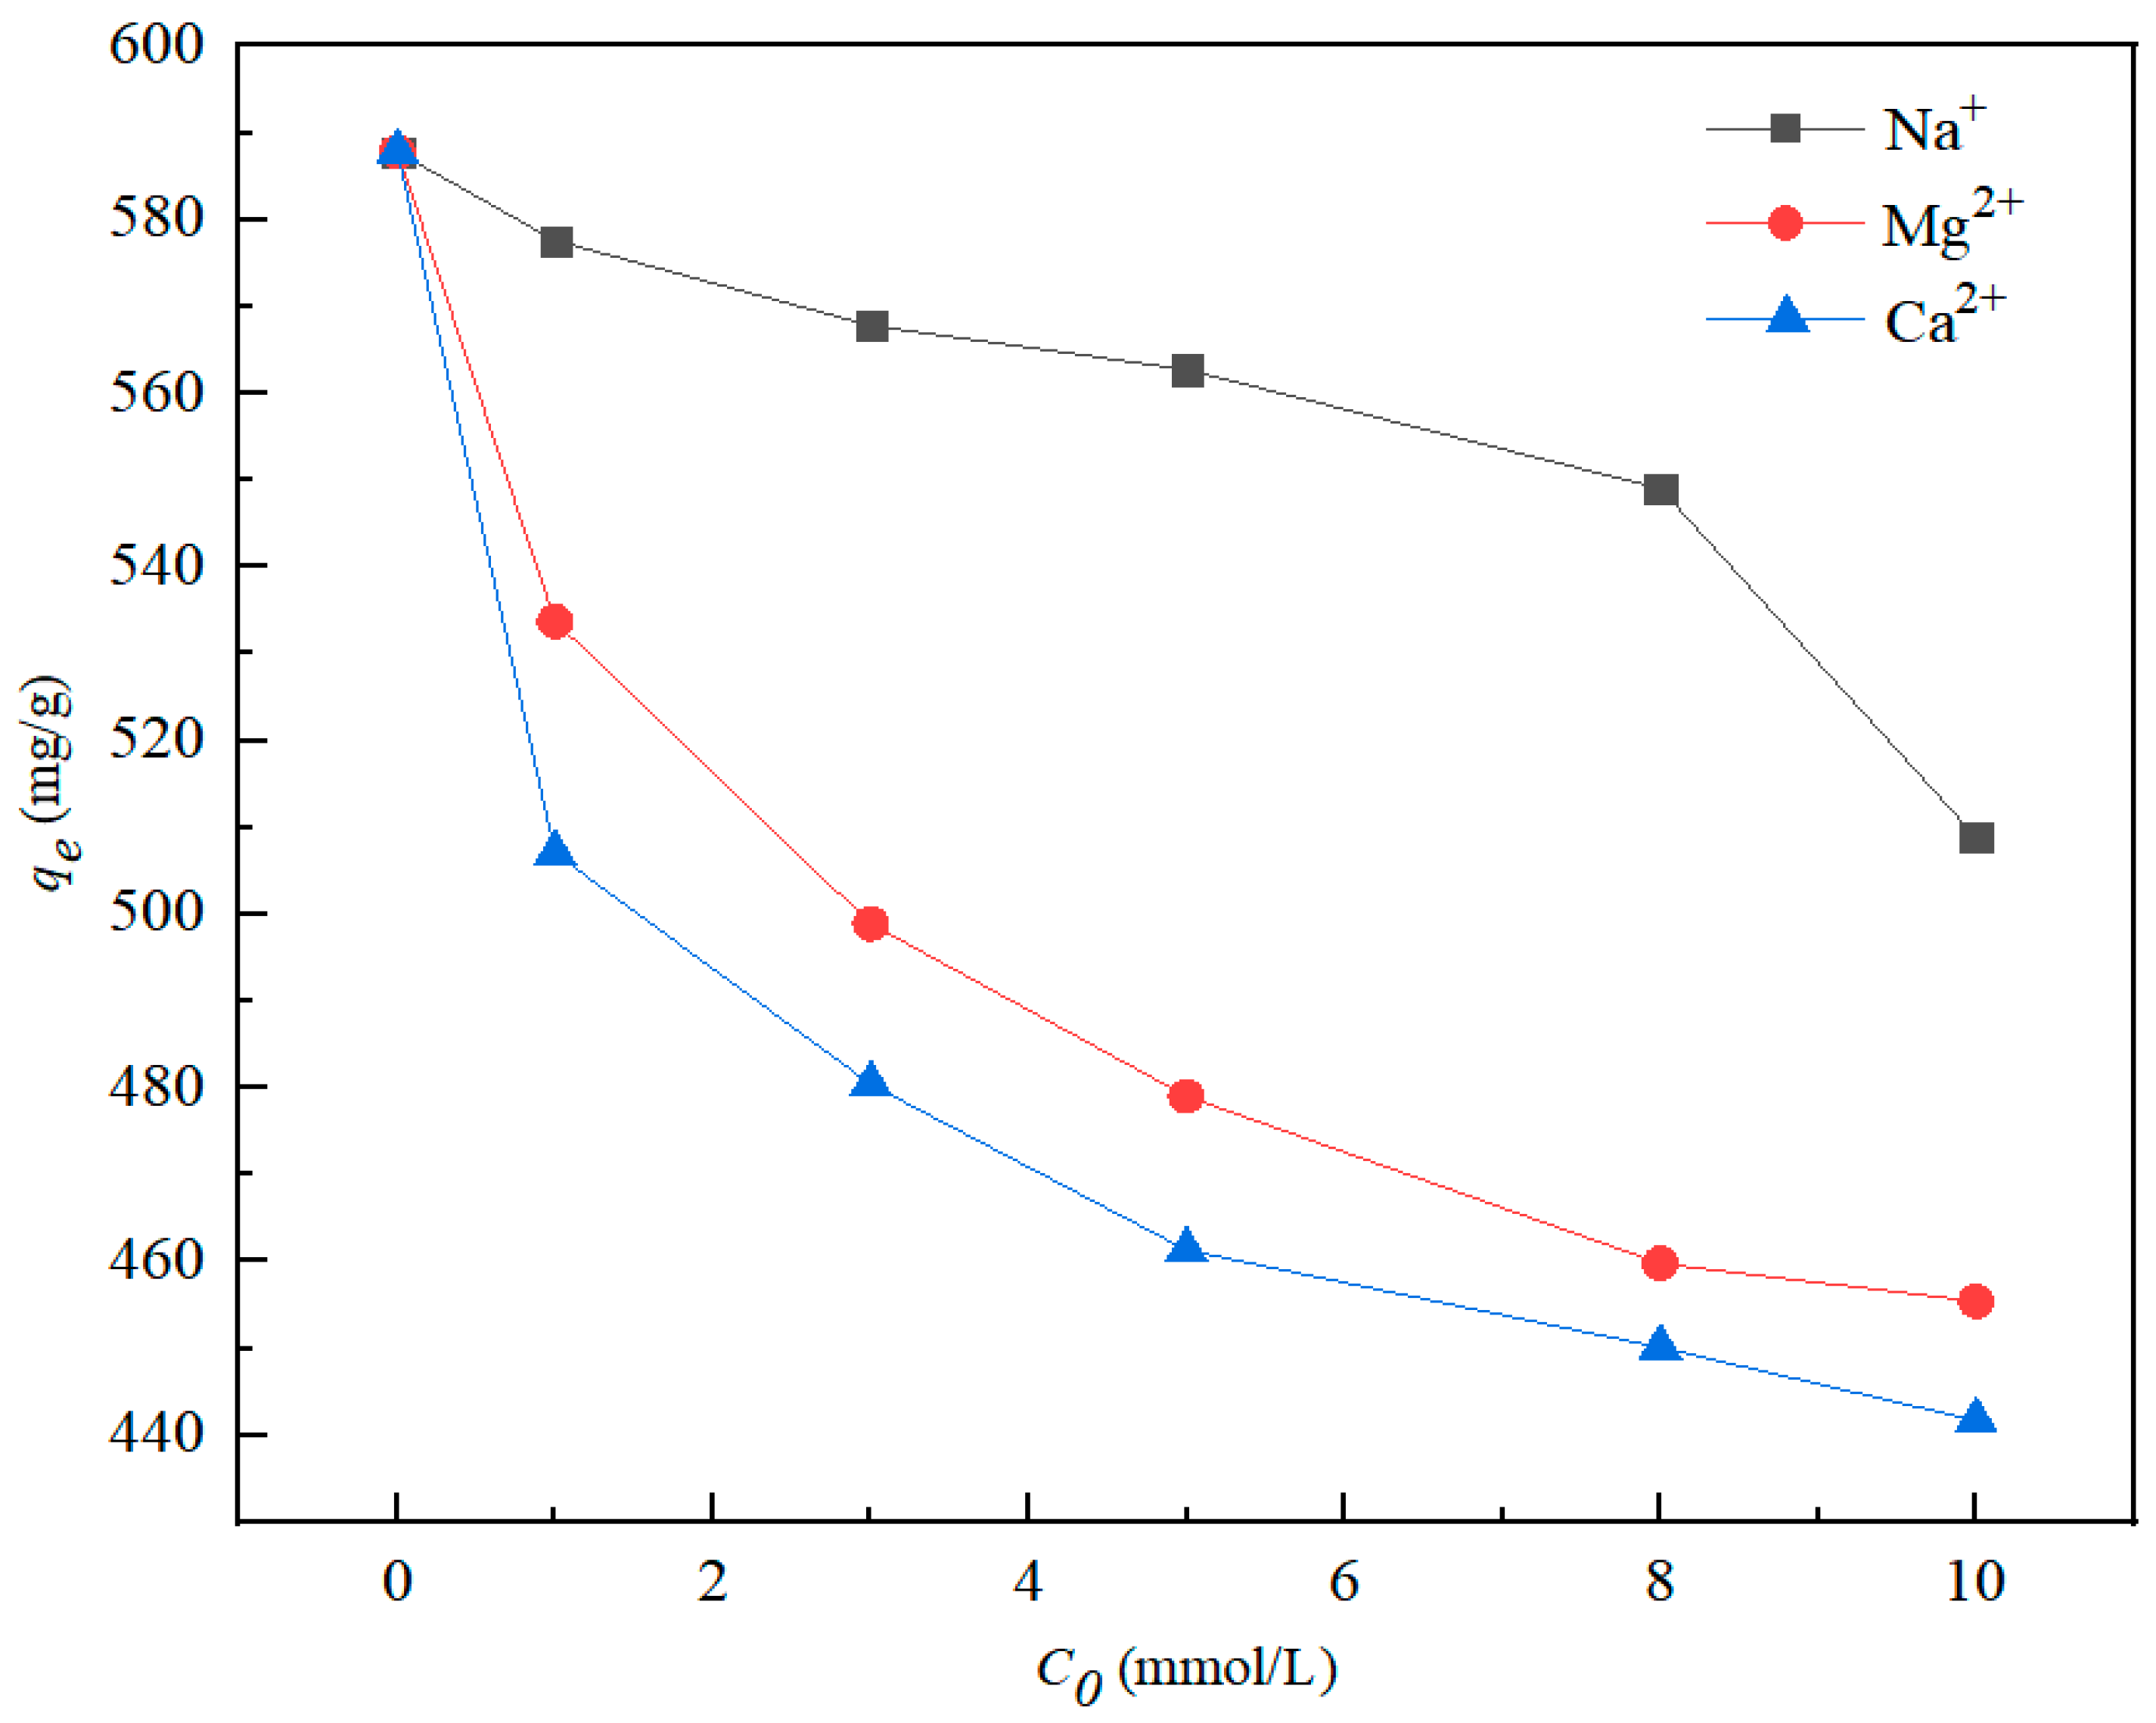
3.5. Influence of Coexisting Cations

Figure 8 shows the effects of three coexisting cations on nZVI@ATP adsorption of Pb2+. The presence of Na+, Mg2+, and Ca2+ could hinder the adsorption process of nZVI@ATP to Pb2+. When the ion concentration increased from 0 to 10 mmol, the adsorption capacity of nZVI@ATP for Pb2+ decreased from 587.8 mg/g to 508.85 mg/g (Na+), 455.40 mg/g (Mg2+) and 441.70 mg/g (Ca2+), respectively. The result shows that the adsorption of Pb2+ by nZVI@ATP decreased by 13.43% (Na+), 22.52% (Mg2+) and 24.86% (Ca2+), respectively. The three coexisting cations occupied the adsorption sites on nZVI@ATP and competed with Pb2+, reducing the adsorption efficiency of nZVI@ATP for Pb2+.

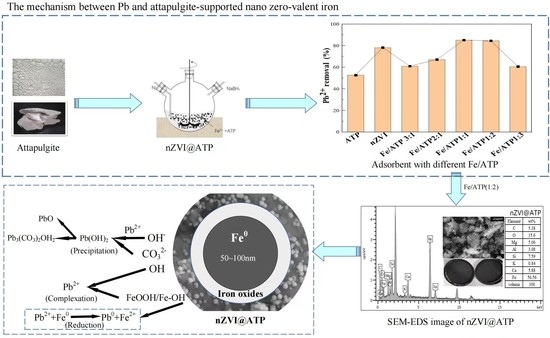
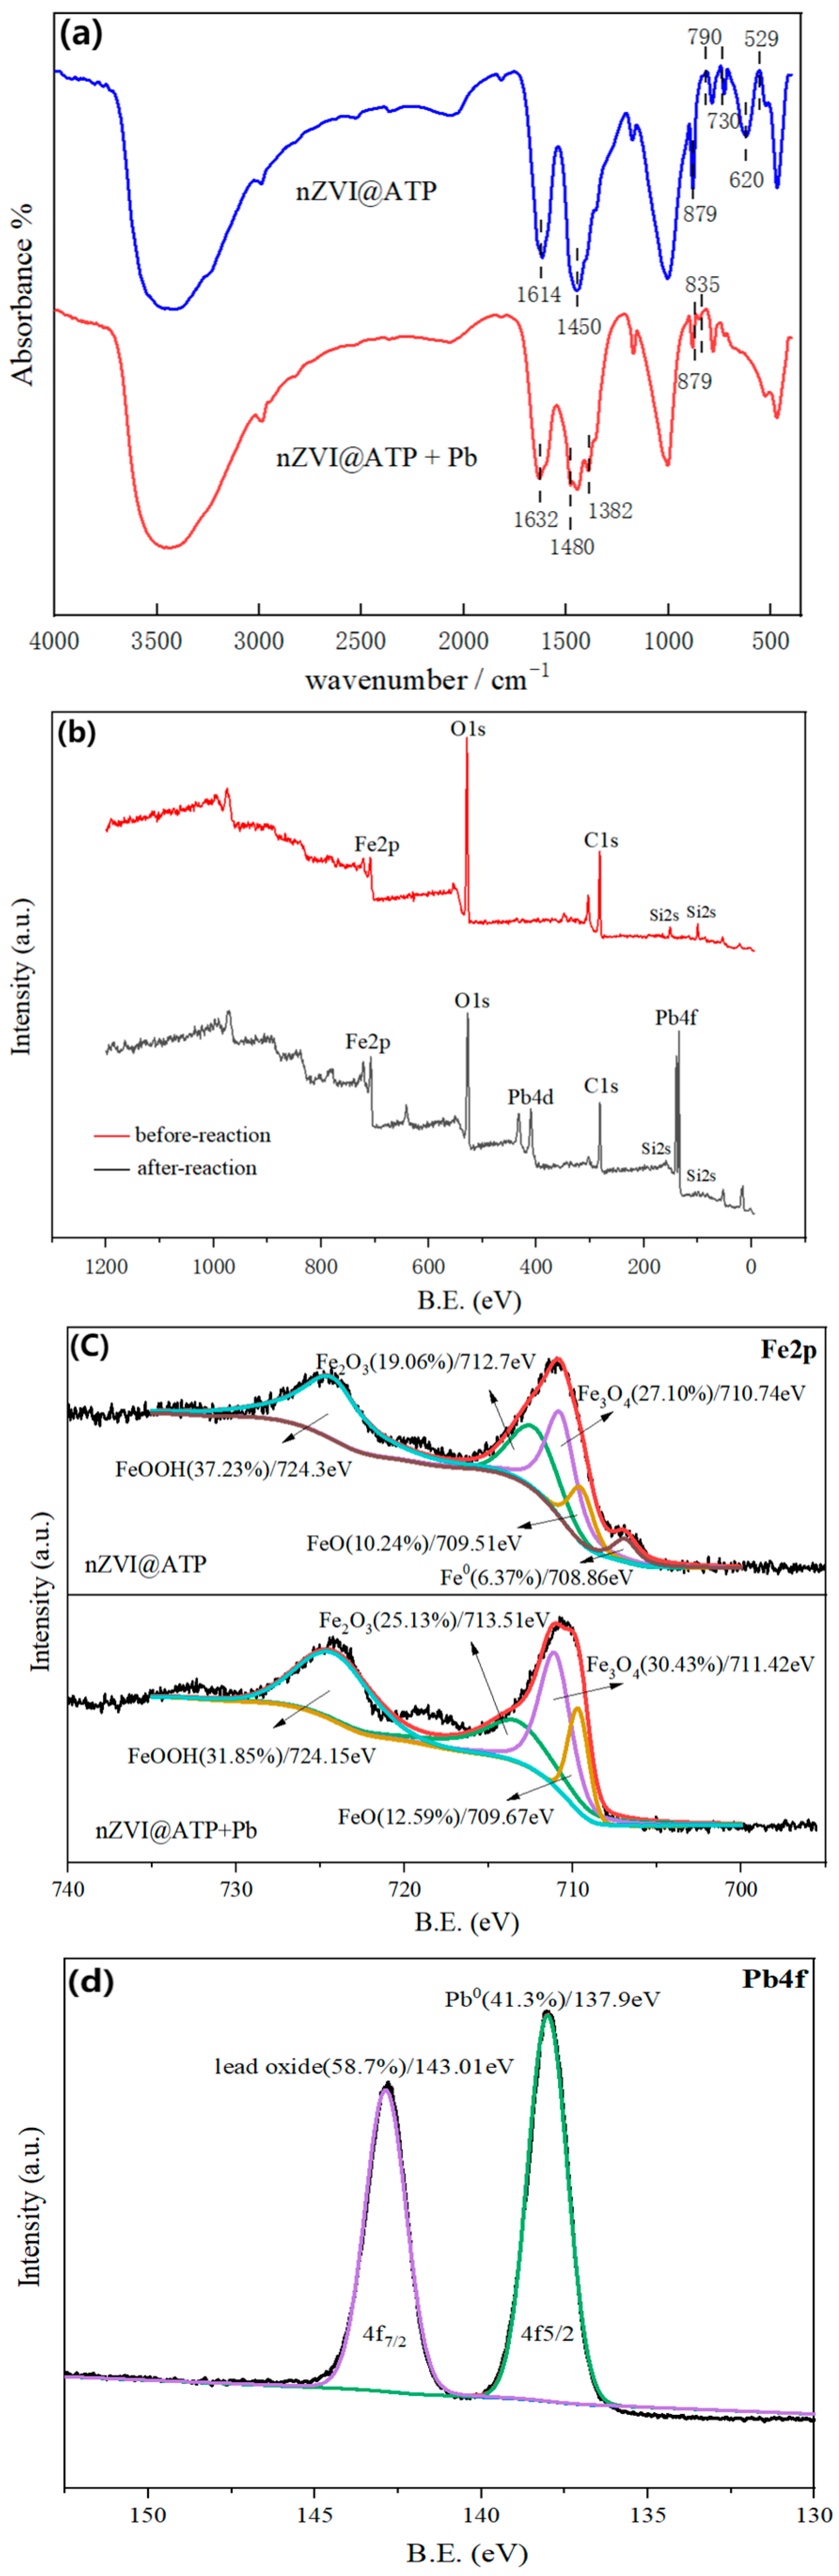
3.6. Pb2+ Removal of Mechanisms by nZVI@ATP

FT-IR diagram of nZVI@ATP before and after Pb2+ adsorption (Figure 9a) shows that the hydroxyl peak in nZVI@ATP spectrum diagram with 3404 cm−1 was wide, and the hydroxyl peak strength increased and order degree became high, mainly due to the formation of hydroxyl oxide layer on the surface of nZVI particles. The peak of nZVI@ATP at 1614 cm−1 was the stretching vibration peak of H–O–H in the moisture substructure, the sharp and strong peak between 1211 and 1543 cm−1 was the combination peak of Fe–OH and CO32−, and the new characteristic peak near 620 cm−1 corresponded to the lattice vibration peak of Fe–O in FeOOH [31,35]. This also indicates that, due to the high reactivity of nZVI, FeOOH was partially oxidized during the preparation or transfer process, which indirectly proved the successful modification of ATP by nZVI [36]. Several absorption peaks changed significantly in shape and strength before and after adsorption: the vibration peak of –OH at 1614 cm−1 shifted to 1632 cm−1, and the peak strength changed, indicating that –OH was involved in the adsorption reaction. The vibration peak at 1450 cm−1 was divided into two vibration peaks, among which the peak about 1382 cm−1 corresponded to the vibration peak of Fe–OH. The stretching vibration peak of Fe–OH was added at 835 cm−1, the characteristic peak of FeOOH previously located at 790 cm−1 shifted to 778 cm−1, and the weak peak of Fe–O decreased in the range of 730–470 cm−1, confirming the successful attachment of Fe3+ to its surface through its oxygen-containing group [31]. The formation of metal oxides on the surface of nZVI@ATP was confirmed, and the stretching vibration peak of CO32− at 730 cm−1 was significantly weakened, confirming again that CO32− was involved in the reaction [36].
XPS was used to analyze the valence state information and elemental composition of nZVI@ATP surface elements, as shown in Figure 9b. Before the reaction, the elemental composition was mainly Fe, O, C and Si, as shown in Figure 9b. After the reaction, the characteristic peak of Pb4f was detected at the position of 138.1 eV. This indicates that Pb2+ was successfully adsorbed on the surface of nZVI@ATP. As can be seen in Figure 9c, Fe0 appeared at the binding energy of 708.86 eV before nZVI@ATP reaction, which confirmed the presence of metallic iron in nZVI@ATP, indicating that nZVI was successfully loaded on ATP. nZVI@ATP corresponded to Fe2+ and Fe3+ at the positions of 710.74, 712.7, 709.51, and 724.3 eV before adsorption, which was due to iron oxides (2p3/2 and 2p1/2) formed by oxidation of nZVI surface (Fe–O) [37]. The characteristic peak of nZVI@ATP disappeared after adsorption, indicating that in the adsorption process, Fe0 participated in the reaction and converted it into iron oxide. Figure 9c shows the relative contents of different iron oxides. The relative contents of Fe2O3, FeO and Fe3O4 all increased after reaction, indicating that more iron oxides were generated during the reaction process, while the relative content of FeOOH decreased, indicating that it participated in the reaction of removing Pb2+. The Pb4f peak fitting diagram of nZVI@ATP is shown in Figure 9d, where 143.01 eV and 137.9 eV represented Pb4f7/2 and Pb4f5/2 respectively, which may be attributed to the formation of PbO, Pb(OH)2 and Pb0 [38]. The process of nZVI@ATP removing Pb2+ includes adsorption and reduction, that is, nZVI@ATP can physically adsorb Pb2+ in the solution, and then Fe0 in nZVI@ATP provides electrons to reduce Pb2+ to Pb0 [39]. Through XPS analysis, 41.3% of Pb2+ became Pb0, and the reaction equation was as follows: Fe0 + Pb2+→Fe2+ + Pb0.

4. Conclusions

nZVI@ATP has excellent adsorption performance for Pb2+, and when the ratio of iron to soil was 1:2, the removal rate of Pb solution with the initial concentration of 700 mg/L could reach 84.47% by nZVI@ATP, and the adsorption capacity was 591.29 mg/g. Through characterization analysis, it was found that nZVI presented regular smooth spherical particles with a particle size of about 50–100 nm. After loading on ATP, spherical nZVI particles were uniformly dispersed on the surface and interspaces of ATP, and the chain accumulation phenomenon was significantly weakened. The crystallinity of Fe0 in nZVI@ATP was low, some Fe0 was oxidized, and Fe3O4, FeOOH, and other substances were generated on the surface. The adsorption process of Pb2+ by nZVI@ATP conformed to the pseudo-second-order kinetic model, which indicates that the adsorption process was mainly chemical adsorption, and the speed control steps were composed of liquid film diffusion and intra-particle diffusion. The isothermal adsorption model was more suitable for the Freundlich isothermal adsorption model, which mainly consists of uneven surface adsorption. The adsorption process was a spontaneous endothermic reaction. The adsorption of nZVI@ATP to Pb2+ increased with the increase in pH in the range of 2–5.5. The presence of Na+, Mg2+, and Ca2+ could inhibit the removal of Pb2+, and the concentration of coexisting ions was inversely proportional to the adsorption capacity, among which Ca2+ has the strongest inhibition. The adsorption mechanism of nZVI@ATP to Pb2+ was mainly chemical adsorption. The removal of Pb2+ by nZVI@ATP would complex with the iron (hydrogen) oxide shell and precipitate Pb(OH)2 [38], PbO, and Pb3(CO3)2OH2 [31], and would also be reduced to Pb0 by the Fe0 core of nZVI.

Author Contributions

Project administration, Conceptualization, L.D.; Data curation, Formal analysis, Methodology, K.M.; Writing—original draft, W.Z.; Writing—review and editing, T.H.; Software, Z.L. and G.M.; Resources, X.T. and J.R. All authors have read and agreed to the published version of the manuscript.

Funding

This work was supported by the Natural Science Foundation of Ningxia Province (2022AAC03310), Open Foundation of Key Laboratory of Yellow River Environment of Gansu Province (21YRWEK007 and 21YRWEG003), the funding from the Ningxia Normal University Liupanshan Resource Engineering Technology Research Centre (GrantHGZD21-20).

Acknowledgments

The authors also acknowledge the technical support from Instrument Analysis Center of Lanzhou Jiaotong University.

Conflicts of Interest

The authors declare that they have no known competing financial interests or personal relationships that could have appeared to influence the work reported in this paper.

References

  1. Fiyadh, S.S.; Alsaadi, M.A.; Jaafar, W.Z.; Alomar, M.K.; Fayaed, S.S.; Mohd, N.S.; Hin, L.S.; EI-Shafie, A. Review on Heavy Metal Adsorption Processes By Carbon Nanotubes. J. Clean. Prod. 2019, 230, 783–793. [Google Scholar] [CrossRef]
  2. O’Connor, D.; Hou, D.; Ye, J.; Zhang, Y.; Ok, Y.S.; Song, Y.; Coulon, F.; Peng, T.; Tian, L. Lead-based paint remains a major public health concern: A critical review of global production, trade, use, exposure, health risk, and implications. Environ. Int. 2018, 121, 85–101. [Google Scholar] [CrossRef] [PubMed]
  3. Shen, Z.; Hou, D.; Zhang, P.; Wang, Y.; Zhang, Y.; Shi, P.; O’Connor, D. Lead based paint in children’s toys sold on China’s major online shopping platforms. Environ. Pollut. 2018, 241, 311–318. [Google Scholar] [CrossRef] [PubMed]
  4. Li, J.; Wang, X.X.; Zhao, G.X.; Chen, C.L.; Chai, A.F.; Alsaedi, A.; Hayat, T.; Wang, X.T. Metal-organic Framework-based Materials: Superior Adsorbents for the Capture of Toxic and Radioactive Metal Ions. Chem. Soc. Rev. 2018, 47, 2322–2356. [Google Scholar] [CrossRef] [PubMed]
  5. Lee, J.; Freeman, J.L. Zebrafish as a Model for Investigating Developmental Lead (Pb) Neurotoxicity as a Risk Factor in Adult Neurodegenerative Disease: A Mini-review. Neurotoxicology 2014, 43, 57–64. [Google Scholar] [CrossRef]
  6. Guha, T.; Barman, S.; Mukherjee, A.; Kundu, R. Nano-scale zero valent iron modulates Fe/Cd transporters and immobilizes soil Cd for production of Cd free rice. Chemosphere 2020, 260, 127533. [Google Scholar] [CrossRef]
  7. Gomes, H.I.; Fan, G.; Mateus, E.P.; Dias-Ferreira, C.; Ribeiro, A.B. Assessment of Combined Electro–nanoremediation of Molinate Contaminated Soil. Sci. Total Environ. 2014, 493, 178–184. [Google Scholar] [CrossRef]
  8. Visentin, C.; Trentin, A.S.; Braun, A.B.; Thome, A. Lifecycle Assessment of Environmental and Economic Impacts of Nano-iron Synthesis Process for Application in Contaminated Site Remediation. J. Clean. Prod. 2019, 231, 307–319. [Google Scholar] [CrossRef]
  9. Bae, S.; Collins, R.N.; Waite, T.D.; Hanna, K. Advances in surface passivation of nanoscale zerovalent iron: A critical review. Environ. Sci. Technol. 2018, 52, 12010–12025. [Google Scholar] [CrossRef]
  10. Hua, Y.; Wang, W.; Hu, N.; Gu, T.; Ling, L.; Zhang, W.X. Enrichment of uranium from wastewater with nanoscale zero-valent iron (nZVI). Environ. Sci. Nano 2021, 8, 666–674. [Google Scholar] [CrossRef]
  11. Adusei-Gyamfi, J.; Acha, V. Carriers for nano zerovalent iron (nZVI): Synthesis, application and efficiency. RSC Adv. 2016, 6, 91025–91044. [Google Scholar] [CrossRef]
  12. Fu, F.; Dionysiou, D.D.; Liu, H. The use of zero-valent iron for groundwater remediation and wastewater treatment: A review. J. Hazard. Mater. 2014, 267, 194–205. [Google Scholar] [CrossRef] [PubMed]
  13. Zhao, X.; Liu, W.; Cai, Z.; Han, B.; Qian, T.; Zhao, W.D.Y. An Overview of Preparation and Applications of Stabilized Zero-valent Iron Nanoparticles for Soil and Groundwater Remediation. Water Res. 2016, 100, 245–266. [Google Scholar] [CrossRef] [PubMed] [Green Version]
  14. Kocur, C.M.; Sleep, B.E.; O’carroll, D.M. Moving Into the Third Decade of Nanoscale zero-valent Iron (nZVI) Development: Best Practices for Field Implementation. In Nanoscale Zerovalent Iron Particles for Environmental Restoration; Springer: Cham, Switzerland, 2019; pp. 293–333. [Google Scholar] [CrossRef]
  15. Wang, S.S.; Zhao, M.; Li, Y.C.; Wang, J.; Gao, B.; Sato, S.; Feng, W.Q.; Igalavithana, A.D.; Oleszczuk, P.; Ok, Y.S.; et al. Biochar-supported nZVI (nZVI/BC) for Contaminant Removal from Soil and Water: A Critical Review. J. Hazard. Mater. 2019, 373, 820–834. [Google Scholar] [CrossRef]
  16. Guan, J.; Li, Z.X.; Chen, S.; Gu, W.X. Zero-valent iron supported on expanded graphite from spent lithium-ion battery anodes and ferric chloride for the degradation of 4-chlorophenol in water. Chemosphere 2022, 290, 133381. [Google Scholar] [CrossRef]
  17. Selvan, B.K.; Thiyagarajan, K.; Das, S.; Jaya, N.; Jabasingh, S.A.; Saravanan, P.; Rajasimman, M.; Vasseghian, Y. Synthesis and characterization of nano zerovalent iron-kaolin clay (nZVI-Kaol) composite polyethersulfone (PES) membrane for the efficacious As2O3 removal from potable water samples. Chemosphere 2022, 288, 132405. [Google Scholar] [CrossRef]
  18. Xu, Y.; Liu, Z.M.; Ma, K.X.; Qin, Q.D. Facile synthesis of high iron content activated carbon-supported nanoscale zero-valent iron for enhanced Cr(VI) removal in aqueous solution. Chemosphere 2022, 291, 132709. [Google Scholar] [CrossRef]
  19. Boudriche, L.; Calvet, R.; Hamdi, B.; Balard, H. Surface properties evolution of attapulgite by IGC analysis as a function of thermal treatment. Colloids Surf. A. 2012, 399, 1–10. [Google Scholar] [CrossRef] [Green Version]
  20. Yin, H.B.; Kong, M.; Gu, X.H.; Chen, H. Removal of Arsenic from Water by Porous Charred Granulated Attapulgite-supported Hydrated Iron Oxide in Bath and Column Modes. J. Clean. Prod. 2017, 166, 88–97. [Google Scholar] [CrossRef]
  21. Yin, H.B.; Zhu, J.C. In Situ Remediation of Metal Contaminated Lake Sediment Using Naturally Occurring, Calcium-rich Clay Mineral-based Low-cost Amendment. Chem. Eng. J. 2016, 285, 112–120. [Google Scholar] [CrossRef]
  22. Xu, L.; Liu, Y.; Wang, J.G.; Tang, Y.; Zhang, Z. Selective Adsorption of Pb2+ and Cu2+ on Amino-modified Attapulgite: Kinetic, Thermal Dynamic and DFT Studies. J. Hazard. Mater. 2021, 404, 124–140. [Google Scholar] [CrossRef] [PubMed]
  23. Huang, R.; Lin, Q.; Zhong, Q.; Zhang, X.; Wen, X.; Luo, H. Removal of Cd(II) and Pb(II) from Aqueous Solution by Modified Attapulgite Clay. Arab. J. Chem. 2020, 13, 4994–5008. [Google Scholar] [CrossRef]
  24. Devi, P.; Saroha, A.K. Utilization of Sludge Based Adsorbents for the Removal of Various Pollutants: A Review. Sci. Total Environ. 2016, 578, 16–33. [Google Scholar] [CrossRef] [PubMed]
  25. Kwak, J.H.; Islam, M.S.; Wang, S.Y.; Messele, S.A.; Naeth, M.A.; EI-Din, M.G.; Chang, S.X. Biochar Properties and Lead(II) Adsorption Capacity Depend on Feedstock Type, Pyrolysis Temperature, and Steam Activation. Chemosphere 2019, 231, 393–404. [Google Scholar] [CrossRef]
  26. Trazzi, P.A.; Leahy, J.; Hayes, M.H.B.; Kwapinski, W. Adsorption and desorption of phosphate on biochar. J. Environ. Chem. Eng. 2016, 4, 37–46. [Google Scholar] [CrossRef]
  27. Arshadi, M.; Soleymanzadeh, M.; Salvacion, J.; SalimiVahid, F. Nanoscale zerovalent iron (NZVI) supported on sineguelas waste for Pb(II) removal from aqueous solution: Kinetics, thermodynamic and mechanism. J. Colloid Interf. Sci. 2014, 426, 241–251. [Google Scholar] [CrossRef]
  28. Xavier, K.C.M.; Santos, M.; Santos, M.; Oliveira, M.; Carvalho, M.; Osajima, J.A.; Filho, E. Effects of Acid Treatment on the Clay Palygorskite: XRD, Surface Area, Morphological and Chemical Composition. Mater. Res. Bull. 2014, 17, 3–8. [Google Scholar] [CrossRef]
  29. Kim, S.A.; Kamala-Kannan, S.; Lee, K.J.; Park, Y.J.; Shea, P.J.; Lee, W.H.; Kim, H.M.; Oh, B.T. Removal of Pb(II) from aqueous solution by a zeolite–nanoscale zero-valent iron composite. Chem. Eng. J. 2013, 217, 54–60. [Google Scholar] [CrossRef] [Green Version]
  30. Zhang, X.; Lin, S.; Lu, X.Q.; Chen, Z.L. Removal of Pb(II) from water using synthesized kaolin supported nanoscale zero-valent iron. Chem. Eng. J. 2010, 163, 243–248. [Google Scholar] [CrossRef]
  31. Yang, F.; Zhang, S.; Sun, Y.; Cheng, K.; Li, J.; Tsang, D. Fabrication and Characterization of Hydrophilic Corn Stalk Biochar-supported Nanoscale zero-valent Iron Composites for Efficient Metal Removal. Bioresour. Technol. 2018, 265, 490–497. [Google Scholar] [CrossRef]
  32. Wang, J.; Liu, G.J.; Li, T.; Zhou, C. Physicochemical studies toward the removal of Zn( II ) and Pb( II ) ions through adsorption on montmorillonite-supported zero-valent ironnanoparticles. RSC Adv. 2015, 5, 29859–29871. [Google Scholar] [CrossRef]
  33. Lakkaboyana, S.K.; Khantong, S.; Asmel, N.K.; Obaidullah, S.; Kumar, V.; Kannan, K.; Venkateswarlu, K.; Yuzir, A.; Yaacob, W.Z.W. Indonesian Kaolin supported nZVI (IK-nZVI) used for the an efficient removal of Pb(II) from aqueous solutions: Kinetics, thermodynamics and mechanism. J. Environ. Chem. Eng. 2021, 9, 106483. [Google Scholar] [CrossRef]
  34. Shang, Z.; Zhang, L.W.; Zhao, X.; Liu, S.; Li, D. Removal of Pb(II), Cd(II) and Hg(II) from Aqueous Solution by Mercapto-modified Coal Gangue. J. Environ. Manag. 2019, 231, 391–396. [Google Scholar] [CrossRef] [PubMed]
  35. Qu, J.H.; Liu, Y.; Cheng, L.; Jiang, Z.; Zhang, G.S.; Deng, F.X.; Wang, L.; Han, W.; Zhang, Y. Green synthesis of hydrophilic activated carbon supported sulfide nZVI for enhanced Pb(II) scavenging from water: Characterization, kinetics, isotherms and mechanisms. J. Hazard. Mater. 2021, 403, 123607. [Google Scholar] [CrossRef] [PubMed]
  36. Sun, Y.; Ding, C.; Cheng, W.; Wang, X. Simultaneous adsorption and reduction of U (VI) on reduced graphene oxide-supported nanoscale zerovalent iron. J. Hazard. Mater. 2014, 280, 399–408. [Google Scholar] [CrossRef] [PubMed]
  37. Xiao, F.; Li, W.; Fang, L.; Wang, D. Synthesis of akageneite (beta-FeOOH)/reduced graphene oxide nanocomposites for oxidative decomposition of 2-chlorophenol by Fenton-like reaction. J. Hazard. Mater. 2016, 308, 11–20. [Google Scholar] [CrossRef] [PubMed]
  38. Park, M.H.; Jeong, S.; Lee, G.; Park, H.; Kim, J. Removal of aqueous-phase Pb(II), Cd(II), As(III), and As(V) by nanoscale zero-valent iron supported on exhausted coffee grounds. Waste Manag. 2019, 92, 49–58. [Google Scholar] [CrossRef]
  39. Jiao, W.Z.; Song, Y.; Zhang, D.S.; Chang, G.Z.; Fan, H.L.; Liu, Y.Z. Nanoscale zero-valent iron modified with carboxymethyl cellulose in an impinging stream-rotating packed bed for the removal of lead(II). Adv. Powder Technol. 2019, 30, 2251–2261. [Google Scholar] [CrossRef]
Figure 1. SEM image of (a) ATP, (b) nZVI@ATP, (c) nZVI@ATP + Pb; and EDS image of (d) ATP, (e) nZVI@ATP, (f) nZVI@ATP + Pb.
Nanomaterials 12 01591 g001
Figure 2. XRD patterns of nZVI@ATP, nZVI@ATP + Pb before (a) and after (b) adsorption.
Nanomaterials 12 01591 g002
Figure 3. Nitrogen adsorption–desorption curve of nZVI@ATP.
Nanomaterials 12 01591 g003
Figure 4. The removal rates of Pb2+ using different adsorbents.
Nanomaterials 12 01591 g004
Figure 5. Adsorption kinetics for Pb2+ adsorption on nZVI@ATP: (a) kinetic model; (b) intra-particle diffusion model. Adsorption conditions: Pb2+ concentration = 700 mg/L, adsorption time = 0–24 h, pH = 5.0 ± 0.2, temperature = 298 K, adsorbent dose = 1.0 g/L, solution volume = 30 mL. The black squares in the figure stand for experimental data.
Nanomaterials 12 01591 g005
Figure 6. Adsorption isotherms and fitted models of nZVI@ATP for the removal of Pb2+: (a) 298 K, (b) 308 K, (c) 318 K, (d) Van t’ Hoff curve. Adsorption conditions: Pb2+ concentration = 50–450 mg/L, adsorption time = 24 h, pH = 5.0 ± 0.2, temperature = 298–318 K, adsorbent dose = 1.0 g/L, solution volume = 30 mL.
Nanomaterials 12 01591 g006
Figure 7. Effects of initial pH on the adsorption capacity of nZVI@ ATP for the removal of Pb2+. Adsorption conditions: Pb2+ concentration = 700 mg/L, adsorption time = 24 h, pH = 2.0–6.0 ± 0.2, temperature = 298 K, adsorbent dose = 1.0 g/L, solution volume = 30 mL. The inset in the figure caption shows the Zeta potential of ATP and nZVI@ATP as a function of pH; The black squares in the figure stand for experimental data.
Nanomaterials 12 01591 g007
Figure 8. Removal efficiency of coexisting Pb2+ from water with different coexisting Na+ (0–10 mmol/L), Mg2+(0–10 mmol/L) and Ca2+(0–10 mmol/L). Adsorption conditions: Pb2+ concentration = 700 mg/L, adsorption time = 24 h, pH = 5.0 ± 0.2, temperature = 298 K, adsorbent dose = 1.0 g/L, solution volume = 30 mL.
Nanomaterials 12 01591 g008
Figure 9. (a) FT-IR survey spectra of ATP before and after adsorption. (b) XPS survey spectra of nZVI@ATP before and after adsorption. (c) High-resolution XPS scan spectra over Fe2p of nZVI@ATP before and after adsorption. (d) High-resolution XPS scan spectra over Pb4f of nZVI@ATP.
Nanomaterials 12 01591 g009
Table 1. Pore structure parameter of nZVI@ATP.
SamplenZVI@ATP
BET Surface area (m2/g)25.413
BJH Adsorption cumulative surface area of pores (m2/g)19.993
Single point adsorption total pore volume of pores (cm3/g)4.593 × 10−2
BJH Adsorption cumulative volume of pores (cm3/g)4.391 × 10−2
Adsorption average pore width (4V/A by BET) (nm)7.229
Table 2. Comparison of Pb2+ adsorption performance under the action of different adsorbents.
SampleCarrierC0
(mg/L)
T (K)pHDosage (g/L)Qt
(mg/g)
Ref.
Zeolite and nanoscale zero-valent ironZeolite1003084196.2[29]
Kaolin supported nZVIKaolin500303.15*5440.5[30]
nZVI-HCSHydrophilic
corn stalk
5029870.25195.1[31]
Montmorillonite-supported nZVIMontmorillonite502985510.65[32]
nZVI@ATPATP70029851578.77This work
Note: * indicates that the initial pH of the solution has not been adjusted.
Table 3. Kinetics adsorption parameters of Pb2+ on nZVI@ATP.
C0Pseudo-First-Order Kinetic ModelPseudo-Second-Order Kinetic Model
qm1k1R12qm2k2R22
700 mg/L554.06313.31730.7701578.77270.00980.9614
Note: qm1 (mg/g) is the theoretical adsorption capacity obtained by fitting the pseudo-first-order kinetic model; qm2 (mg/g) is the theoretical adsorption capacity obtained by fitting the pseudo-second-order kinetic model; k1 (g/(mg·h)) is the pseudo-first-order rate constant; k2 (g/(mg·h)) is the pseudo-second-order rate constant.
Table 4. Intra-particle diffusion parameters of Pb2+ on nZVI@ATP.
C0kd1E1R2kd2E2R2
700 mg/L124.4606324.71250.93567.8813546.94070.9761
Note: C0 (mg/L) is the initial concentration of heavy metals; Kdi (mg/(g·h1/2)) is the intra-particle diffusion rate constant; Ei (mmol/g) is the intercept, i represents phase i, i = 1 or 2.
Table 5. Langmuir, Freundlich and Temkin adsorption isotherm parameters for Pb2+ on nZVI@ATP.
T/KLangmuirFreundlichTemkin
qmKLR2KF 1 n R2AKtR2
298618.15460.49350.8909486.68240.04400.973025.85221.0512 × 1080.9759
308747.86792.00960.8456561.52420.06800.984246.15291.6551 × 1050.9887
318777.681024.20990.7725653.33600.05480.971038.01063.4127 × 1070.9678
Note: qm (mg/g) is the maximum adsorbed capacity; KL (L/mg) is the Langmuir constant indicating the affinity of the binding sites for the heavy metal ions; KF (L/mg) is the Freundlich adsorption coefficient; 1/n is the adsorption intensity; A, Kt is the Temkin adsorption coefficient.
Table 6. Thermodynamic parameters for Pb2+ on nZVI@ATP.
KdC0
(mg/L)
ΔHo
(kJ/mol)
ΔSo
(J/(mol·K))
ΔGo (kJ/mol)
298 K308 K318 K
Kd = qe/Ce
(mL/g)
550204.876717.688−8.995−16.172−23.349
600230.271795.176−6.692−14.643−22.595
650206.058709.607−5.405−12.501−19.597
700127.144441.172−4.325−8.737−13.149
750116.786404.169−3.657−7.698−11.740
80091.081315.223−2.856−6.008−9.160
85087.577302.014−2.423−5.443−8.463
90070.817244.507−2.046−4.491−6.936
95057.215197.816−1.734−3.712−5.691
Note: Kd (mL/g) is the distribution coefficient of adsorption; C0 (mg/L) is the initial concentration of heavy metals; ΔHo (kJ/mol) is the enthalpy change; ΔSo (J/(mol·K)) is the entropy change; ΔGo (kJ/mol) is the Gibbs free energy change.
Publisher’s Note: MDPI stays neutral with regard to jurisdictional claims in published maps and institutional affiliations.

