Article

Photoelectrochemical Performance of Nanotubular Fe2O3–TiO2 Electrodes under Solar Radiation

Faculty of Chemistry, Jagiellonian University, Gronostajowa 2, 30-387 Krakow, Poland
*
Authors to whom correspondence should be addressed.
Nanomaterials 2022, 12(9), 1546; https://doi.org/10.3390/nano12091546
Submission received: 30 March 2022 / Revised: 18 April 2022 / Accepted: 28 April 2022 / Published: 3 May 2022
(This article belongs to the Special Issue Functional Nanostructured Materials—from Synthesis to Applications)

Abstract

:
Fe2O3–TiO2 materials were obtained by the cathodic electrochemical deposition of Fe on anodic TiO2 at different deposition times (5–180 s), followed by annealing at 450 °C. The effect of the hematite content on the photoelectrochemical (PEC) activity of the received materials was studied. The synthesized electrodes were characterized by field emission scanning electron microscopy (FE-SEM), energy dispersive spectroscopy (EDS), X-ray diffraction (XRD), Raman spectroscopy, diffuse reflectance spectroscopy (DRS), Mott–Schottky analysis, and PEC measurements. It was shown that the amount of deposited iron (ca. 0.5 at.%–30 at.%) and, consequently, hematite after a final annealing increased with the extension of deposition time and directly affected the semiconducting properties of the hybrid material. It was observed that the flat band potential shifted towards more positive values, facilitating photoelectrochemical water oxidation. In addition, the optical band gap decreased from 3.18 eV to 2.77 eV, which resulted in enhanced PEC visible-light response. Moreover, the Fe2O3–TiO2 electrodes were sensitive to the addition of glucose, which indicates that such materials may be considered as potential PEC sensors for the detection of glucose.

Graphical Abstract

1. Introduction

In recent years, there is a growing interest in the connecting of two semiconductors (generally, TiO2 and Fe2O3) both exhibiting properties such as good chemical stability, non-toxicity, light absorption, and appropriate band alignment [1,2,3,4,5] as this allows their use in the preparation of hybrid materials that absorb radiation of a wide range of wavelengths. Among the methods of combining these oxides, electrodeposition has attracted attention because of its simplicity, affordability, and in most cases, the reasonable speed and easy control of its operating conditions [6,7]. This synthesis method can be carried out as anodic [8], cathodic [8], and pulsed/potential cycling electrodeposition [9]. It is widely recognized that electrodeposition conditions such as the composition of the deposition bath, its pH, temperature, applied potential, and the process duration affect the formation of different surface morphologies, which in turn might impact the photoelectrochemical (PEC) activity of nanostructured electrodes [10].
The summary of nanostructured hybrid materials based on Fe/Fe2O3 and TiO2 synthesized by electrochemical deposition is presented in Table 1.
For instance, Mohapatra et al. [11] obtained Fe2O3–TiO2 composites by using the pulsed technique for electrodeposition of iron inside TiO2 nanotubes, followed by high-temperature transformation of deposited Fe into Fe2O3 in an oxygen atmosphere. It was found that by changing the applied current density, deposition time, and duty cycle, Fe2O3 nanorods with a diameter of 80–90 nm and a length of up to 550 nm could be obtained within anodic TiO2 nanotubes. Moreover, Liang et al. [12] deposited two types of hematite nanoparticles on the TiO2 surface: sphere-like large particles (500 ± 10 nm) and sub-particles with a smaller diameter. The distribution density of sub-particles at the TiO2 surface increased when the higher potential was applied, and their shape and size were controllable by the applied potential and time. On the other hand, Jeon et al. [13] proposed a combination of two techniques, (i) impregnation of anodic TiO2 in an iron (III) chloride solution and (ii) electrochemical deposition, to obtain Fe2O3–TiO2. It was found that 1 h immersion followed by potential cycling in an electrolyte containing 5 mM sodium fluoride, 0.1 M sodium chloride, 1 M hydrogen peroxide, and 5 mM iron (III) chloride causes the formation of hematite particles of 20–30 nm in diameter at the mouth of TiO2 nanotubes, while 24 h immersion resulted in completely filling of the interior of the nanotubes, and a cap top layer was even formed. What is more, the obtained hybrid materials were tested for PEC water splitting. The improved PEC properties (1 mA cm−3 at 1.0 V vs. SCE in 0.1 M Na2SO4, under visible light) were observed for the material immersed for 24 h before electrodeposition. Cong et al. [14] used a similar strategy to deposit Fe2O3 nanoparticles (with an average diameter of 35 nm) at the mouths, tube walls, and bottoms of TiO2 nanotubes. The synthesis procedure included a few alternating cycles of soaking TiO2 nanotubes in a 0.05 M ferric nitrate aqueous solution for 10 min, and electrochemical reduction in a supporting electrolyte containing sodium sulfate. Furthermore, Cong et al. [15] compared the above-obtained materials with anodic TiO2 samples impregnated in an aqueous suspension of 5 mg cm−3 α-Fe2O3 nanoparticles. It was observed that the material obtained by electrodeposition showed a higher distribution density of smaller hematite particles on the surface, which may be responsible for the enhanced PEC properties. The electrodeposited samples showed a higher phenol removal efficiency and better visible light response. What is more, it was shown that such a modification improved the interfacial charge transport of the TiO2 nanotubes. Ren et al. [16] used an electrodeposition method to obtain Fe–TiO2 hybrid materials for PEC and photocatalytic applications. As reported, with increasing bias voltages from 0.5 to 2.0 V vs. Ag/AgCl (3 M KCl), the average photocurrent densities under UV and visible light irradiation measured in a 1 M urea solution increased from 17.65 to 201.85 mA m−2, respectively. On the other hand, Tsui et al. [17] noticed that for a prolonged deposition time, more Fe2O3 nanoparticles cover the surface of the TiO2 nanotubes, and, as a consequence, the UV and visible light PEC efficiencies increased to 5% and 1%, respectively. Additionally, Chin et al. [18] studied the effect of the applied potential during the electrodeposition of iron on the visible light absorption of Fe–TiO2 hybrid materials. It was shown that for higher applied potentials (3 or 4 V), lower light adsorption was observed due to the full coverage of the mouth of the TiO2 nanotubes by the Fe particles, which drastically influenced the PEC properties.
It is worth highlighting that the comprehensive characterization of semiconducting properties (such as band gap energy, flat band potential, charge density, and conduction band potential) is an important aspect of the study of photoanode materials. What is more, it should be emphasized that those properties (e.g., donor density and flat band potential [19]) of the anodic TiO2 substrate itself are affected by different oxide thicknesses, pore sizes, wall thicknesses [20], and post-heat-treatment conditions [21,22] due to changes in the oxide morphology, crystallinity, and composition [19,20,21,22,23,24,25,26]. For this reason, a particular emphasis should be put on the systematic study of the semiconducting properties of Fe2O3–TiO2 materials.
Therefore, in this paper, Fe2O3–TiO2 hybrid materials were synthesized by the cathodic electrodeposition of iron at different durations (5–180 s), followed by annealing at 450 °C in air. A complex characterization (SEM/EDS, XRD, Raman spectroscopy, UV-Vis DRS) of the obtained hybrid materials was performed. Additionally, for the first time, a detailed investigation of the semiconducting properties of Fe2O3–TiO2 electrodes was provided. Moreover, the PEC water-splitting experiments were carried out under solar and monochromatic illumination. The obtained results were compared with a similar material received by impregnation of anodic titanium oxide in a 100 mM FeCl3 solution, the full characterization of which was previously reported [27,28]. Furthermore, the synthesized materials were also tested for the first time as potential non-enzymatic PEC sensors for the determination of glucose.

2. Materials and Methods

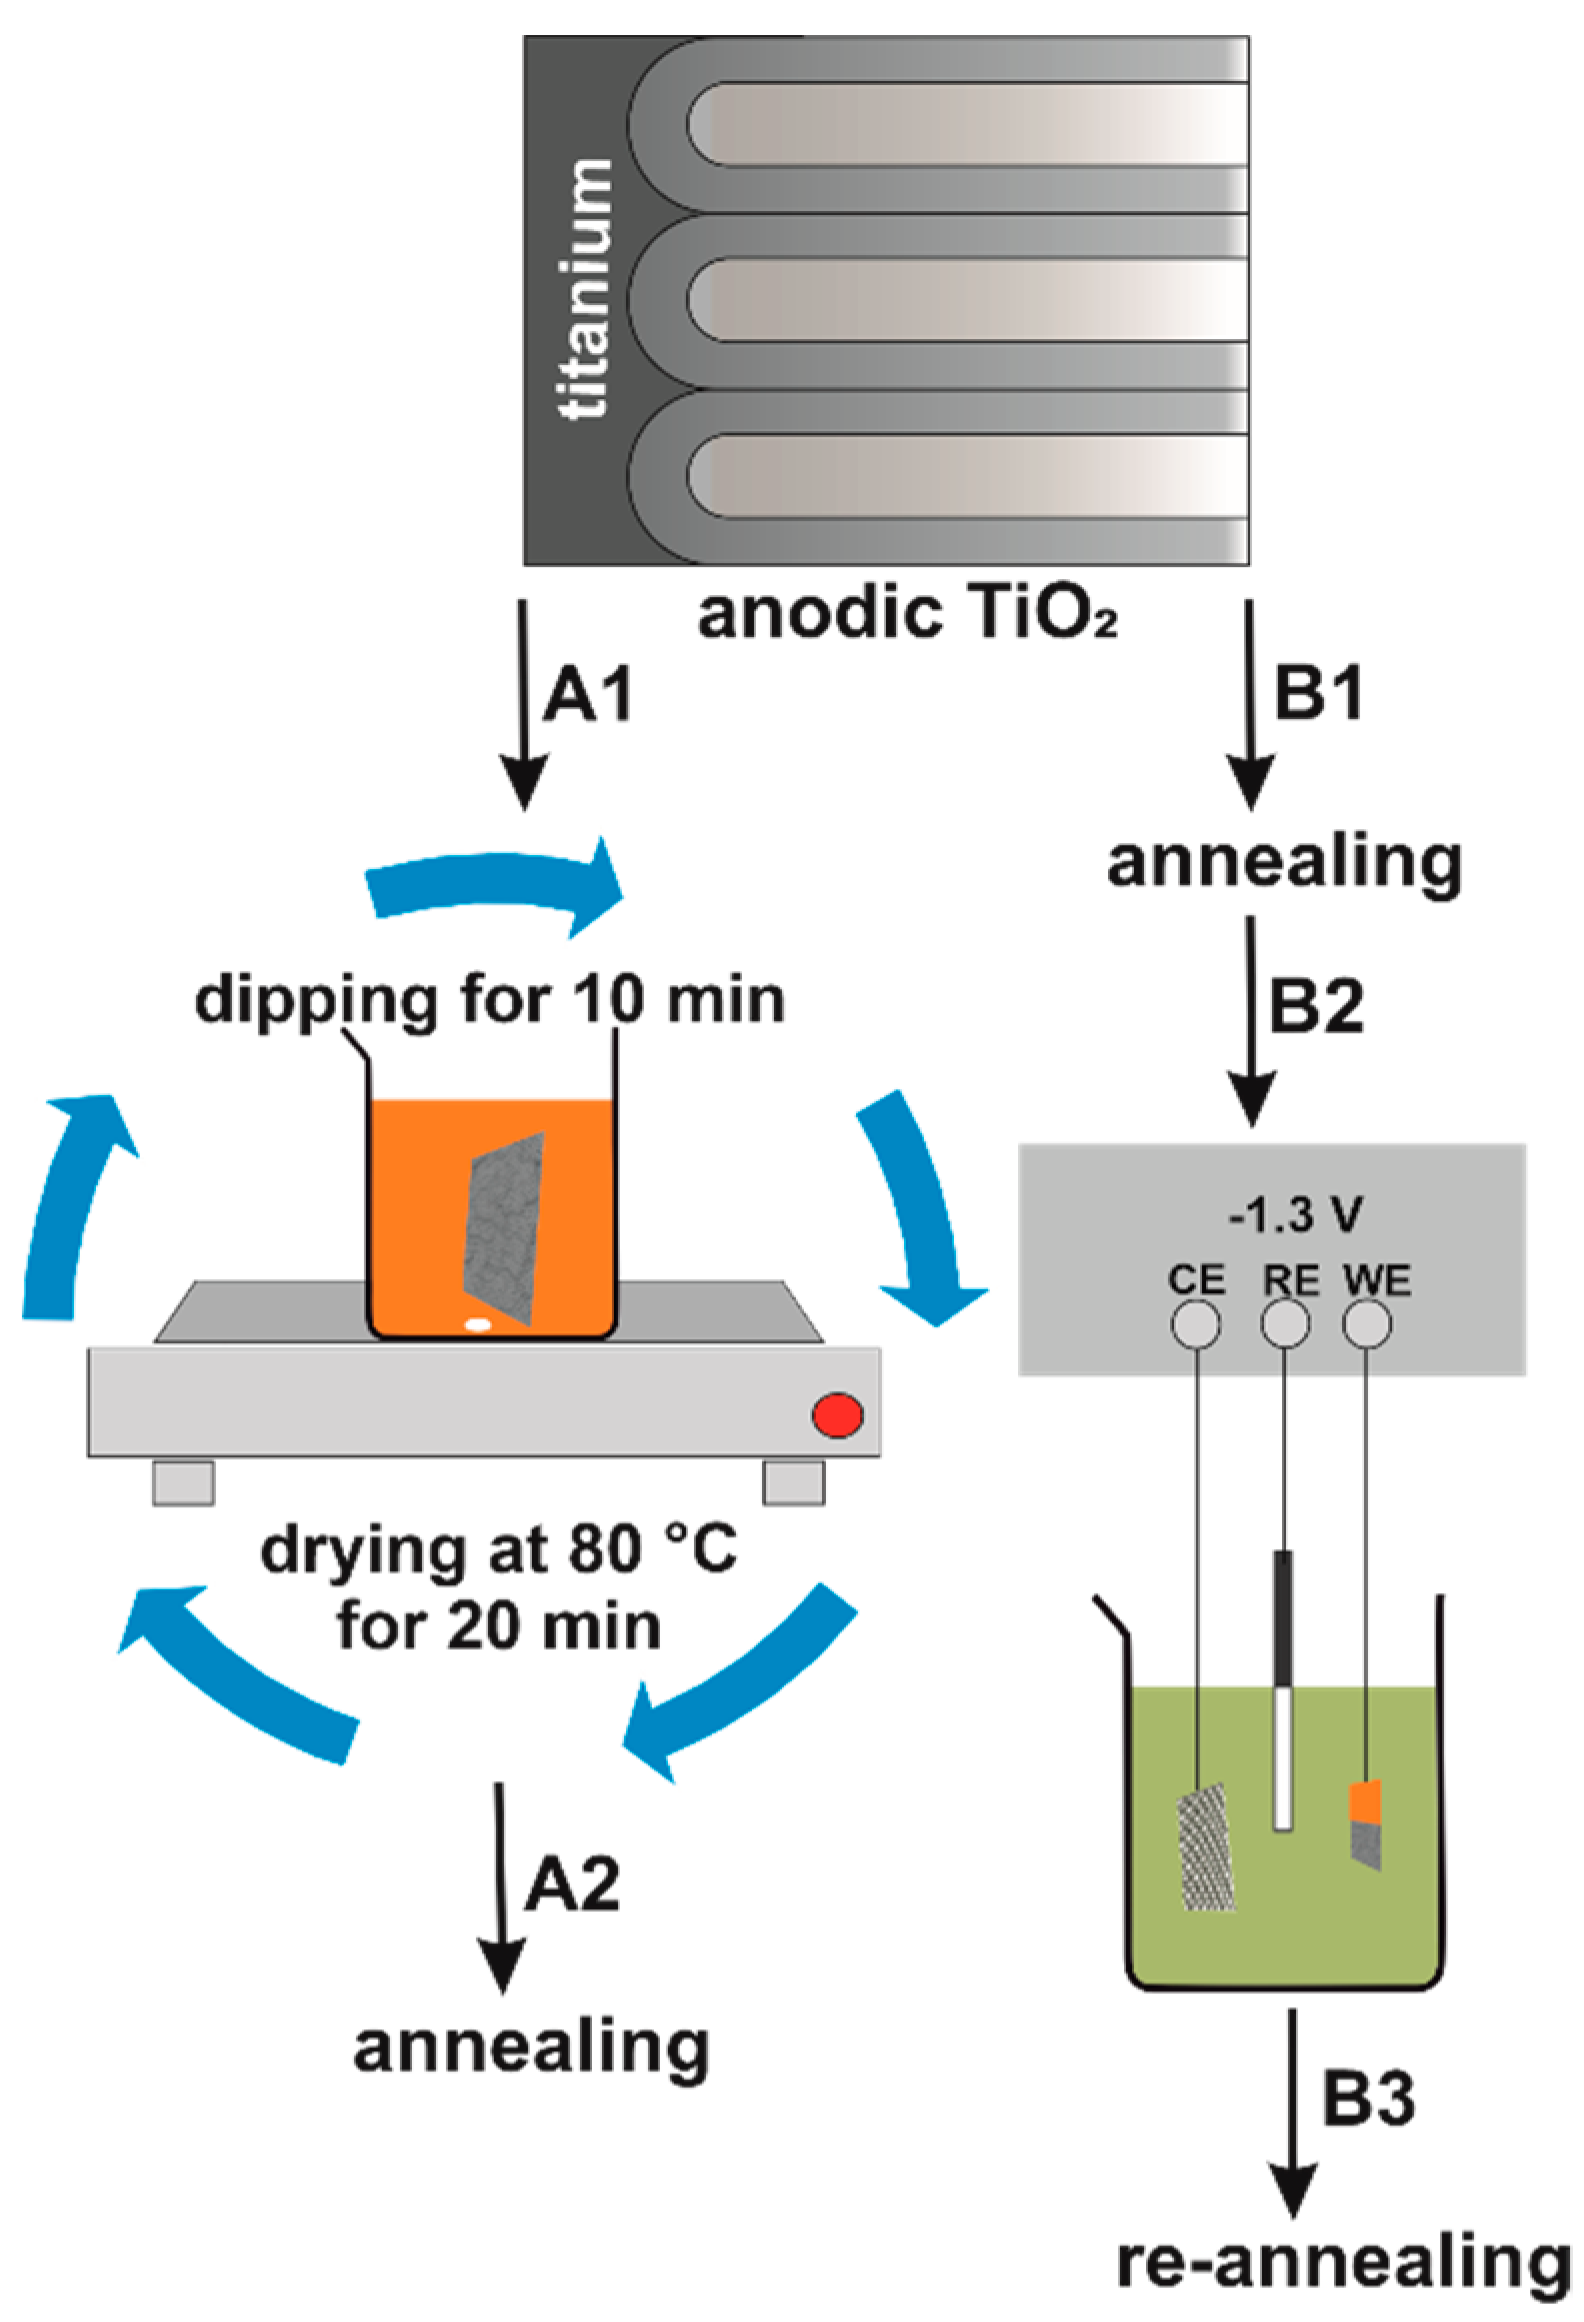
2.1. Synthesis of Nanostructured Fe2O3–TiO2

Anodic TiO2 samples were prepared according to the previously described method [27]. The obtained pore diameter, interpore distance, length, and wall thickness were around 54, 90, 600, and 20 nm, respectively [23,24,25,26]. Figure 1 shows the schematic procedure used for the preparation of the studied and reference samples. The anodic TiO2 layers before electrodeposition were annealed at 400 °C for 2 h using a muffle furnace (FCF 5SHM Z, Czylok, Krakow, Poland) with a heating rate of 2 °C min−1 (Figure 1B1). Using as-received anodic TiO2 layers, Fe was potentiostatically electrodeposited from a mixture of 0.1 M FeSO4 (Sigma-Aldrich, India) and 0.1 M H3BO3 (Chempur, Poland) (pH = 3.9) at −1.3 V vs. SCE for 5–180 s (Figure 1B2) [17]. After deposition, the samples were annealed at 450 °C for 1 h (Figure 1B3). As the reference sample, an anodic TiO2 layer impregnated with 100 mM FeCl3 (Honeywell, Seelze, Germany) (Figure 1A1) and annealed at 450 °C for 2 h (Figure 1A2) was used. The experimental details have been described previously [27,28].

2.2. Characterization of Fe2O3–TiO2 Materials

The morphology and chemical composition of synthesized materials were characterized by using a field emission scanning electron microscope (FE-SEM/EDS, Hitachi S-4700 with a Noran System 7, Tokyo, Japan). The phase composition was determined by using a Rigaku Mini Flex II diffractometer (Rigaku, Tokyo, Japan) with Cu Kα radiation (1.54060 Å) at the 2θ range of 20–60°. Optical band gaps were determined based on UV-Vis Diffuse Reflectance Spectroscopy (DRS) measurements performed at the wavelength range of 200–800 nm (with a step size of 2 nm) using a Lambda 750S spectrophotometer (PerkinElmer, Waltham, MA, USA). The Spectralon® SRS-99-010 diffuse reflectance standard was used as a reference. Raman spectra were collected by using a Raman microscope, WITec Alpha 300 (WITec, Ulm, Germany), equipped with an air-cooled solid-state laser operating at 532 nm, a 600 grooves/nm grating, and a CCD detector. A microscope was coupled with a laser and a spectrograph via a single-mode optical fiber with a diameter of 50 µm. Samples were illuminated with the output laser power of 1.8 mW through a 40× air objective (NA: 0.6). Fifty accumulations with an integration time of 1 s were acquired in the range of 0–4000 cm–1, with a spectral resolution of ca. 3 cm–1. From 5 to 10 Raman spectra were acquired from randomly selected points on the sample surface, and if the spectra represented a similar spectral profile, they then were averaged.

2.3. Electrochemical and Photoelectrochemical Measurements

Electrochemical and photoelectrochemical measurements were performed in a three-electrode system, where a SCE electrode (3 M KCl), platinum wire, and Fe2O3–TiO2 sample were used as a reference, counter, and working electrodes, respectively. Mott–Schottky analyses were carried out using a Gamry Reference 3000 potentiostat (Gamry Instruments, Warminster, PA, USA) in the dark, at the constant frequencies of 200, 500, and 1000 Hz in a 0.1 M KNO3 solution (pH = 6.1). Photoelectrochemical tests were carried out using a photoelectric spectrometer (Instytut Fotonowy, Krakow, Poland) equipped with a 150 W xenon arc lamp in a Teflon cell with a quartz window. The photocurrent vs. time curves was recorded in a 0.1 M KNO3 (Sigma-Aldrich, Spain) aqueous solution (pH = 6.1) under the applied potentials of 0–1 V vs. SCE (with a 200 mV step). Pulse illumination in the range of 200–600 nm with a 10 nm wavelength step and 15 s light and 10 s dark cycles was used. In addition, PEC properties were investigated using a solar simulator equipped with a 150 W xenon lamp, and an Air-Mass 1.5 G filter (Instytut Fotonowy, Krakow, Poland), which corrects the spectral output of the lamp to match the solar spectrum in the wavelength range of 350–700 nm. The received materials were also tested as glucose sensors, and their chronoamperometric response in the dark and under simulated solar illumination was studied. The tests were carried out at the applied potential of 1 V vs. SCE in a 0.1 M KNO3 solution containing 1.06–10.28 mM L−1 glucose.

3. Results and Discussion

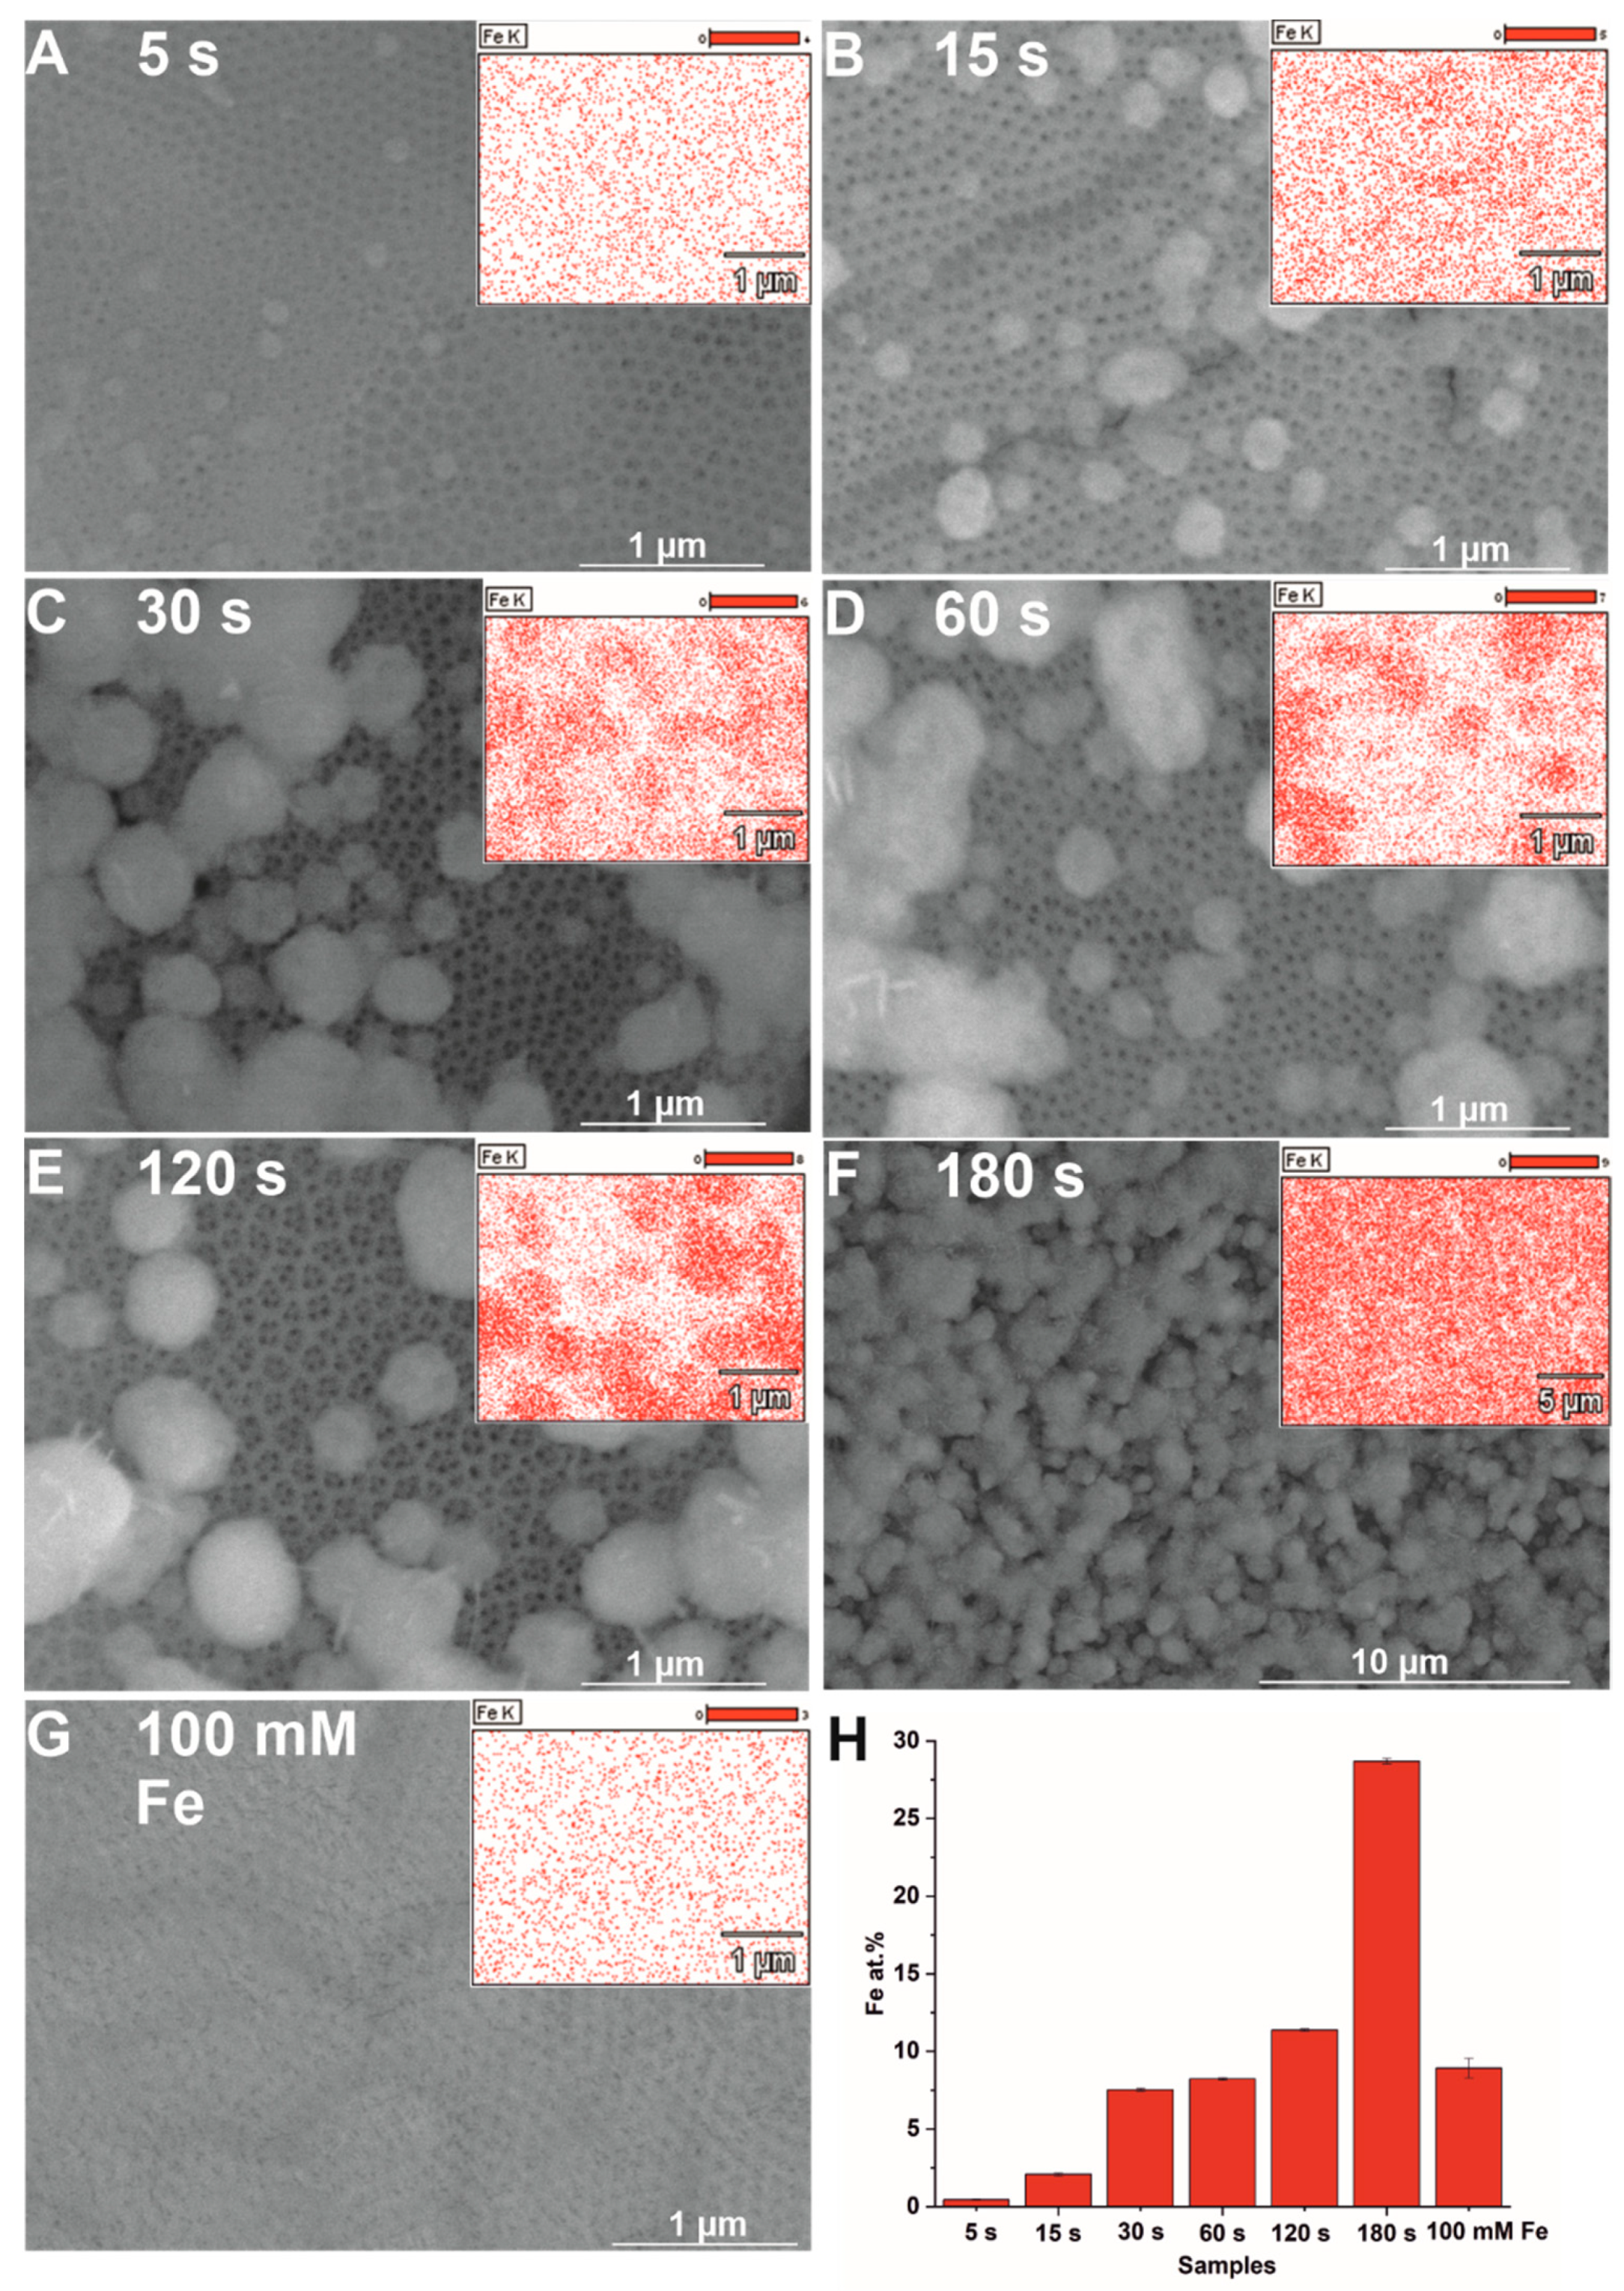
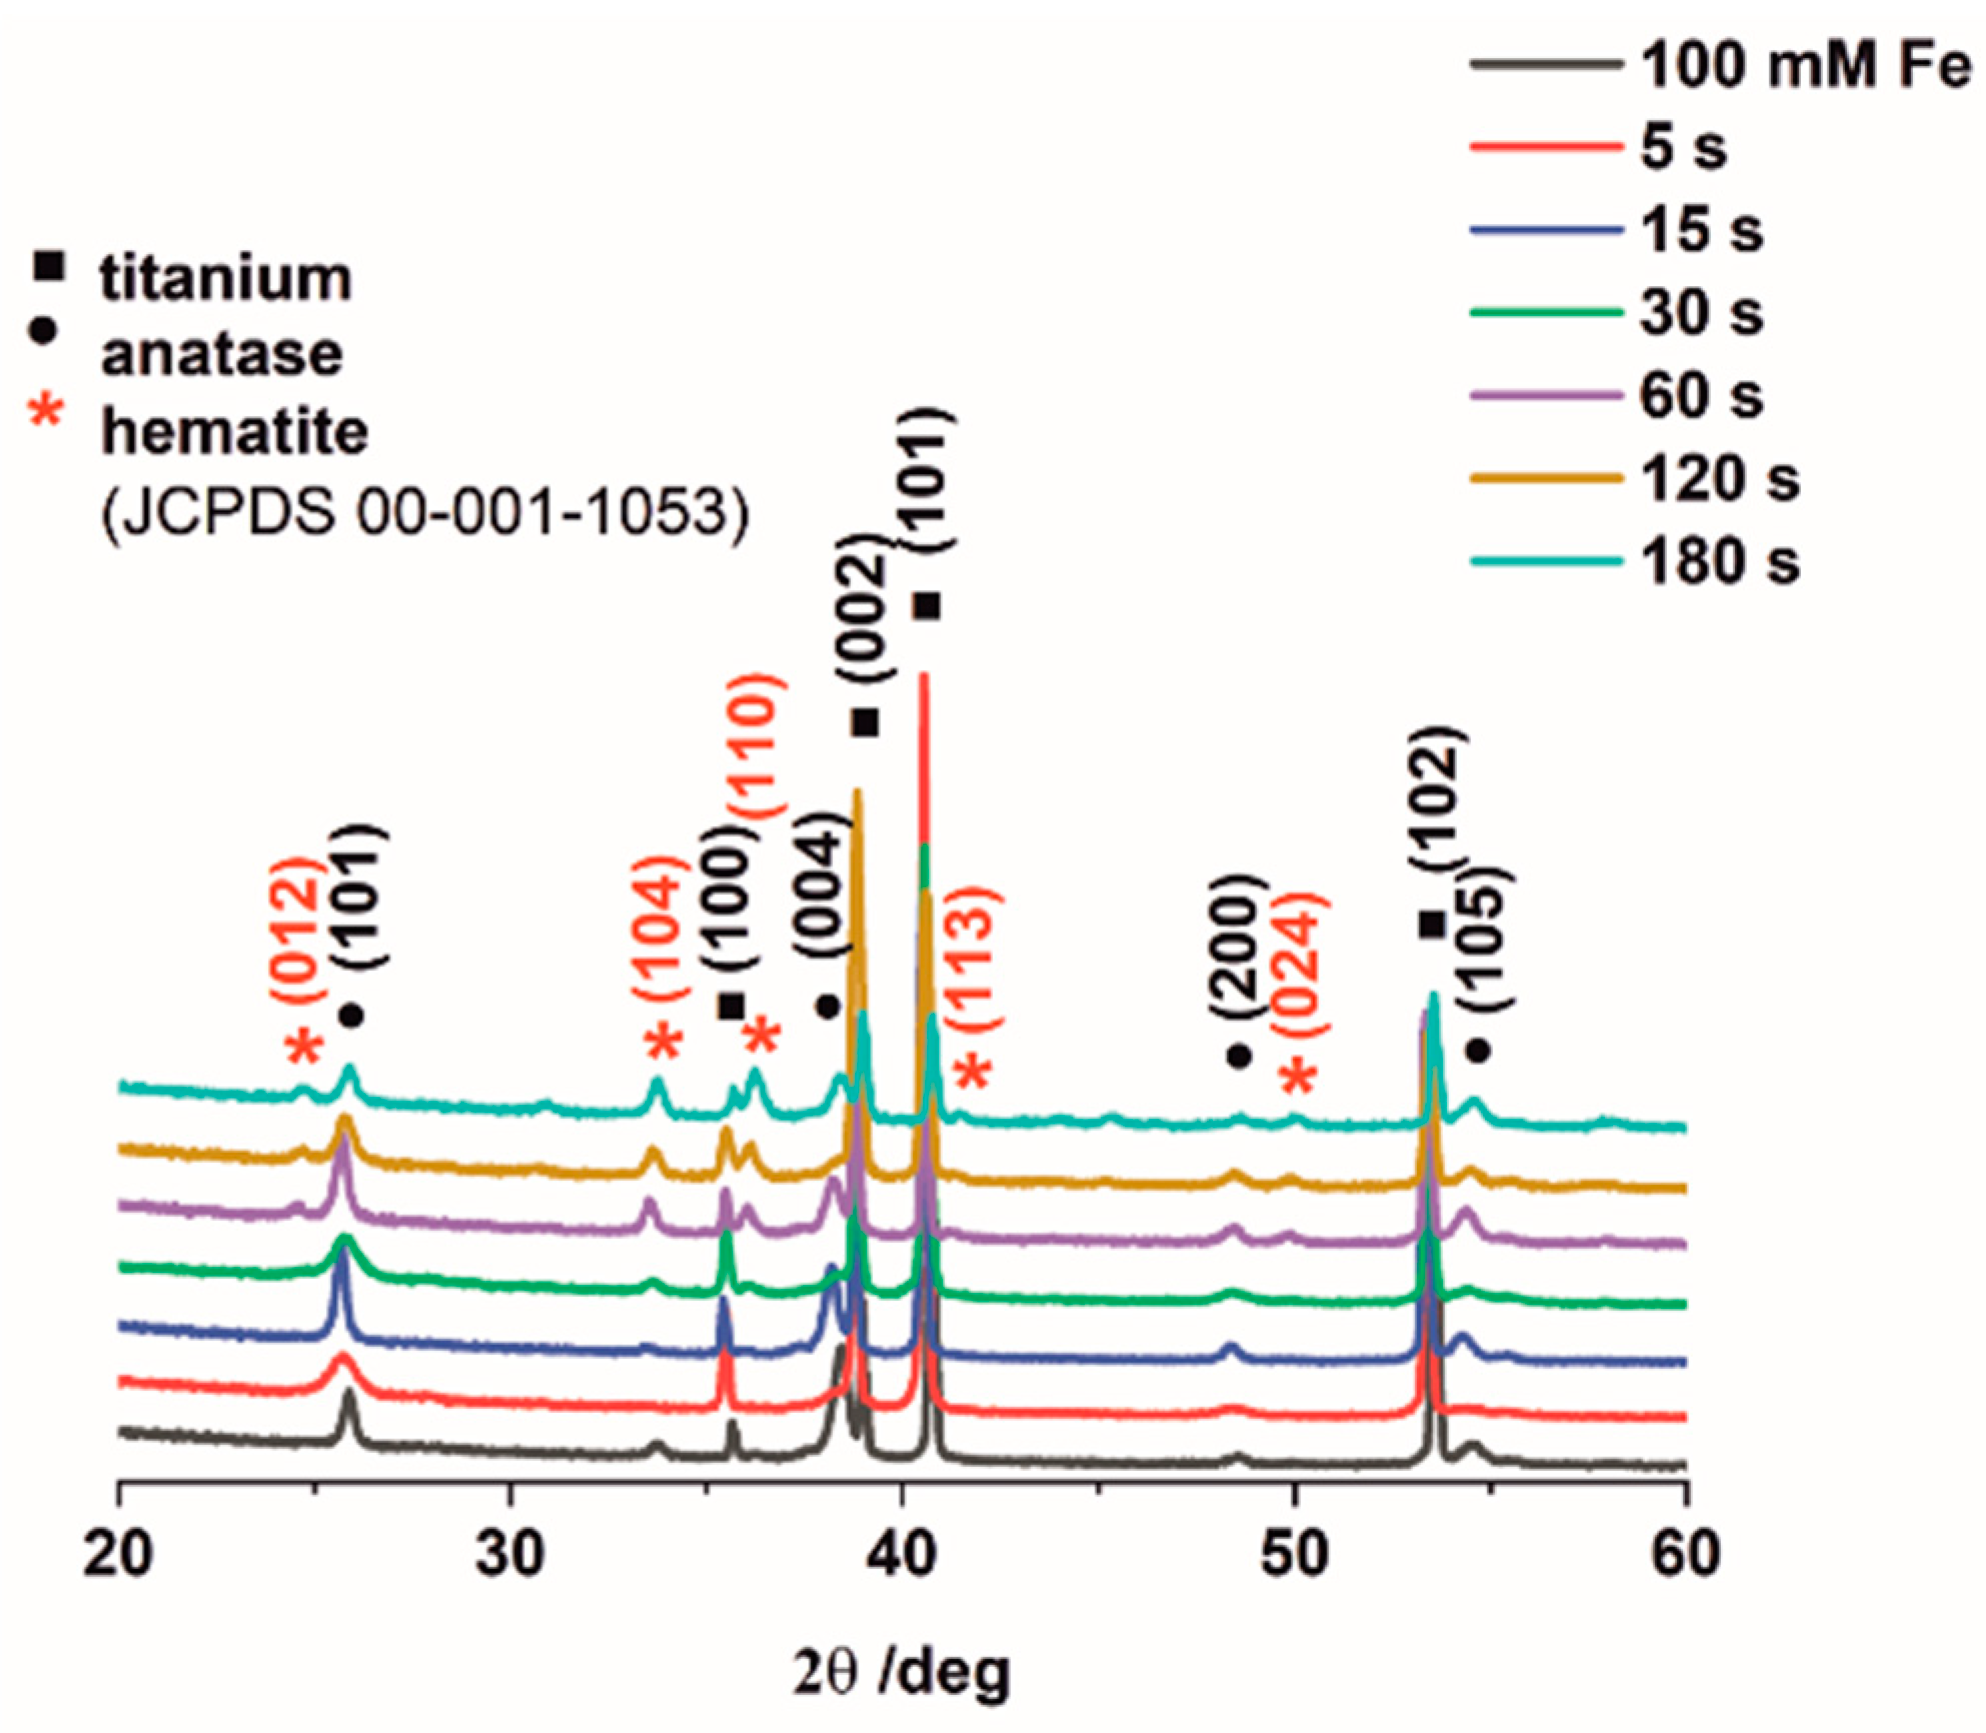
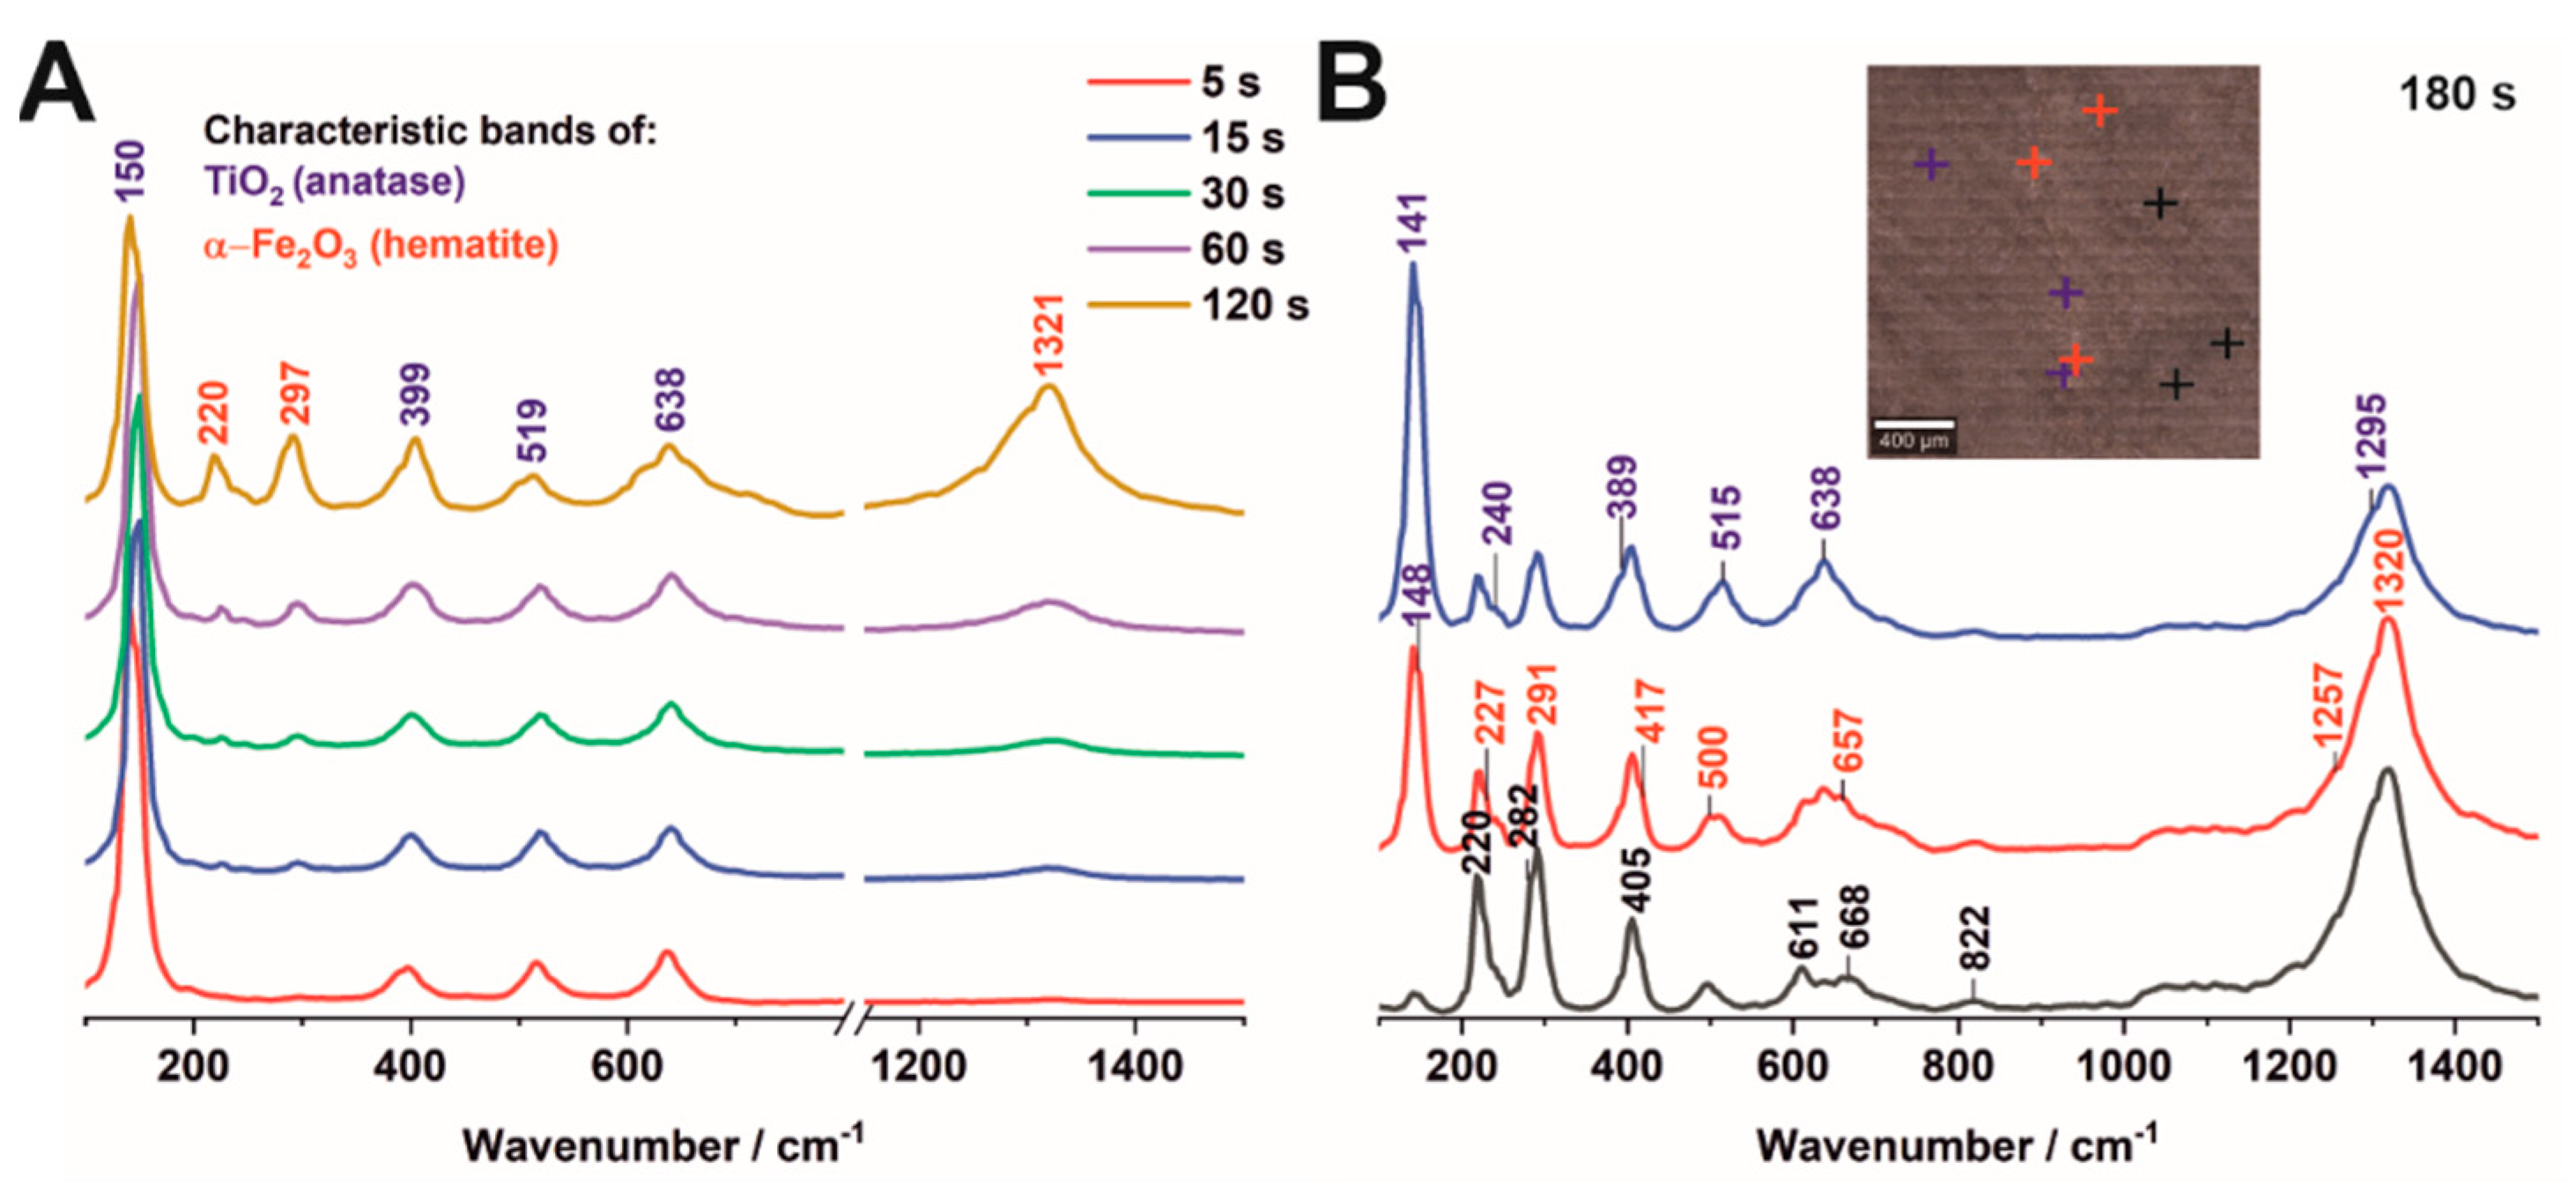
3.1. Morphology and Crystallinity of Fe2O3–TiO2 Nanostructured Materials Synthesized by Electrodeposition

The electrodeposition of iron at the constant potential mode is characterized by a typical exponential decay of current density to a steady-state value (Figure S1A, Supplementary Materials) [12]. What is more, based on current–time transients, the total charge density was obtained (Figure S1B, Supplementary Materials). As expected, the total charge density passing through the system increases with the prolonged deposition, indicating a higher amount of iron deposited on the anodic TiO2 surface, which is consistent with the data in the literature [29]. To confirm it, SEM imaging of the prepared samples (Figure 2A–F) with EDS mapping was performed. It can be observed that hematite particles resulting from Fe deposition and annealing have a diameter of ca. 150 nm and are unevenly distributed over the porous surface. The estimated Fe content (Figure 2H) gradually increases from about 0.50 at.% to nearly 30 at.% as deposition time increases from 5 s to 180 s. Moreover, the iron content determined for the impregnated sample (Figure 2G) was comparable to that of the sample electrodeposited for 60 s (Figure 2D), for which the Fe content was about 7.5 at.%. It can be concluded that electrodeposition using anodic TiO2 layers as substrates results in the formation of a more controllable distribution of particles over the oxide layer when compared to the sample formed by impregnation.
X-ray diffraction measurements were performed to characterize the crystal structure of obtained samples. The XRD patterns (Figure 3) of the prepared materials exhibited three main components. The main diffraction peaks correspond to the reflection from (100), (002), (101), (102) titanium (JCPDS card no. 05-0682) crystal planes and (101), (004), (200), (105) anatase (JCPDS card no. 21-1272) crystal planes. It can be seen that hematite peaks were not observed for the sample electrodeposited for 5 s due to a very low quantity of iron (ca. 0.5 at.%). However, for the samples electrodeposited for longer durations, such as 15 s and 30 s, (104), (110) crystal planes of rhombohedral hematite (JCPSD card no. 00-001-1053) are clearly visible. When compared with the impregnated sample, the materials electrodeposited for 60 s, 120 s, and 180 s, all having much higher Fe contents, revealed the presence of additional crystal planes of (012), (113), (024) that correspond to hematite.
Figure 4 displays the Raman spectra acquired for hybrid Fe2O3–TiO2 samples obtained by electrodeposition for 5–120 s (A) and 180 s (B). Regardless of the amount of hematite obtained after annealing, all samples are composed of anatase and hematite, as manifested by Raman bands for TiO2 at 150, 399, 519, and 638 cm−1 [25,28] as well as for α-Fe2O3 at 220, 284, and 1318 cm−1 [27]. In turn, an intensity ratio of the α-Fe2O3 and TiO2 bands clearly shows that the content of hematite gradually increases, and only these iron species are formed when anodic TiO2 is subjected to electrodeposition of up to 60 s. The intensity of the α-Fe2O3 features varies slightly across the sample surface, indicating that its growth is uneven (Figure S2, Supplementary Materials). After 120 s, additional low- and medium-intensity Raman bands appear at ca. 230 (goethite, FeOOH), 390/500 (maghemite, γ-Fe2O3), 610 (wüstite, FeO), 660 (magnetite, Fe3O4), and 1300 (lepidocrocite, γ-FeO(OH)) cm−1 (Figure 4A) [28]. The distribution of these iron oxides changes due to the elongation of the deposition time up to 180 s (Figure 4B). Here, there are sites in which the hematite/anatase ratio alters from low (blue trace) to high (red trace), while the contribution of other iron oxides is similar.

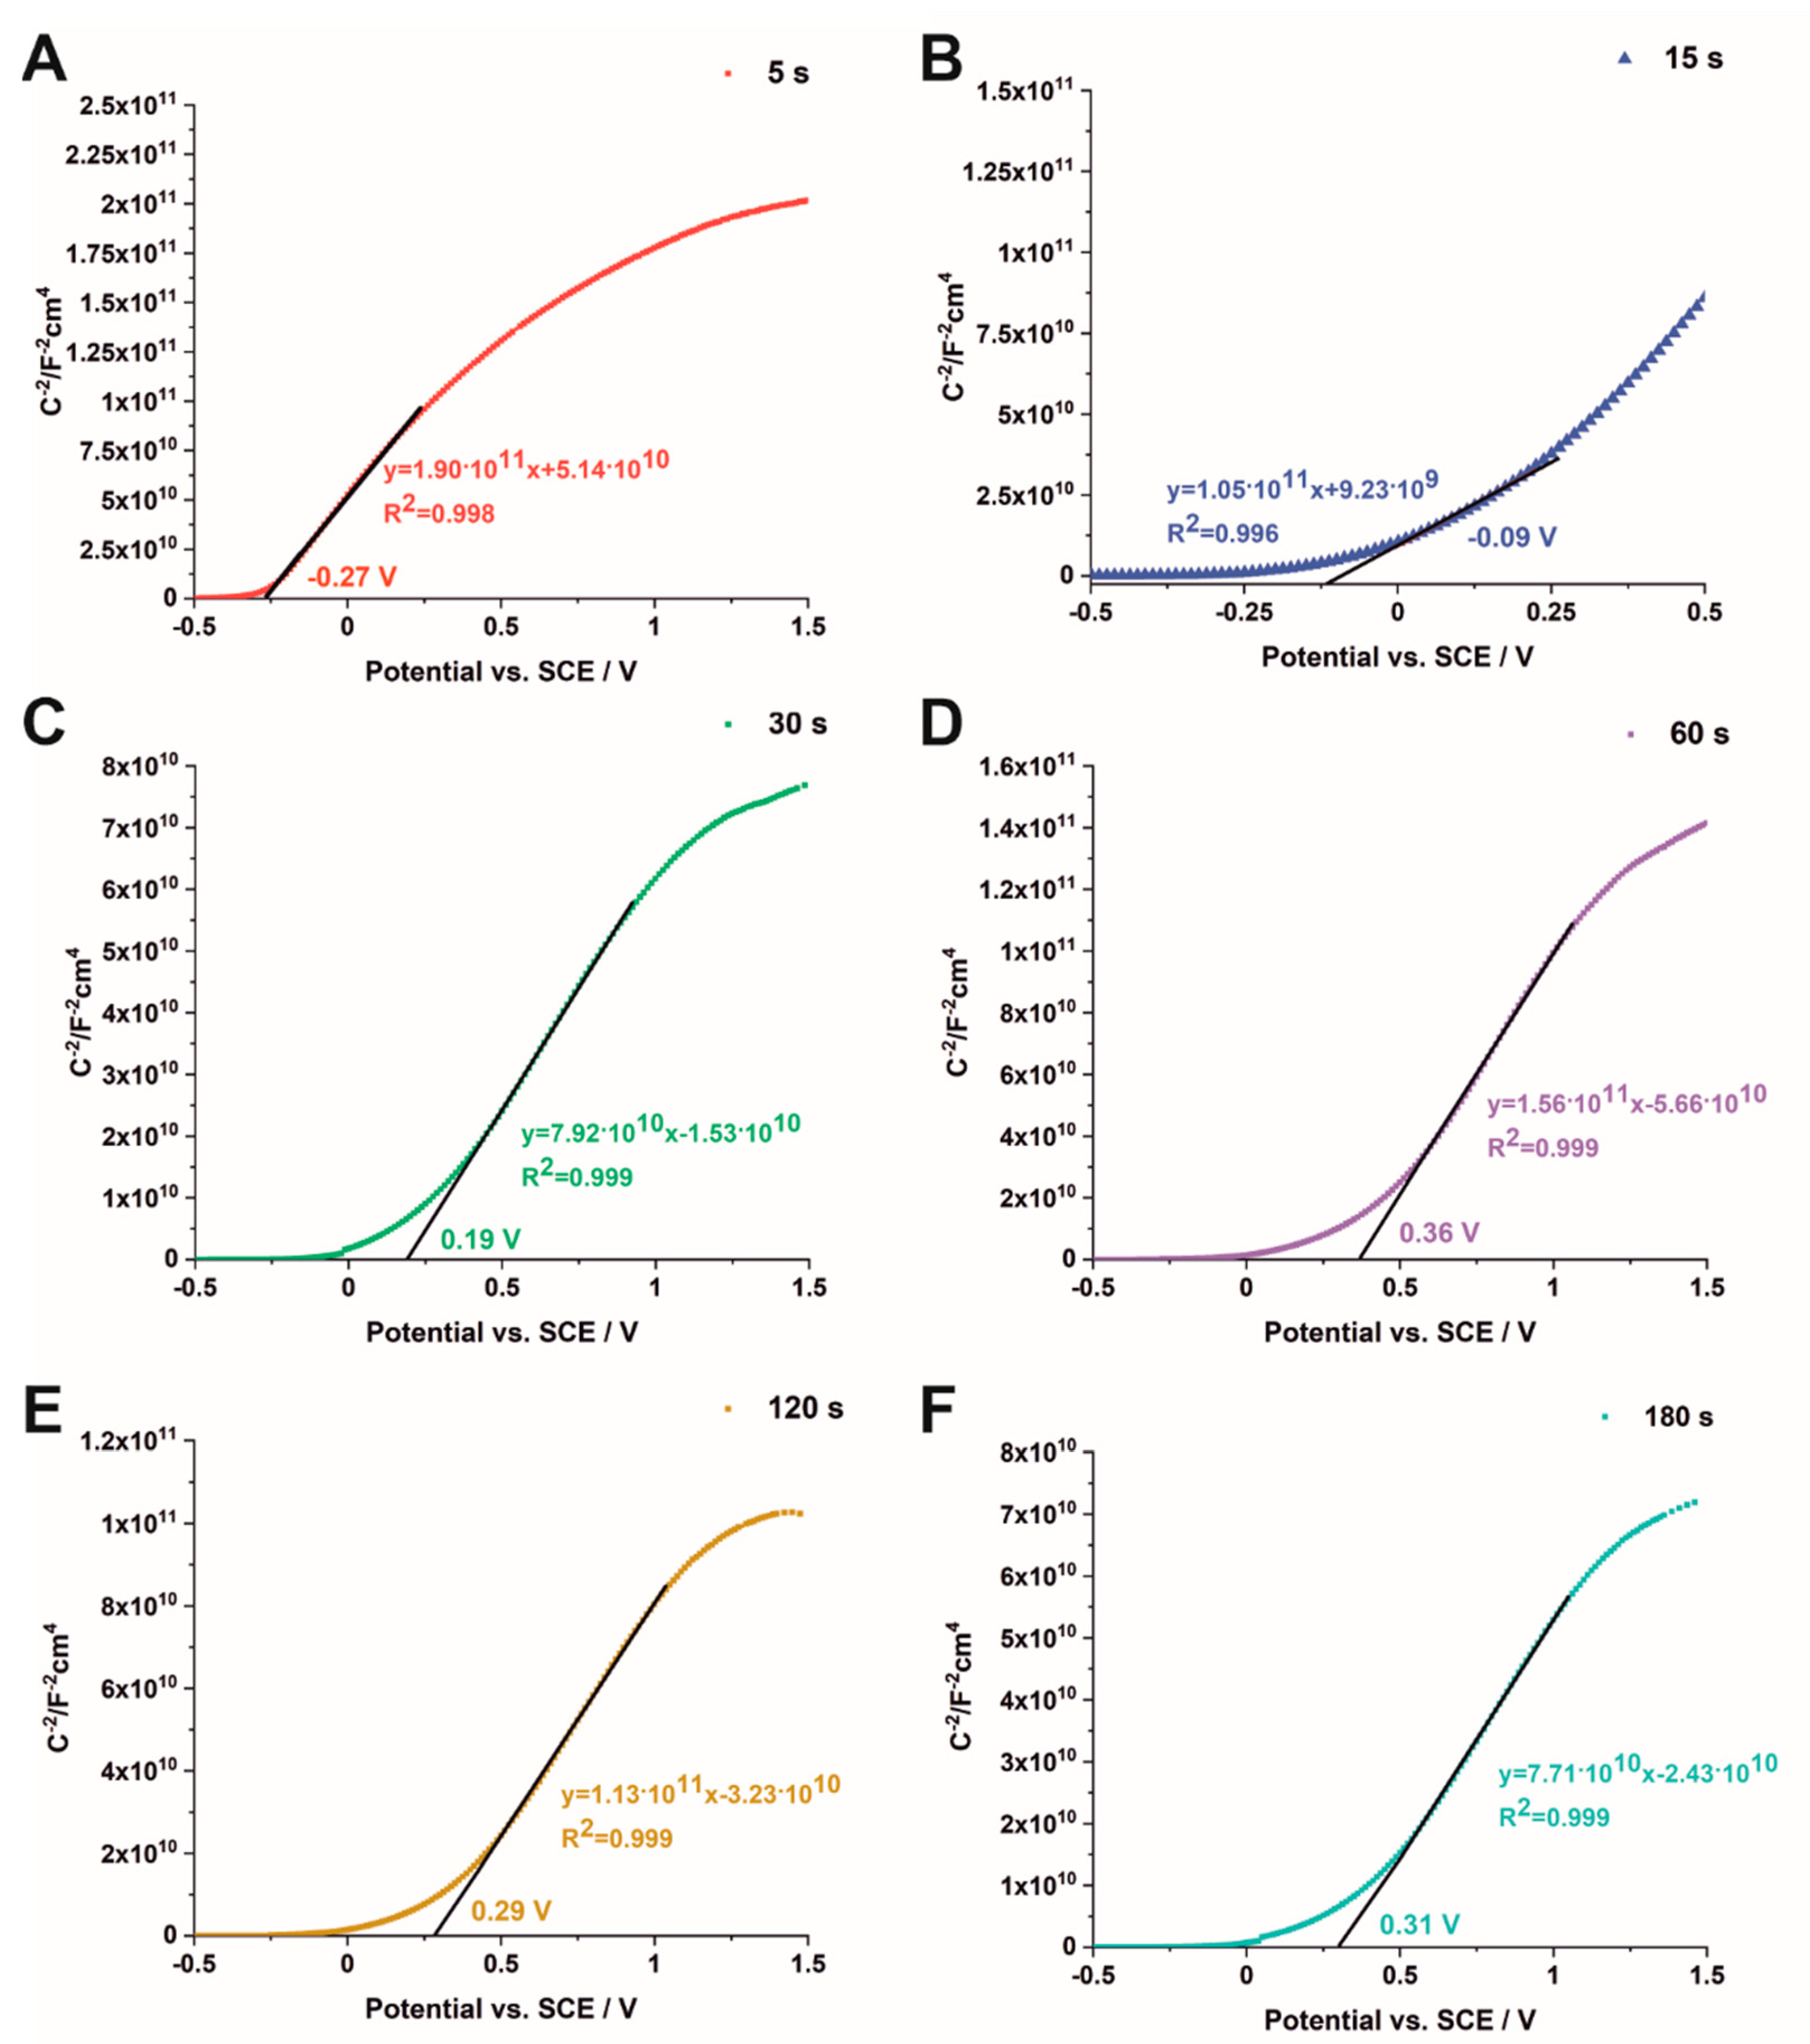
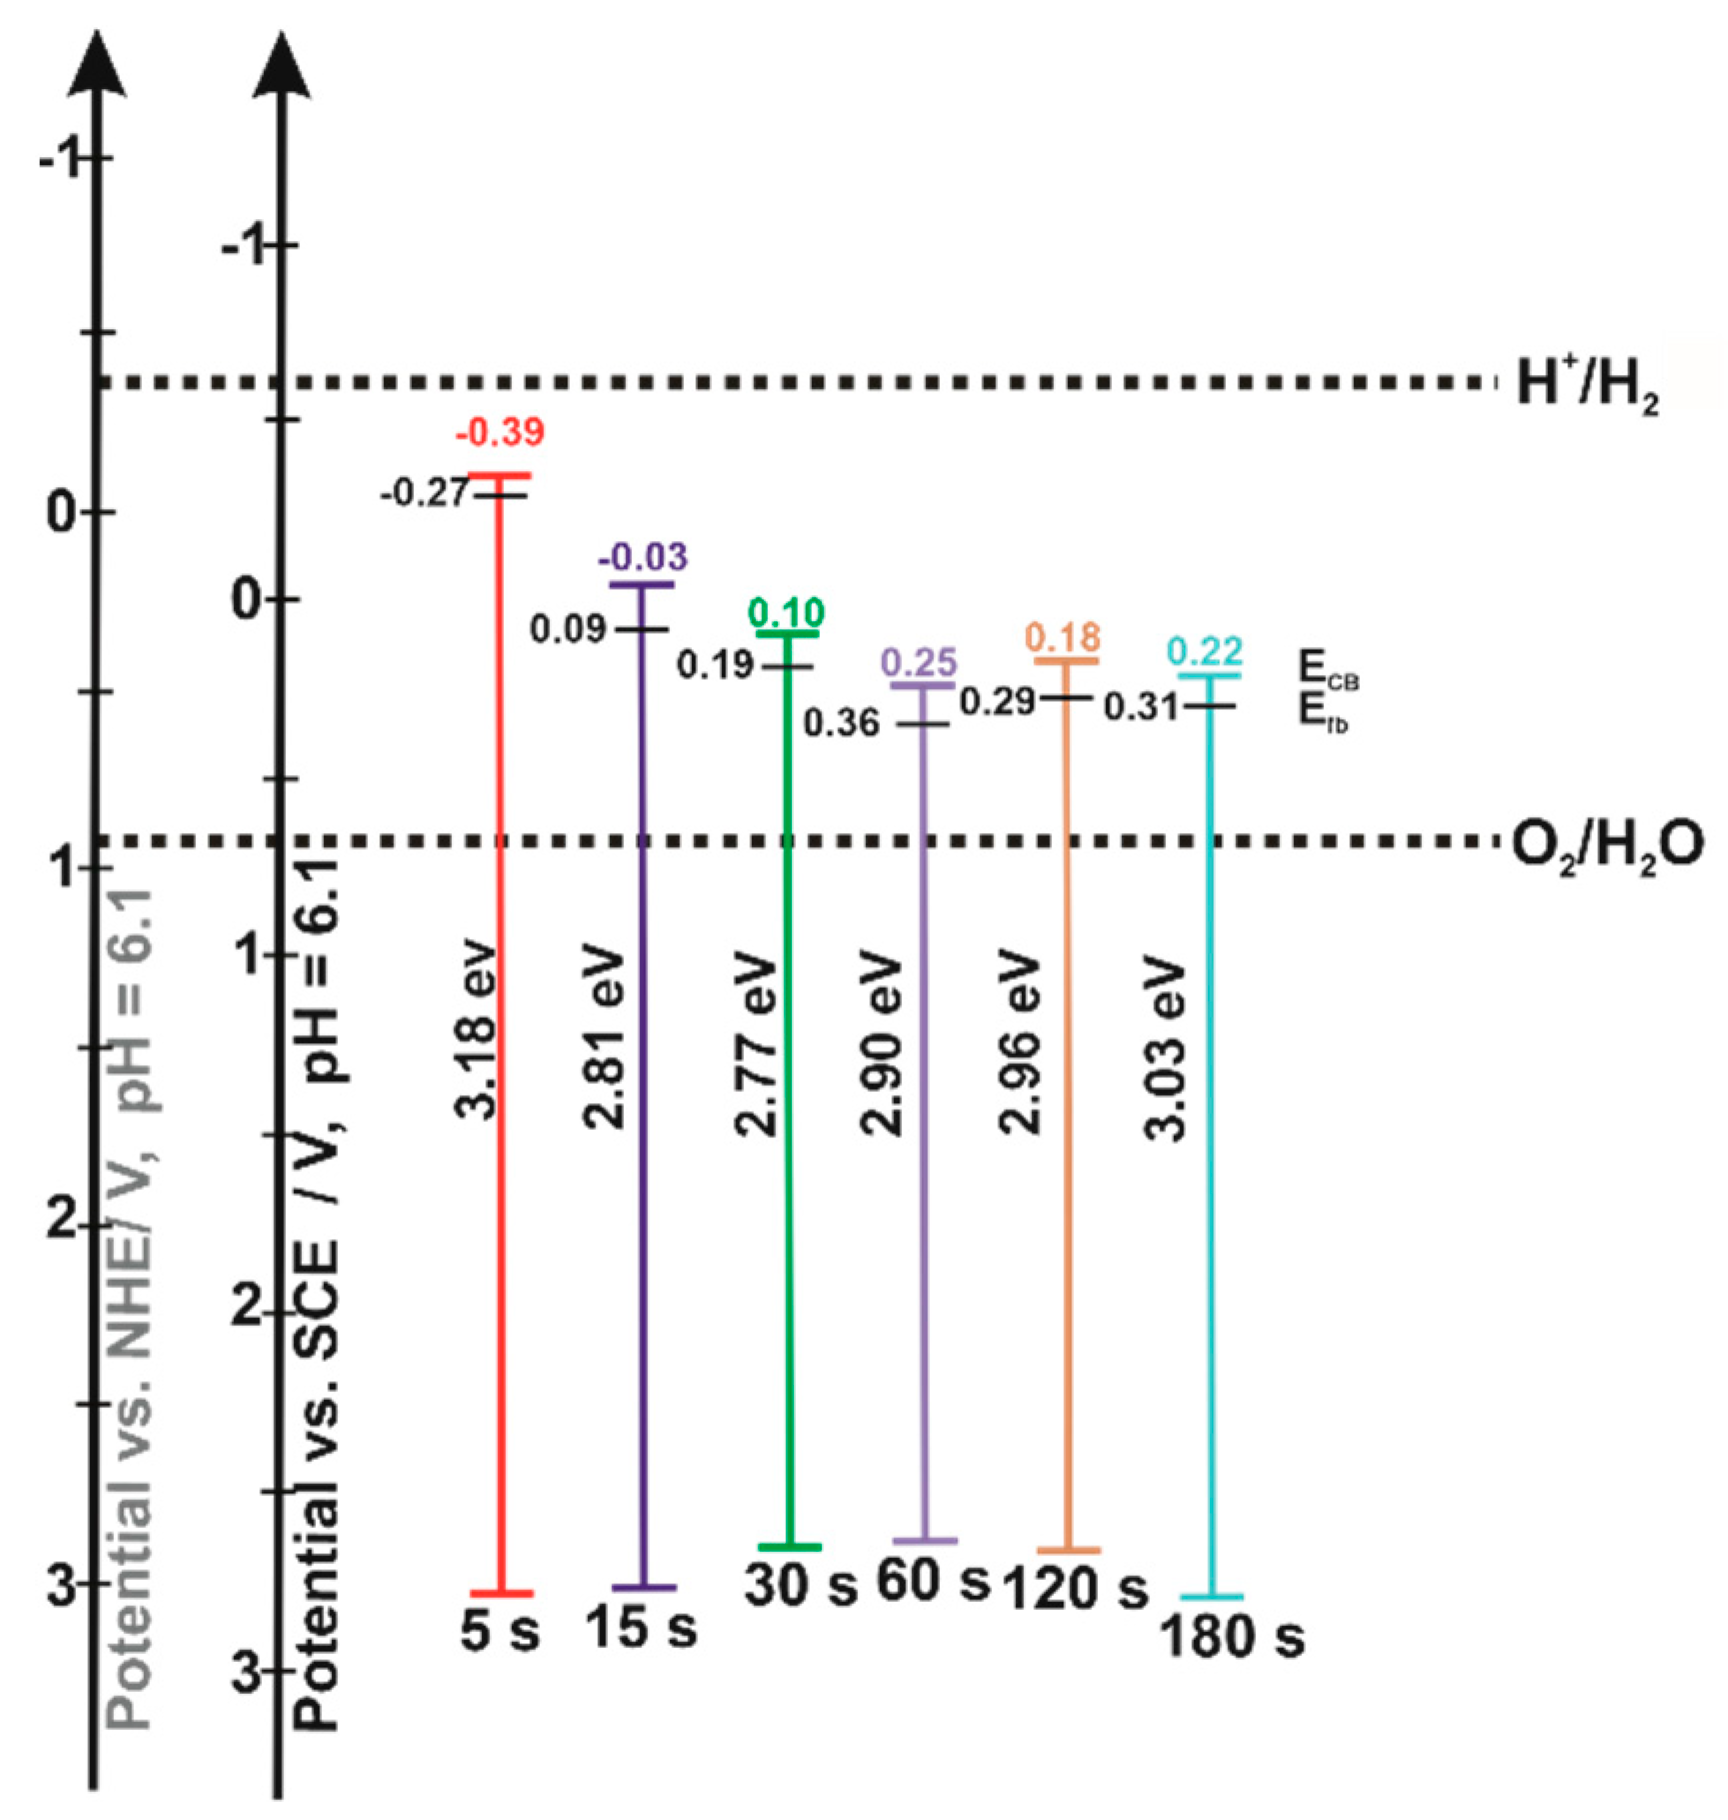
3.2. Semiconducting Properties

For all studied samples, optical band gap values were determined from diffuse reflectance measurements, as described previously [27,28]. An example of the estimation of the optical band gap energy from UV-Vis DRS measurements is presented in Figure S3 in Supplementary Materials. The obtained data for all studied materials are collected in Figure 5. It can be seen that two optical band gaps can be determined for all samples. The first band gap energy of ~3.2 eV, observed for the material obtained after 5 s deposition, is related to the electronic transitions in the crystal structure of TiO2 nanotubes (anatase) [30]. For the extended deposition process, band gap narrowing is observed, probably due to a heterogeneous morphology of Fe2O3–TiO2 and the formation of a heterojunction, which was observed in our previous work [27,28]. On the other hand, a second energy band gap of ~2.2 eV located in the visible region of the solar spectrum was calculated for the studied samples and is related to the presence of hematite [31].
The semiconducting properties of Fe2O3–TiO2 materials were studied using Mott–Schottky analysis, according to the following equation (1) [22]:
C S C 2 = ( 2 ε ε 0 q N d ) ( E E f b k T q )
where: Csc is the capacitance of the space-charge region (F cm−2), Nd is the donor density (cm−3), ɛ is the dielectric constant of TiO2 (100), ɛ0 is the permittivity of free space (8.85∙10−14 F cm−1), q is the electron charge (1.602∙10−19 C), E is the applied potential (V), Efb is the flat band potential (V), T is the absolute temperature (K), and k is the Boltzmann constant (1.38∙10−23 J K−1) [32]. The Mott–Schottky analysis was performed at frequencies of 200, 500, and 1000 Hz. The flat band potential was obtained from the intersection of the Csc−2 vs. applied potential curve. The n-type behavior of the studied materials was confirmed by the positive slopes of the above-mentioned curves [33]. The Mott–Schottky plots measured at the frequency of 1000 Hz are presented in Figure 6 for samples obtained by electrodeposition for 5 s (A), 15 s (B), 30 s (C), 60 s (D), 120 s (E), and 180 s (F). As can be seen, with increasing the deposition time from 5 s to 180 s, the flat band potential shifts toward more positive potentials from −0.27 to 0.31 V vs. SCE, respectively. For the hybrid materials received by efigurelectrodeposition for 60 s, 120 s, and 180 s, the slight differences in Efb values are attributed to changes in the surface chemistry of TiO2 and concomitant modification of the surface states mediating the charge transfer across the material [34,35]. The above-mentioned results are consistent with the data in the literature, which typically report the flat band potential of hematite ranging between 0.16 V and 0.56 vs. SCE [36]. What is more, a good linear fit of the Mott–Schottky plot indicates a partially depleted space-charge layer at the semiconductor surface [37,38]. As an example, Mott–Schottky plots for three different frequencies (200, 500, and 1000 Hz) are shown in Figure S4 in Supplementary Materials for the sample electrodeposited for 5 s. As can be seen, the flat band potential of the hybrid material shifts from −0.27 to −0.02 V vs. SCE as the applied frequency changes from 1000 to 200 Hz, which can be attributed to the high crystallinity and porosity of the electrode as well as the presence of the metal component [22,27].
The average donor densities of the studied samples were calculated based on Mott–Schottky measurements, as described earlier [27,28] Equation (S1) in Supplementary Materials for all tested frequencies (Figure S5, Supplementary Materials). As can be noticed, the donor density increases with increasing deposition time (except for the samples electrodeposited for 5 s and 30 s), which can be related to increasing the film thickness in a manner that depends on the substrate and its morphology, as suggested by Sellers and Seebauer [39]. The increased donor concentration reduces the width of the space-charge layer and, consequently, the electric field across the space-charge layer is larger. As a result, charge carriers within this region are efficiently separated and their recombination is inhibited [38]. It is worth noting that the dopant concentration should not be too high because it would provide more defect-scattering/recombination properties, which can equalize the increased separation efficiency [40]. Based on the flat band potentials and donor densities determined from the Mott–Schottky analyses, the conduction band edge was calculated for the studied samples from the following Equation (2) [41]:
E C B = E f b + k T · l n N s c N C B
where: ECB is the conduction band edge (V), Efb is the flat band potential (V), k is the Boltzmann constant (8.62∙10−5 eV K−1), T is the semiconductor temperature (298 K), Nsc is the donor density (cm−3), and NCB is the effective density of states in the conduction band (7.8∙1020 cm−3 [42]). The conduction band edges calculated for the analyses performed at 1000 Hz were −0.39, −0.03, 0.10, 0.25, 0.18, and 0.22 V vs. SCE for the samples electrodeposited for 5, 15, 30, 60, 120, and 180 s, respectively. The observed ECB shift toward more positive values with increasing electrodeposition time is consistent with the data in the literature and is strictly related to the formation of hematite layers [14]. Such a conduction band position of hematite causes a transfer of electrons from TiO2 to Fe2O3, leaving holes in the titanium oxide which may undergo oxidation reactions or act as recombination centers [14]. These results are opposite to those obtained by the impregnation method, where increasing the concentration of ferric chloride in the solution (5, 10, 25, 50, 100 mM) resulted in a slight shift in the conduction band edge toward more negative potentials [27], due to the much weaker effect of the hematite presence. To gain a deeper insight into the electronic properties of the studied hybrid Fe2O3–TiO2 materials, energy diagrams were constructed using band gap values determined from UV-Vis reflectance measurements and flat band potentials determined by Mott–Schottky analyses (Figure 7).

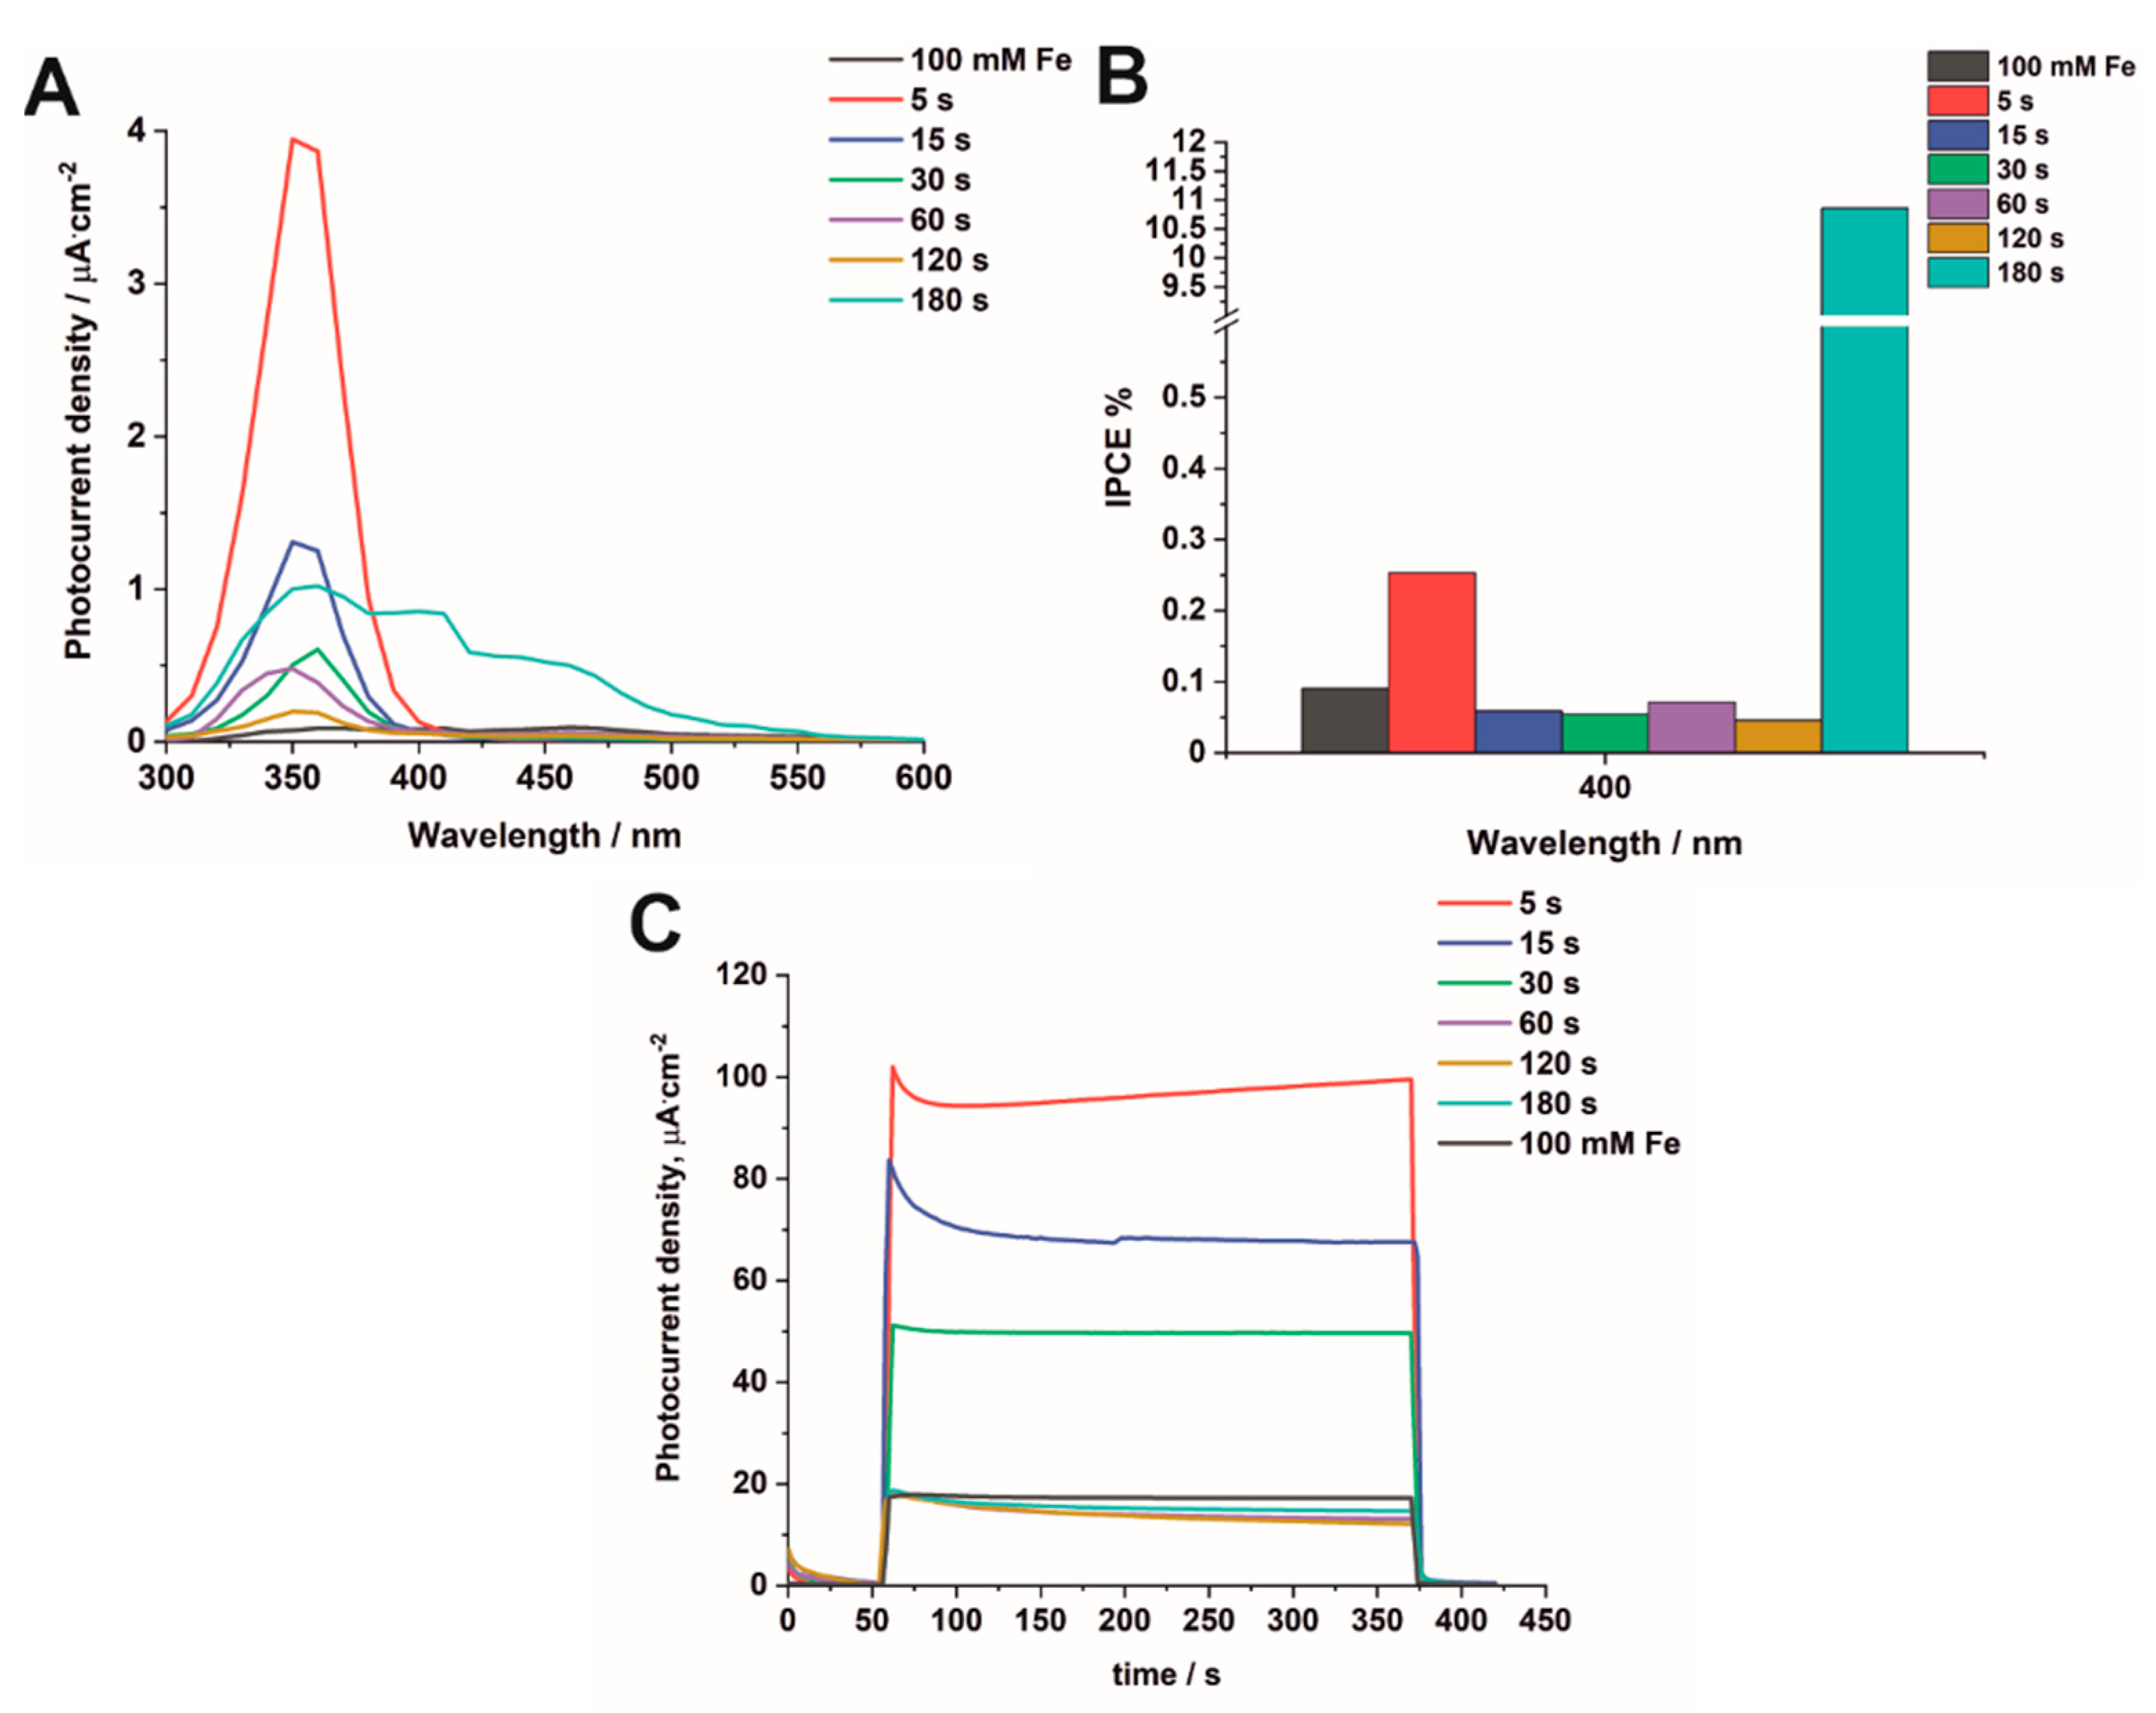
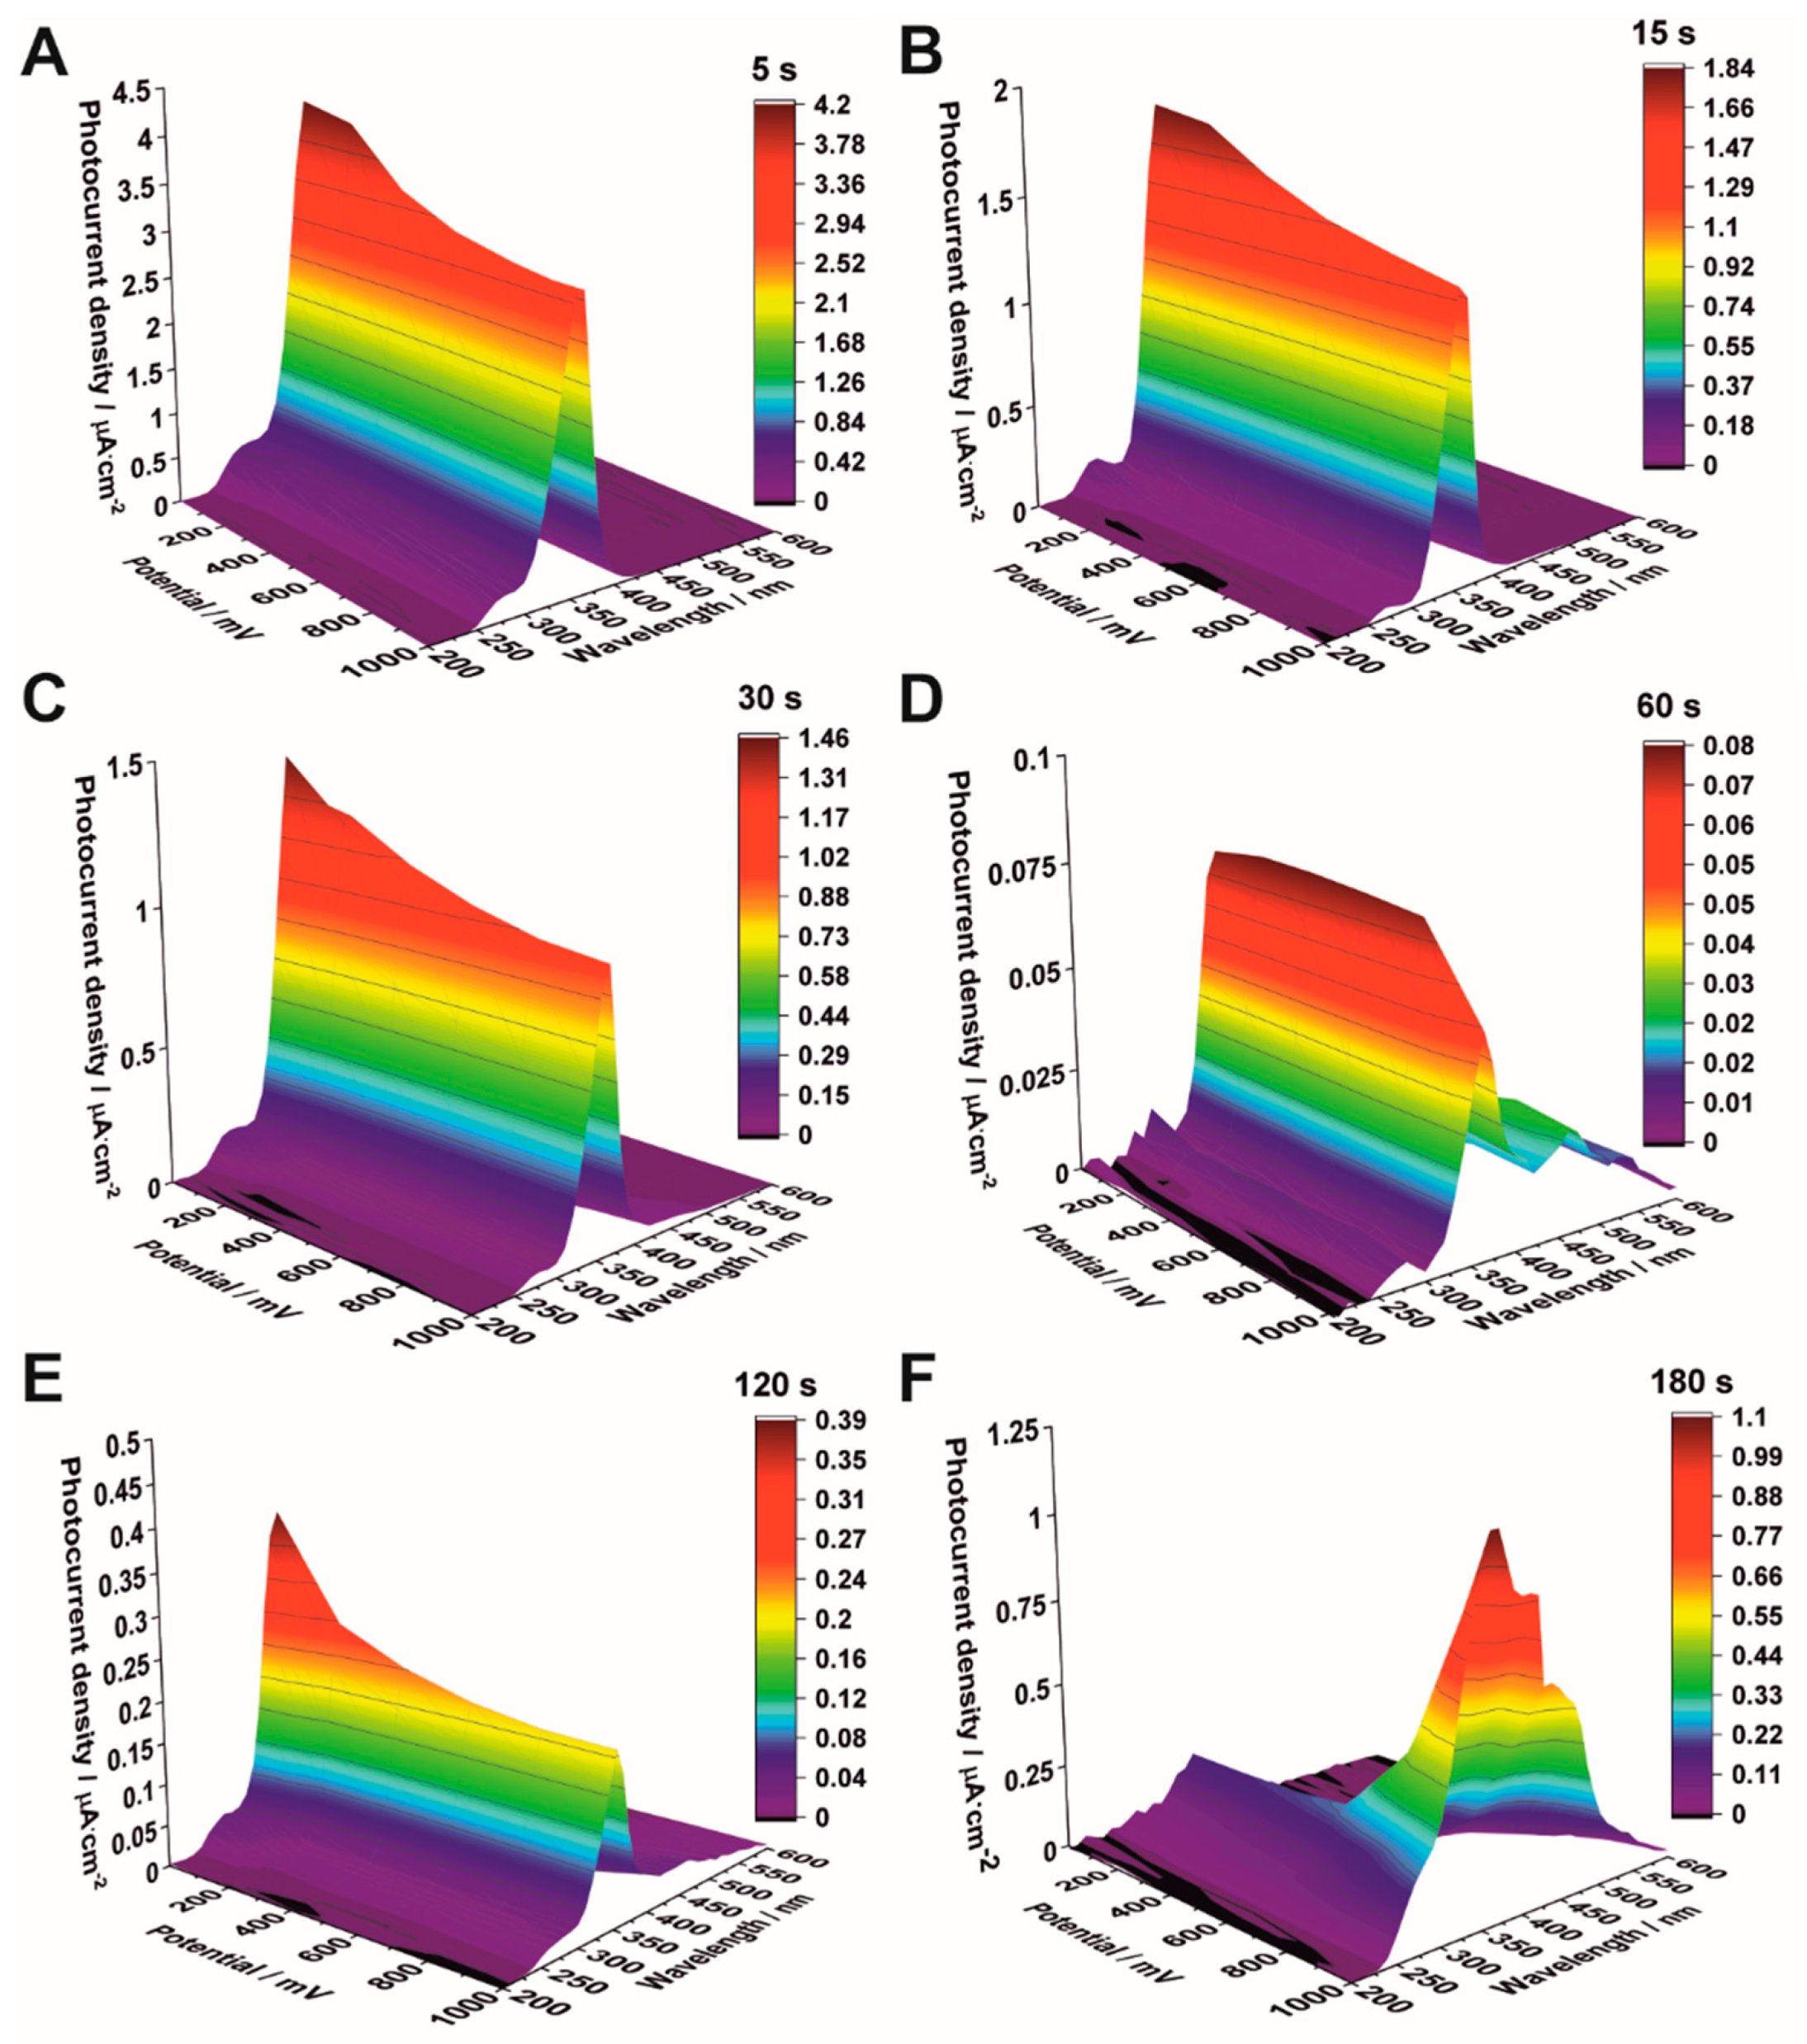
3.3. Photoelectrochemical Measurements

To evaluate the activity of the studied materials as potential photoelectrodes for water-splitting applications, photoelectrochemical properties were investigated under monochromatic conditions and solar radiation from a solar simulator with the Air-Mass 1.5G filter. The generated photocurrent under monochromatic radiation was recorded as a function of wavelength (300–600 nm) and potential (0–1 V vs. SCE) in 0.1 M KNO3 for all the studied samples (Figure 8). As can be seen, the highest photocurrent density was observed for the sample which was subjected to electrodeposition for 5 s (Figure 8A). The maximum photocurrent density was observed near 350 nm for all samples. However, the intensity of generated photocurrent gradually decreased in the UV range and simultaneously increased in the visible light range as the electrodeposition time was extended (Figure 8B–F). This behavior is closely related to the formation of hematite particles on the surface of anodic TiO2, which efficiently absorb visible light due to their narrow band gap (2.2 eV) [31].
Photocurrent density vs. illumination wavelength curves were recorded in 0.1 M KNO3 at 1 V vs. SCE under monochromatic radiation conditions (Figure 9A), and the obtained results are collected in Table S1 in Supplementary Materials. In close view, the sample electrodeposited for 5 s responds the most effectively to UV light irradiation due to the relatively small quantity of hematite particles deposited on the TiO2 surface. As the deposition time increases, more iron particles and, consequently, hematite are deposited on the TiO2 surface, which reduces the intensity of the photocurrent density in the UV range and increases it in the visible light region. The observed decrease in PEC response of the studied materials, with respect to increasing the iron content, is related to the low charge separation efficiency, which in turn is connected with a small hole diffusion length and short excited-state lifetime [43,44,45]. However, the sample with the highest amount of iron, and thus mostly covered with hematite particles, exhibited the highest photoresponse at the wavelength range of 450–500 nm, which is confirmed by the shape of the curve presented in Figure 9A. This PEC response in the visible light region is closely related to the hematite layer, having a narrow band gap (2.2 eV) and completely covering the surface of the anodic TiO2 [31].
From photocurrent density vs. time curves recorded for the Fe2O3–TiO2 samples electrodeposited for a longer period of time and impregnated (Figure S6, Supplementary Materials), it is clearly seen that the kinetics of photocurrent decay changes at higher Fe contents. Comparing the impregnated sample with that electrodeposited for 180 s, it is evident that the steady-state current conditions are gained within the time scale of ‘light on’ cycles for the impregnated sample, while the recombination of photogenerated charge carriers is observed during ‘light on’ cycles for the samples with a higher Fe content [45]. Additionally, for the sample electrodeposited for 180 s, characteristic cathodic current spikes appear when the light is turned off [46].
The incident photon-to-current efficiency (IPCE) values obtained at 1 V vs. SCE for 400 nm, 450 nm, and 500 nm were calculated as shown in Equation (S2) (Supplementary Materials) and presented in Figure 9B and Figure S7A,B and Table S1 in Supplementary Materials, respectively. It can be seen that the highest IPCE value at 400 nm, 450 nm, and 500 nm is observed for the sample electrodeposited for 180 s, which is associated with the formation of hematite absorbing visible light. The impregnated sample shows a similar IPCE value to the sample electrodeposited for 60 s due to a similar hematite content. For all studied samples, band gap values were also determined from PEC measurements as described previously [27,28]. An example of determining the energy band gap is given in Figure S8 in Supplementary Materials. The estimated band gaps are presented in Table S1 in Supplementary Materials. As expected, the lowest band gap was obtained for the sample electrodeposited for 180 s and for that impregnated in a 100 mM FeCl3 solution.
The kinetics of photocurrent decay were studied for the Fe2O3–TiO2 samples exposed to solar irradiation (Figure 9C), and the obtained results are presented in Table S1 (Supplementary Materials). As can be seen from Figure 9C, the anodic current peak related to the accumulation of charge near the surface of the semiconductor and exponential photocurrent decay to steady-state value are observed for the sample electrodeposited for 5 s. However, for longer deposition times (60–180 s), a steady-state photocurrent is reached quickly, almost immediately after the initiation of the ‘light on’ cycle. Among the samples electrodeposited for shorter durations (5–30 s), the sample electrodeposited for 5 s exhibited the best performance due to the highest photocurrent density generated under solar irradiation. It can be attributed to facilitated longitudinal electron transfer from the hematite to the Ti bulk through the TiO2 layer [10]. On the other hand, Fe2O3–TiO2 samples deposited for longer durations (60–180 s) contain hematite particles on the TiO2 surface and are characterized by a similar response, most probably caused by the presence of Fe3+ ions, which can act as recombination centers for photogenerated carriers [18].

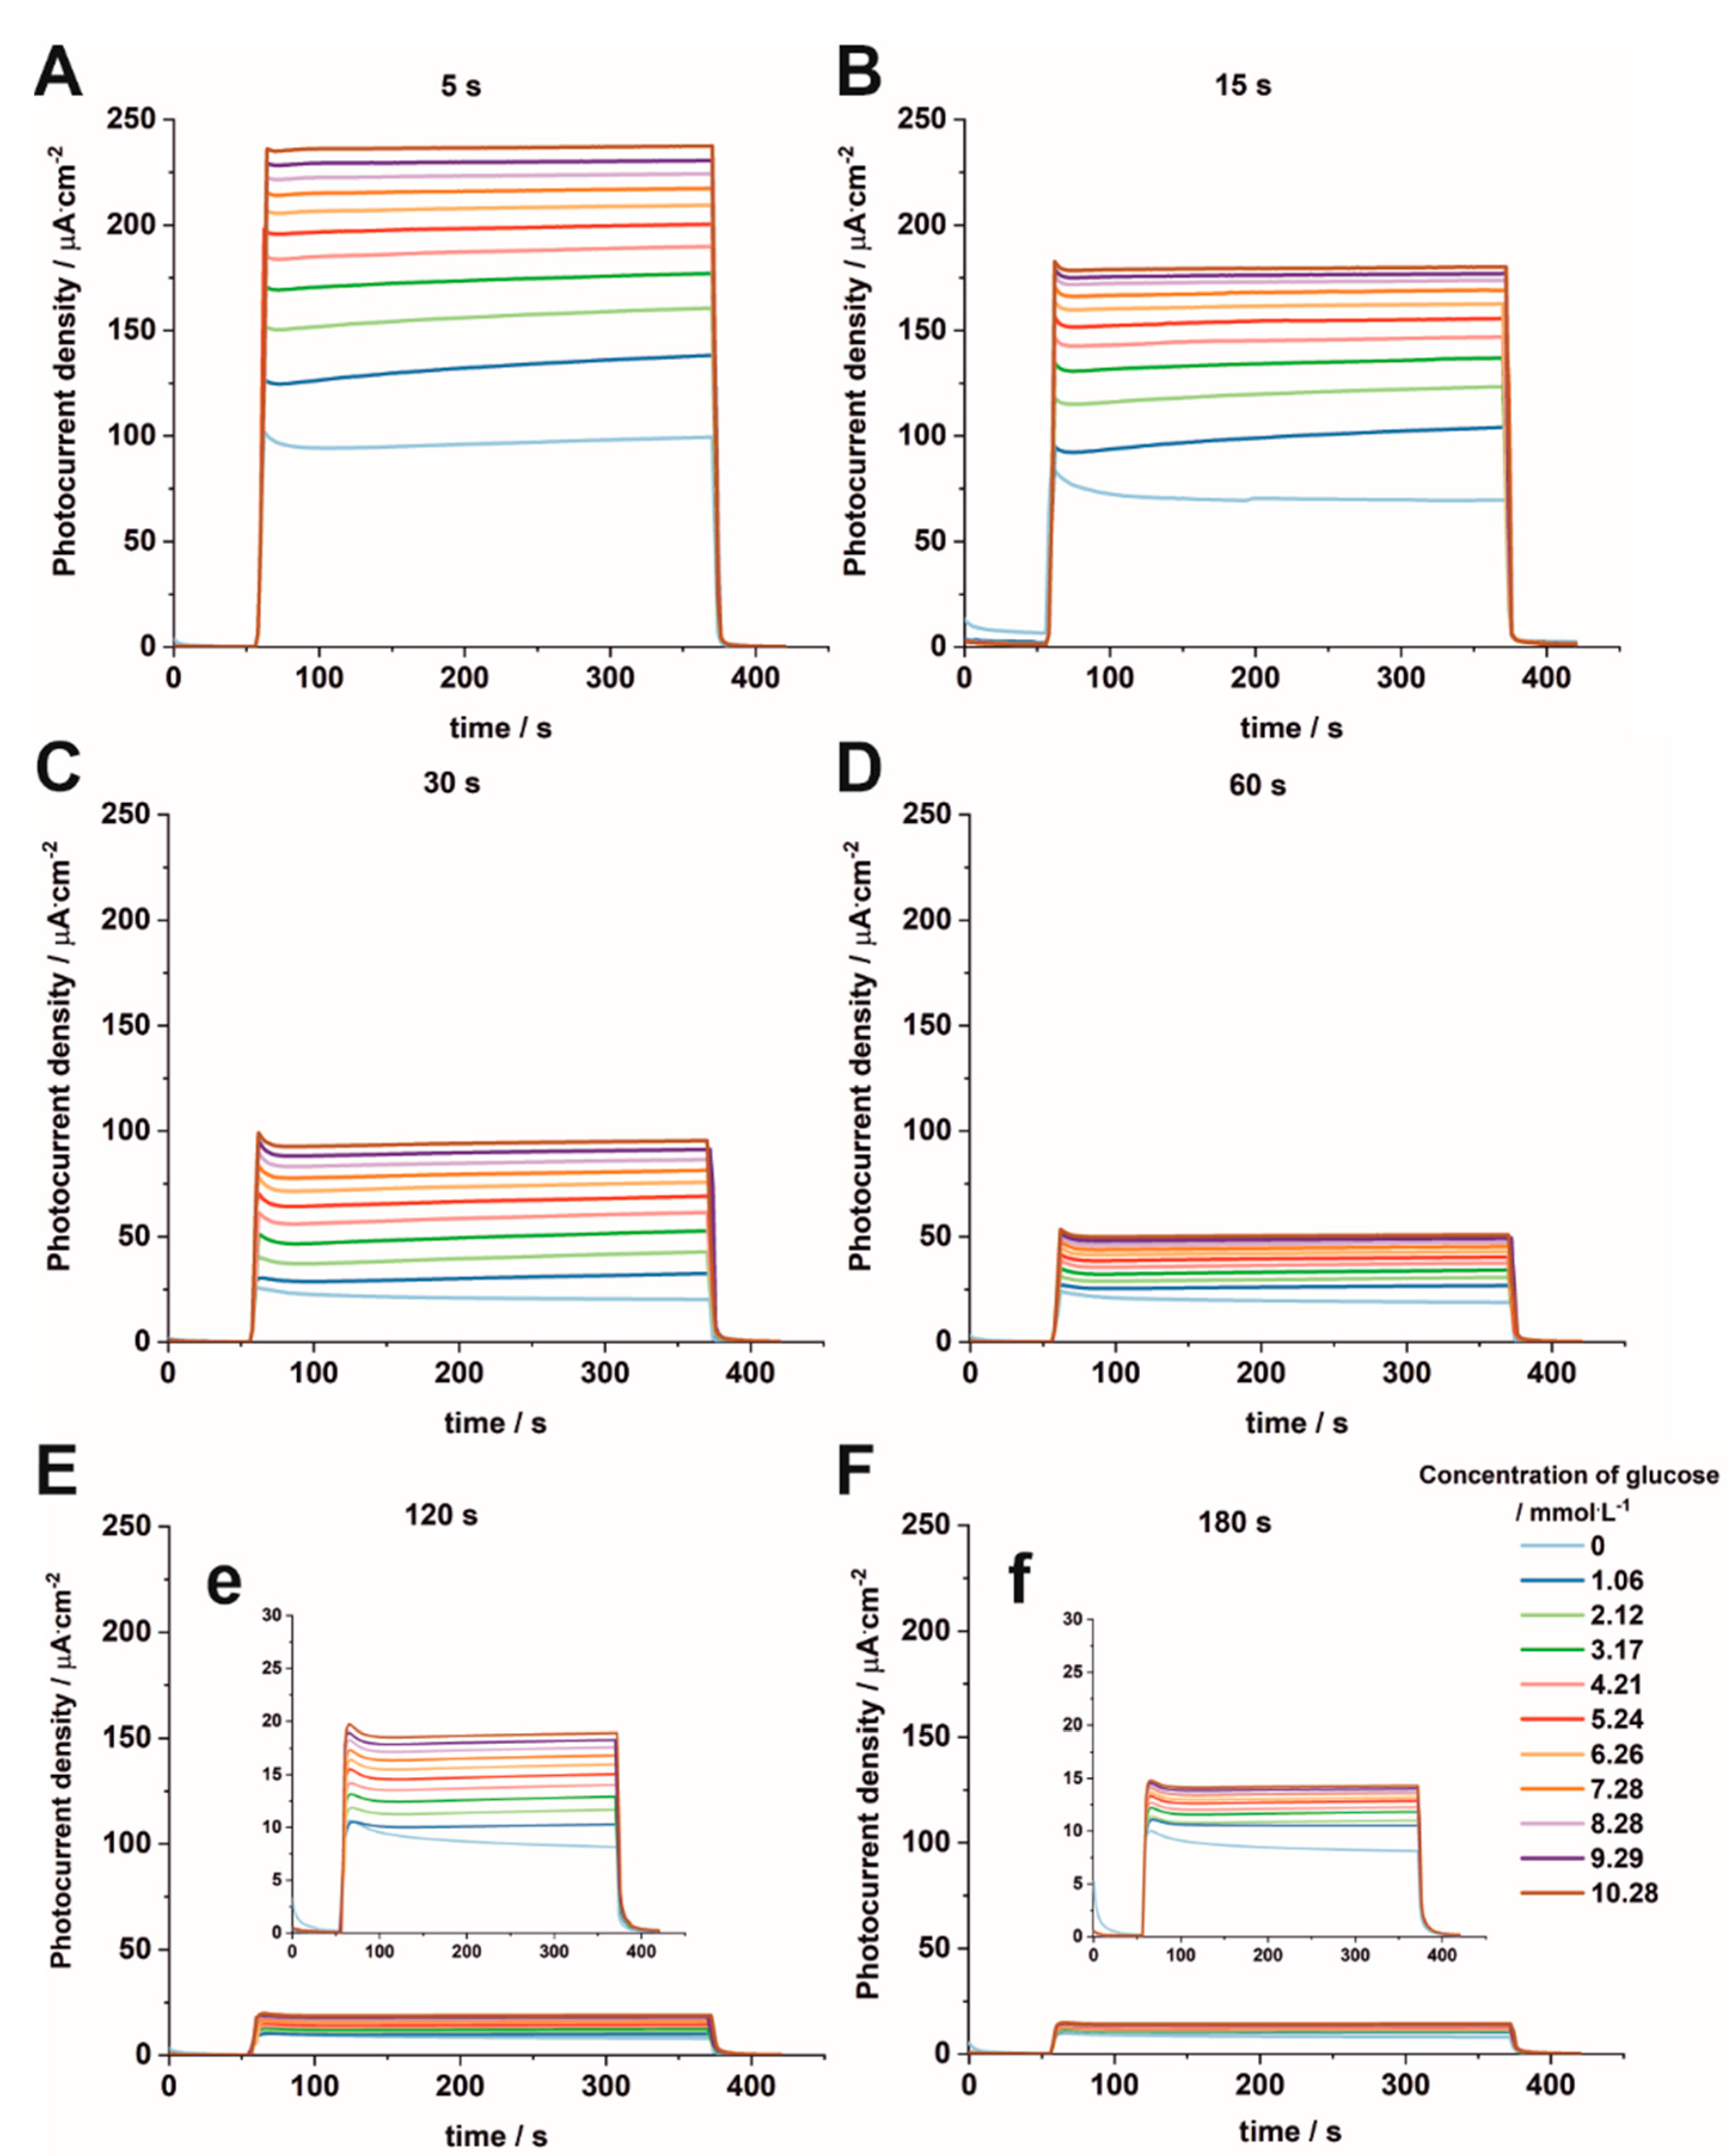
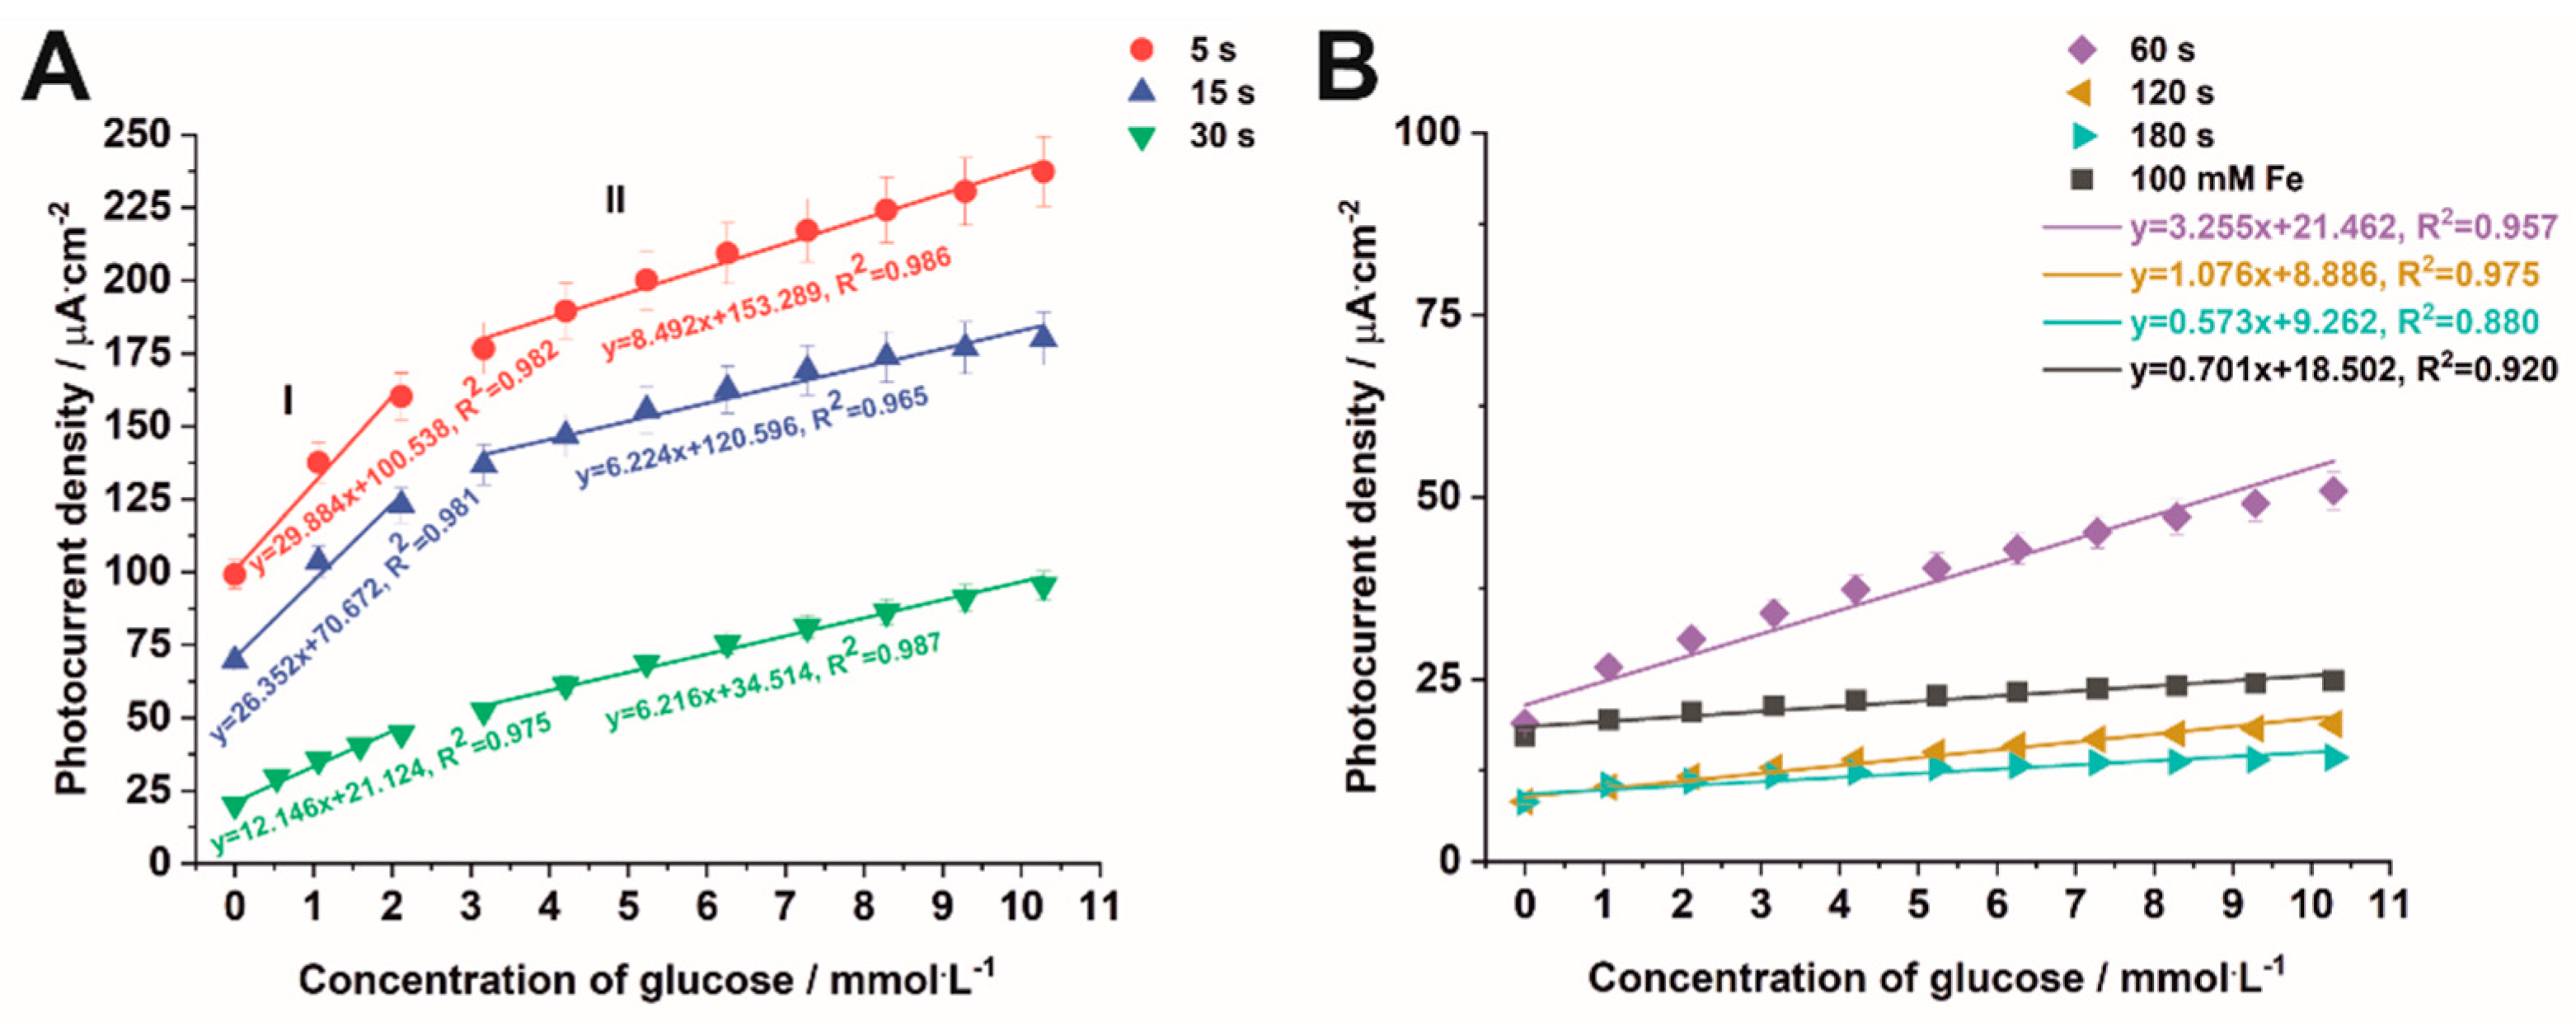
3.4. Non-Enzymatic Glucose Sensing

The above-mentioned materials are typically used for photoelectrochemical and photocatalytic applications, such as water splitting [13], degradation of environmental pollutants [14,15,16], and solar cells [17,18]. However, an interesting recent application of semiconductor materials is their potential use as non-enzymatic glucose photosensors due to their self-cleaning properties [47]. What is more, the effective separation between the excitation source and the detection in the PEC shows ultra-sensitivity and a lower background signal, which might be crucial for biological and chemical analyses [48,49,50,51].
To the best of our knowledge, there is not yet a clear answer in the literature as to whether hybrid Fe2O3–TiO2 materials are suitable as photoelectrodes for the electrochemical detection of glucose. Therefore, all studied samples were tested as photoelectrodes for glucose sensing. For this purpose, photocurrent density vs. time curves were recorded under solar irradiation at 1 V vs. SCE in a 0.1 M KNO3 solution in the presence of different concentrations of glucose for the studied materials (Figure 10). Moreover, the photoelectrochemical performance of the impregnated sample in glucose sensing was also presented for comparison (Figure S9, Supplementary Materials).
It can be seen from Figure 10 that the highest changes in the photocurrent with increasing concentrations of glucose are observed for Fe2O3–TiO2 electrodes obtained by electrodepositions carried out for 5 s (A) and 15 s (B). For samples electrodeposited for longer durations (Figure 10 C–F), the irradiated electrodes generate smaller photocurrent densities, but it can be still noticed that, in the solutions containing higher concentrations of glucose, the photocurrent density increases, such as for the impregnated sample. Additionally, the steady-state photocurrent is reached.
The calibration plots were constructed from the points at t = 350 s (with 5% error marked) from Figure 10. For samples deposited for 5 s to 30 s, two linear regions, namely I (at a low concentration range of 1.06–2.12 mM) and II (at a high concentration range of 3.17–10.28 mM), which demonstrated the best linearity, were fitted to the experimental data (Figure 11A). However, for samples deposited for a longer time and for the impregnated sample, one linear region can be found (Figure 11B). For the linear regions of the calibration plots, the sensitivity and the limit of detection (LOD = 3Sb/m, where Sb is the standard deviation of the blank signal and m is the slope of the calibration curve), and the limit of quantification (LOQ = 10Sb/m) were calculated. As the deposition time increases, the sensitivity of the method estimated for the lower concentration range (range I), as well for the higher concentration range (range II), decreases respectively, from 29.88 µA mM−1 cm−2 and 8.49 µA mM−1 cm−2 for the sample electrodeposited for 5 s to 12.15 µA mM−1 cm−2 and 6.22 µA mM−1 cm−2 for the sample electrodeposited for 30 s. For the samples electrodeposited for 60–180 s, the sensitivity decreases from 3.26 µA mM−1 cm−2 to 0.57 µA mM−1 cm−2. It can be seen that the highest sensitivities were found for the electrodes prepared for the samples electrodeposited for 5 s and 15 s, and they were even better than those obtained by Liu et al. [52] for Fe2O3 nanoparticles on fluorine-doped indium oxide (FTO), which are equal to 17.23 µA mM−1 cm−2. The calculated LOD and LOQ values are collected in Table S2 in Supplementary Materials. It is worth noticing that both LOD and LOQ values decrease with increasing electrodeposition time used for the formation of iron oxide particles on the TiO2 surface. Taking into account the above-mentioned characteristics of the tested electrodes, namely the sensitivity, LOD, and LOQ values, the best electrode for PEC detection of glucose turned out to be that prepared from the sample electrodeposited for 5 s. A comparison of the results obtained for the sample electrodeposited for 5 s with those found in the literature for different kinds of Fe2O3 materials [52,53,54,55,56] is presented in Table S3 in Supplementary Materials. The proposed sensor is distinguished by its sensitivity compared to those in other works.

4. Conclusions

In this research, it was shown that the iron content in the tested Fe2O3–TiO2 materials was in the range of ca. 0.5–30 at.%, depending on the electrodeposition duration. XRD and Raman spectroscopy measurements confirmed the formation of hematite based TiO2 materials. The Mot–-Schottky analyses revealed that flat band potential shifts toward more positive values, which suggests that water oxidation should be facilitated. Based on UV-Vis DRS measurements, two optical energy band gaps were estimated. One, which changes from 3.18 eV to 2.77 eV as deposition time increases to 30 s, and from 2.90 eV to 3.03 eV for longer durations, and an additional energy band gap of about 2.2 eV, appeared due to the presence of hematite. It was noticed that the samples exposed to monochromatic light responded differently in comparison to solar irradiation. The best PEC activity under irradiation with monochromatic UV light and solar light showed the sample deposited for 5 s, due to a low hematite content. However, the best photoresponse under visible light was observed for the sample deposited for 180 s, which is related to the presence of the hematite covering the surface. It was demonstrated that the studied Fe2O3–TiO2 materials are sensitive to the photoelectrochemical detection of glucose and can be used for the preparation of PEC sensors operating under solar radiation.

Supplementary Materials

The following Supplementary Materials can be downloaded at https://www.mdpi.com/article/10.3390/nano12091546/s1: Figure S1, Current density-time curves recorded during Fe deposition at -1.3 V vs. SCE for different durations (5–180 s) (A). The corresponding total charge densities obtained from current-time transients (B); Figure S2, Raman spectra of the Fe2O3–TiO2 sample electrodeposited for 60 s. The colors of different areas at the image correspond to the colors of the Raman spectra; Figure S3, Example of determination of the energy band gap from UV-Vis measurements together with a diffuse reflectance plot (a); Figure S4, Mott–Schottky plots measured at different frequencies (1000, 500, and 200 Hz) for the sample electrodeposited for 5 s; Figure S5, Average donor densities estimated for all studied materials, and for all tested frequencies; Figure S6, Photocurrent density vs. time curves recorded at 1 V vs. SCE for Fe2O3–TiO2 samples obtained by electrodeposition for 60 s and 180 s as well as by impregnation method; Figure S7, IPCE values obtained under monochromatic radiation for all modified samples at 450 nm (A) and 500 nm (B); Figure S8, Example of determining the energy band gap from photoelectrochemical measurements for the Fe2O3–TiO2 sample obtained by electrodeposition for 30 s; Figure S9, Photocurrent density vs. time curves measured at 1 V vs. SCE in 0.1 M KNO3 containing 1.06–10.28 mM of glucose under solar irradiation of the Fe2O3–TiO2 sample impregnated in 100 mM FeCl3 with inset; Table S1, The comparison of PEC properties of Fe2O3–TiO2 materials measured in 0.1 M KNO3 at 1 V vs. SCE; Table S2, Calculated LOD and LOQ values for all studied Fe2O3–TiO2 electrodes; Table S3, Glucose-sensing characteristics of the proposed sensor compared with data in the literature.

Author Contributions

Conceptualization, M.S.-M., K.S. and G.D.S.; methodology, M.S.-M., K.S., K.M. and G.D.S.; investigation, M.S.-M. and Ł.P.; writing—original draft preparation, M.S.-M., K.S., K.M. and G.D.S.; writing—review and editing, M.S.-M., K.S. and G.D.S.; visualization, M.S.-M.; supervision, G.D.S.; funding acquisition, G.D.S. All authors have read and agreed to the published version of the manuscript.

Funding

The research was funded by the National Science Centre Poland (Project No. 2016/23/B/ST5/00790).

Institutional Review Board Statement

Not applicable.

Informed Consent Statement

Not applicable.

Data Availability Statement

Not applicable.

Acknowledgments

The SEM imaging was performed in the Laboratory of Field Emission Scanning Electron Microscopy and Microanalysis at the Institute of Geological Sciences, Jagiellonian University, Poland.

Conflicts of Interest

The authors declare no conflict of interest.

References

  1. Carp, O.; Huisman, C.L.; Reller, A. Photoinduced reactivity of titanium dioxide. Prog. Solid State Chem. 2004, 32, 33–177. [Google Scholar] [CrossRef]
  2. Chernomordik, B.D.; Russell, H.B.; Cvelbar, U.; Jasinski, J.B.; Kumar, V.; Deutsch, T.; Sunkara, M.K. Photoelectrochemical activity of as-grown, α-Fe2O3 nanowire array electrodes for water splitting. Nanotechnology 2012, 23, 194009. [Google Scholar] [CrossRef] [PubMed] [Green Version]
  3. Qin, Y.X.; Yang, Z.Z.; Wang, J.J.; Xie, Z.Y.; Cui, M.Y.; Tian, C.M.; Du, Y.G.; Zhang, K.H.L. Epitaxial growth and band alignment of p-NiO/n-Fe2O3 heterojunction on Al2O3(0001). Appl. Surf. Sci. 2019, 464, 488–493. [Google Scholar] [CrossRef]
  4. Zhang, D.; Dong, S. Challenges in band alignment between semiconducting materials: A case of rutile and anatase TiO2. Prog. Nat. Sci. Mater. 2019, 29, 277–284. [Google Scholar] [CrossRef]
  5. Kodan, N.; Agarwal, K.; Mehta, B.R. All-oxide α-Fe2O3/H:TiO2 heterojunction photoanode: A platform for stable and enhanced photoelectrochemical performance through favorable band edge alignment. J. Phys. Chem. C 2019, 123, 3326–3335. [Google Scholar] [CrossRef]
  6. Danilov, F.I.; Tsurkan, A.V.; Vasil’eva, E.A.; Protsenko, V.S. Electrocatalytic activity of composite Fe/TiO2 electrodeposits for hydrogen evolution reaction in alkaline solutions. Int. J. Hydrogen Energy 2016, 41, 7363–7372. [Google Scholar] [CrossRef]
  7. Park, H.; Ayala, P.; Deshusses, M.A.; Mulchandani, A.; Choi, H.; Myung, N.V. Electrodeposition of maghemite (γ-Fe2O3) nanoparticles. Chem. Eng. J. 2008, 139, 208–212. [Google Scholar] [CrossRef]
  8. Kimmich, D.; Taffa, D.H.; Dosche, C.; Wark, M.; Wittstock, G. Photoactivity andscattering behavior of anodically and cathodically deposited hematite photoanodes—A comparison by scanning photoelectrochemical microscopy. Electrochim. Acta 2016, 202, 224–230. [Google Scholar] [CrossRef]
  9. Schrebler, R.S.; Altamirano, H.; Grez, P.; Herrera, F.V.; Muñz, E.C.; Ballesteros, L.A.; Córdova, R.A.; Gómez, H.; Dalchiele, E.A. The influence of different electrodeposition E/t programs on the photoelectrochemical properties of α-Fe2O3 thin films. Thin Solid Films 2010, 518, 6844–6852. [Google Scholar] [CrossRef]
  10. Tamboli, S.H.; Rahman, G.; Joo, O.-S. Influence of potential, deposition time and annealing temperature on photoelectrochemical properties of electrodeposited iron oxide thin films. J. Alloys Compd. 2012, 520, 232–237. [Google Scholar] [CrossRef]
  11. Mohapatra, S.K.; Banerjee, S.; Misra, M. Synthesis of Fe2O3/TiO2 nanorod–nanotube arrays by filling TiO2 nanotubes with Fe. Nanotechnology 2008, 19, 315601. [Google Scholar] [CrossRef] [PubMed]
  12. Liang, Y.Q.; Cui, Z.D.; Zhu, S.L.; Yang, X.J. Formation and characterization of iron oxide nanoparticles loaded on self-organized TiO2 nanotubes. Electrochim. Acta 2010, 55, 5245–5252. [Google Scholar] [CrossRef]
  13. Jeon, T.H.; Choi, W.; Park, H. Photoelectrochemical and photocatalytic behaviors of hematite-decorated titania nanotube arrays: Energy level mismatch versus surface specific reactivity. J. Phys. Chem. C 2011, 115, 7134–7142. [Google Scholar] [CrossRef]
  14. Cong, Y.-Q.; Li, Z.; Wang, Q.; Zhang, Y.; Xu, Q.; Fu, F.-X. Enhanced photoeletrocatalytic activity of TiO2 nanotube arrays modified with simple transition metal oxides (Fe2O3, CuO, NiO). Acta Phys. Chim. Sin. 2012, 28, 1489–1496. [Google Scholar]
  15. Cong, Y.; Li, Z.; Zhang, Y.; Wang, Q.; Xu, Q. Synthesis of α-Fe2O3/TiO2 nanotube arrays for photoelectro-Fenton degradation of phenol. Chem. Eng. J. 2012, 191, 356–363. [Google Scholar] [CrossRef]
  16. Ren, K.; Gan, Y.X.; Young, T.J.; Moutassem, Z.M.; Zhang, L. Photoelectrochemical responses of doped and coated titanium dioxide composite nanotube anodes. Compos. B Eng. 2013, 52, 292–302. [Google Scholar] [CrossRef]
  17. Tsui, L.-k.; Zangari, G. The influence of morphology of electrodeposited Cu2O and Fe2O3 on the conversion efficiency of TiO2 nanotube photoelectrochemical solar cells. Electrochim. Acta 2013, 100, 220–225. [Google Scholar] [CrossRef]
  18. Chin, L.Y.; Mustaffa, N.; Ayal, A.K.; Kanakaraju, D.; Pei, L.Y. Structural characterization and visible light-induced photoelectrochemical performance of Fe-sensitized TiO2 nanotube arrays prepared via electrodeposition. Malays. J. Chem. 2021, 23, 173–182. [Google Scholar]
  19. Radecka, M.; Rekas, M.; Trenczek-Zajac, A.; Zakrzewska, K. Importance of the band gap energy and flat band potential for application of modified TiO2 photoanodes in water photolysis. J. Power Sources 2008, 181, 46–55. [Google Scholar] [CrossRef]
  20. Muñoz, A.G. Semiconducting properties of self-organized TiO2 nanotubes. Electrochim. Acta 2007, 52, 4167–4176. [Google Scholar] [CrossRef]
  21. Acevedo-Pena, P.; Carrera-Crespo, J.E.; Gonzalez, F.; Gonzalez, I. Effect of heat treatment on the crystal phase composition, semiconducting properties and photoelectrocatalytic color removal efficiency of TiO2 nanotubes arrays. Electrochim. Acta 2014, 140, 564–571. [Google Scholar] [CrossRef]
  22. Syrek, K.; Sennik-Kubiec, A.; Rodriguez-Lopez, J.; Rutkowska, M.; Żmudzki, P.; Hnida-Gut, K.E.; Grudzień, J.; Chmielarz, L.; Sulka, G.D. Reactive and morphological trends on porous anodic TiO2 substrates obtained at different annealing temperatures. Int. J. Hydrogen Energy 2020, 45, 4376–4389. [Google Scholar] [CrossRef]
  23. Sulka, G.D.; Kapusta-Kołodziej, J.; Brzózka, A.; Jaskuła, M. Fabrication of nanoporous TiO2 by electrochemical anodization. Electrochim. Acta 2010, 55, 4359–4367. [Google Scholar] [CrossRef]
  24. Kapusta-Kołodziej, J.; Syrek, K.; Pawlik, A.; Jarosz, M.; Tynkevych, O.; Sulka, G.D. Effects of anodizing potential and temperature on the growth of anodic TiO2 and its photoelectrochemical properties. Appl. Surf. Sci. 2017, 396, 1119–1129. [Google Scholar] [CrossRef]
  25. Jarosz, M.; Syrek, K.; Kapusta-Kołodziej, J.; Mech, J.; Małek, K.; Hnida, K.; Łojewski, T.; Jaskula, M.; Sulka, G.D. Heat treatment effect on crystalline structure and photoelectrochemical properties of anodic TiO2 nanotube arrays formed in ethylene glycol and glycerol based electrolytes. J. Phys. Chem. C 2015, 119, 24182–24191. [Google Scholar] [CrossRef]
  26. Syrek, K.; Kapusta-Kołodziej, J.; Jarosz, M.; Sulka, G.D. Effect of electrolyte agitation on anodic titanium dioxide (ATO) growth and its photoelectrochemical properties. Electrochim. Acta 2015, 180, 801–810. [Google Scholar] [CrossRef]
  27. Sołtys-Mróz, M.; Syrek, K.; Pierzchała, J.; Wiercigroch, E.; Malek, K.; Sulka, G.D. Band gap engineering of nanotubular Fe2O3-TiO2 photoanodes by wet impregnation. Appl. Surf. Sci. 2020, 517, 146195. [Google Scholar] [CrossRef]
  28. Sołtys-Mróz, M.; Syrek, K.; Wiercigroch, E.; Małek, K.; Rokosz, K.; Raaen, S.; Sulka, G.D. Enhanced visible light photoelectrochemical water splitting using nanotubular FeOx-TiO2 annealed at different temperatures. J. Power Sources 2021, 507, 230274. [Google Scholar] [CrossRef]
  29. El Sawy, E.N.; Birss, V.I. Nano-porous iridium and iridium oxide thin films formed by high efficiency electrodeposition. J. Mater. Chem. 2009, 19, 8244–8252. [Google Scholar] [CrossRef]
  30. Ghicov, A.; Schmuki, P. Self-ordering electrochemistry: A review on growth and functionality of TiO2 nanotubes and other self-aligned MOx structures. Chem. Commun. 2009, 2791–2808. [Google Scholar] [CrossRef]
  31. Liŭ, D.; Li, Z.; Wang, W.; Wang, G.; Liú, D. Hematite doped magnetic TiO2 nanocomposites with improved photocatalytic activity. J. Alloys Compd. 2016, 654, 491–497. [Google Scholar] [CrossRef]
  32. Aïnouche, L.; Hamadou, L.; Kadri, A.; Benbrahim, N.; Bradai, D. Interfacial barrier layer properties of three generations of TiO2 nanotube arrays. Electrochim. Acta 2014, 133, 597–609. [Google Scholar] [CrossRef]
  33. Rahman, G.; Joo, O.-S. Photoelectrochemical water splitting at nanostructured α-Fe2O3 electrodes. Int. J. Hydrogen Energy 2012, 37, 13989–13997. [Google Scholar] [CrossRef]
  34. Kontos, A.I.; Likodimos, V.; Stergiopoulos, T.; Tsoukleris, D.S.; Falaras, P.; Rabias, I.; Papavassiliou, G.; Kim, D.; Kunze, J.; Schmuki, P. Self-organized anodic TiO2 nanotube arrays functionalized by iron oxide nanoparticles. Chem. Mater. 2009, 21, 662–672. [Google Scholar] [CrossRef]
  35. Zhu, Z.; Murugananthan, M.; Gu, J.; Zhang, Y. Fabrication of a Z-scheme g-C3N4/Fe-TiO2 photocatalytic composite with enhanced photocatalytic activity under visible light irradiation. Catalysts 2018, 8, 112. [Google Scholar] [CrossRef] [Green Version]
  36. Iandolo, B.; Zhang, H.; Wickman, B.; Zori, I.; Conibeer, G.; Hellman, A. Correlating flatband and onset potentials for solar water splitting on model hematite photoanodes. RSC Adv. 2015, 5, 61021–61030. [Google Scholar] [CrossRef] [Green Version]
  37. Goncalves, R.H.; Lima, B.H.R.; Leite, E.R. Magnetite colloidal nanocrystals: A facile pathway to prepare mesoporous hematite thin films for photoelectrochemical water splitting. J. Am. Chem. Soc. 2011, 133, 6012–6019. [Google Scholar] [CrossRef]
  38. Cesar, I.; Sivula, K.; Kay, A.; Zboril, R.; Grätzel, M. Influence of feature size, film thickness, and silicon doping on the performance of nanostructured hematite photoanodes for solar water splitting. J. Phys. Chem. C 2009, 113, 772–782. [Google Scholar] [CrossRef]
  39. Sellers, M.C.K.; Seebauer, E.G. Measurement method for carrier concentration in TiO2 via the Mott–Schottky approach. Thin Solid Films 2011, 519, 2103–2110. [Google Scholar] [CrossRef]
  40. Hu, Y.-S.; Kleiman-Shwarsctein, A.; Forman, A.J.; Hazen, D.; Park, J.-N.; McFarland, E.W. Pt-doped α-Fe2O3 thin films active for photoelectrochemical water splitting. Chem. Mater. 2008, 20, 3803–3805. [Google Scholar] [CrossRef]
  41. Smith, W.A.; Sharp, I.D.; Strandwitz, N.C.; Bisquert, J. Interfacial band-edge energetics for solar fuels production. Energy Environ. Sci. 2015, 8, 2851–2862. [Google Scholar] [CrossRef] [Green Version]
  42. Seger, B.; Tilley, S.D.; Pedersen, T.; Vesborg, P.C.K.; Hansen, O.; Gratzel, M.; Chorkendorff, I. Silicon protected with atomic layer deposited TiO2: Conducting versus tunnelling through TiO2. J. Mater. Chem. A 2013, 1, 15089–15094. [Google Scholar] [CrossRef]
  43. Tamirat, A.G.; Rick, J.; Dubale, A.A.; Sub, W.-N.; Hwang, B.-J. Using hematite for photoelectrochemical water splitting: A review of current progress and challenges. Nanoscale Horiz. 2016, 1, 243–267. [Google Scholar] [CrossRef] [PubMed]
  44. Venkata Reddy, C.; Neelakanta Reddy, I.; Akkinepally, B.; Raghava Reddy, K.; Shim, J. Synthesis and photoelectrochemical water oxidation of (Y, Cu) codoped α-Fe2O3 nanostructure photoanode. J. Alloys Compd. 2020, 814, 152349. [Google Scholar] [CrossRef]
  45. Kment, S.; Riboni, F.; Pausova, S.; Wang, L.; Wang, L.; Han, H.; Hubicka, Z.; Krysa, J.; Schmuki, P.; Zboril, R. Photoanodes based on TiO2 and α-Fe2O3 for solar water splitting—Superior role of 1D nanoarchitectures and of combined heterostructures. Chem. Soc. Rev. 2017, 46, 3716–3769. [Google Scholar] [CrossRef] [PubMed]
  46. Syrek, K.; Skolarczyk, M.; Zych, M.; Sołtys-Mróz, M.; Sulka, G.D. A photoelectrochemical sensor based on anodic TiO2 for glucose determination. Sensors 2019, 19, 4981. [Google Scholar] [CrossRef] [Green Version]
  47. Soliveri, G.; Pifferi, V.; Panzarasa, G.; Ardizzone, S.; Cappelletti, G.; Meroni, D.; Sparnaccic, K.; Falciola, L. Self-cleaning properties in engineered sensors for dopamine electroanalytical detection. Analyst 2015, 140, 1486. [Google Scholar] [CrossRef] [Green Version]
  48. Ibrahim, I.; Lim, H.N.; Zawawi, R.M.; Tajudin, A.A.; Ng, Y.H.; Guo, H.; Huang, N.M. A review on visible-light induced photoelectrochemical sensors based on CdS nanoparticles. J. Mater. Chem. B 2018, 6, 4551. [Google Scholar] [CrossRef]
  49. Hou, T.; Zhang, L.; Sun, X.; Li, F. Biphasic photoelectrochemical sensing strategy based on in situ formation of CdS quantum dots for highly sensitive detection of acetylcholinesterase activity and inhibition. Biosens. Bioelectron. 2016, 75, 359–364. [Google Scholar] [CrossRef]
  50. Osterloh, F.E. Inorganic nanostructures for photoelectrochemical and photocatalytic water splitting. Chem. Soc. Rev. 2013, 42, 2294–2320. [Google Scholar] [CrossRef]
  51. Wang, H.; Ye, H.; Zhang, B.; Zhao, F.; Zeng, B. Electrostatic interaction mechanism based synthesis of a Z-scheme BiOI–CdS photocatalyst for selective and sensitive detection of Cu2+. J. Mater. Chem. A 2017, 5, 10599–10608. [Google Scholar] [CrossRef]
  52. Liu, F.; Wang, P.; Zhang, Q.; Wang, Z.; Liu, Y.; Zheng, Z.; Qin, X.; Zhang, X.; Dai, Y.; Huang, B. α-Fe2O3 film with highly photoactivity for non-enzymatic photoelectrochemical detection of glucose. Electroanalysis 2019, 31, 1809–1814. [Google Scholar] [CrossRef]
  53. Cao, X.; Wang, N. A novel non-enzymatic glucose sensor modified with Fe2O3 nanowire arrays. Analyst 2011, 136, 4241–4246. [Google Scholar] [CrossRef] [PubMed]
  54. Xu, L.; Xia, J.; Wang, L.; Qian, J.; Li, H.; Wang, K.; Sun, K.; He, M. α-Fe2O3 cubes with high visible-light-activated photoelectrochemical activity towards glucose: Hydrothermal synthesis assisted by a hydrophobic ionic liquid. Chem. Eur. J. 2014, 20, 2244–2253. [Google Scholar] [CrossRef] [PubMed]
  55. Xing, Z.C.; Tian, J.Q.; Asiri, A.M.; Qusti, A.H.; Al-Youbi, A.O.; Sun, X.P. Two-dimensional hybrid mesoporous Fe2O3–graphene nanostructures: A highly active and reusable peroxidase mimetic toward rapid, highly sensitive optical detection of glucose. Biosens. Bioelectron. 2014, 52, 452–457. [Google Scholar] [CrossRef]
  56. He, L.; Zhang, Q.; Gong, C.; Liu, H.; Hu, F.; Zhong, F.; Wang, G.; Su, H.; Wen, S.; Xiang, S.; et al. The dual-function of hematite-based photoelectrochemical sensor for solar-to-electricity conversion and self-powered glucose detection. Sens. Actuators B Chem. 2020, 310, 12784. [Google Scholar] [CrossRef]
Figure 1. Synthesis of nanostructured Fe2O3–TiO2 by impregnation (A1) and electrochemical deposition (B2).
Nanomaterials 12 01546 g001
Figure 2. SEM images with EDS maps of Fe distribution (insets) of hybrid Fe2O3–TiO2 samples electrodeposited for 5 s (A), 15 s (B), 30 s (C), 60 s (D), 120 s (E), and 180 s (F), and impregnated in a 100 mM FeCl3 solution (G). The estimated average iron content for the corresponding modified samples (H).
Nanomaterials 12 01546 g002
Figure 3. XRD patterns of all studied Fe2O3–TiO2 materials.
Nanomaterials 12 01546 g003
Figure 4. Raman spectra of the Fe2O3–TiO2 samples obtained by electrodeposition for 5–120 s (A) and 180 s (B). The colors of different areas on the picture correspond to the colors of the Raman spectra.
Nanomaterials 12 01546 g004
Figure 5. Band gap energies estimated from UV–Vis DRS measurements for all tested Fe2O3–TiO2 materials.
Nanomaterials 12 01546 g005
Figure 6. Mott–Schottky plots measured at 1000 Hz for the Fe2O3–TiO2 samples obtained by electrodeposition for 5 (A), 15 s (B), 30 s (C), 60 s (D), 120 s (E), and 180 s (F).
Nanomaterials 12 01546 g006
Figure 7. Energy positions of the conduction band (CB) and valence band (VB) of the studied Fe2O3–TiO2 samples.
Nanomaterials 12 01546 g007
Figure 8. Photocurrent density vs. incident light wavelength and applied potential in 0.1 M KNO3 for Fe2O3–TiO2 samples obtained by electrodeposition for 5 s (A), 15 s (B), 30 s (C), 60 s (D), 120 s (E), and 180 s (F).
Nanomaterials 12 01546 g008
Figure 9. Photocurrent density vs. wavelength curves at 1 V vs. SCE in 0.1 M KNO3 under monochromatic radiation for Fe2O3–TiO2 samples obtained by electrodeposition for 5–180 s and impregnated in 100 mM FeCl3 (A). IPCE values obtained under monochromatic radiation for all modified samples at 400 nm (B). Photocurrent density vs. time curves at 1 V vs. SCE in 0.1 M KNO3 under solar radiation with the Air-Mass 1.5G filter for all modified samples (C).
Nanomaterials 12 01546 g009
Figure 10. Photocurrent density vs. time curves measured at 1 V vs. SCE in 0.1 M KNO3 containing 1.06–10.28 mM of glucose under solar irradiation for samples deposited after 5 s (A), 15 s (B), 30 s (C), 60 s (D), 120 s (E), and 180 s (F), with insets (e) and (f).
Nanomaterials 12 01546 g010
Figure 11. Calibration curves of photocurrent density against the concentration of glucose for Fe2O3–TiO2 electrodes obtained by electrodeposition carried out for 5–30 s (A) and for 60–180 s together with the sample impregnated in a 100 mM FeCl3 solution (B).
Nanomaterials 12 01546 g011
Table 1. Procedures for the synthesis of Fe/Fe2O3–TiO2 materials by electrochemical deposition of iron/iron oxides in anodic TiO2 nanotubes (NTs). Dp—pore diameter (inner); Dc—interpore distance (outer); L—length; W—wall thickness; A—anodic; C—cathodic; P—pulsed; PC—potential cycling.
Morphology of TiO2 NTs [nm]Pre-Treatment (Immersion)Electrochemical Deposition ConditionsPost-TreatmentObtained MaterialRef.
Electrolytic BathTemperature [°C]Time [s]Technique/Conditions
Dp = 80
L ≈ 550
W = 15–20
-aqueous solution of 60 g FeSO4, 1.5 g C6H8O6, 0.5 g H2NSO3H, 15 g H3BO3ambient60–300P
cathodic current pulse:
8 ms of −70 mAcm−2;
anodic potential pulse:
2 ms of 3 V
Annealing
500 °C for 6 h in an oxygen atmosphere
α-Fe2O3–TiO2 NTs[11]
- -0.02 M
FeCl3 in water:glycerol mixture (volume ratio: 1:1)
ambient300–3600C
potential: −1 V, −3 V, −5 V
Annealing
450 °C
for 2 h in air
α-Fe2O3–TiO2 NTs[12]
Dp = 100
L = 400–500
5 mM NaF, 0.1 M NaCl, 1 M H2O2, 5 mM FeCl3 for 1 h, and 24 h5 mM NaF, 0.1 M NaCl, 1 M H2O2, 5 mM FeCl3--PC
potential: −0.52 V to 0.41 V vs. SCE,
sweep rate: 0.1 V s−1,
number of cycles: 50
Annealing
500 °C for 30 min in air
Fe2O3@TiO2 NTs[13]
Dp = 80–100
W = 15 – 20
Dp ≈ 80
Dc ≈ 110
L ≈ 1200
0.05 M Fe(NO3)3 for 10 min0.1 M Na2SO4851200A
potential: 8 V
Electrochemical oxidation of Fe/TiO2-NT at 8 V for 2 min at room temperature in 1 M KOHFe2O3/TiO2 NTs[14,15]
Dc = 270
L = 3300
-0.2 M
Fe(NO3)3
25-PC
potential: 0 to −0.5 V vs. Ag/AgCl,
scan rate: 0.01 V s−1, number of cycle: 2
-Fe–TiO2 NTs[16]
Dp ≈ 75
L = 1000
-0.1 M FeSO4, 0.1 M H3BO3 (pH 3.5)-20–160C
potential: −1.3 V vs. SCE
Annealing
450 °C for 3 h in air
Fe2O3/TiO2-NTs[17]
Dp = 54 ± 9
Dc = 93 ± 11
W = 18 ± 5
-0.1 M FeCl3-600 A
potential: 2 V, 2.5 V, 3 V, 4 V
Annealing
500 °C for 2 h
Fe–TiO2 NTs[18]
Publisher’s Note: MDPI stays neutral with regard to jurisdictional claims in published maps and institutional affiliations.

