Article

Improved TEA Sensitivity and Selectivity of In2O3 Porous Nanospheres by Modification with Ag Nanoparticles

1
School of Materials Science and Engineering, Henan Polytechnic University, Jiaozuo 454000, China
2
The Collaboration Innovation Center of Coal Safety Production of Henan Province, Henan Polytechnic University, Jiaozuo 454000, China
3
School of Chemistry and Chemical Engineering, Henan Polytechnic University, Jiaozuo 454000, China
*
Authors to whom correspondence should be addressed.
Nanomaterials 2022, 12(9), 1532; https://doi.org/10.3390/nano12091532
Submission received: 31 March 2022 / Revised: 17 April 2022 / Accepted: 27 April 2022 / Published: 2 May 2022

Abstract

:
A highly sensitive and selective detection of volatile organic compounds (VOCs) by using gas sensors based on metal oxide semiconductor (MOS) has attracted increasing interest, but still remains a challenge in gas sensitivity and selectivity. In order to improve the sensitivity and selectivity of In2O3 to triethylamine (TEA), herein, a silver (Ag)-modification strategy is proposed. Ag nanoparticles with a size around 25–30 nm were modified on pre-synthesized In2O3 PNSs via a simple room-temperature chemical reduction method by using NaBH4 as a reductant. The results of gas sensing tests indicate that after functionalization with Ag, the gas sensing performance of In2O3 PNSs for VOCs, especially for TEA, was remarkably improved. At a lower optimal working temperature (OWT) of 300 °C (bare In2O3 sensor: 320 °C), the best Ag/In2O3-2 sensor (Ag/In2O3 PNSs with an optimized Ag content of 2.90 wt%) shows a sensitivity of 116.86/ppm to 1–50 ppm TEA, about 170 times higher than that of bare In2O3 sensor (0.69/ppm). Significantly, the Ag/In2O3-2 sensor can provide a response (Ra/Rg) as high as 5697 to 50 ppm TEA, which is superior to most previous TEA sensors. Besides lower OWT and higher sensitivity, the Ag/In2O3-2 sensor also shows a remarkably improved selectivity to TEA, whose selectivity coefficient (STEA/Sethanol) is as high as 5.30, about 3.3 times higher than that of bare In2O3 (1.59). The sensitization mechanism of Ag on In2O3 is discussed in detail.

1. Introduction

In recent decades, with the sustained growth of environmental issues, fast and timely detection of flammable and harmful gases in our surroundings has attracted increasing attention [1,2,3,4]. Triethylamine (TEA), as a member of volatile organic compounds (VOCs), is a typical organic amine compound with strong pungent smell, which has been widely used in industry as a catalyst, solvent, synthetic fuel, preservative, and so on [5,6]. However, owing to its toxic nature, long-term exposure to excessive TEA (>1 ppm) may cause a series of health problems, such as skin irritation, headache, gastroenteritis, and pulmonary edema [7,8]. In practice, some traditional techniques, such as chromatographic and colorimetric methods, have been applied to detect TEA, but usually suffer from high price, complicated operations, and time-consuming detection processes [9]. Therefore, developing fast and convenient techniques for TEA detection is of great important.
Among different state-of-the-art gas detection techniques, gas sensors based on metal oxide semiconductor (MOS) have attracted extensive attention because of their outstanding merits of low price, small volume, easy fabrication and integration, high sensitivity for diverse gases, and fast response speed [10,11,12,13]. Up to now, several MOSs such as SnO2 [14], ZnO [15], TiO2 [16], WO3 [17], In2O3 [18,19], and Fe2O3 [20] have been studied for TEA sensor application, and significant advances have been achieved. However, there are still some obstacles that need to be overcome from the perspective of practical application, especially in the aspects of sensitivity and selectivity. In previous studies, yearning to improve the gas sensing properties of MOS, researchers have attempted several sensitization strategies. These strategies mainly include fabrication of novel nanostructures [21], doping with foreign element [22,23], modification with noble metal (nanoparticles or single atoms) [24,25,26], and combination with other MOSs to construct heterojunction [27,28]. Among these strategies, modification with nano-sized noble metals was found to be very effective to upgrade the gas sensing performance of MOS, especially in the aspect of gas sensitivity. For example, Sukee et al. [29] prepared Ag-loaded LaFeO3 by a flame spray pyrolysis (FSP) method and found that the 0.1 wt% Ag-loaded LaFeO3 sensor showed a response of 60 to 100 ppm acetylene, almost 12 times higher than that of the pure LaFeO3 sensor. Cai et al. [30] fabricated a highly selective H2 sensor fabricated with Pd nanoparticle-decorated SnO2 nanowires, whose response to 100 ppm H2 was about 12.7 times higher than that of the bare SnO2 sensor. Yang et al. [31] reported that, benefitting from the increased concentration of oxygen vacancy after modification with Au, the Au-decorated In2O3 hollow nanosphere sensor showed excellent sensitivity (26.3 of 100 ppm) and selectivity toward 1-butylamine at the optimized working temperature of 340 °C. All of the above studies have demonstrated that during the gas sensing process, the noble metal sensitizer can bring a series of positive effects on MOS, such as facilitating the formation of chemisorbed oxygen [32,33], modulating the space charge layer [34,35,36], and catalyzing the gas sensing reaction between gaseous analyte and chemisorbed oxygen [37,38,39].
In2O3, as an n-type semiconductor (Eg = 3.55–3.75 eV) with diverse functions, has been widely studied in the fields of lithium ion battery [40], supercapacitor [41], photocatalyst [42], and gas sensor [43] due to its unique physical and chemical properties, such as low toxicity, strong inoxidizability, and high electric mobility [44]. For gas sensor applications, In2O3 has been found to be sensitive to various gases, including TEA [32], CO [45], methane [46], acetone [47], hydrogen [48], alcohol [49], NO2 [50], etc. To improve the gas sensitivity of In2O3 to TEA, different noble metals were used as sensitizers to functionalize In2O3. For example, Zheng et al. prepared porous In2O3 microspheres by annealing the In2S3 precursor and then decorated Au nanoparticles on them to obtain novel Au/In2O3 hybrid microspheres. At an operating temperature of 280 °C, the hybrid Au/In2O3 microspheres showed a response of 648.2 to 100 ppm TEA, higher than that of pristine In2O3 [51]. Liu et al. reported a TEA sensor that fabricated with Pd nanoparticles-functionalized In2O3 microspheres, whose response to 50 ppm TEA at 220 °C was 47.56, higher than that of In2O3 counterpart [52]. Compared with other noble metals (Au, Pt, Pd), Ag is more suitable for large-scale practical application owing to its lower price. Although Ag has been proven to be a valid sensitizer for In2O3 to sense NO2 [53] and H2S [54], there are few reports, to the best of our knowledge, on improving the TEA sensing performance of In2O3 by modification with Ag, as well as the detailed sensitization effects of Ag on In2O3 for sensing TEA.
In this study, Ag nanoparticles with a size of around 25–30 nm were evenly decorated on pre-synthesized In2O3 porous nanospheres (PNSs) via a simple room-temperature chemical reduction method. To check the influence of Ag modification on In2O3 and further understand the sensitization effect of Ag nanoparticles, the prepared bare and Ag-modified In2O3 samples were characterized by various techniques and their TEA sensing performances were investigated in detail. Research results indicate that after modification with Ag, the In2O3 sensor showed impressive improvements in TEA sensing performance, especially of lower operating temperature, much higher sensitivity, and better selectivity. Specifically, at its optimal working temperature (300 °C), the best Ag/In2O3 sensor can give a response as high as 5697 to 50 ppm TEA, which is about 158 times higher than that of bare In2O3 sensor (36) and is also superior to most previous TEA sensors. The upgraded gas sensing performances of Ag/In2O3 sensor can be ascribed to the spillover and catalytic effects of Ag nanoparticles, as well as the electronic sensitization effect of the Ag–In2O3 Schottky junction. Our research not only provides a promising sensitization strategy to enhance the TEA sensing performance of In2O3, but also contributes to a deeper understanding on the sensitization mechanism of Ag/In2O3 sensor.

2. Materials and Methods

2.1. Sample Preparation

All chemicals applied in our experiment were of analytical grade and used as received without further purification. To synthesize Ag-modified In2O3 PNSs, bare In2O3 PNSs were synthesized in advance according to our previous method [55]. Briefly, 0.42 g of In(NO3)3·4.5H2O and 0.71 g of sodium citrate were dissolved in 80 mL distilled water under magnetic stirring. After adding 0.20 g of urea into above solution, the obtained reaction solution was sealed in a Teflon-lined autoclave with the capacity of 100 mL and heated at 160 °C for 24 h. After reaction, the product was collected by centrifugation, washed with distilled water and absolute ethanol alternately, and dried at 60 °C in air for 8 h. Finally, bare In2O3 sample was obtained by annealing the collected powder at 500 °C (heating rate: 2 °C/min) in air for 3 h.
To synthesize Ag-modified In2O3 PNSs, a designed amount of as-prepared bare In2O3 powder was ultrasonically dispersed into 150 mL of AgNO3 aqueous solution (0.6 mmol/L), followed by adding 13 mL of NaBH4 (7 mmol/L) aqueous solution drop by drop. After the mixed solution was sonicated at room temperature for 3 h, dark brown precipitates were collected and purified by washing with distilled water. Finally, the precipitate was dried at 60 °C for 8 h to obtain the final Ag-modified In2O3 sample. The Ag content in Ag-modified In2O3 sample was controlled by adjusting the using amount of bare In2O3. When the mass of In2O3 was set as 88.26, 74.68, and 64.72 mg, Ag/In2O3 samples with theoretical Ag contents of 11 wt%, 13 wt%, and 15 wt% were prepared and denoted as Ag/In2O3-1, Ag/In2O3-2, and Ag/In2O3-3, respectively.

2.2. Characterizations

The phase structure analysis of the samples was performed by powder X-ray diffraction (XRD, Bruker D8, Cu-Kα1 radiation, λ = 1.5418 Å) in the 2θ range of 10–90°. The actual Ag contents in Ag/In2O3 samples were measured by using an inductively coupled plasma optical emission spectrometer (ICP-OES, Agilent ICP-OES 725 ES). The morphology and microstructure of the samples were characterized by scanning electron microscope (SEM, Merlin Compact) and transmission electron microscope (TEM, JEOL JEM 2100 F). The chemical composition and surface state of the materials were analyzed by X-ray photoelectron spectroscopy (XPS, Thermo SCIENTIFIC ESCALAB 250Xi). The binding energy of elements is calibrated with the surface adventitious carbon (the C 1s peak at 284.8 eV). The porosity and specific surface area of the samples were measured by N2 adsorption/desorption instrument (Micromeritics ASAP 2020).

2.3. Gas sensor Fabrication and Analysis

The gas sensing performance of the samples was measured on an intelligent gas sensing analysis system of CGS-4TPS (Beijing Elite Technology Co., Ltd., Beijing, China), and the gas sensors were fabricated according to our previous method [56]. In a typical sensor fabrication procedure, approximately 10 mg of as-prepared sample was mixed with 1 mL of distilled water by grinding in an agate mortar to obtain a uniform slurry. The slurry was brush-coated on the surface of a ceramic substrate (Al2O3, size: 13.4 mm × 7 mm × 0.635 mm) with interdigitated Ag-Pd electrodes (width: 0.2 mm, gap distance: 1 mm) and then dried naturally at room temperature to obtain a resistance-type sensor. Before the test, the fabricated sensors were aged at 280 °C for 10 h to improve their stability. By using ambient air as the diluted and reference gas, a static gas distribution method was applied to achieve a desired concentration of target gas in the test chamber (1.8 L). The response of the bare and Ag-modified In2O3 sensors to the reducing analyte is defined as Ra/Rg, where Ra and Rg refer to the resistance of the sensor in air and target gas, respectively. The response and recovery time is measured by recording the time of 90% sensor resistance change after the target gas was injected or released. During the test, the environment temperature was about 25 °C and the relative humidity was 30 ± 8%.

3. Results and Discussion

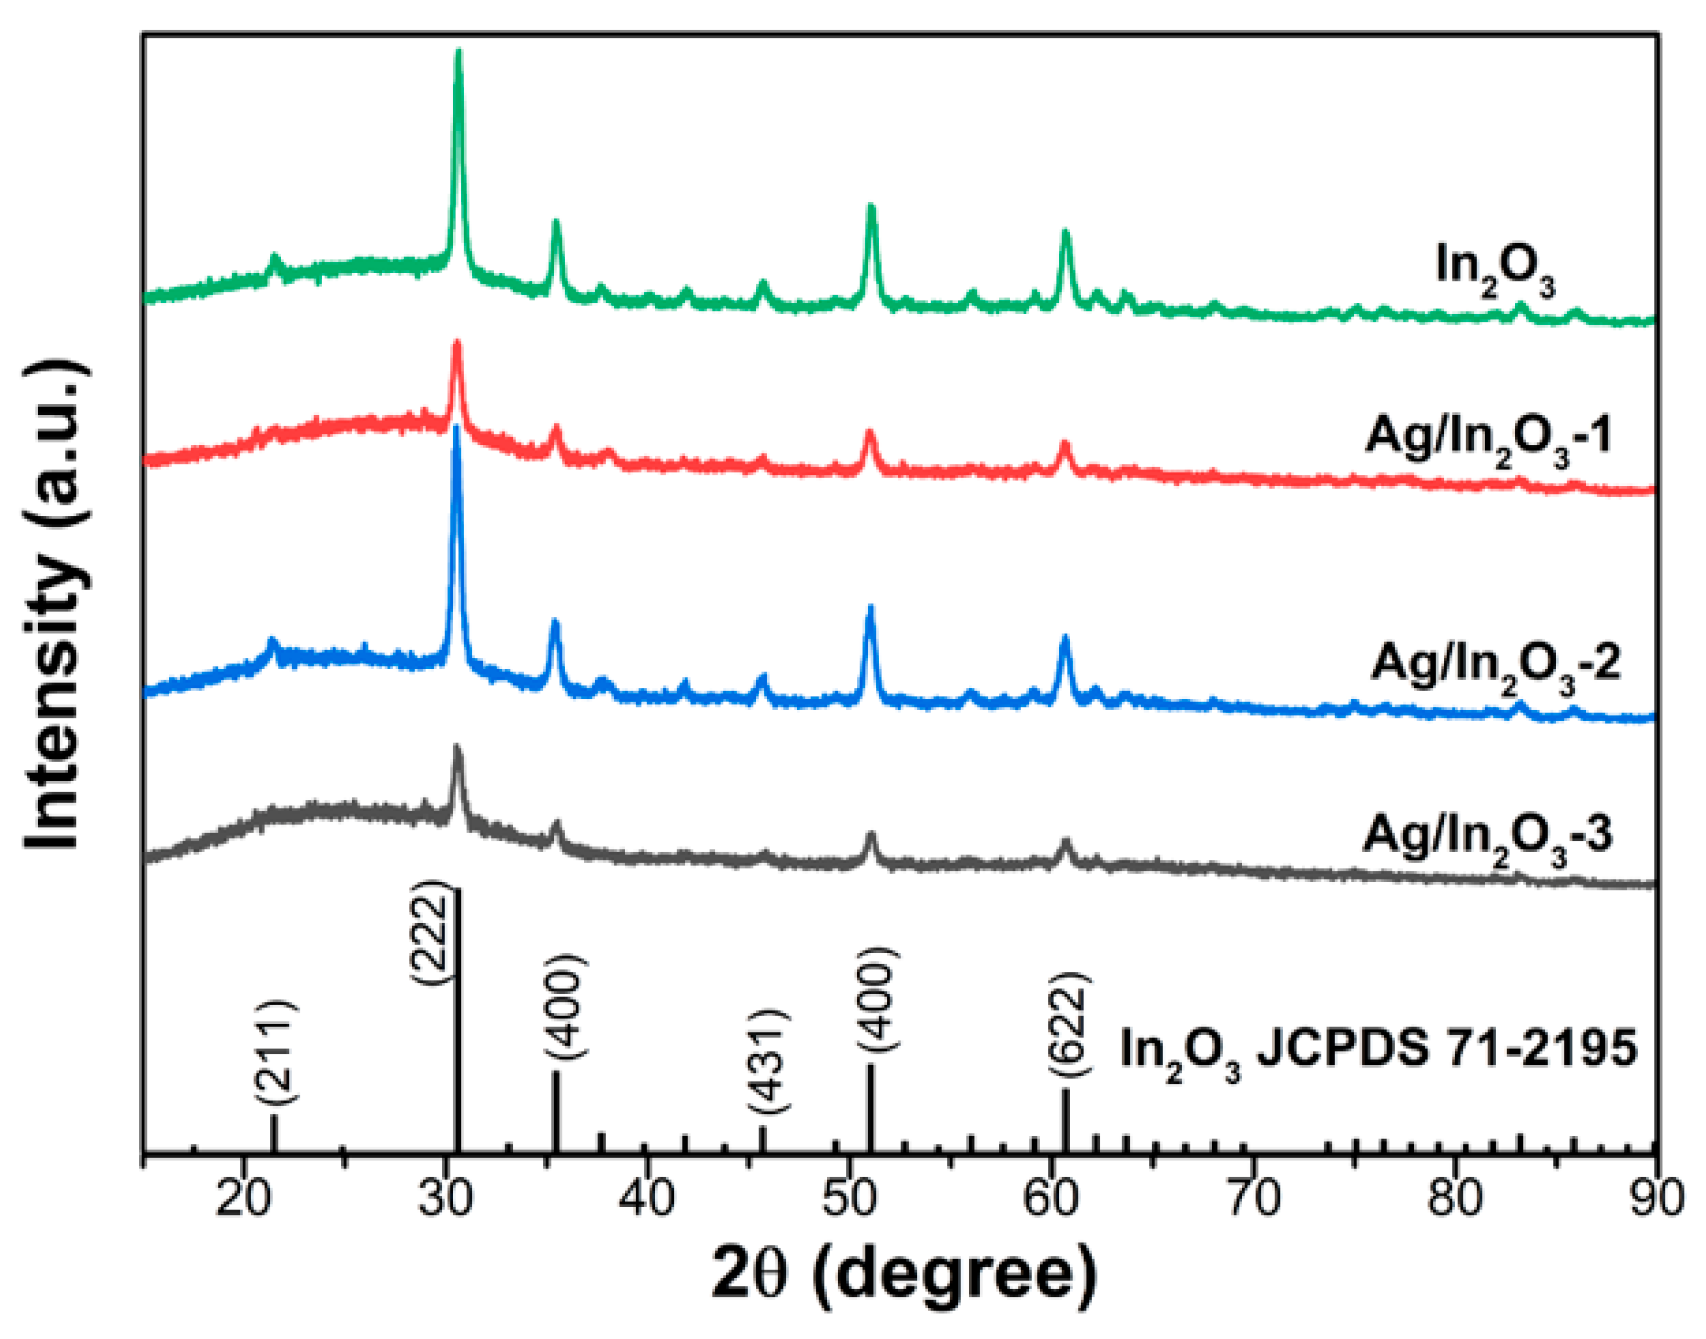
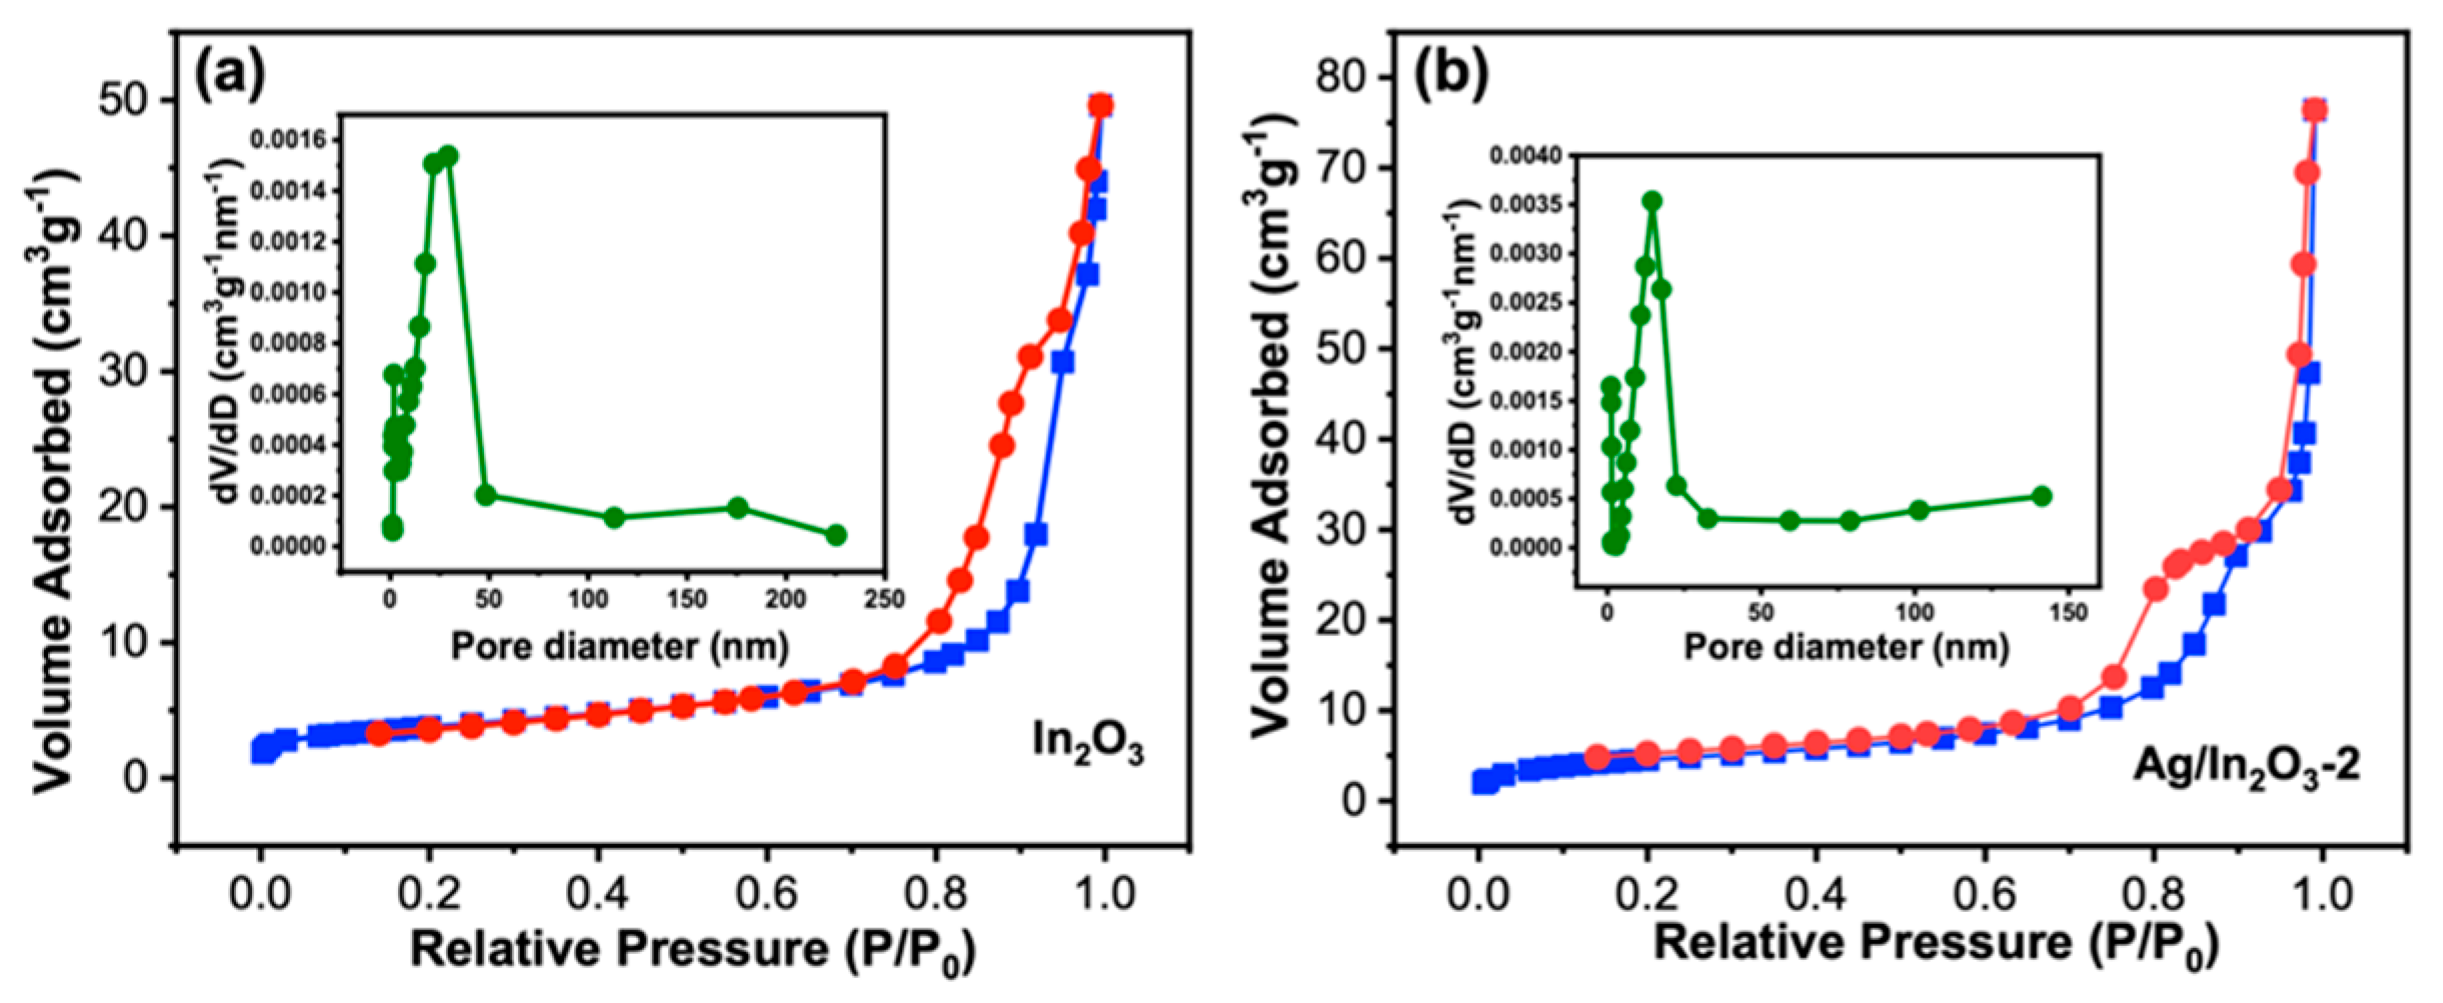
3.1. Sample Characterization

The phase structure and composition of the prepared samples were confirmed by XRD analysis. As shown in Figure 1, all diffraction peaks match well with the standard data of cubic In2O3 (JCPDS No. 71-2195, a = b = c = 10.117 Å), demonstrating the formation of the cubic In2O3 phase in the four samples. The strong and sharp diffraction peaks reveal their good crystallinity. No obvious peaks arising from Ag metal or its related compounds were detected in the Ag/In2O3 samples. To determine the actual Ag contents in the Ag/In2O3 samples, ICP-OES measurements were conducted. The results show that the Ag contents in Ag/In2O3-1, Ag/In2O3-2, and Ag/In2O3-3 are 2.43, 2.90, and 3.68 wt%, respectively. Obviously, the actual Ag content of Ag/In2O3 samples is lower than their designed amount. This phenomenon is similar to that of a previous report [25]. Therefore, the absence of Ag peaks in the XRD patterns should be attributed to the low content of Ag and the sufficient dispersion of Ag nanoparticles in the surface of In2O3.
The SEM and TEM were applied to observe the microstructure and morphology of the prepared samples. Figure 2a,b shows the representative SEM images of bare In2O3 and Ag/In2O3-2, respectively. Both samples show similar sphere-like structure with the diameter about 120 nm, demonstrating that Ag modification has almost no influence on the basic morphology of primary In2O3. Figure 2c shows the TEM image of Ag/In2O3-2, from which the porous structure of the nanospheres is clearly observed. In the high-resolution TEM (HRTEM) image recorded from the edge of a randomly selected nanosphere (Figure 2d), two definite crystalline phases were determined by measuring the lattice fringes. The lattice fringes with the separation distance of 0.287 nm (as displayed in (1) and 0.237 nm (as displayed in (2) correspond to the (222) plane of cubic In2O3 (JCPDS No. 71-2195) and (111) plane of Ag metal (JCPDS No. 87-0598), respectively. EDS measurement was performed to further confirm the successful decoration of Ag nanoparticles on In2O3 PNS. In the obtained element maps (Figure 2e), besides the well dispersed In and O elements, agglomerated Ag element was also observed on the nanospheres, strongly demonstrating the decoration of Ag nanoparticles on the In2O3 PNSs. The average size of the Ag nanoparticles was measured to be about 25–30 nm.
The surface chemical state of bare In2O3 and Ag/In2O3-2 was investigated by XPS (Figure 3). In their full XPS spectra (Figure 3a), the signals from In, O, and C are clearly observed. The signals of C in the two samples are ascribed to the contaminated carbon. Compared with bare In2O3, additional signals arising from Ag 3d are presented in Ag/In2O3-2, further confirming the successful introduction of Ag in In2O3. Figure 3b shows the high-resolution XPS spectra of In 3d. In the bare In2O3 sample, the peaks at the binding energy of 451.65 and 444.11 eV belong to In 3d3/2 and In 3d5/2, respectively. In comparison with bare In2O3, the In 3d3/2 and In 3d5/2 peaks of Ag/In2O3-2 shift slightly to higher binding energy, which are located at 451.77 and 444.22 eV, respectively. The different binding energies of In 3d in the two samples suggest an electronic interaction between Ag and In2O3 because of their different work functions [57]. In the high-resolution XPS spectrum of Ag 3d of Ag/In2O3-2 (Figure 3c), the Ag 3d5/2 (367.63 eV) and Ag 3d3/2 (373.63 eV) peaks with 6 eV splitting demonstrate the existence of Ag0 [54,58], being consistent with above TEM analysis. Compared with the standard binding energy of Ag 3d5/2 (368.2 eV) and Ag 3d3/2 (374.2 eV) in metallic Ag, such two peaks in Ag/In2O3-2 shift slightly to the lower binding energy side, which can be also ascribed to the interaction of Ag with In2O3. Figure 3d shows the high-resolution XPS spectra of O1s. After deconvolution, the signals of O1s can be divided into three peaks, including lattice oxygen (OLatt) at about 529.60 eV, surface adsorbed oxygen (Oads) at about 531.24 eV, and surface OH groups (OOH) at about 532.08eV [33,59], and their relative percentages are listed in the inset. The estimated percentage of Oads in Ag/In2O3-2 is 48.48%, which is higher than that in bare In2O3 (34.79%). It was generally believed that during the gas sensing process, the surface chemisorbed oxygen species, including O2, O, and O2−, can play the role of oxidant to react with reducing gas. Therefore, the higher Oads content is usually favorable for enhanced gas sensitivity.
The specific surface area and porosity of In2O3 and Ag/In2O3-2 were investigated by N2 adsorption and desorption method, as shown in Figure 4. Both samples show clear hysteresis loops at P/P0 = 0.6–1 and their isotherms increase rapidly at the position near P/P0 = 0, revealing the co-existence of micro- and mesoporous structures in In2O3 and Ag/In2O3-2. From their pore diameter distribution plots (insets of Figure 4a,b), the dominant diameters of micropore and mesopore are 1.88 and 29.24 nm for bare In2O3 and 1.17 and 14.63 nm for Ag/In2O3-2, respectively. Based on the BET method, the calculated specific surface areas of In2O3 and Ag/In2O3-2 are 13.20 and 16.39 m2g−1, respectively.

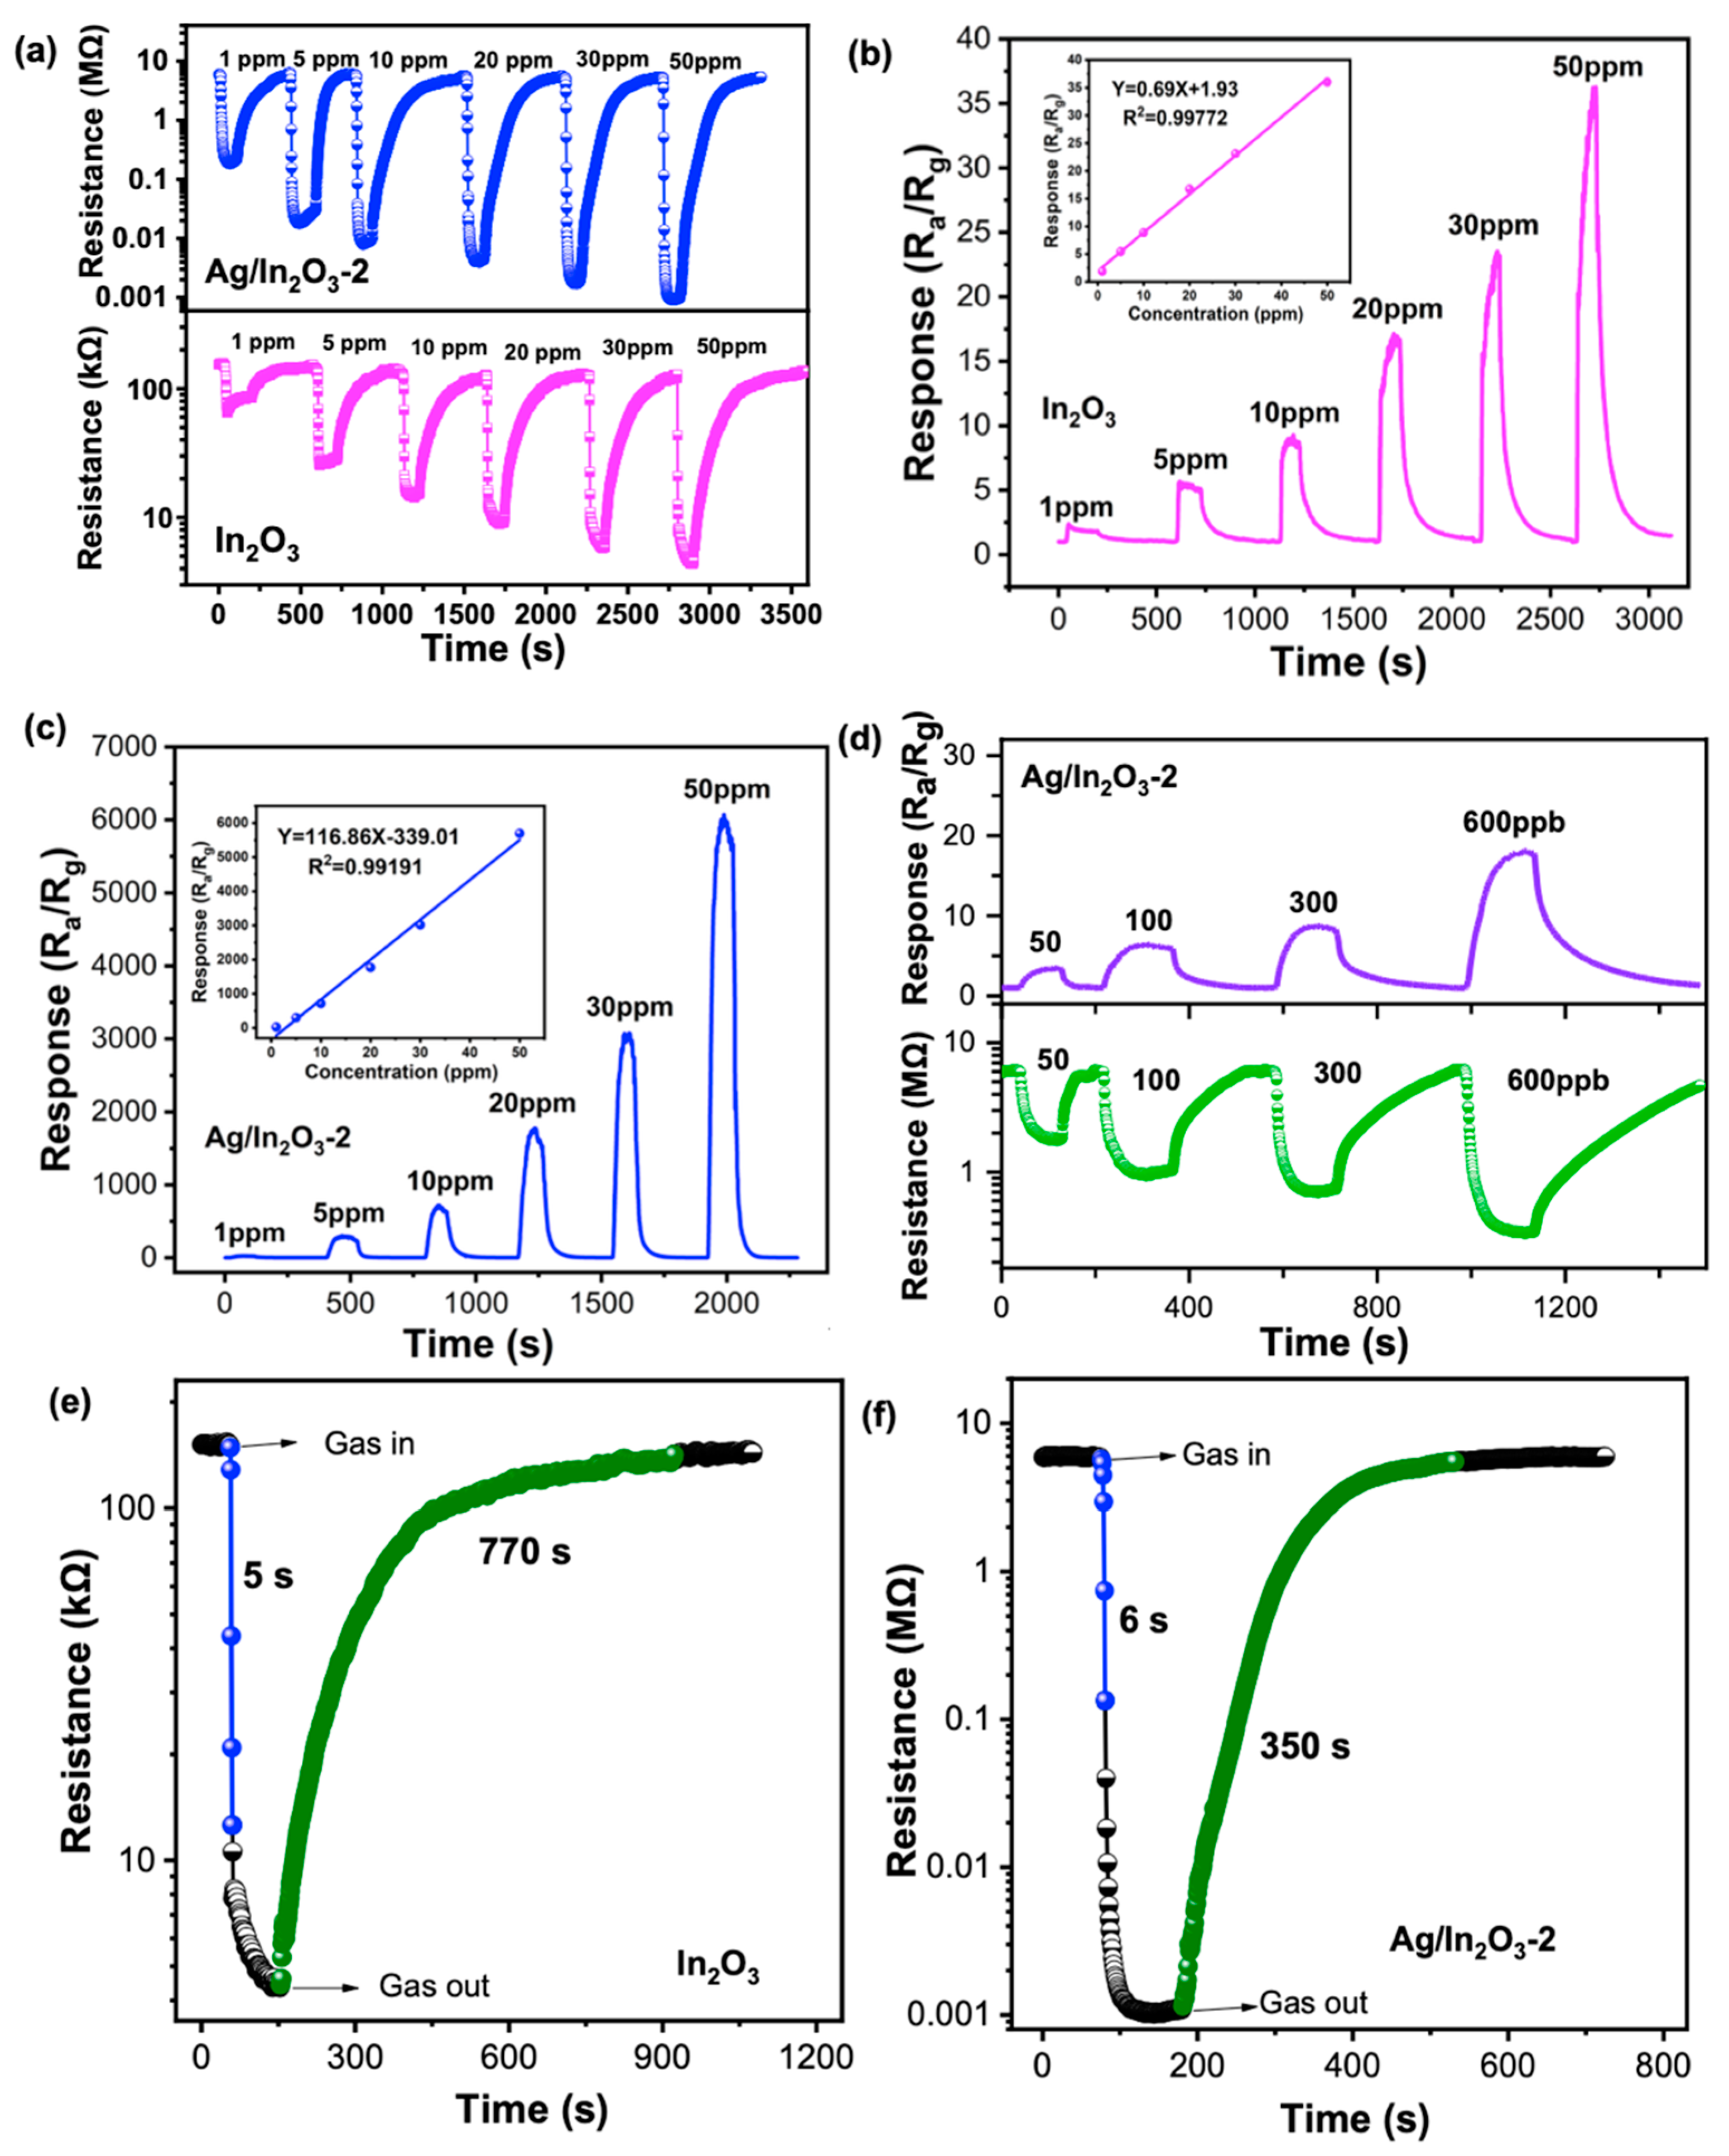
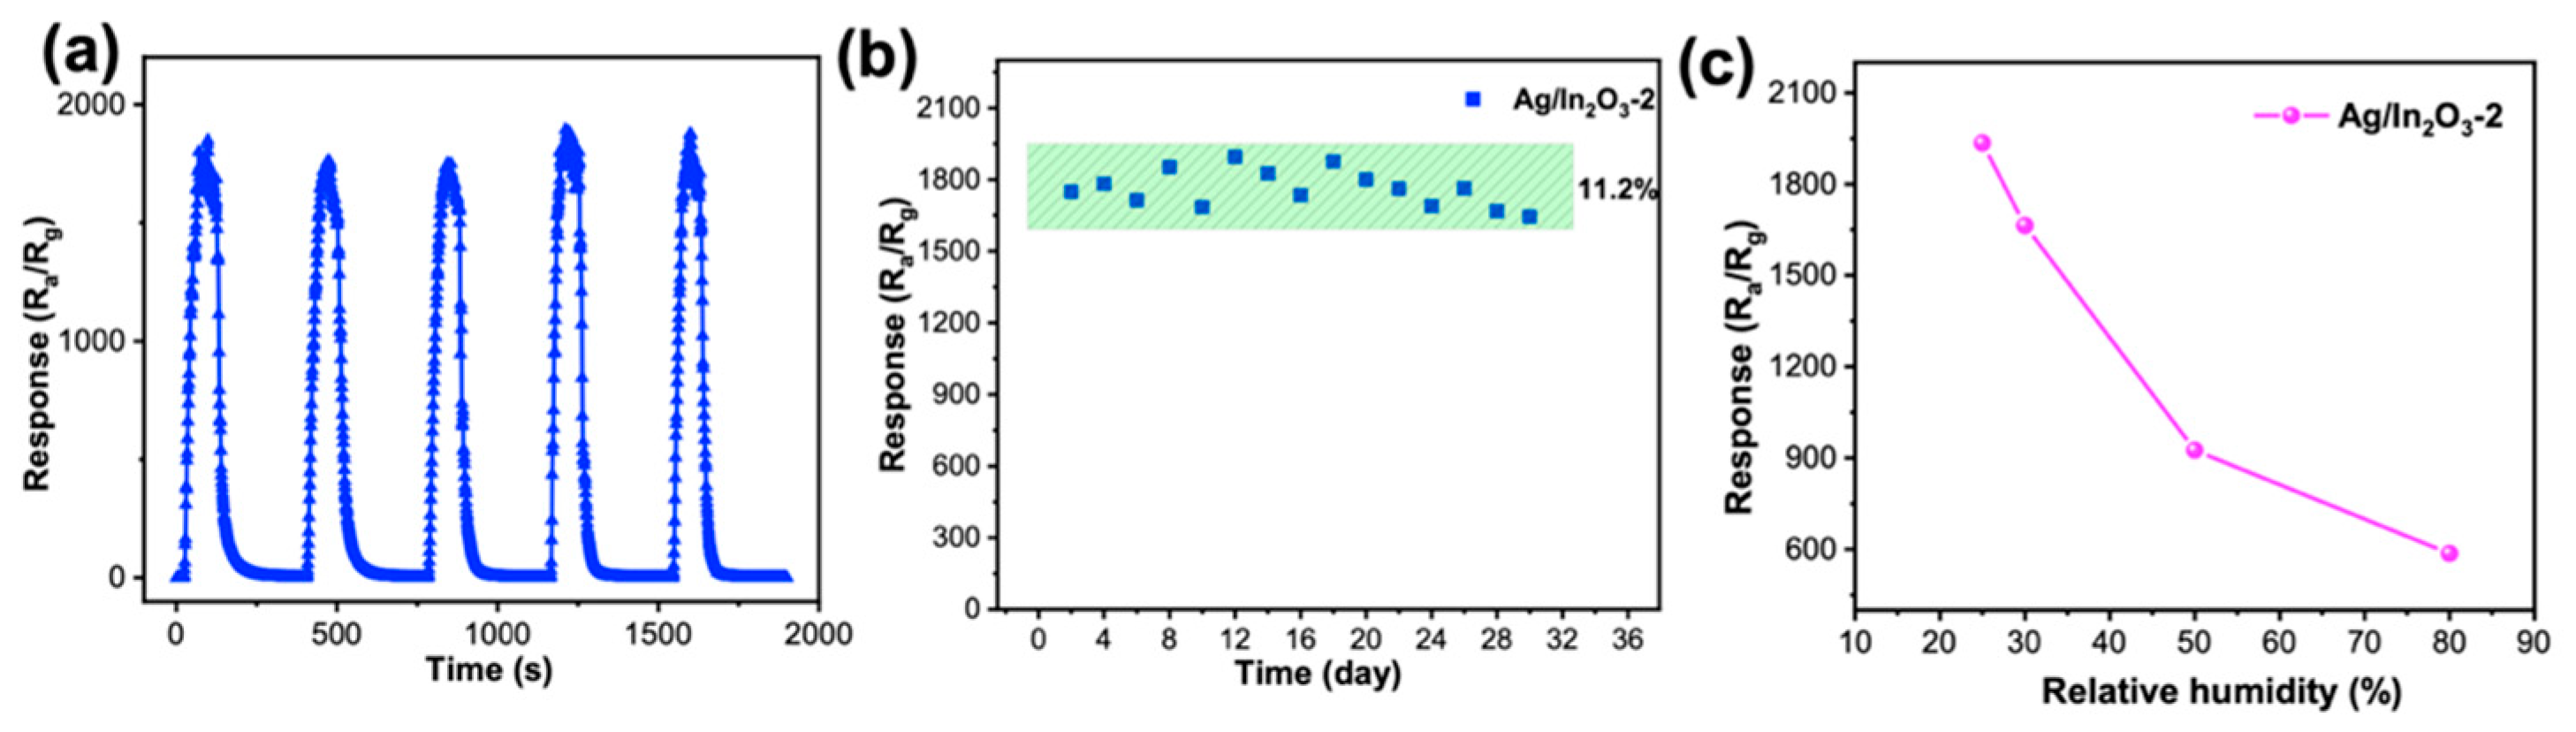
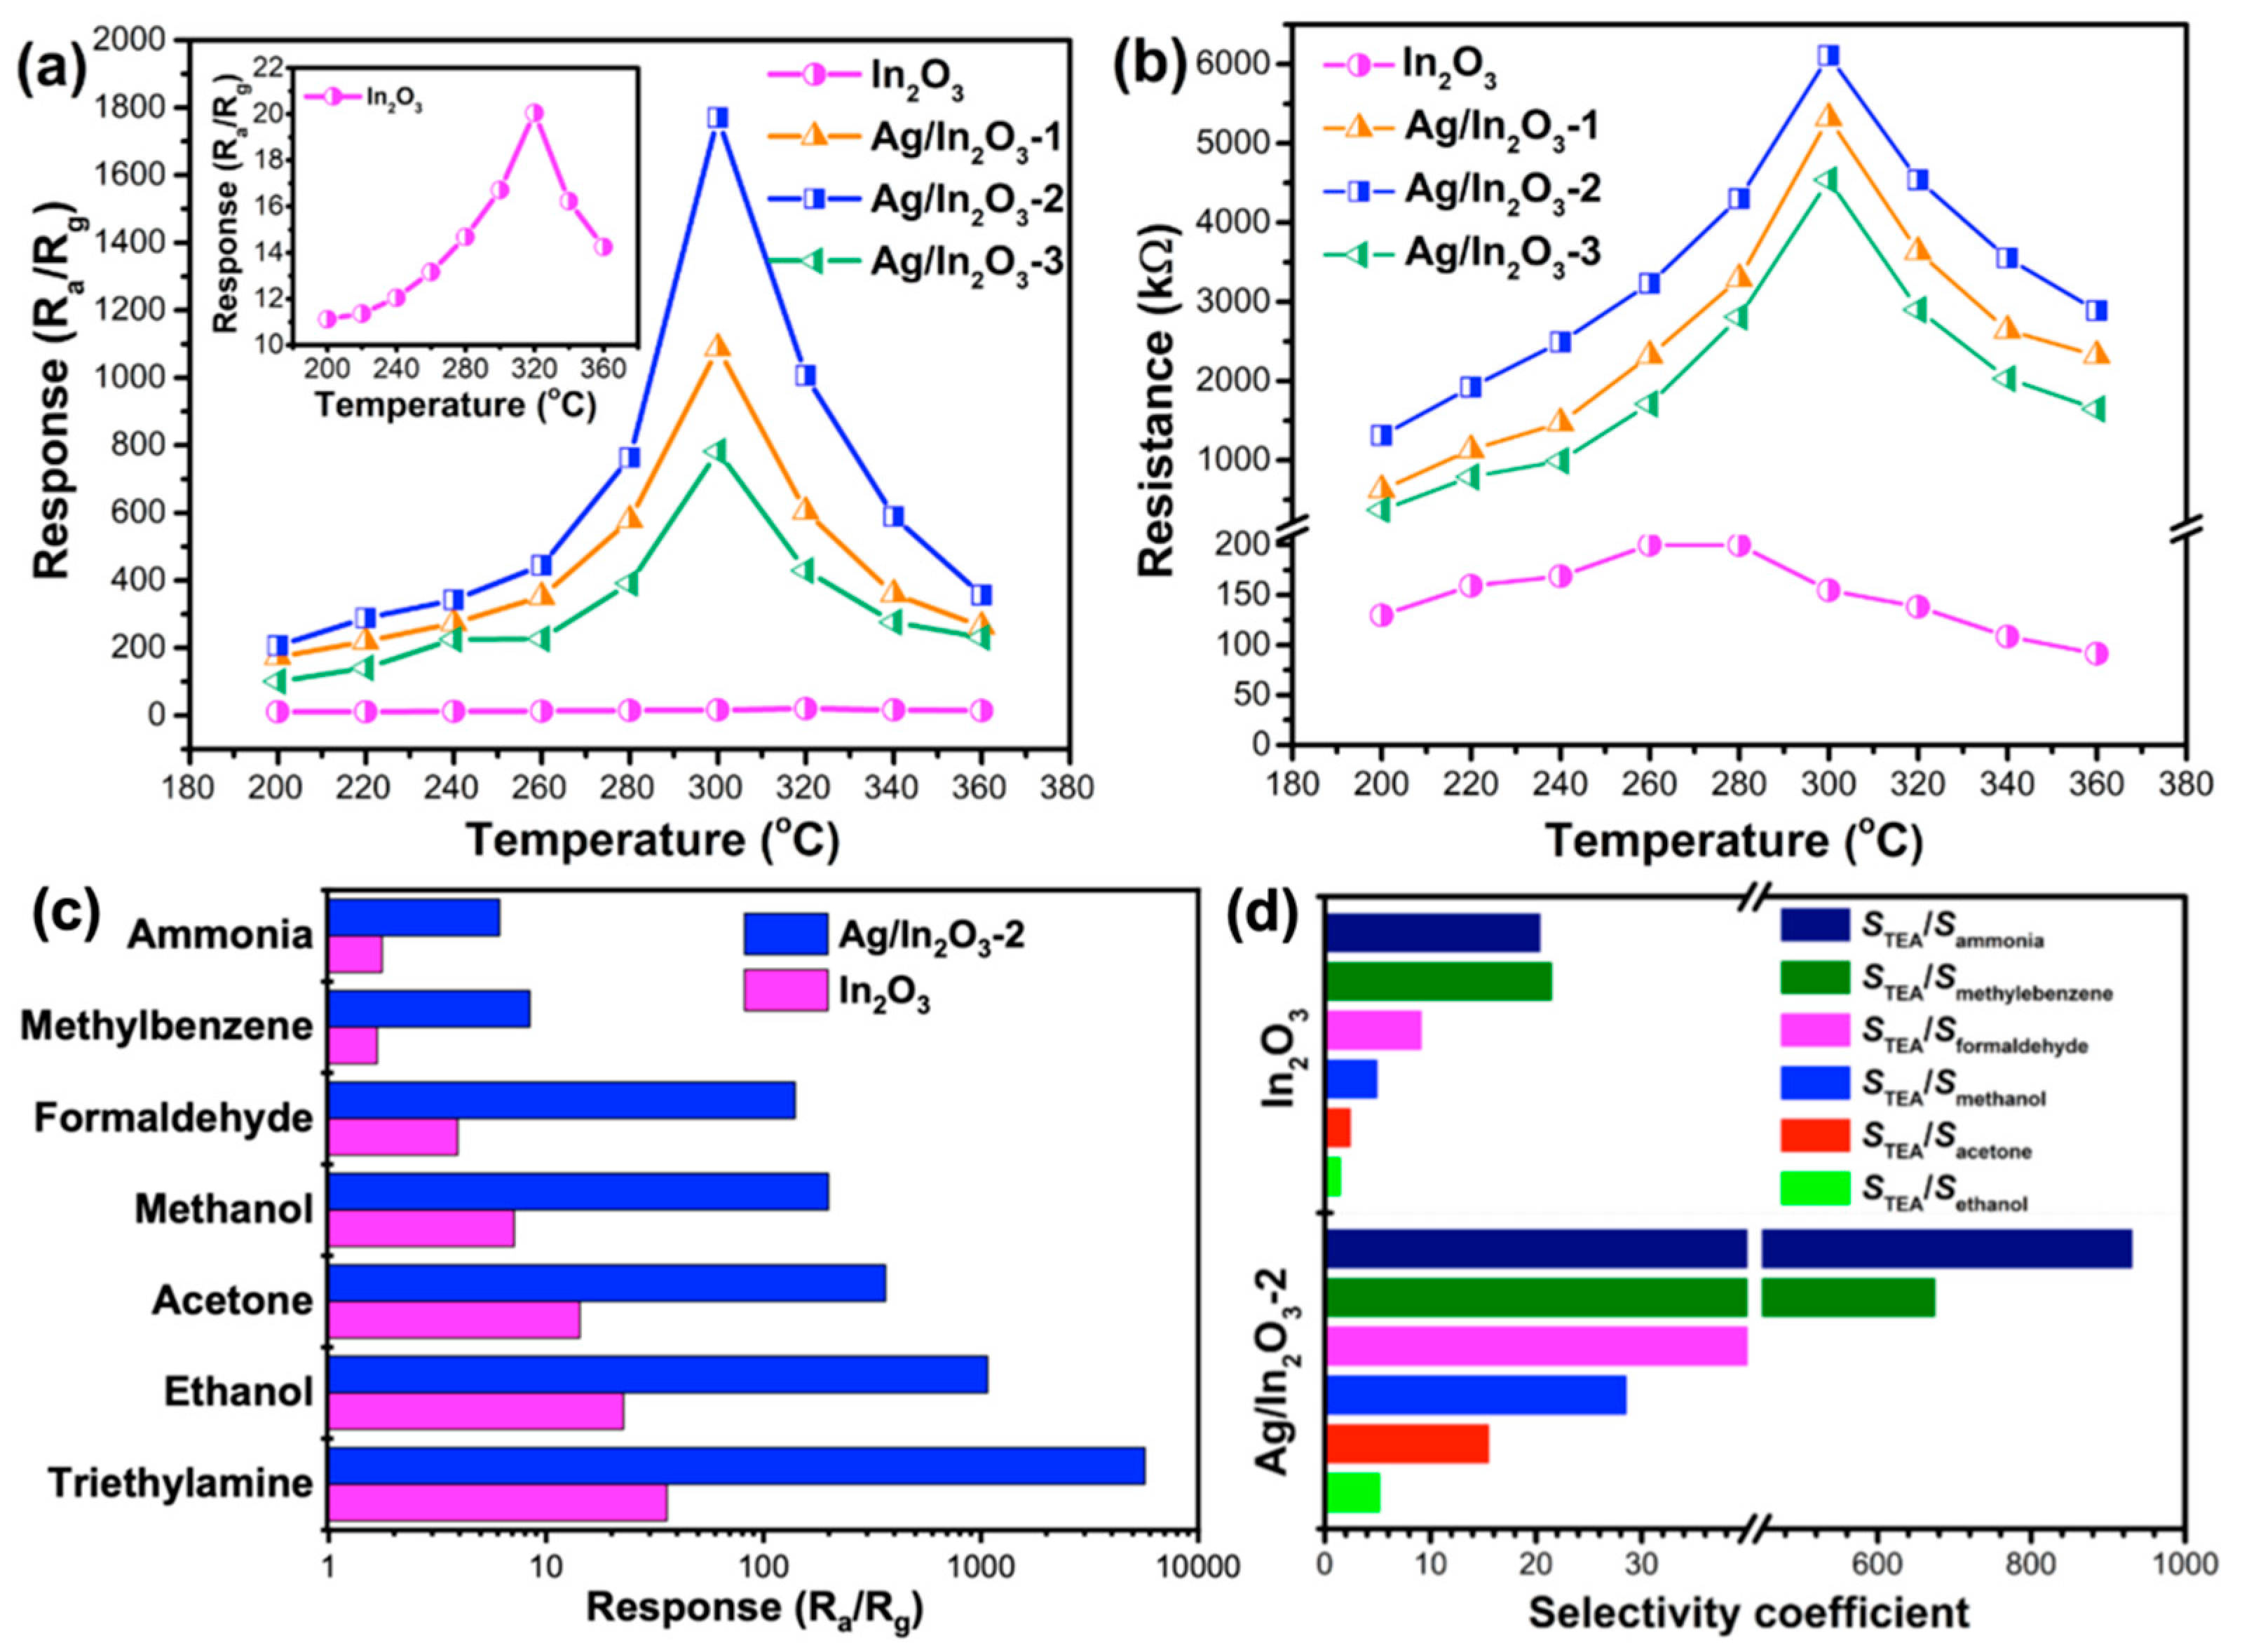
3.2. Gas Sensing Performance

In order to realize an insight into the effects of Ag modification on the TEA sensing performance of In2O3, gas sensing tests were carried out on the bare and Ag-modified In2O3 sensors. In view of the fact that the gas sensing characteristics of a MOS sensor greatly rely on its working temperature, the temperature-dependent resistances of the sensors as well as their responses to 20 ppm TEA were first measured. As shown in Figure 5a, with the temperature increasing from 200 to 360 °C, the bare and Ag-modified In2O3 sensors show similar response variation trends of “increase–maximum–decrease” and reach their maximum responses at 320 and 300 °C, respectively. At different operating temperatures, the Ag/In2O3 sensors always show higher responses than the In2O3 sensor, demonstrating the sensitization effect of Ag nanoparticles on In2O3 PNSs. From Figure 5b, one can see that the sensors’ resistance variation is similar to their response variation. Moreover, in the whole temperature range, the baseline resistances (Ra) of Ag/In2O3 sensors are always higher than that of bare In2O3 sensor. Based on the widely accepted oxygen adsorption theory [15,60], the temperature-dependent variation in sensor resistance and response may be associated with the adsorption and desorption behavior of oxygen molecules. When the operating temperature is relatively low (such as 200 °C), less oxygen molecules can adsorb on In2O3 and Ag/In2O3 to form chemisorbed oxygen due to their lower activity, which will lead to their lower resistance and response. With the increase in operating temperature, more and more oxygen molecules can acquire enough energy to adsorb on the materials and then transform into chemisorbed oxygen species, resulting in the gradually increased resistance and response of In2O3 and Ag/In2O3. The adsorption and desorption of oxygen molecules on the In2O3 and Ag/In2O3 PNSs may reach their balance at 280 and 300 °C, respectively. At this moment, the amounts of chemisorbed oxygen species will reach their maximum values, leading to the maximum resistance and response, correspondingly. However, as the temperature exceeds 280 °C for In2O3 and 300 °C for Ag/In2O3, the adsorption–desorption balance of oxygen will remove to the desorption side, which will decay the resistance and response due to the decreased amount of chemisorbed oxygen species. In Figure 5b, the higher resistance of Ag/In2O3 sensors than the bare In2O3 sensor can be understood from two aspects. Firstly, Ag nanoparticles can facilitate the formation of chemisorbed oxygen on In2O3 through the spillover effect [61]. Thus, at different operating temperatures, more chemisorbed oxygen was created on Ag/In2O3 than on bare In2O3. As is well known, the formation of chemisorbed oxygen on n-type MOS usually accompanies increased sensor resistance because of the decreased carrier (electron) concentration. Thus, more chemisorbed oxygen species can endow Ag/In2O3 sensors with higher resistance. Secondly, at the interface of Ag and In2O3, electrons will migrate from In2O3 to Ag on account of the lower work function of In2O3 (4.3 eV) than that of Ag (4.6 eV), which will also lead to the higher resistance of Ag/In2O3 sensors [57]. In addition, from Figure 5a,b, one can clearly observe that the temperature-dependent response variation of all Ag/In2O3 sensors is strictly in accordance with their resistance variation, and both their response and resistance reach the maximum values at 300 °C, while, in contrast to the Ag/In2O3 sensors, the bare In2O3 sensor gives its maximum resistance at 280 °C, which is lower than its maximum response temperature (320 °C). Such a phenomenon is supposed to be relevant to the catalytic effect of Ag nanoparticles. In general, the response of a MOS sensor is mainly controlled by the gas sensing reaction occurring between chemisorbed oxygen and gaseous analyte. As the gas concentration of analyte is fixed, more chemisorbed oxygen species participating in the reaction usually result in higher sensor response. In the Ag/In2O3 sensors, Ag nanoparticles can catalyze the reaction that occurred between chemisorbed oxygen and TEA, which means that at the temperature before 300 °C, most reactants (chemisorbed oxygen species and TEA molecules) can be activated to complete the gas sensing reaction. In this case, the amount of chemisorbed oxygen species on Ag/In2O3 becomes the decisive factor of sensor response. Since the amount of chemisorbed oxygen of Ag/In2O3 sensors reaches the maximum value at 300 °C (Figure 5b), their maximum response to TEA also appears at 300 °C, accordingly. While, for bare In2O3 sensor, perhaps due to the lack of the catalytic effect of Ag nanoparticles, most of the chemisorbed oxygen species formed at 280 °C could be not active enough to react with TEA until the temperature increases to 320 °C. Therefore, it realizes the highest response at 320 °C but not at 280 °C. From Figure 5b, we can also observe that with the Ag content increases from 2.43 wt% (Ag/In2O3-1) to 2.90 wt% (Ag/In2O3-2) and 3.68 wt% (Ag/In2O3-3), the Ra values of the sensor first increase and then decease. This phenomenon may be explained in that, when the Ag content is lower than 2.90 wt%, the Ag nanoparticles decorated on In2O3 have good dispersion. In this case, the existence of more well-dispersed Ag nanoparticles will enhance the spillover effect, resulting in the higher Ra values of Ag/In2O3-2 than Ag/In2O3-1. Whereas, with the Ag content further increasing to 3.68 wt% (Ag/In2O3-3), aggregation between Ag nanoparticles can occur, which will weaken the spillover effect and lead to a lower Ra of Ag/In2O3-3 than Ag/In2O3-2. Since the Ag/In2O3-2 sensor shows the highest response among different Ag-modified In2O3 sensors (Figure 5a), in the following tests, it is chosen as the representative sensor to evaluate the effect of Ag modification on the gas sensing performance of In2O3 by comparing with bare In2O3 sensor.
Figure 5c shows the responses of In2O3 and Ag/In2O3-2 sensors to 50 ppm various gases at 300 °C. Apparently, the responses of Ag/In2O3-2 for different gases are obviously higher than that of bare In2O3, further demonstrating the positive effect of Ag nanoparticles on the gas sensing performance of In2O3 PNSs. Additionally, both sensors exhibit much higher response to TEA than to other gases, revealing their good selectivity to TEA. To quantitatively evaluate the influence of Ag modification on the TEA selectivity of In2O3, the TEA selectivity coefficients of In2O3 and Ag/In2O3-2 were calculated by using STEA/Sinterference gas, where STEA and Sinterference gas refer to the responses of the sensors to TEA and interference gas, respectively. As depicted in Figure 5d, when using different gases as interference gas (ammonia, formaldehyde, methanol, ethanol, acetone, and methylbenzene), the Ag/In2O3-2 sensor always gives much higher selectivity coefficients than the bare In2O3 sensor. For example, the values of STEA/Sethanol and STEA/Sammonia of Ag/In2O3-2 are 5.30 and 932.43, which are about 3.33 and 45.55 times higher than that of In2O3, respectively. The higher response and better selectivity of Ag/In2O3-2 to TEA make it more suitable for practical application.
Figure 6a shows the dynamic resistance changes in In2O3 and Ag/In2O3-2 as they were exposed to 1–50 ppm of TEA at 300 °C. Both sensors show a rapid decay of resistance once exposure to TEA vapor, exhibiting the characteristic response of n-type MOS. With the increase in TEA concentration, the response amplitudes of the two sensors enlarge gradually (Figure 6b,c), while, for different concentrations of TEA, the Ag/In2O3-2 sensor gives much higher responses than the bare In2O3 sensor, demonstrating its superior ability for sensing TEA. For instance, the responses of Ag/In2O3-2 to 50 ppm TEA are as high as 5697, about 158 times higher than that of bare In2O3 (36). In the tested TEA concentration range, both the bare In2O3 and Ag/In2O3-2 sensors show good response linearity (the insets in Figure 6b,c). Based on the slop of their fitting line, the sensitivity of In2O3 and Ag/In2O3-2 to 1–50 ppm TEA is determined as 0.69 and 116.86/ppm, respectively. Apparently, after modification with Ag, the sensitivity of our In2O3 sensor to TEA is dramatically increased (about 169.36 times). Since the Ag/In2O3-2 sensor can give a high response (24.3), even to 1 ppm TEA, its response to ppb level TEA was further tested. As shown in Figure.6d, with increasing TEA concertation from 50 to 600 ppb, the sensor shows a gradually increased response. The response to 50 ppb TEA is as high as 3.4, demonstrating its strong sensing ability for TEA at ppb level. The response and recovery speed of bare In2O3 and Ag/In2O3-2 were also measured from their transient resistance response–recovery curves to 50 ppm TEA (Figure 6e,f), whose results show that the response/recovery time (τres.rec.) of In2O3 and Ag/In2O3-2 are 5/770s and 6/350s, respectively. Perhaps because of their relatively higher operating temperature, both sensors can give fast response to TEA, while, compared with bare In2O3 sensor, the Ag/In2O3-2 sensor shows much shorter recovery time. Theoretically, the recovery time of a MOS sensor to garget gas is mainly controlled by two factors, including the desorption speed of the product of gas sensing reaction and the regeneration speed of chemisorbed oxygen on the surface of MOS. In our case, the faster recovery speed of Ag/In2O3-2 may mean that Ag nanoparticle can not only accelerate the regeneration of chemisorbed oxygen through its strong spillover effect, but also can catalyze the gas sensing reaction to produce some products that can easily desorb from In2O3 PNS. To further evaluate the quality of Ag/In2O3-2, its TEA sensing performances were compared with that of the previously reported sensors. As displayed in Table 1, the present Ag/In2O3-2 sensor shows much higher response and better selectivity to TEA than most of the reported sensors, demonstrating its superiority in TEA detection.
The repeatability, long-term stability, and humidity resistance of the Ag/In2O3-2 sensor were also tested to further evaluate its quality. As shown in Figure 7a,b, in five continues response–recovery cycles test results, the sensor can give almost the same response amplitudes to 20 ppm TEA; moreover, within a period of 30 days, there is only a slight decay in its response, revealing its good repeatability and stability. Figure 7c presents the response values of Ag/In2O3-2 sensor toward 20 ppm TEA under different relative humidity (RH). With increasing RH from 25 to 80%, the response of the sensor decreases seriously. Under humidity conditions, water molecules can absorb on the surface of Ag/In2O3 PNSs and then compete with TEA molecules to react with chemisorbed oxygen [25], resulting in a decreased response of TEA under high humidity. According to the research results of Lee’s group, doping our In2O3 PNSs with Pr before modification with Ag nanoparticles may be a possible strategy to improve the humidity resistance of the present Ag/In2O3 sensor [65], which will be tried in our future work.

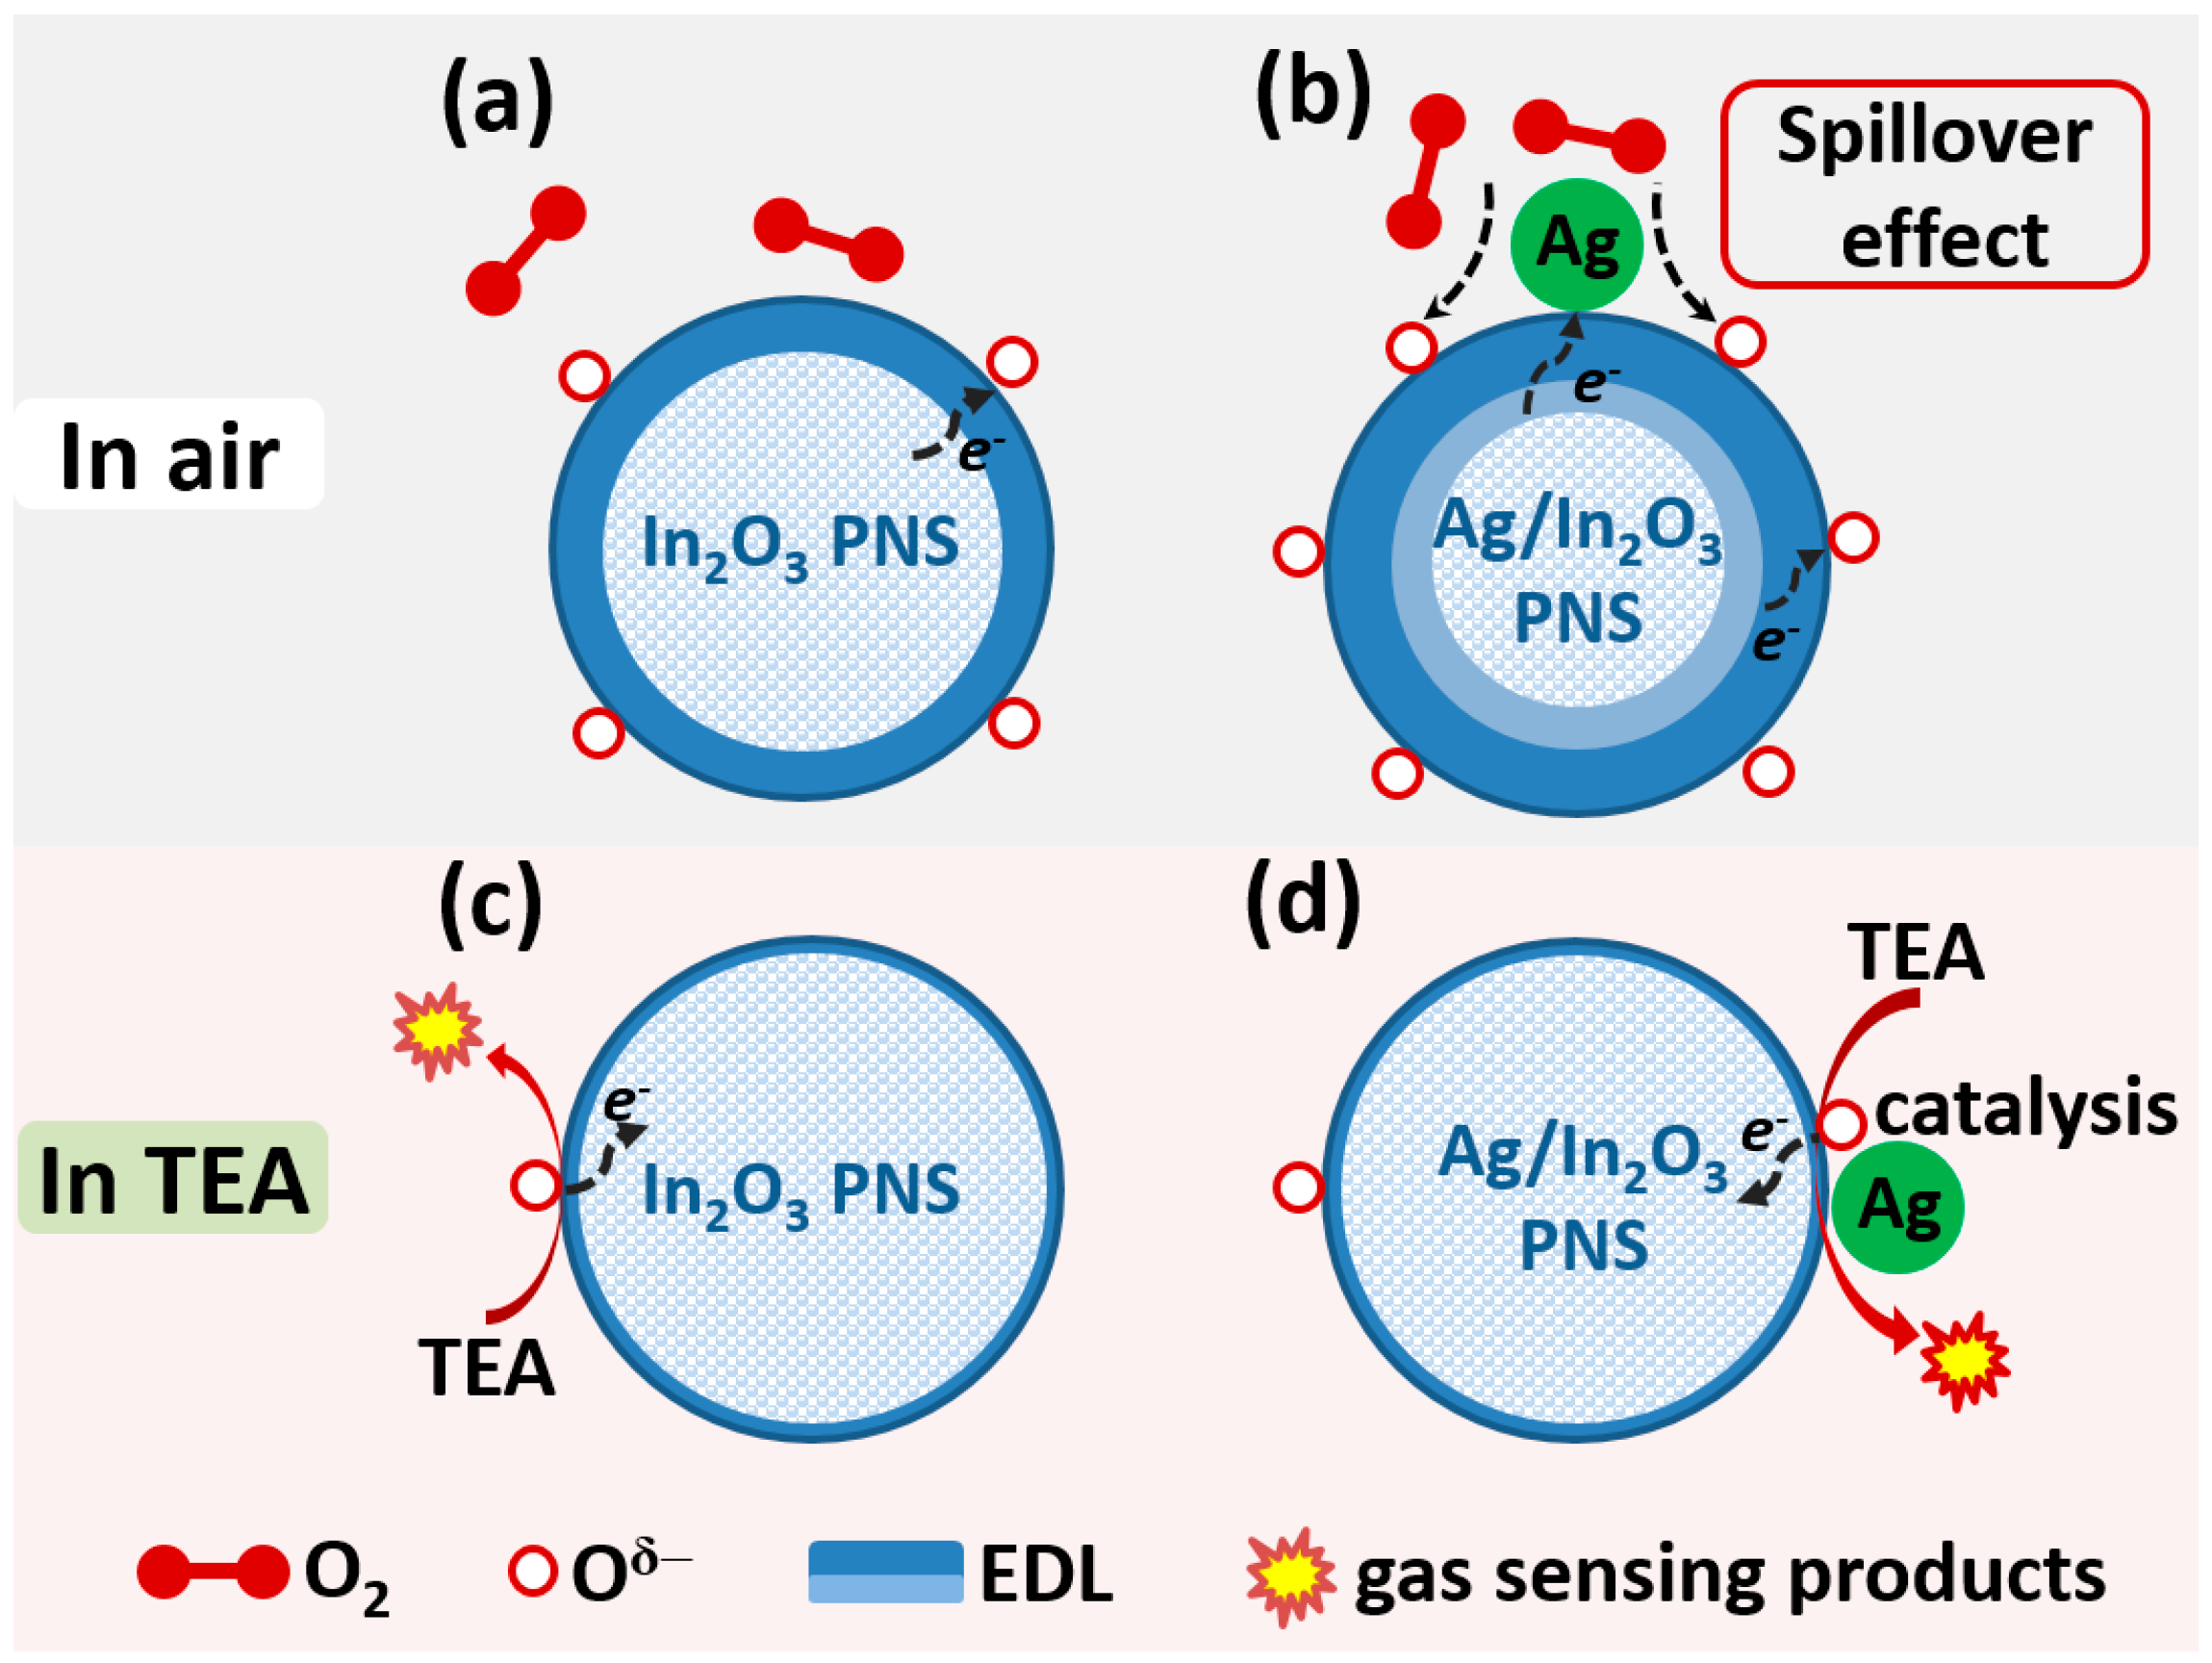
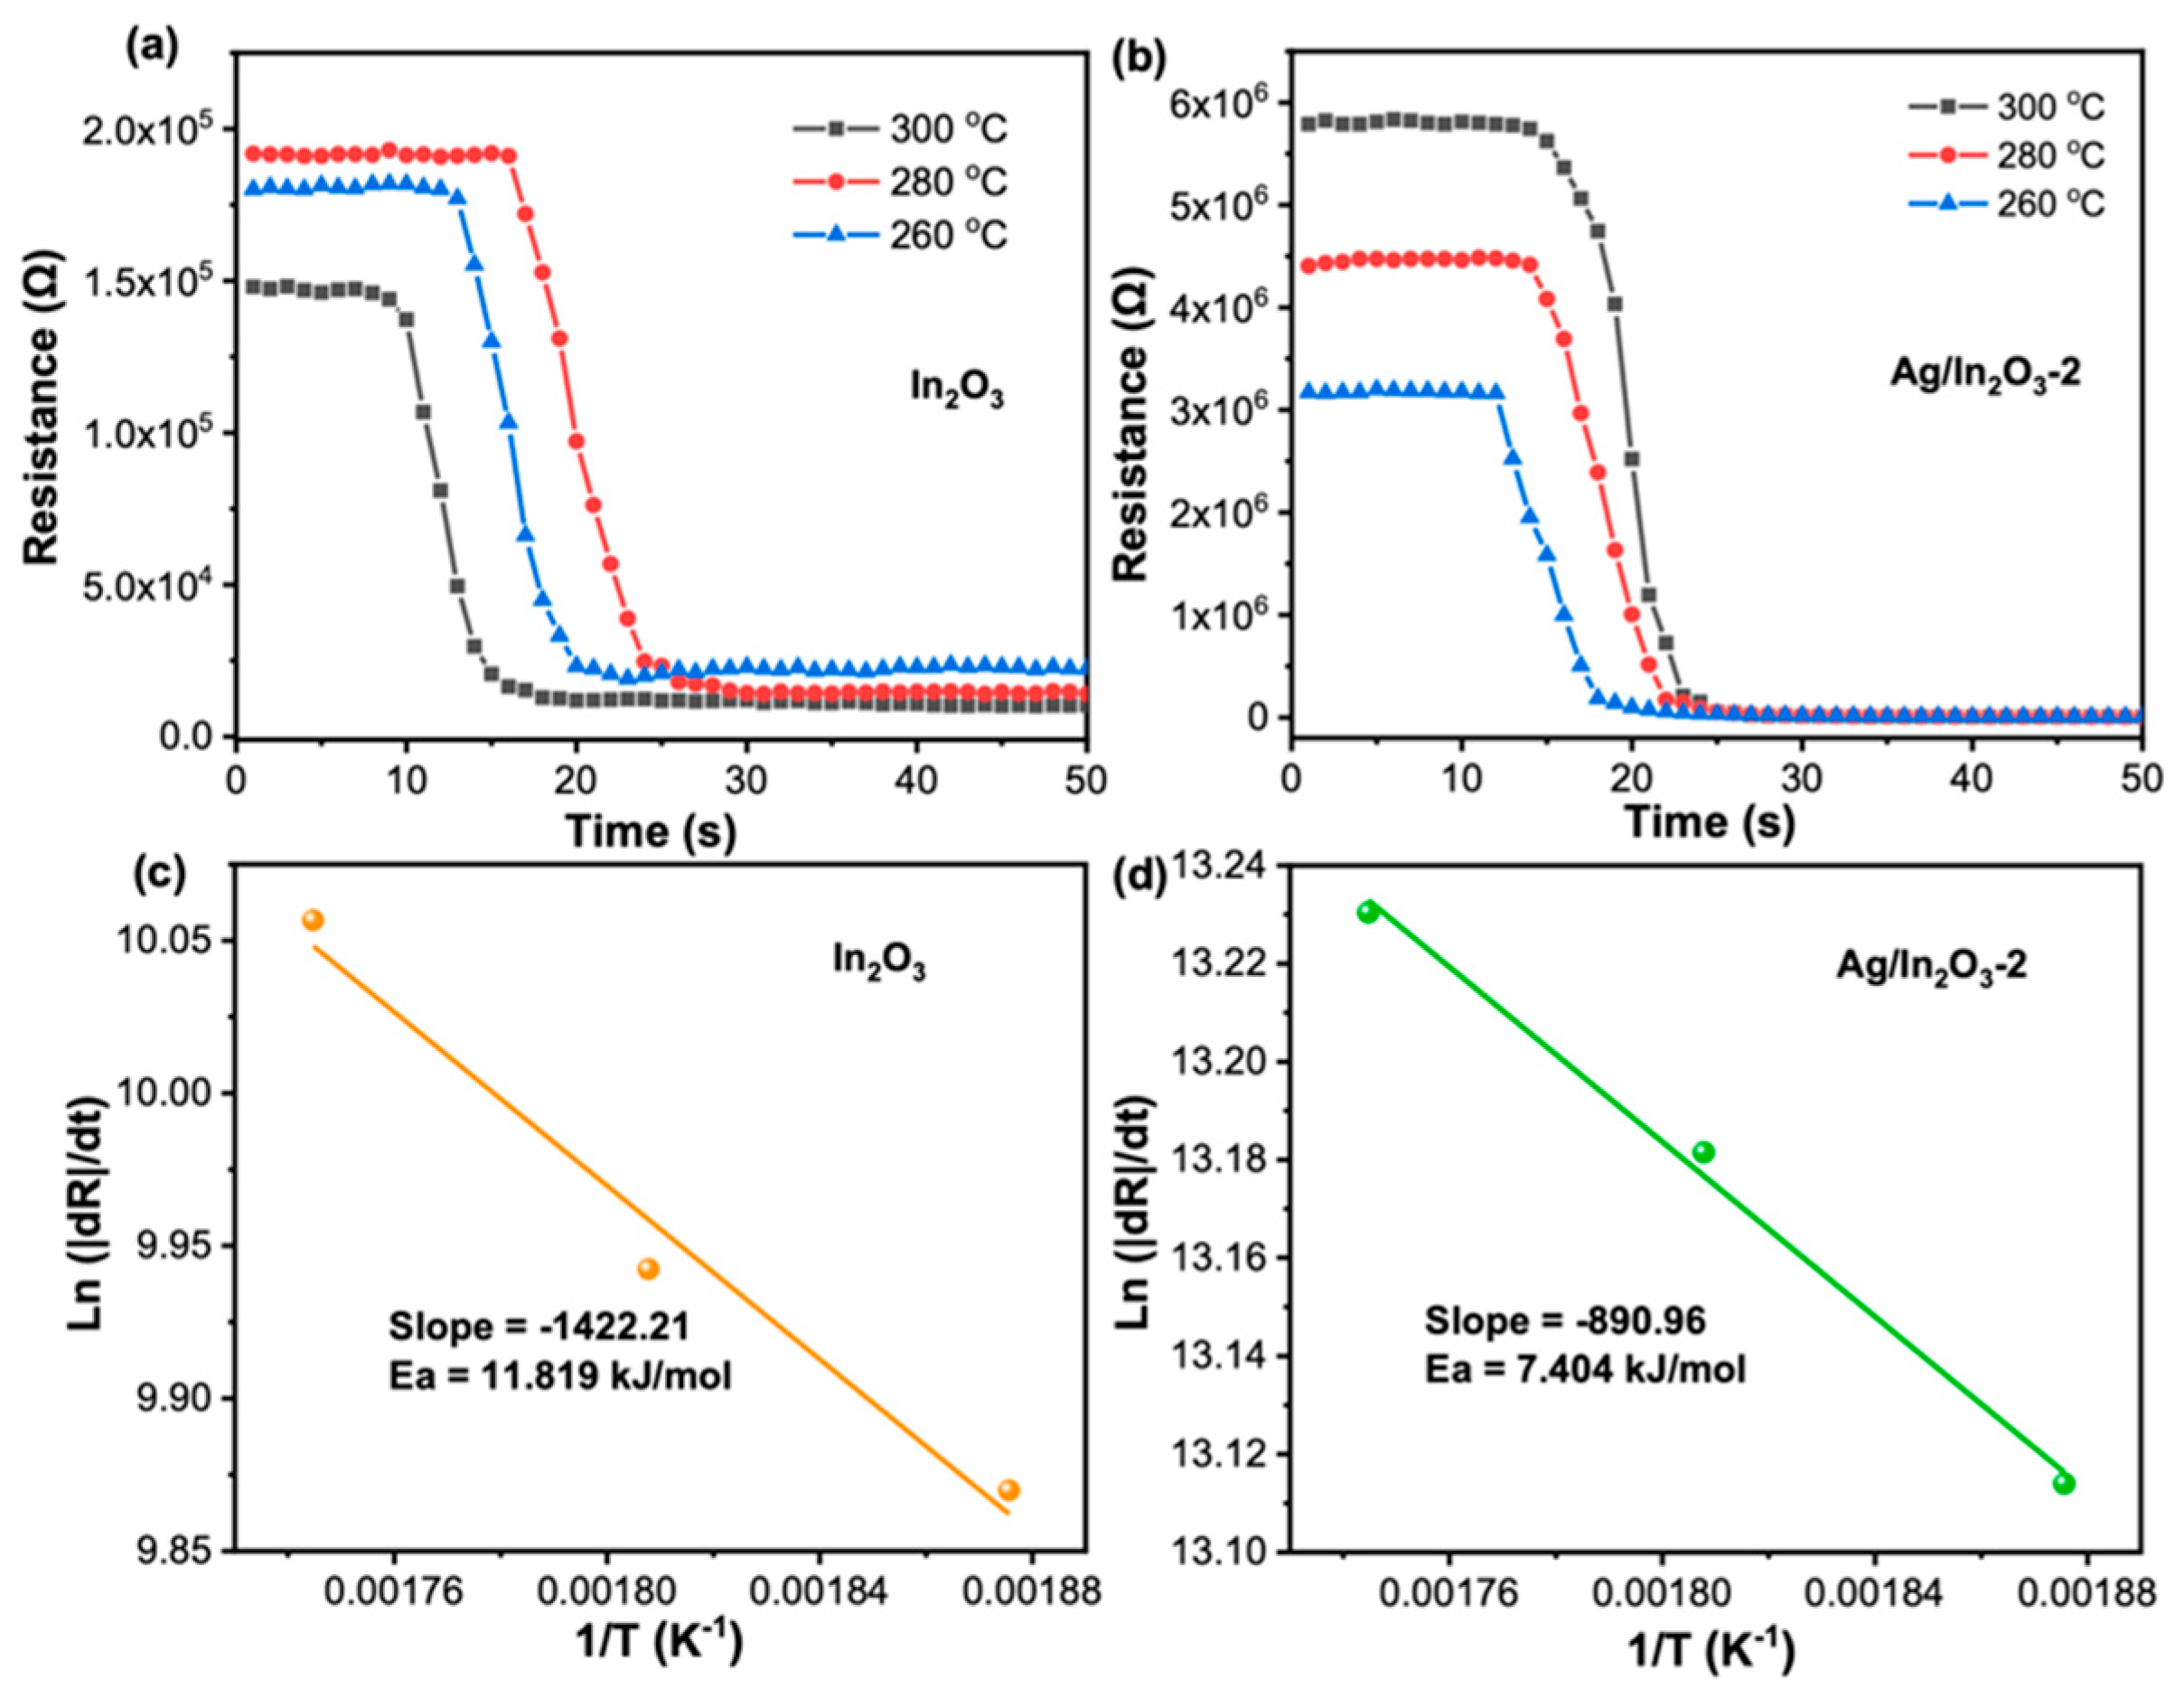
3.3. Gas Sensing Mechanism

In2O3 is a typical n-type MOS, and its gas sensing phenomenon can be illustrated by widely accepted oxygen adsorption theory [66,67]. As schematically illustrated in Figure 8, when our In2O3 PNS sensor is exposed in air atmosphere, oxygen molecules can adsorb on the surface of In2O3 PNS and then capture electrons from its conduction band to form chemisorbed oxygen species (Equations (1)–(4)). As a result, a thick electron depletion layer (EDL) with higher resistance will form on the surface of In2O3 PNS, leading to its higher sensor resistance in air (Ra) (Figure 8a). Meanwhile, as the sensor is exposed to reducing gases, such as TEA, a redox reaction (gas sensing reaction) between TEA and chemisorbed oxygen species will occur, after which the electrons captured by chemisorbed oxygen will be released back to In2O3, resulting in a thinner EDL and a decreased sensor resistance (Rg), accordingly (Figure 8c). The varied resistance of the In2O3 PNS sensor in air and target gas endows it with the gas sensing ability.
O2(gas)→O2(ads)
O2(ads) + e→O2(ads)
O2(ads) + e→2O(ads)
O(ads) + e→O2−(ads)
In our experiment, the Ag/In2O3-2 sensor, like the bare In2O3 sensor, shows the characteristic response of an n-type MOS, but its gas sensing performance to TEA was remarkably boosted, especially in terms of lower operating temperature, higher sensitivity, and better selectivity. These improvements in gas sensing performance can be mainly attributed to the sensitization effects of Ag nanoparticles on In2O3 PNSs. Firstly, Ag nanoparticle can promote the dissociation of oxygen molecules to form chemisorbed oxygen through its strong “spillover effect” [53] (Figure 8c). That is to say, in air atmospheres, more chemisorbed oxygen species (O2−) will be created on Ag-decorated In2O3 PNSs than on the bare In2O3 counterpart (the XPS spectra of O 1s in Figure 3d indicate that Ag/In2O3-2 owns higher Oads content than bare In2O3, supporting this speculation). On one hand, the increase in chemisorbed oxygen can endow the Ag/In2O3-2 sensor with higher Ra value (Figure 5b), which is favorable for higher response because the response of the Ag/In2O3 sensor to TEA is defined as Ra/Rg. On the other hand, it will promote the surface sensing reaction due to the increased concentration of O2− reactant, which also contributes to the enhancement in TEA response. Additionally, the faster recovery speed of Ag/In2O3-2 (Figure 6f) may also be relevant to the “spillover effect” of Ag nanoparticles, which can accelerate the regeneration of chemisorbed oxygen after switching the sensor from TEA to air ambient. Secondly, Ag has good catalytic property. When decorating Ag nanoparticles on In2O3 PNS, they can catalytic the gas sensing reaction that occurs between TEA and chemisorbed oxygen species (Figure 8d), leading to a lower reaction barrier and a decreased operating temperature, accordingly. As in our discussion on Figure 4a,b, due to the catalytic effect of Ag nanoparticles, the Ag/In2O3 sensors show the maximum resistance and response at the same temperature (300 °C); in contrast, the bare In2O3 sensor shows higher temperature of maximum response (320 °C) than that of its maximum resistance (280 °C). Such a difference between bare In2O3 and Ag/In2O3 sensors supports, to some extent, the existence of catalytic effect of Ag nanoparticles in the Ag/In2O3 sensors. To prove above speculation, the apparent activation energies (Ea) of bare In2O3 and Ag/In2O3-2 were estimated by their Arrhenius-type plots (Figure 9c,d) that derived from Figure 9a,b [17,61]. The results show that the Ea values of bare In2O3 and Ag/In2O3-2 are 11.819 and 7.404 kJ/mol, respectively. The lower Ea of Ag/In2O3-2 than that of bare In2O3 convinces the existence of catalytic effect of Ag, which not only endows the Ag/In2O3-2 sensor with lower OWT, but also endows it with higher response for sensing TEA. Thirdly, when decorating Ag nanoparticles on the surface of In2O3 PNSs, the Schottky junction between Ag and In2O3 will be created. Since the work function of In2O3 (4.3 eV) is smaller than that of Ag (4.6 eV) [57], at the interface of Ag nanoparticles and In2O3 PNSs, electrons will flow from In2O3 to Ag to equilibrate their Fermi level (Figure 8b). Consequently, on the In2O3 side, besides the EDL caused by chemisorbed oxygen, an additional EDL will be also formed, leading to a thicker EDL on Ag/In2O3 and a higher response than bare In2O3 accordingly.
In addition, both our In2O3 and Ag/In2O3 sensors show good selectivity to TEA. Generally, the gas selectivity of a MOS sensor can be influenced by many factors, such as the adsorption property of target gas on the surface of MOS, the reactivity of reactants (chemisorbed oxygen species and adsorbed target gas), the surface catalytic property of MOS, and so on. In our case, the relatively lower bond energy of C-N should be one of the possible reasons for the good TEA selectivity of the In2O3 and Ag/In2O3 sensors. The bond energy of C-N in TEA is 307 kJ/mol, which is lower than that of C=C (toluene, 610.3 kJ/mol), N-H (ammonia, 386 kJ/mol), H-O (ethanol and methanol, 458 kJ/mol), and C=O (formaldehyde and acetone, 798.9 kJ/mol) [61]. The lowest bond energy of C-N endows TEA molecules with high reaction activity during the gas sensing process, leading to good TEA selectivity.

4. Conclusions

In summary, well-dispersed Ag nanoparticles with a size of about 25–30 nm were decorated on In2O3 PNSs (~100 nm in diameter) via a room-temperature chemical reduction method. After modification with Ag nanoparticles, the In2O3 PNSs sensor showed remarkable improvements in TEA sensing performance, especially of lower OWT (decreased from 320 to 300°C), higher sensitivity (increased from 0.69/ppm to 116.86/ppm for 1–50 ppm TEA), and better selectivity (STEA/Sethanol increased from 1.59 to 5.30). These improved gas sensing performances of as-prepared Ag/In2O3 were contributed to the positive effects of Ag, the spillover effect, and electron sensitization of the Ag–In2O3 Schottky junction, as well as the catalysis effect of Ag on the surface gas sensing reaction between TEA and chemisorbed oxygen. Our research strongly demonstrates that modification of In2O3 with Ag is a promising strategy to develop an advanced TEA sensor.

Author Contributions

Investigation and writing—original draft preparation, D.L.; conceptualization and methodology, Y.L.; investigation, X.W.; supervision, writing—reviewing and editing, project administration, G.S.; formal analysis, J.C. and Y.W. All authors have read and agreed to the published version of the manuscript.

Funding

This work was financially supported by the National Natural Science Foundation of China (U1704255 and U1404613), Program for Science and Technology Innovation Talents in Universities of Henan Province (18HASTIT010), the Program for Innovative Research Team of Henan Polytechnic University (T2019-1), Program for Innovative Research Team in the Universities of Henan Province (21IRTSTHN006), and Natural Science Foundation of Henan Province of China (162300410113).

Conflicts of Interest

The authors declare no conflict of interest.

References

  1. Capelli, L.; Sironi, S.; Del Rosso, R. Electronic noses for environmental monitoring applications. Sensors 2014, 14, 19979–20007. [Google Scholar] [CrossRef] [PubMed]
  2. Jung, Y.; Moon, H.G.; Lim, C.; Choi, K.; Song, H.S.; Bae, S.; Kim, S.M.; Seo, M.; Lee, T.; Lee, S.; et al. Humidity-tolerant single-stranded DNA-Functionalized graphene probe for medical applications of exhaled breath analysis. Adv. Funct. Mater. 2017, 27, 1700068. [Google Scholar] [CrossRef]
  3. Lloyd Spetz, A.; Huotari, J.; Bur, C.; Bjorklund, R.; Lappalainen, J.; Jantunen, H.; Schütze, A.; Andersson, M. Chemical sensor systems for emission control from combustions. Sens. Actuators B-Chem. 2013, 187, 184–190. [Google Scholar] [CrossRef] [Green Version]
  4. Love, C.; Nazemi, H.; El-Masri, E.; Ambrose, K.; Freund, M.S.; Emadi, A. A review on advanced sensing materials for agricultural gas sensors. Sensors 2021, 21, 3423. [Google Scholar] [CrossRef] [PubMed]
  5. Ju, D.X.; Xu, H.Y.; Qiu, Z.W.; Guo, J.; Zhang, J.; Cao, B.Q. Highly sensitive and selective triethylamine-sensing properties of nanosheets directly grown on ceramic tube by forming NiO/ZnO PN heterojunction. Sens. Actuators B-Chem. 2014, 200, 288–296. [Google Scholar] [CrossRef]
  6. Liu, S.R.; Guan, M.Y.; Li, X.Z.; Guo, Y. Light irradiation enhanced triethylamine gas sensing materials based on ZnO/ZnFe2O4 composites. Sens. Actuators B-Chem. 2016, 236, 350–357. [Google Scholar] [CrossRef]
  7. Bai, S.L.; Zhao, Y.H.; Sun, J.H.; Tong, Z.F.; Luo, R.X.; Li, D.Q.; Chen, A.F. Preparation of conducting films based on alpha-MoO3/PANI hybrids and their sensing properties to triethylamine at room temperature. Sens. Actuators B-Chem. 2017, 239, 131–138. [Google Scholar] [CrossRef]
  8. Zou, Y.H.; Chen, S.; Sun, J.; Liu, J.Q.; Che, Y.K.; Liu, X.H.; Zhang, J.; Yang, D.J. Highly efficient gas sensor using a hollow SnO2 microfiber for triethylamine detection. ACS Sens. 2017, 2, 897–902. [Google Scholar] [CrossRef]
  9. Shi, S.X.; Zhang, F.; Lin, H.M.; Wang, Q.; Shi, E.B.; Qu, F.Y. Enhanced triethylamine-sensing properties of P-N heterojunction Co3O4/In2O3 hollow microtubes derived from metal-organic frameworks. Sens. Actuators B-Chem. 2018, 262, 739–749. [Google Scholar] [CrossRef]
  10. Gao, X.; Zhang, T. An overview: Facet-dependent metal oxide semiconductor gas sensors. Sens. Actuators B-Chem. 2018, 277, 604–633. [Google Scholar] [CrossRef]
  11. Mirzaei, A.; Kim, S.S.; Kim, H.W. Resistance-based H2S gas sensors using metal oxide nanostructures: A review of recent advances. J. Hazard. Mater. 2018, 357, 314–331. [Google Scholar] [CrossRef] [PubMed]
  12. Zhong, Y.; Li, W.; Zhao, X.; Jiang, X.; Lin, S.; Zhen, Z.; Chen, W.; Xie, D.; Zhu, H. High-response room-temperature NO2 Sensor and ultrafast humidity sensor based on SnO2 with rich oxygen vacancy. ACS Appl. Mater. Interfaces 2019, 11, 13441–13449. [Google Scholar] [CrossRef] [PubMed]
  13. Yuan, H.; Aljneibi, S.A.A.A.; Yuan, J.; Wang, Y.; Liu, H.; Fang, J.; Tang, C.; Yan, X.; Cai, H.; Gu, Y.; et al. ZnO nanosheets abundant in oxygen vacancies derived from metal-organic frameworks for ppb-level gas sensing. Adv. Mater. 2019, 31, 1807161. [Google Scholar] [CrossRef] [PubMed]
  14. Xu, Y.; Zheng, L.; Yang, C.; Zheng, W.; Liu, X.; Zhang, J. Oxygen vacancies enabled porous SnO2 thin films for highly sensitive detection of triethylamine at room temperature. ACS Appl. Mater. 2020, 12, 20704–20713. [Google Scholar] [CrossRef] [PubMed]
  15. Shen, Z.; Zhang, X.; Mi, R.; Liu, M.; Chen, Y.; Chen, C.; Ruan, S. On the high response towards TEA of gas sensors based on Ag-loaded 3D porous ZnO microspheres. Sens. Actuators B-Chem. 2018, 270, 492–499. [Google Scholar] [CrossRef]
  16. Zhang, B.; Li, Y.W.; Luo, N.; Xu, X.T.; Sun, G.; Wang, Y.; Cao, J.L. TiO2/ZnCo2O4 porous nanorods: Synthesis and temperature-dependent dual selectivity for sensing HCHO and TEA. Sens. Actuators B-Chem. 2020, 321, 128461. [Google Scholar] [CrossRef]
  17. Gu, F.; Cui, Y.; Han, D.; Hong, S.; Flytzani-Stephanopoulos, M.; Wang, Z. Atomically dispersed Pt (II) on WO3 for highly selective sensing and catalytic oxidation of triethylamine. Appl. Catal. B Environ. 2019, 256, 117809. [Google Scholar] [CrossRef]
  18. Sun, X.; Liu, X.; Deng, X.; Xu, X. Synthesis of Zn-doped In2O3 nano sphere architectures as a triethylamine gas sensor and photocatalytic properties. RSC Adv. 2016, 6, 89847–89854. [Google Scholar] [CrossRef]
  19. Yang, Y.; Zhang, D.; Wang, D.; Xu, Z.; Zhang, J. A high-stability weighing paper/polytetrafluoroethylene-based triboelectric nanogenerator for self-powered In2O3 nanocubes/SnS2 nanoflower NO2 gas sensors. J. Mater. Chem. A 2021, 9, 14495–14506. [Google Scholar] [CrossRef]
  20. Liu, L.; Zhao, Y.T.; Song, P.; Yang, Z.X.; Wang, Q. ppb level triethylamine detection of yolk-shell SnO2/Au/Fe2O3 nanoboxes at low-temperature. Appl. Surf. Sci. 2019, 476, 391–401. [Google Scholar] [CrossRef]
  21. Yang, S.; Song, Z.; Gao, N.; Hu, Z.; Zhou, L.; Liu, J.; Zhang, B.; Zhang, G.; Jiang, S.; Li, H.-Y.; et al. Near room temperature operable H2S sensors based on In2O3 colloidal quantum dots. Sens. Actuators B-Chem. 2019, 286, 22–31. [Google Scholar] [CrossRef]
  22. Zhang, C.; Huan, Y.C.; Sun, D.J.; Lu, Y.L. Synthesis and NO2 sensing performances of CuO nanoparticles loaded In2O3 hollow spheres. J. Alloys Compd. 2020, 842, 155857. [Google Scholar] [CrossRef]
  23. Zhang, D.; Cao, Y.; Yang, Z.; Wu, J. Nanoheterostructure construction and DFT study of Ni-doped In2O3 nanocubes/WS2 hexagon nanosheets for formaldehyde sensing at room temperature. ACS Appl. Mater. Interfaces 2020, 12, 11979–11989. [Google Scholar] [CrossRef] [PubMed]
  24. Quan, W.; Hu, X.; Min, X.; Qiu, J.; Tian, R.; Ji, P.; Qin, W.; Wang, H.; Pan, T.; Cheng, S.; et al. A highly sensitive and selective ppb-level acetone sensor based on a Pt-doped 3D Porous SnO2 hierarchical structure. Sensors 2020, 20, 1150. [Google Scholar] [CrossRef] [Green Version]
  25. Gu, F.; Di, M.; Han, D.; Hong, S.; Wang, Z. Atomically dispersed Au on In2O3 Nanosheets for highly sensitive and selective detection of formaldehyde. ACS Sens. 2020, 5, 2611–2619. [Google Scholar] [CrossRef]
  26. Zhang, D.; Yang, Z.; Yu, S.; Mi, Q.; Pan, Q. Diversiform metal oxide-based hybrid nanostructures for gas sensing with versatile prospects. Coord. Chem. Rev. 2020, 413, 213272. [Google Scholar] [CrossRef]
  27. Zhang, K.; Qin, S.W.; Tang, P.G.; Feng, Y.J.; Li, D.Q. Ultra-sensitive ethanol gas sensors based on nanosheet-assembled hierarchical ZnO-In2O3 heterostructures. J. Hazard. Mater. 2020, 391, 122191. [Google Scholar] [CrossRef]
  28. Zhang, D.; Yang, Z.; Li, P.; Zhou, X. Ozone gas sensing properties of metal-organic frameworks-derived In2O3 hollow microtubes decorated with ZnO nanoparticles. Sens. Actuators B-Chem. 2019, 301, 127081. [Google Scholar] [CrossRef]
  29. Sukee, A.; Alharbi, A.A.; Staerz, A.; Wisitsoraat, A.; Liewhiran, C.; Weimar, U.; Barsan, N. Effect of AgO loading on flame-made LaFeO3 p-type semiconductor nanoparticles to acetylene sensing. Sens. Actuators B-Chem. 2020, 312, 127990. [Google Scholar] [CrossRef]
  30. Cai, Z.; Park, S. Synthesis of Pd nanoparticle-decorated SnO2 nanowires and determination of the optimum quantity of Pd nanoparticles for highly sensitive and selective hydrogen gas sensor. Sens. Actuators B-Chem. 2020, 322, 128651. [Google Scholar] [CrossRef]
  31. Yang, X.; Fu, H.; Tian, Y.; Xie, Q.; Xiong, S.; Han, D.; Zhang, H.; An, X. Au decorated In2O3 hollow nanospheres: A novel sensing material toward amine. Sens. Actuators B-Chem. 2019, 296, 126696. [Google Scholar] [CrossRef]
  32. Zhou, S.; Lu, Q.; Chen, M.; Li, B.; Wei, H.; Zi, B.; Zeng, J.; Zhang, Y.; Zhang, J.; Zhu, Z.; et al. Platinum-supported cerium-doped indium oxide for highly sensitive triethylamine gas sensing with good antihumidity. ACS Appl. Mater. Interfaces 2020, 12, 42962–42970. [Google Scholar] [CrossRef] [PubMed]
  33. Xu, Y.; Zheng, W.; Liu, X.; Zhang, L.; Zheng, L.; Yang, C.; Pinna, N.; Zhang, J. Platinum single atoms on tin oxide ultrathin films for extremely sensitive gas detection. Mater. Horiz. 2020, 7, 1519–1527. [Google Scholar] [CrossRef]
  34. Pan, Q.N.; Li, T.T.; Zhang, D.Z. Ammonia gas sensing properties and density functional theory investigation of coral-like Au-SnSe2 schottky junction. Sens. Actuators B-Chem. 2021, 332, 129440. [Google Scholar] [CrossRef]
  35. Majhi, S.M.; Naik, G.K.; Lee, H.J.; Song, H.G.; Lee, C.R.; Lee, I.H.; Yu, Y.T. Au@NiO core-shell nanoparticles as a p-type gas sensor: Novel synthesis, characterization, and their gas sensing properties with sensing mechanism. Sens. Actuators B-Chem. 2018, 268, 223–231. [Google Scholar] [CrossRef]
  36. Zhang, D.; Sun, Y.E.; Jiang, C.; Yao, Y.; Wang, D.; Zhang, Y. Room-temperature highly sensitive CO gas sensor based on Ag-loaded zinc oxide/molybdenum disulfide ternary nanocomposite and its sensing properties. Sens. Actuators B-Chem. 2017, 253, 1120–1128. [Google Scholar] [CrossRef]
  37. Ju, D.X.; Xu, H.Y.; Qiu, Z.W.; Zhang, Z.C.; Xu, Q.; Zhang, J.; Wang, J.Q.; Cao, B.Q. Near room temperature, fast-response, and highly sensitive triethylamine sensor assembled with Au-Loaded ZnO/SnO2 Core-Shell nanorods on flat alumina substrates. ACS Appl. Mater. Interfaces 2015, 7, 19163–19171. [Google Scholar] [CrossRef] [PubMed]
  38. Peng, R.; Li, Y.; Liu, T.; Si, P.; Feng, J.; Suhr, J.; Ci, L. Boron-doped graphene coated Au@SnO2 for high-performance triethylamine gas detection. Mater. Chem. Phys. 2020, 239, 121961. [Google Scholar] [CrossRef]
  39. Zhang, D.; Yang, Z.; Li, P.; Pang, M.; Xue, Q. Flexible self-powered high-performance ammonia sensor based on Au-decorated MoSe2 nanoflowers driven by single layer MoS2-flake piezoelectric nanogenerator. Nano Energy 2019, 65, 103974. [Google Scholar] [CrossRef]
  40. Zhao, H.; Yin, H.; Yu, X.X.; Zhang, W.; Li, C.; Zhu, M.Q. In2O3 nanoparticles/carbon fiber hybrid mat as free-standing anode for lithium-ion batteries with enhanced electrochemical performance. J. Alloys Compd. 2018, 735, 319–326. [Google Scholar] [CrossRef]
  41. Zhu, B.; Wu, X.H.; Liu, W.J.; Lu, H.L.; Zhang, D.W.; Fan, Z.Y.; Ding, S.J. High-performance on-chip supercapacitors based on mesoporous silicon coated with ultrathin atomic layer-deposited In2O3 films. ACS Appl. Mater. Interfaces 2019, 11, 747–752. [Google Scholar] [CrossRef] [PubMed]
  42. Chao, Y.G.; Zhou, P.; Li, N.; Lai, J.P.; Yang, Y.; Zhang, Y.L.; Tang, Y.H.; Yang, W.X.; Du, Y.P.; Su, D.; et al. Ultrathin visible-light-driven Mo incorporating In2O3-ZnIn2Se4 Z-scheme nanosheet photocatalysts. Adv. Mater. 2019, 31, 1807226. [Google Scholar] [CrossRef] [PubMed]
  43. Wang, Z.H.; Hou, C.L.; De, Q.M.; Gu, F.B.; Han, D.M. One-step synthesis of Co-doped In2O3 nanorods for high response of formaldehyde sensor at low temperature. ACS Sens. 2018, 3, 468–475. [Google Scholar] [CrossRef]
  44. Hu, J.; Sun, Y.; Xue, Y.; Zhang, M.; Li, P.; Lian, K.; Zhuiykov, S.; Zhang, W.; Chen, Y. Highly sensitive and ultra-fast gas sensor based on CeO2-loaded In2O3 hollow spheres for ppb-level hydrogen detection. Sens. Actuators B-Chem. 2018, 257, 124–135. [Google Scholar] [CrossRef]
  45. Hwang, J.; Jung, H.; Shin, H.S.; Kim, D.S.; Kim, D.S.; Ju, B.K.; Chun, M. The effect of noble metals on co gas sensing properties of In2O3 nanoparticles. Appl. Sci. 2021, 11, 4903. [Google Scholar] [CrossRef]
  46. Xue, D.P.; Zhang, S.S.; Zhang, Z.Y. Hydrothermal synthesis of methane sensitive porous In2O3 nanosheets. Mater. Lett. 2019, 252, 169–172. [Google Scholar] [CrossRef]
  47. Zhang, S.; Song, P.; Zhang, J.; Yan, H.H.; Li, J.; Yang, Z.X.; Wang, Q. Highly sensitive detection of acetone using mesoporous In2O3 nanospher es decorated with Au nanoparticles. Sens. Actuators B-Chem. 2017, 242, 983–993. [Google Scholar] [CrossRef]
  48. Li, Z.J.; Yan, S.N.; Wu, Z.L.; Li, H.; Wang, J.Q.; Shen, W.Z.; Wang, Z.G.; Fu, Y.Q. Hydrogen gas sensor based on mesoporous In2O3 with fast response/recovery and ppb level detection limit. Int. J. Hydrogen Energy 2018, 43, 22746–22755. [Google Scholar] [CrossRef]
  49. Qin, Z.J.; Liu, Y.K.; Chen, W.W.; Ai, P.; Wu, Y.M.; Li, S.H.; Yu, D.P. Highly sensitive alcohol sensor based on a single Er-doped In2O3 nanoribbon. Chem. Phys. Lett. 2016, 646, 12–17. [Google Scholar] [CrossRef]
  50. Han, D.M.; Zhai, L.L.; Gu, F.B.; Wang, Z.H. Highly sensitive NO2 gas sensor of ppb-level detection based on In2O3 nanobricks at low temperature. Sens. Actuators B-Chem. 2018, 262, 655–663. [Google Scholar] [CrossRef]
  51. Zheng, L.; Ma, T.; Zhao, Y.; Xu, Y.; Sun, L.; Zhang, J.; Liu, X. Synergy between Au and In2O3 microspheres: A superior hybrid structure for the selective and sensitive detection of triethylamine. Sens. Actuators B-Chem. 2019, 290, 155–162. [Google Scholar] [CrossRef]
  52. Liu, X.J.; Zhao, K.R.; Sun, X.L.; Zhang, C.; Duan, X.P.; Hou, P.Y.; Zhao, G.; Zhang, S.W.; Yang, H.C.; Cao, R.Y.; et al. Rational design of sensitivity enhanced and stability improved TEA gas sensor assembled with Pd nanoparticles-functionalized In2O3 composites. Sens. Actuators B-Chem. 2019, 285, 1–10. [Google Scholar] [CrossRef]
  53. Ding, M.; Xie, N.; Wang, C.; Kou, X.; Zhang, H.; Guo, L.; Sun, Y.; Chuai, X.; Gao, Y.; Liu, F.; et al. Enhanced NO2 gas sensing properties by Ag-doped hollow urchin-like In2O3 hierarchical nanostructures. Sens. Actuators B-Chem. 2017, 252, 418–427. [Google Scholar] [CrossRef]
  54. Yan, S.; Li, Z.; Li, H.; Wu, Z.; Wang, J.; Shen, W.; Fu, Y.Q. Ultra-sensitive room-temperature H2S sensor using Ag–In2O3 nanorod composites. J. Mater. Sci. 2018, 53, 16331–16344. [Google Scholar] [CrossRef]
  55. Jin, X.H.; Li, Y.W.; Zhang, B.; Xu, X.T.; Sun, G.; Wang, Y. Temperature-dependent dual selectivity of hierarchical porous In2O3 nanospheres for sensing ethanol and TEA. Sens. Actuators B-Chem. 2021, 330, 129271. [Google Scholar] [CrossRef]
  56. Li, Y.W.; Luo, N.; Sun, G.; Zhang, B.; Jin, H.H.; Lin, L.; Bala, H.; Cao, J.L.; Zhang, Z.Y.; Wang, Y. Synthesis of porous nanosheets-assembled ZnO/ZnCo2O4 hierarchical structure for TEA detection. Sens. Actuators B-Chem. 2019, 287, 199–208. [Google Scholar] [CrossRef]
  57. Liu, X.; Sun, X.; Duan, X.; Zhang, C.; Zhao, K.; Xu, X. Core-shell Ag@In2O3 hollow hetero-nanostructures for selective ethanol detection in air. Sens. Actuators B-Chem. 2020, 305, 127450. [Google Scholar] [CrossRef]
  58. Han, L.; Yin, D.; Yang, X.; Li, J.; Gao, X.; Liu, H. Incorporation of Ag-In2O3 nanostructures into sodium borosilicate glass: A combined route for high transparency and fluorescence. Mater. Chem. Phys. 2016, 181, 234–240. [Google Scholar] [CrossRef]
  59. Zeng, J.; Rong, Q.; Xiao, B.; Yu, R.; Zi, B.; Kuang, X.; Deng, X.; Ma, Y.; Zhang, J.; Wu, J.; et al. Single-atom silver loaded on tungsten oxide with oxygen vacancies for high performance triethylamine gas sensors. J. Mater. Chem. A 2021, 9, 8704–8710. [Google Scholar] [CrossRef]
  60. Navaneethan, M.; Patil, V.L.; Ponnusamy, S.; Muthamizhchelvan, C.; Kawasaki, S.; Patil, P.S.; Hayakawa, Y. Sensitivity enhancement of ammonia gas sensor based on Ag/ZnO flower and nanoellipsoids at low temperature. Sens. Actuators B-Chem. 2018, 255, 672–683. [Google Scholar]
  61. Zheng, L.; Xie, J.; Liu, X.; Yang, C.; Zheng, W.; Zhang, J. Unveiling the Electronic Interaction in ZnO/PtO/Pt nanoarrays for catalytic detection of triethylamine with ultrahigh sensitivity. ACS Appl. Mater. Interfaces 2020, 12, 46267–46276. [Google Scholar] [CrossRef] [PubMed]
  62. Xu, Y.; Tian, X.; Liu, P.; Sun, Y.; Du, G. In2O3 nanoplates with different crystallinity and porosity: Controllable synthesis and gas-sensing properties investigation. J. Alloys Compd. 2019, 787, 1063–1073. [Google Scholar] [CrossRef]
  63. Zhu, M.; Yang, T.; Zhai, C.; Du, L.; Zhang, J.; Zhang, M. Fast triethylamine gas sensing response properties of Ho-doped SnO2 nanoparticles. J. Alloys Compd. 2020, 817, 152724. [Google Scholar] [CrossRef]
  64. Xu, H.Y.; Li, W.R.; Han, R.; Zhai, T.; Yu, H.Q.; Chen, Z.R.; Wu, X.W.; Wang, J.Q.; Cao, B.Q. Enhanced triethylamine sensing properties by fabricating Au@SnO2/alpha-Fe2O3 core-shell nanoneedles directly on alumina tubes. Sens. Actuators B-Chem. 2018, 262, 70–78. [Google Scholar] [CrossRef]
  65. Kim, J.S.; Na, C.W.; Kwak, C.H.; Li, H.Y.; Yoon, J.W.; Kim, J.H.; Jeong, S.Y.; Lee, J.H. Humidity-independent gas sensors using Pr-doped In2O3 macroporous spheres: Role of cyclic Pr3+/Pr4+ redox reactions in suppression of water-poisoning effect. ACS Appl. Mater. Interfaces 2019, 11, 25322–25329. [Google Scholar] [CrossRef] [PubMed]
  66. Gu, F.; Li, C.; Han, D.; Wang, Z. Manipulating the defect structure (VO) of In2O3 nanoparticles for enhancement of formaldehyde detection. ACS Appl. Mater. Interfaces 2018, 10, 933–942. [Google Scholar] [CrossRef] [PubMed]
  67. Sun, L.; Wang, B.; Wang, Y. High-temperature gas sensor based on novel Pt Single Atoms@SnO2 Nanorods@SiC nanosheets multi-heterojunctions. ACS Appl. Mater. Interfaces 2020, 12, 21808–21817. [Google Scholar] [CrossRef]
Figure 1. XRD patterns of the prepared bare In2O3 and Ag-decorated In2O3 samples.
Nanomaterials 12 01532 g001
Figure 2. FESEM images of (a) bare In2O3 and (b) Ag/In2O3-2. Typical (c) TEM and (d) HRTEM images of Ag/In2O3-2. (e) EDS element maps of two adjacent Ag/In2O3 PNSs observed in Ag/In2O3-2. The inset in (c) is an enlarged TEM image of a single Ag/In2O3 PNS.
Nanomaterials 12 01532 g002
Figure 3. XPS spectra of the In2O3 and Ag/In2O3-2: (a) full survey spectra, (b) high-resolution In 3d spectra, (c) high-resolution Ag 3d spectrum of Ag/In2O3-2, and (d) high-resolution O 1s spectra.
Nanomaterials 12 01532 g003
Figure 4. N2 adsorption and desorption isotherms and pore-size distribution curves (insets) of (a) In2O3 and (b) Ag/In2O3-2.
Nanomaterials 12 01532 g004
Figure 5. (a) Temperature-dependent responses of the sensors to 20 ppm TEA, and (b) baseline resistances of the sensors at different operating temperatures. (c) Responses of In2O3 and Ag/In2O3-2 to different gases (50 ppm) at 300 °C, and (d) corresponding selectivity coefficients by using TEA as target gas.
Nanomaterials 12 01532 g005
Figure 6. (a) Dynamic resistance change in In2O3 and Ag/In2O3-2 as exposure to 1–50 ppm TEA at 300 °C. Real-time response–recovery curve of (b) In2O3 and (c) Ag/In2O3-2 for 1–50 ppm TEA at 300 °C (the insets are their corresponding liner relationship between response and gas concentration.). (d) Dynamic resistance change and real-time response–recovery curve of Ag/In2O3-2 as exposure to 50–600 ppb TEA at 300 °C. Transient resistance change in (e) In2O3 and (f) Ag/In2O3-2 as exposure to 50 ppm TEA at 300 °C.
Nanomaterials 12 01532 g006
Figure 7. (a) Repeatability and (b) long-term stability test of Ag/In2O3-2 for 20 ppm TEA; (c) responses of Ag/In2O3-2 to 20 ppm TEA under different relative humidity (RH).
Nanomaterials 12 01532 g007
Figure 8. Schematic illustration for the enhanced TEA sensitivity of In2O3 PNS by modifying with Ag nanoparticles.
Nanomaterials 12 01532 g008
Figure 9. The transient resistance change of (a) In2O3 and (b) Ag/In2O3-2 as exposure to 20 ppm TEA at different temperatures, and derived Arrhenius-type plots of (c) In2O3 and (d) Ag/In2O3-2.
Nanomaterials 12 01532 g009
Table 1. Compared TEA sensing performances of different materials.
MaterialsCon. (ppm)Response (Ra/Rg)Temp. (°C)Tres/Trec (s)STEA/SethanolRef.
Ag/In2O3 porous nanosphere505697.153006/3505.30This work
Single crystalline In2O3 nanoplates507.832010/195.20[62]
SnO2: Ho3+ nanoparticles50121752/1201.88[63]
Zn-doped In2O3 nanospheres50362809/73.00[18]
Yolk-shell SnO2/Au/Fe2O3 nanoboxes100126.842407/101.41[20]
Pd NPs-In2O35047.562204/171.85[52]
Au@SnO2/α-Fe2O3 nanoneedles100393004/2032.57[64]
Publisher’s Note: MDPI stays neutral with regard to jurisdictional claims in published maps and institutional affiliations.

