Article

Facile Synthesis of Green Fluorescent Carbon Dots and Their Application to Fe3+ Detection in Aqueous Solutions

1
Center for Biomedical Optics and Photonics (CBOP) & College of Physics and Optoelectronic Engineering, Key Lab of Optoelectronics Devices and Systems of Ministry of Education/Guangdong Province, Shenzhen University, Shenzhen 518060, China
2
National Research Nuclear University MEPhI (Moscow Engineering Physics Institute), 115409 Moscow, Russia
*
Authors to whom correspondence should be addressed.
Nanomaterials 2022, 12(9), 1487; https://doi.org/10.3390/nano12091487
Submission received: 3 April 2022 / Revised: 19 April 2022 / Accepted: 26 April 2022 / Published: 27 April 2022

Abstract

:
Carbon dots (CDs), a class of fluorescent nanomaterials, have attracted widespread attention from researchers. Because of their unique chemical properties, these high-quality fluorescent probes are widely used for ion and molecule detection. Excess intake of many ions or molecules can cause harm to the human body. Although iron (in the form of Fe3+ ions) is essential for the human body, excess iron in the human body can cause many diseases, such as iron poisoning. In this study, we have synthesized fluorine and nitrogen co-doped carbon dots (FNCDs) by a hydrothermal method. These FNCDs exhibited good stability, selectivity, and anti-interference ability for Fe3+. Fe3+ could be detected in the range of 0.2–300 μM, and their detection limit is up to 0.08 μM. In addition, the recovery and relative standard deviation measured by the standard addition recovery method were not higher than 107.5% and 1.1%, respectively, indicating that FNCDs have good recovery and accuracy for Fe3+ detection.

Graphical Abstract

1. Introduction

Carbon dots (CDs) are a new class of fluorescent nanomaterials that have widespread applications in fields such as photoelectric device fabrication [1,2], photodynamic therapy [3], living cell imaging [4,5,6], and biosensing [7,8,9], owing to their unique optical and chemical properties. In contrast to most luminescent materials, such as semiconductor quantum dots [10], precious metal nanoclusters, fluorescent proteins, and rare earth ions, CDs have unique optical properties, such as wavelength tunability in the visible region, two-photon emission, excellent photobleaching resistance, good photostability, and ability to exhibit photothermal effect. Most CDs are synthesized using low-cost carbon-based materials that contain abundant functional groups. Consequently, the surface of CDs has abundant functional groups, enabling them to effectively recognize ions and molecules and target specific organelles for imaging. Thus, CDs are being widely explored in the field of bioimaging and biosensing applications.
Fe is a common element in daily life and is an essential trace element in the human body. An average adult has approximately 4 to 5 mg of Fe, which is present in hemoglobin and actin. These two proteins are mainly used for oxygen transport, storage, and release. Therefore, Fe plays a crucial role in stimulating human metabolism; however, excess Fe in the human body can lead to serious diseases, such as Parkinson’s disease, cancer, and cirrhosis [11,12,13,14,15]. Because Fe is recycled efficiently, only trace amounts of Fe are excreted from the small intestine, rendering self-regulation difficult. Therefore, the quantitative detection of Fe is of great biological significance. For example, Ge et al. [16] used fresh tea leaves and urea as carbon and nitrogen sources, respectively, for the hydrothermal synthesis of CDs for Fe3+ detection. The detection range and detection limit of these CDs were 0–300 μM and 0.079 μM, respectively. Although a carbon dot has excellent detection range and detection limit, it is only used for the detection of Fe3+ in cells, and there is no detection data in actual water samples. Chen et al. [17] reported a method for the rapid synthesis of nitrogen-doped CDs by microwave-assisted pyrolysis using glutamic acid and ethylenediamine as carbon sources and N dopants, respectively. The Fe3+ detection range and detection limit of these CDs were 8–80 μM and 3.8 μM, respectively. It has been applied in intracellular and actual water samples. Although there are many application data of the carbon dots, their detection range and detection limit still have room for improvement. Zulfajri et al. [18] synthesized fluorescent CDs using cranberry beans, where the detection range and detection limit reached 30–600 μM and 9.55 μM, respectively. It also was applied to Fe3+ detection in actual water samples. Although the detection range is excellent, the detection limit was still high. Le Minh Tu Phan have developed nitrogen-doped CDs by using citric acid as a carbon source and polyethyleneimine molecular weight 1800 (PEI1800) as a nitrogen source [19]. The linear detection range and detection limit of the CDs for Fe2+ reached 0–50 μM and 0.702 μM. The Fe2+ detection in cells was also studied. Although only a few CDs can detect Fe2+, the detection range and detection limit of this carbon point need to be improved. In addition, this experiment also lacks the research results on the detection of Fe2+ in actual water samples. Therefore, the synthesis of a fluorescent CDs, which can detect Fe3+ in actual water samples and has a better detection range and detection limit, has important research significance.
In this work, we used 4,5-difluoro-o-phenylenediamine and ethylenediamine as precursors to synthesize green fluorescent fluorine and nitrogen co-doped carbon dots (FNCDs). FNCDs showed excellent detection ability for Fe3+. Compared with similar carbon dots that can detect Fe3+ in actual water samples, FNCDs have a better detection range or detection limit. In addition, the fitting degree of the linear relationship between the fluorescence intensity of FNCDs and Fe3+ concentration is very good. Therefore, the FNCDs have the advantages of a fast response, high accuracy, and high detection range for the detection of Fe3+.

2. Experimental Section

2.1. Materials

All reagents used in this study were of analytical grade and used in accordance with the standards. Metal salts (AgNO3, NaCl, KI, MnCl2·4H2O, CaCl2, MgCl2·6H2O, (CH3COO)2Ba, (CH3COO)2Pb, (CH3COO)2Sr, ZnCl2, CsBr, FeCl3·6H2O, NaOH, Na2HPO4, NaNO2, NaHCO3, LiCl, and NaF) and HCl were purchased from Macklin (Shanghai, China). 4,5-Difluoro-1,2 phenylenediamine was supplied by Macklin (Shanghai, China). Ethylenediamine was purchased from XIYA Reagent Co., Ltd., (Shandong, China).

2.2. Instruments

Transmission electron microscopy (TEM, FEI TECNAI G2 F20, Hillsboro, OR, USA), X-ray photoelectron spectroscopy (XPS, Thermo Fisher ESCALAB 250Xi, Waltham, MA, USA), Fourier-transform infrared (FT-IR) spectroscopy (Nicolet 5700 spectrometer, Waltham, MA, USA, mode: ATR, scans times: 64, resolution: 4 cm−1), ultraviolet-visible (UV-Vis) spectroscopy (UV-2550 Shimadzu, Osaka, Japan), fluorescence spectroscopy (PL, Varian Cary Eclipse Agilent, Santa Clara, CA, USA), and fluorescence lifetime (FL) measurements (FLS1000 photoluminescence spectrometer) were performed to determine the morphology, chemical composition, chemical structure, and optical properties of the samples. A laser-scanning confocal fluorescence microscope (Nikon A1R MP+, Tokyo, Japan) was used for cell imaging.

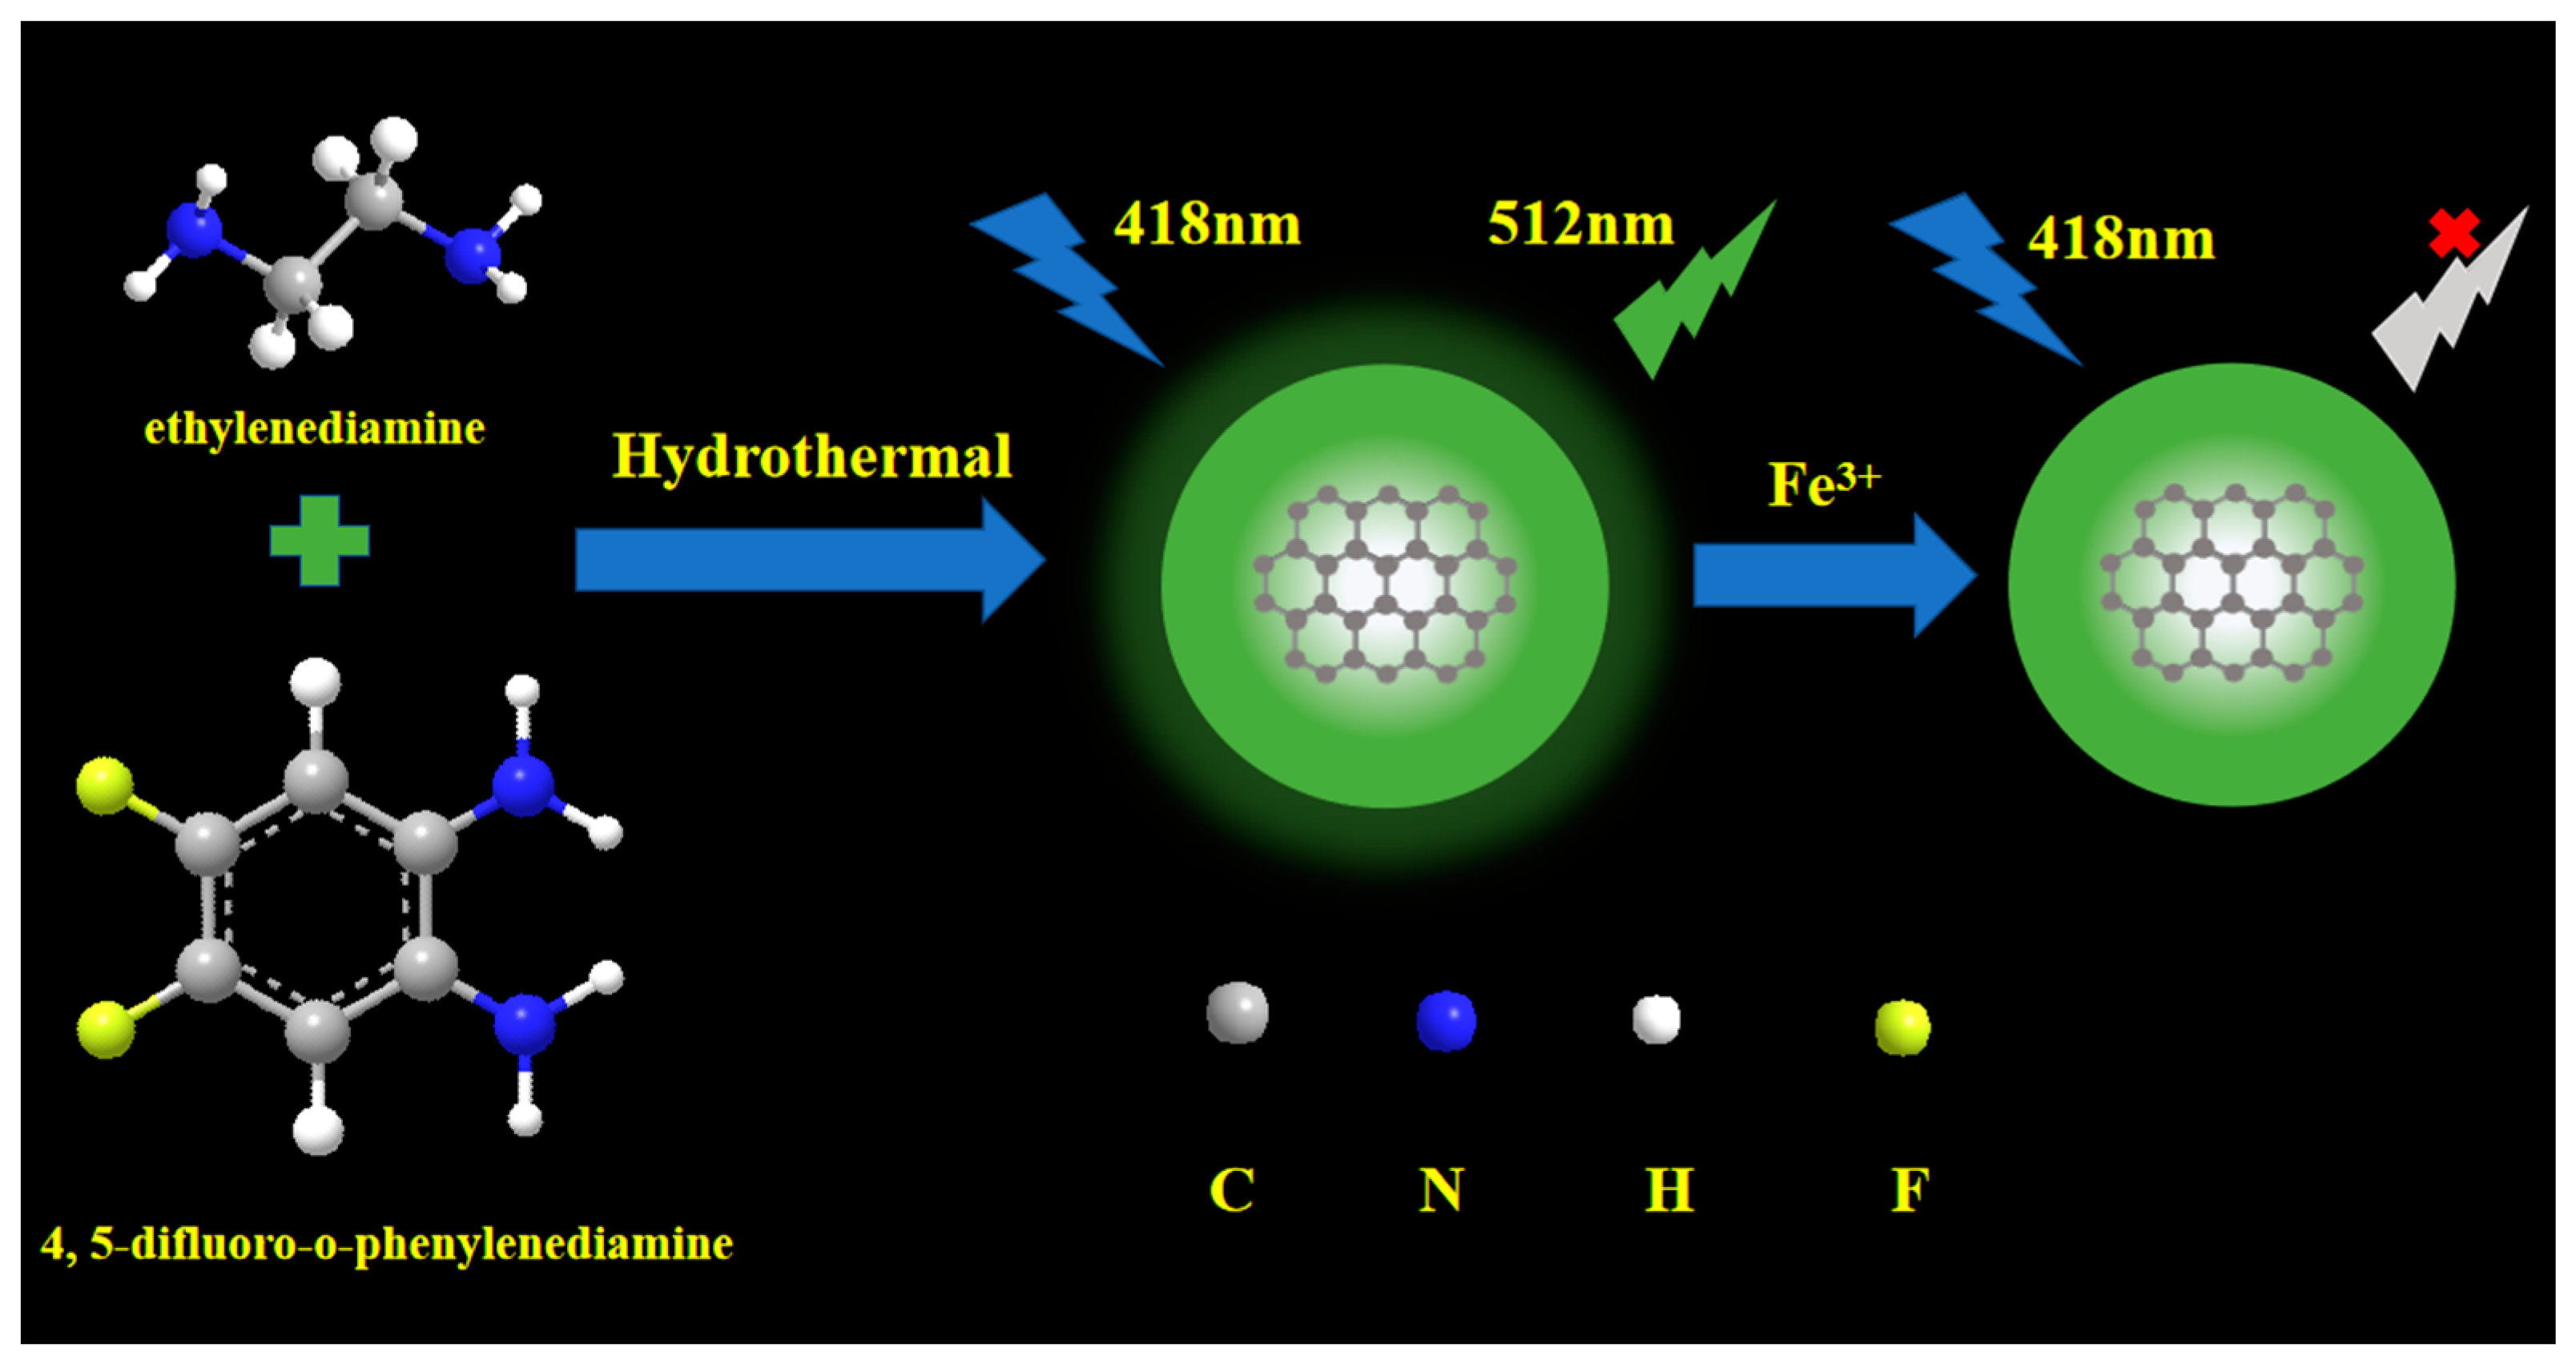
2.3. Synthesis of FNCDs

To synthesize FNCDs, 0.1 g of 4,5-difluoro-1,2 phenylenediamine and 0.1 g of ethylenediamine were added to a polytetrafluoroethylene-lined autoclave containing 15 mL of water, and the reaction was allowed to proceed at 180 °C for 12 h. After the reaction, the reaction kettle was naturally cooled to room temperature. The solution was centrifuged at 8000 rpm for 5 min, and the supernatant was collected. The centrifugation was repeated twice as above to remove large particles. The supernatant was dialyzed for three days against deionized water using a 500 Da membrane, and the deionized water was changed every 12 h during the dialysis. Finally, the dialysate was filtered through a 0.22 μM polyethersulfone aqueous membrane and lyophilized to obtain the FNCD powder.

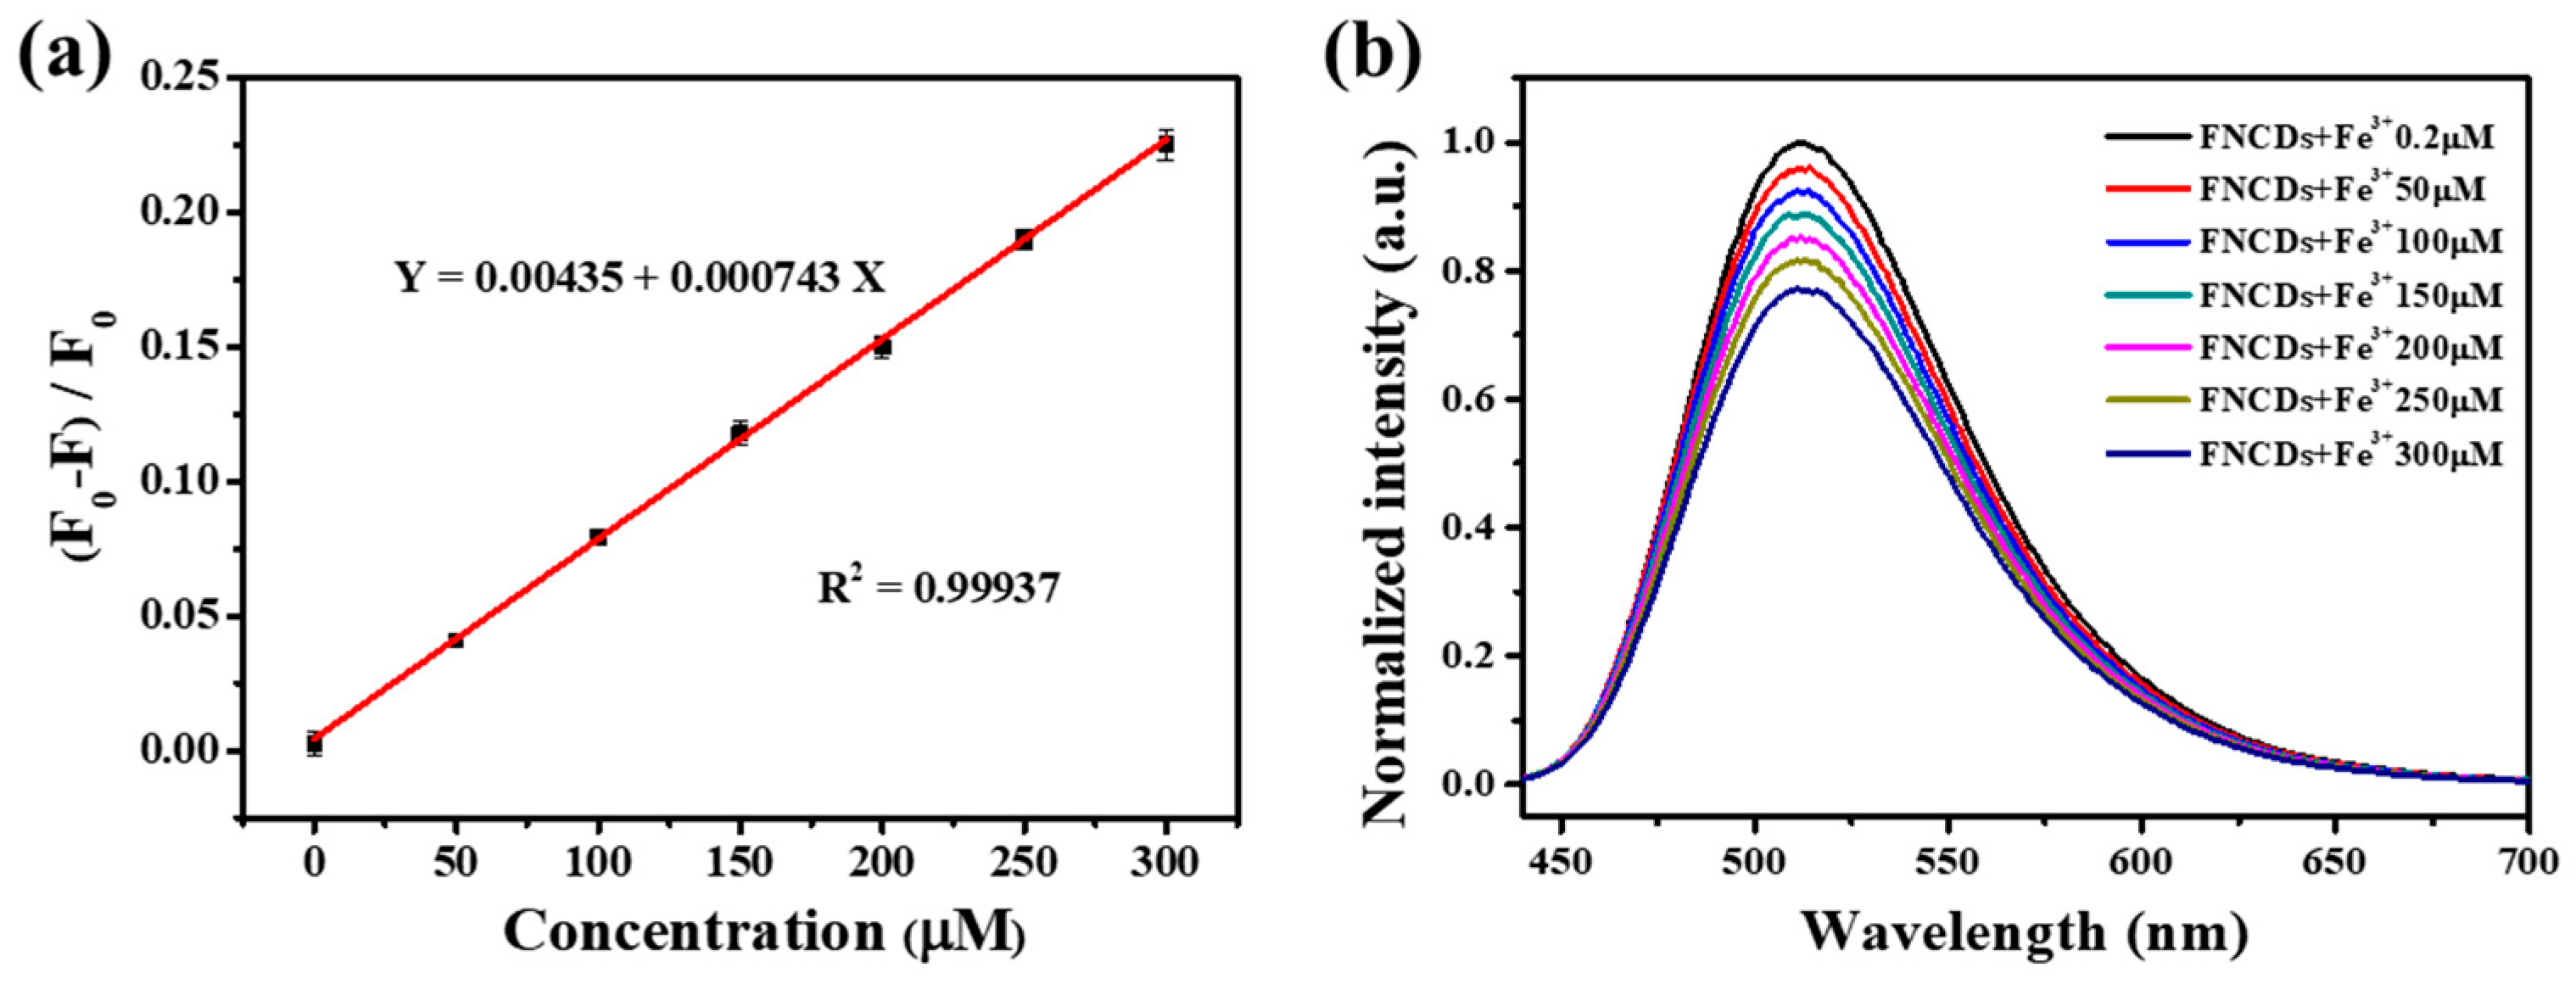
2.4. Quantitative Detection of Fe3+

A constant concentration of FNCDs and different known concentrations of Fe3+ were mixed. The emission intensity at 512 nm, upon excitation at 418 nm, was measured. The detection limit of FNCDs for Fe3+ was calculated using the detection limit formula proposed by the International Union of Pure and Applied Chemistry [20]:
L = 3σ/k
Here, k represents the slope of the fluorescence intensity vs. Fe3+ concentration plot, and σ represents the standard deviation of the background sample. The standard deviation represents the deviation in the fluorescence intensity of the background sample at 512 nm for 20 measurements.

2.5. Detection of Fe3+ in Different Water Samples

Laboratory water samples and dormitory water samples were used as solvents to prepare Fe3+ solutions of different concentrations. A fixed concentration of FNCDs was added to the water samples and the reaction was allowed to proceed for 2 min, following which the fluorescence intensity at 512 nm was measured. The fluorescence intensity was substituted into the fitting equation obtained from the fluorescence intensity vs. Fe3+ concentration plot to obtain the ion concentration in the samples. Each experiment was performed in more than three groups to obtain the standard deviation and recovery rate.

3. Results and Discussion

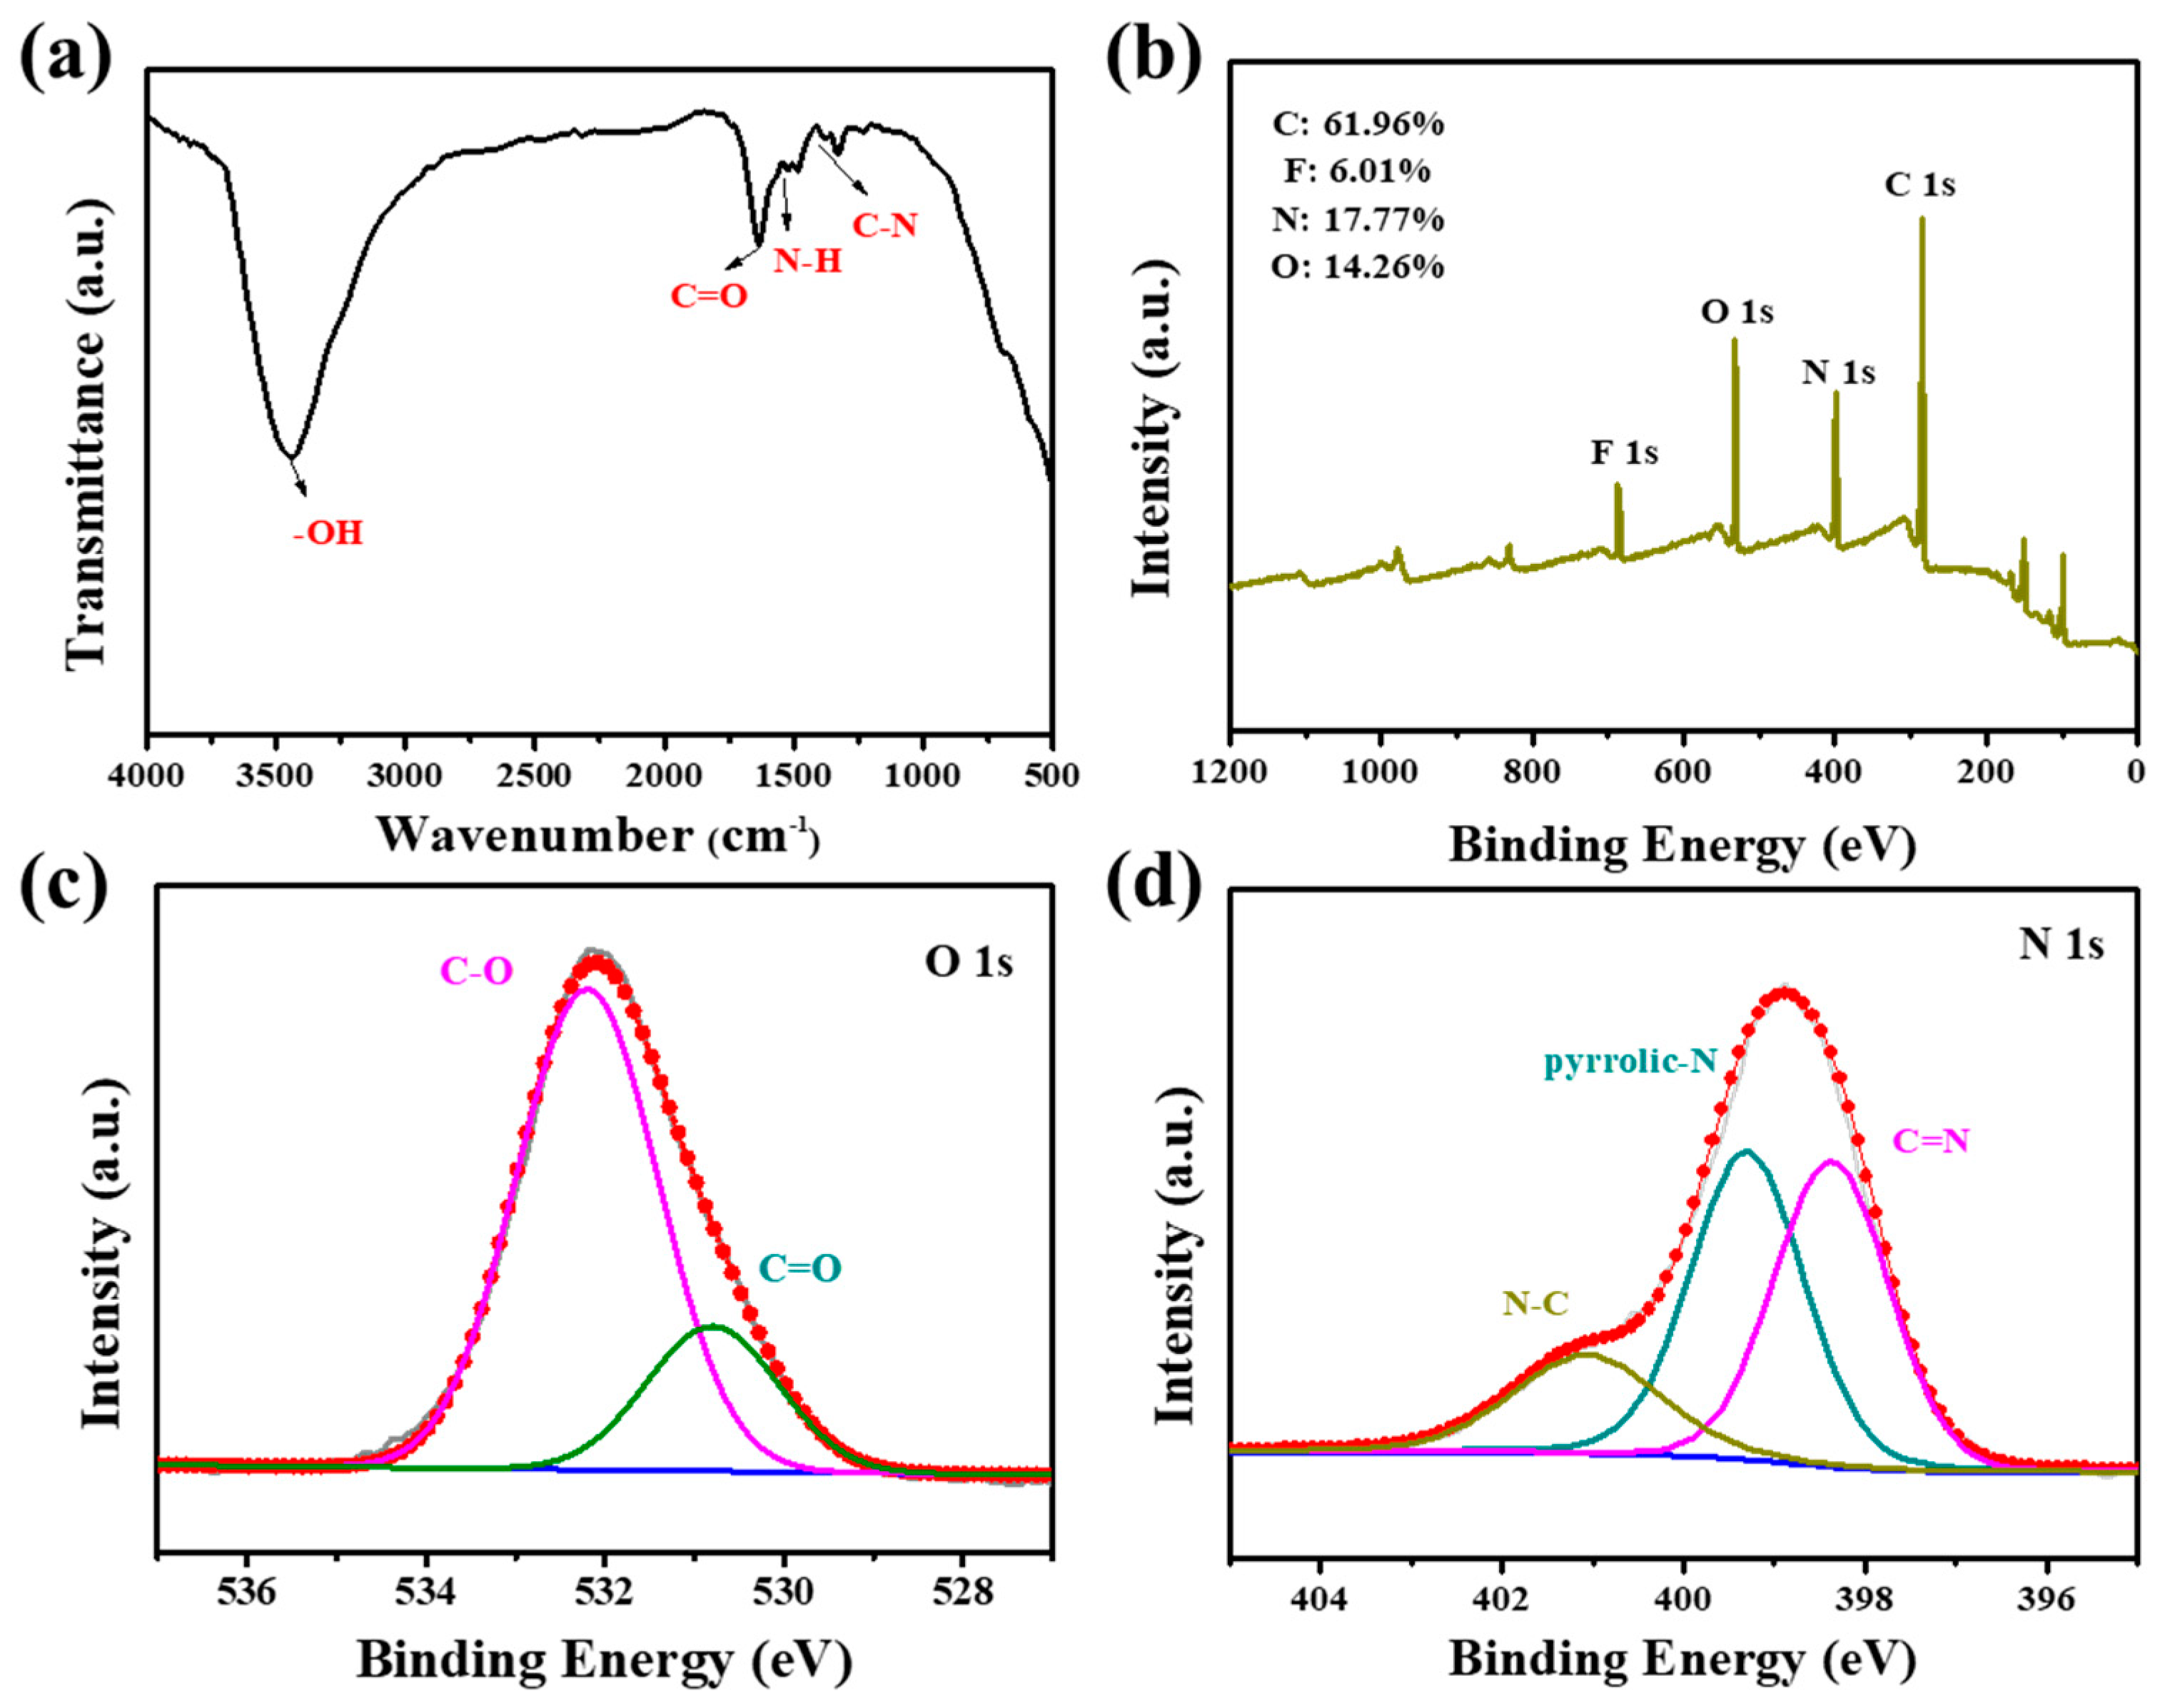
3.1. Characterization of FNCDs

4,5-difluoro-1,2 phenylenediamine and ethylenediamine form carbon dots through high-temperature condensation and carbonization (Scheme 1). The morphology and particle size distribution of the FNCDs were characterized using TEM. The TEM image (Figure 1a) and particle size distribution (Figure 1b) revealed that the FNCDs had a relatively uniform particle size distribution (2.35 ± 0.47 nm) and good dispersion.
The structure of the FNCDs was further characterized by FT-IR spectroscopy and XPS. The FT-IR spectrum showed a characteristic absorption peak of OH at 3450 cm−1. The peak at 1630 cm−1 can be attributed to the asymmetric C=O stretching vibration. The peaks at 1410 cm−1 correspond to the C–N stretching vibration. XPS was performed to analyze the chemical bonds and elemental composition. The C, O, N, and F contents in the synthesized FNCDs were 61.96%, 14.26%, 17.77%, and 6.01%, respectively (Figure 2b). The high-resolution C 1s XPS profile showed four peaks corresponding to C–C/C=C (284.7 eV), C–O/C–N (285.5 eV), C=O (286.7 eV), and C–F (288.6 eV), respectively (Figure S1a). Figure 2c shows the high-resolution O 1s spectra; the three peaks in this spectrum correspond to C=O (530.8 eV) and C–O (532.2 eV). The high-resolution N 1s spectrum showed peaks corresponding to C=N (398.3 eV), pyrrolic–N (399.3 eV), and N–C (401.1 eV). The peaks in the high-resolution F 1s spectrum can be ascribed to covalent C–F (687.1 eV) and semi-ionic C–F (685.0 eV) [21,22,23,24]. The FT-IR and XPS analyses confirmed that N and F were doped into the CDs and that many kinds of functional groups were produced.

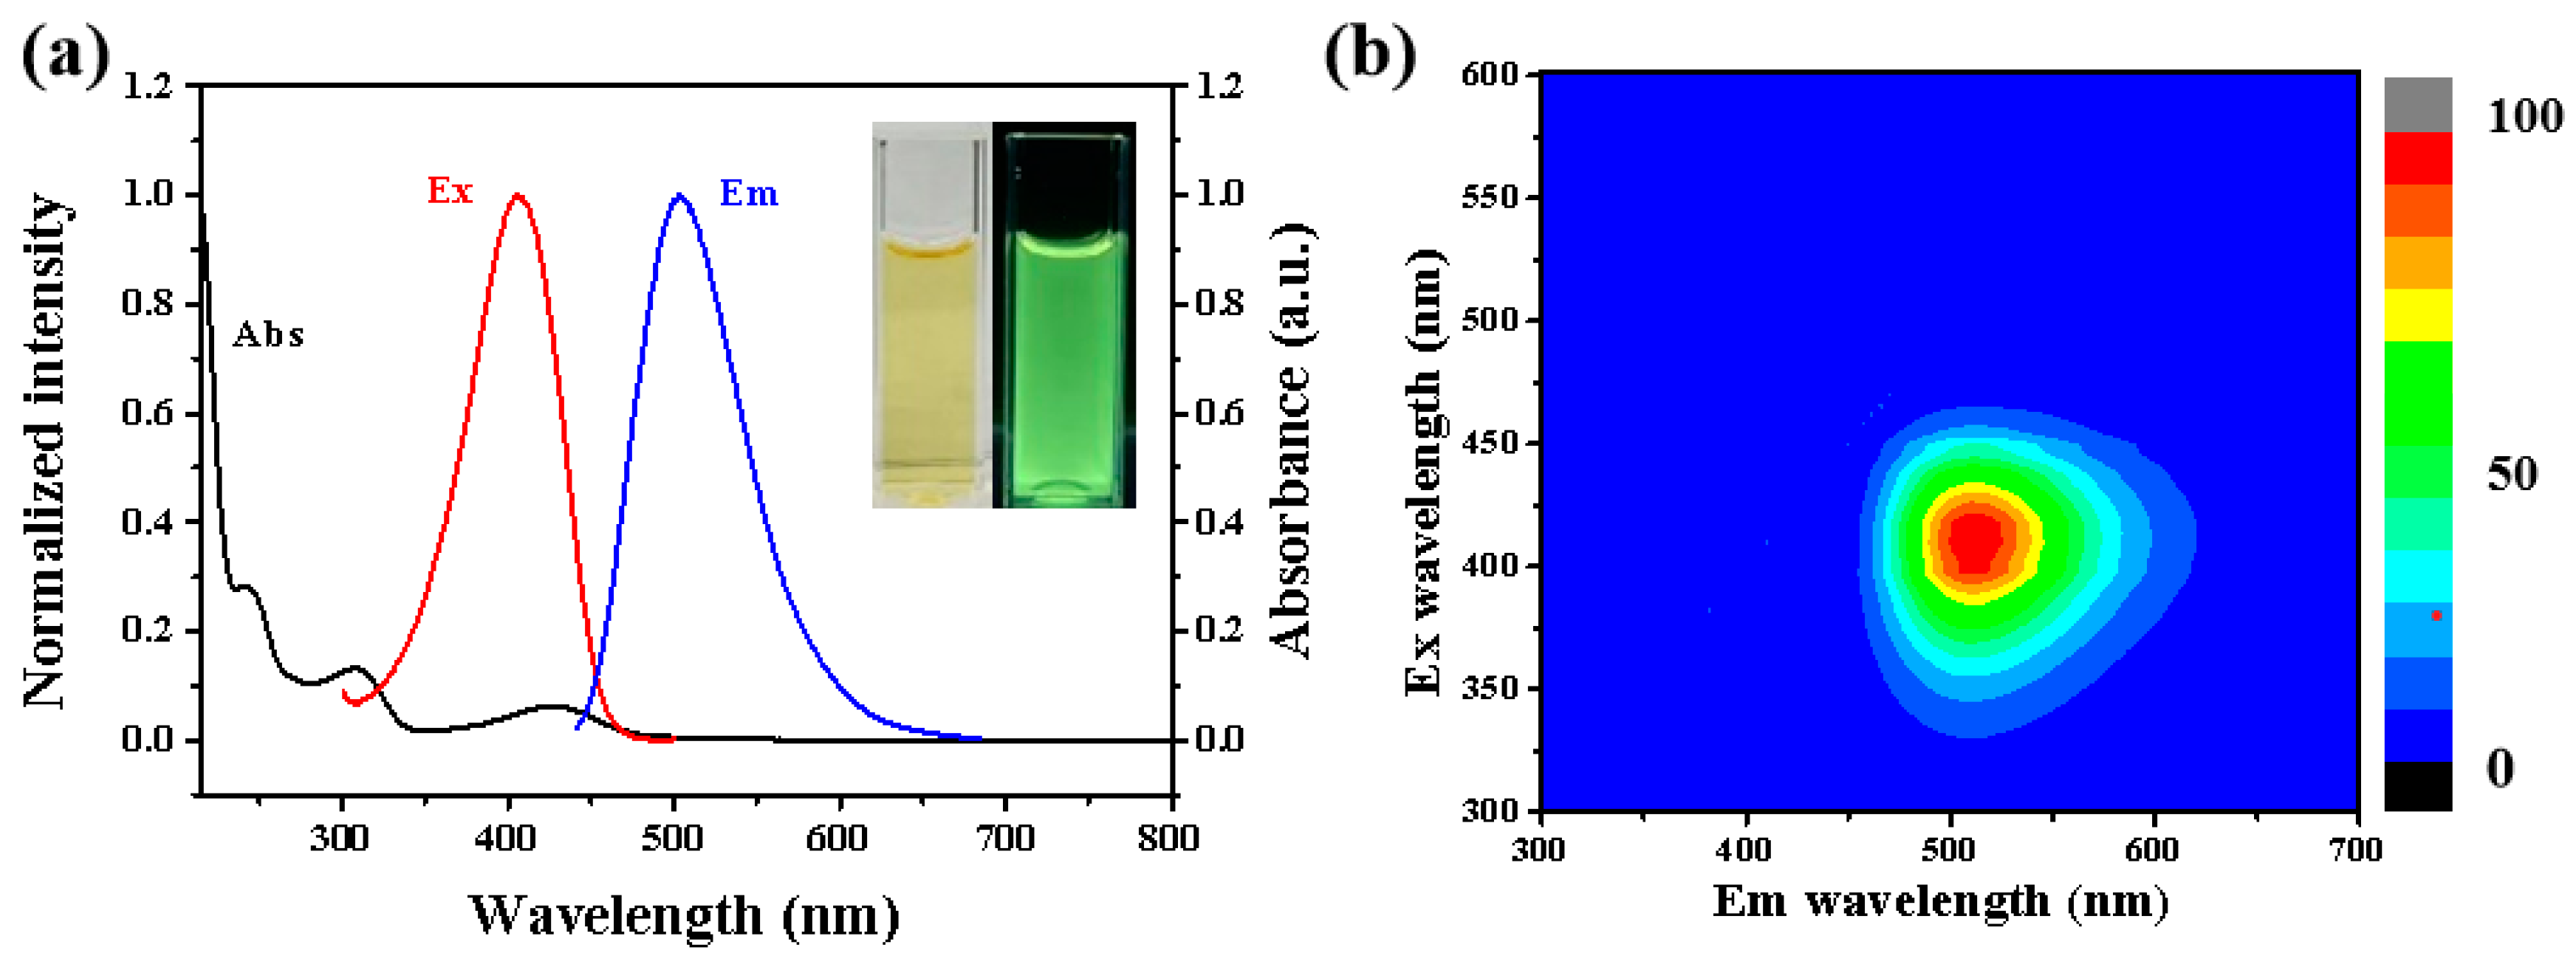
3.2. Optical Characterization

The optical properties of the FNCDs were also studied. As evident from Figure 3a, the FNCDs exhibit clear excitation and emission peaks at 418 and 512 nm, respectively. The 3D spectrum suggests that the FNCDs were excitation-independent CDs (Figure 3b). The absorption spectrum showed three peaks at 245, 313, and 420 nm, corresponding to the π-π* transition, n-π* transition, and bandgap absorption, respectively. By comparing the absorption peak and excitation peak, it can be seen that the luminescence mechanism of the CDs is obviously different from that of semiconductor quantum dots or organic small molecules. This is because the luminescence mechanism of the CDs is determined by both nuclear and surface states.
We next attempted to determine if the synthesized FNCDs were suitable for the detection of Fe3+ in environmental samples. The change in the fluorescence intensity of the FNCDs in solutions with different NaCl concentrations (Figure S2a) suggests that the FNCDs have strong salt resistance. The change in the fluorescence intensity of FNCDs upon irradiation at 365 nm for different durations was examined (Figure S2b). Although the fluorescence intensity gradually decreases upon irradiation for more than 20 min, the time required for an emission scan does not exceed 1 min. Therefore, the FNCDs are suitable for the detection of Fe3+ in environmental samples. The change in the fluorescence intensity of FNCDs at different pH levels suggests that these CDs are highly stable in the pH range of 2–11 (Figure S2c). Fortunately, the pH of most of the solutions tested was in the neutral range. However, for the quantitative detection of Fe3+, it is also necessary to measure the fluorescence intensity of FNCDs in Fe3+ solution at different reaction times (Figure S2d). The fluorescence intensity of FNCDs remained constant till ~5 min of reaction with Fe3+, suggesting that the FNCDs have good reaction sensitivity and stability. Thus, FNCDs have excellent stability in different environments, rendering them suitable for ion or molecule detection.

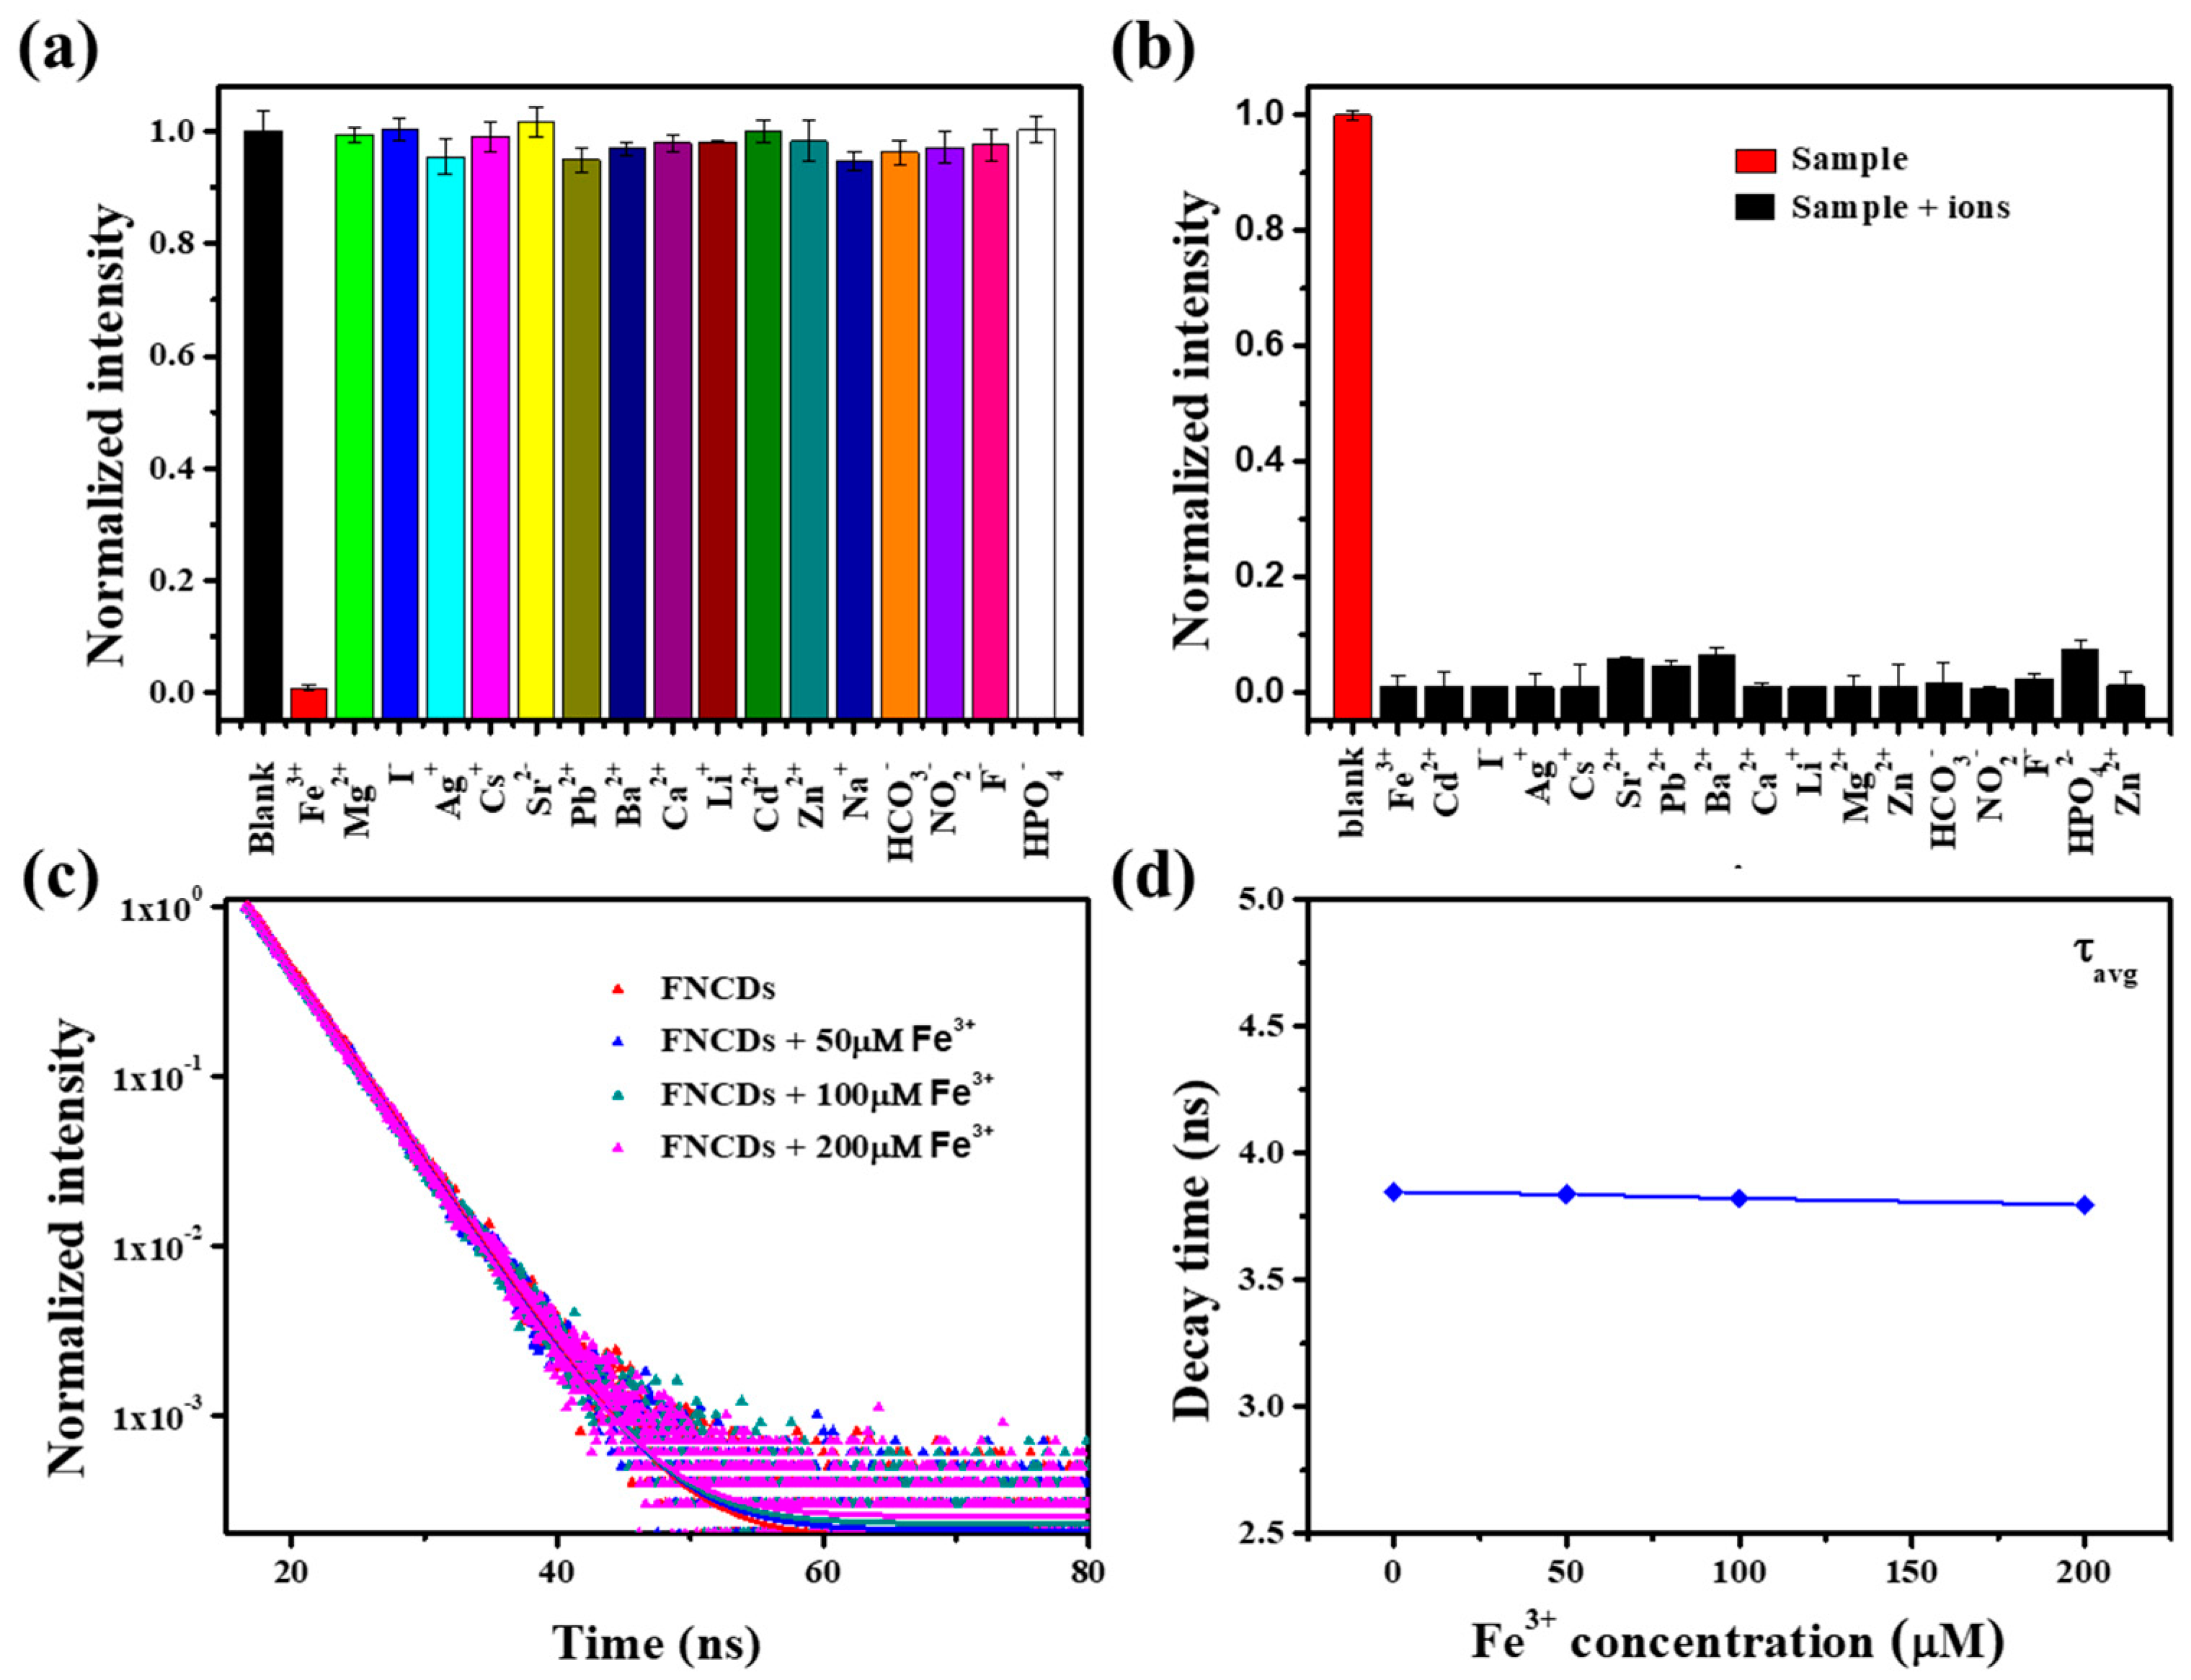
3.3. Selectivity of Fe3+

Figure 4a shows the changes in the fluorescence intensity of the FNCDs in the presence of different ions (1 mM). The fluorescence intensity decreased drastically in the presence of Fe3+, whereas it remained almost same as that of the blank sample in the presence of other ions. This suggested the high selectivity of the FNCDs toward Fe3+ ions. The addition of different ions into the FNCDs/Fe3+ reaction system did not change the fluorescence intensity significantly (Figure 4b), indicating the good anti-interference ability of FNCDs.
Common fluorescence quenching mechanisms include inner filter effect (IFE), fluorescence resonance energy transfer (FRET), and photoinduced electron transfer (PET). To investigate the fluorescence quenching mechanism of FNCDs, the absorption spectrum and fluorescence lifetime of Fe3+ and FNCDs were measured. FRET and PET change with the fluorescence lifetime. However, when the excitation and emission wavelength are 450 nm and 512 nm respectively, the fluorescence lifetimes of FNCDs at different Fe3+ concentrations (0–200 μM) remained almost unchanged (Figure 4c,d). So, the quenching mechanism is not FRET and PET. In addition, the absorption spectra of FNCDs and Fe3+ overlap in the 300–408 nm range (Figure S3). Although the degree of overlap is not as good as that at short wavelengths (270–310 nm), the higher excitation light energy of the FNCDs will be absorbed with an increase in the Fe3+ concentration. The trend in the lifetime and the absorption spectra indicate static fluorescence quenching by the inner filter effect [25]. Consequently, the relationship between the fluorescence intensity of FNCDs and the concentration of Fe3+ was studied (Figure 5). Figure 5b shows that the fluorescence intensity of the FNCDs decreased linearly with increasing Fe3+ concentration. The plot could be fitted to the equation
Y = 0.00435 + 0.000743   X
where X represents the concentration of Fe3+ and Y = (F0 − F)/F0. F0 represents the fluorescence intensity at [Fe3+] = 0, and F represents the fluorescence intensity at different Fe3+ concentrations. The correlation coefficient (R2) of the equation was 0.99937, suggesting a strong linear relationship between the fluorescence intensity and Fe3+ concentration in the range of 0.2–300 μM (Figure 5a). The detection limit and detection range were 0.08 μM and 0.2–300 μM, respectively. This detection range is wider than those of the previously reported fluorescent CDs for Fe3+ detection (Table S1).
Our results suggest that the synthesized FNCDs are a high-quality probe for Fe3+ detection. To determine the practical applicability of the FNCDs for Fe3+ detection in environmental samples, the Fe3+ concentration in laboratory water samples and dormitory water samples was analyzed by the standard addition recovery method. The results are presented in Table 1. Briefly, 40, 80, and 120 μM Fe3+ solutions were added to the laboratory water samples and dormitory water samples. The standard addition recoveries ranged from 95.8 to 97.7% and 93.6 to 107.5%, and the relative standard deviations were 0.6–1.0% and 0.3–1.1%, respectively. The recovery from the spiked samples was not higher than 107.5%, and the relative standard deviation was not higher than 1.1%. The good recovery and accuracy of FNCDs suggest their broad application prospect for Fe3+ detection in different water samples.

4. Conclusions

In general, green fluorescent FNCDs were synthesized by a hydrothermal method using 4, 5-difluoro-o-phenylenediamine and ethylenediamine. Owing to their excellent photostability, salt resistance, pH stability, Fe3+ selectivity, and anti-interference ability, FNCDs can be used to quantitatively detect Fe3+ in different water samples. The detection limit and detection range were 0.08 μM and 0.2–300 μM, respectively. When FNCDs were used to detect Fe3+ in dormitory water and laboratory water samples, the recovery and relative standard deviation were not higher than 107.5% and 1.1%, respectively. Compared with other carbon dots for Fe3+ detection in actual water samples, FNCDs have a better detection range or detection limit. The detection results in actual water samples show that FNCDs have excellent anti-interference ability. FNCDs also has broad application prospects for Fe3+ detection of other water samples. However, the detection limit of FNCDs is still relatively high, which limits the detection of FNCDs given trace Fe3+. If FNCDs can detect the Fe3+ of a cell, FNCDs are expected to have important applications in the research of Fe3+ diseases.

Supplementary Materials

The following supporting information can be downloaded at: https://www.mdpi.com/article/10.3390/nano12091487/s1, Figure S1: High-resolution (a) C 1s and (b) F 1s of XPS spectra; Figure S2: FNCDs fluorescence intensity at (a) different NaCl concentration, (b) different light time, (c) dif-ferent pH and (d) different reaction time at 1mM Fe3+ concentration; Figure S3: Absorption spectra of Fe3+ (blue line), NFCDs (red line), and NFCDs quenched by Fe3+ (black line); Table S1: Fe3+ detection ability of different fluorescent CDs. References [26,27,28,29,30] are cited in the Supplementary Materials.

Author Contributions

Conceptualization, M.Z. and J.G.; methodology, S.Y.; software, S.Y.; validation, J.G. and H.L.; formal analysis, S.Y. and M.Z.; investigation, P.Z. and Y.C.; resources, S.Y., J.S., J.Q., J.G. and H.L.; data curation, J.S. and J.Q.; writing—original draft preparation, S.Y. and M.Z.; writing—review and editing, M.Z., J.G., Y.C. and H.L.; visualization, S.Y. and M.Z.; supervision, J.S., J.Q.; project administration, P.Z.; funding acquisition, S.Y., J.S., J.Q., J.G. and H.L. All authors have read and agreed to the published version of the manuscript.

Funding

This work was partially supported by National Natural Science Foundation of China (61620106016/61835009/62175161/61775145/61975132); China Postdoctoral Science Foundation (No. 2021M702240); Shenzhen Basic Research Program (JCYJ20210324095810028/JCYJ20210324095613036).

Institutional Review Board Statement

Not applicable.

Informed Consent Statement

Not applicable.

Data Availability Statement

The data presented in this study are available on request from the corresponding author.

Conflicts of Interest

The authors declare no conflict of interest.

References

  1. Yang, X.; Zhuo, Y.; Zhu, S.; Luo, Y.; Feng, Y.; Dou, Y. Novel and green synthesis of high-fluorescent carbon dots originated from honey for sensing and imaging. Biosens. Bioelectron. 2014, 60, 292–298. [Google Scholar] [CrossRef]
  2. Xu, J.; Miao, Y.; Zheng, J.; Yang, Y.; Liu, X. Ultrahigh Brightness Carbon Dot–Based Blue Electroluminescent LEDs by Host–Guest Energy Transfer Emission Mechanism. Adv. Opt. Mater. 2018, 6, 1800181. [Google Scholar] [CrossRef]
  3. Bai, Y.; Zhao, J.; Wang, S.; Lin, T.; Ye, F.; Zhao, S. Carbon Dots with Absorption Red-Shifting for Two-Photon Fluorescence Imaging of Tumor Tissue pH and Synergistic Phototherapy. ACS Appl. Mater. Interfaces 2021, 13, 35365–35375. [Google Scholar] [CrossRef]
  4. Wang, B.-B.; Wang, Y.-Y.; Zhang, X.-Y.; Xu, Z.-Q.; Jiang, P.; Jiang, F.-L.; Liu, Y. Bifunctional carbon dots for cell imaging and inhibition of human insulin fibrillation in the whole aggregation process. Int. J. Biol. Macromol. 2020, 147, 453–462. [Google Scholar] [CrossRef]
  5. Das, P.; Ganguly, S.; Mondal, S.; Ghorai, U.K.; Maity, P.P.; Choudhary, S.; Gangopadhyay, S.; Dhara, S.; Banerjee, S.; Das, N.C. Dual doped biocompatible multicolor luminescent carbon dots for bio labeling, UV-active marker and fluorescent polymer composite. Luminescence 2018, 33, 1136–1145. [Google Scholar] [CrossRef]
  6. Kang, Z.; Lee, S.-T. Carbon dots: Advances in nanocarbon applications. Nanoscale 2019, 11, 19214–19224. [Google Scholar] [CrossRef]
  7. Castro, R.C.; Soares, J.X.; Ribeiro, D.S.M.; Santos, J.L.M. Dual-emission ratiometric probe combining carbon dots and CdTe quantum dots for fluorometric and visual determination of H2O2. Sens. Actuators B Chem. 2019, 296, 126665. [Google Scholar] [CrossRef]
  8. Wang, Y.; Lao, S.; Ding, W.; Zhang, Z.; Liu, S. A novel ratiometric fluorescent probe for detection of iron ions and zinc ions based on dual-emission carbon dots. Sens. Actuators B Chem. 2019, 284, 186–192. [Google Scholar] [CrossRef]
  9. Deng, Y.; Zhou, Y.; Li, Q.; Qian, J. One-step hydrothermal synthesis of nitrogen-doped carbon dots for high-sensitivity visual detection of nitrite and ascorbic acid. Anal. Methods 2021, 13, 3685–3692. [Google Scholar] [CrossRef]
  10. Das, P.; Ganguly, S.; Margel, S.; Gedanken, A. Tailor made magnetic nanolights: Fabrication to cancer theranostics applications. Nanoscale Adv. 2021, 3, 6762–6796. [Google Scholar] [CrossRef]
  11. Halliwell, B. Reactive Oxygen Species and the Central Nervous System. J. Neurochem. 1992, 59, 1609–1623. [Google Scholar] [CrossRef] [PubMed]
  12. Swaminathan, S.; Fonseca, V.A.; Alam, M.G.; Shah, S.V. The Role of Iron in Diabetes and Its Complications. Diabetes Care 2007, 30, 1926–1933. [Google Scholar] [CrossRef] [Green Version]
  13. Galaris, D.; Skiada, V.; Barbouti, A. Redox signaling and cancer: The role of “labile” iron. Cancer Lett. 2008, 266, 21–29. [Google Scholar] [CrossRef]
  14. Witte, D.L.; Crosby, W.H.; Edwards, C.Q.; Fairbanks, V.F.; Mitros, F.A. Hereditary hemochromatosis. Clin. Chim. Acta 1996, 245, 139–200. [Google Scholar] [CrossRef]
  15. Kehrer, J.P. The Haber–Weiss reaction and mechanisms of toxicity. Toxicology 2000, 149, 43–50. [Google Scholar] [CrossRef]
  16. Ge, G.; Li, L.; Chen, M.; Wu, X.; Yang, Y.; Wang, D.; Zuo, S.; Zeng, Z.; Xiong, W.; Guo, C. Green Synthesis of Nitrogen–Doped Carbon Dots from Fresh Tea Leaves for Selective Fe3+ Ions Detection and Cellular Imaging. Nanomaterials 2022, 12, 986. [Google Scholar] [CrossRef]
  17. Chen, Y.; Sun, X.; Pan, W.; Yu, G.; Wang, J. Fe3+-Sensitive Carbon Dots for Detection of Fe3+ in Aqueous Solution and Intracellular Imaging of Fe3+ Inside Fungal Cells. Front. Chem. 2020, 7, 911. [Google Scholar] [CrossRef]
  18. Zulfajri, M.; Gedda, G.; Chang, C.-J.; Chang, Y.-P.; Huang, G.G. Cranberry Beans Derived Carbon Dots as a Potential Fluorescence Sensor for Selective Detection of Fe3+ Ions in Aqueous Solution. ACS Omega 2019, 4, 15382–15392. [Google Scholar] [CrossRef] [Green Version]
  19. Phan, L.M.; Hoang, T.X.; Cho, S. Fluorescent Carbon Dots for Sensitive and Rapid Monitoring of Intracellular Ferrous Ion. Biosensors 2022, 12, 41. [Google Scholar] [CrossRef]
  20. Yan, F.; Zhang, H.; Yu, N.; Sun, Z.; Chen, L. Conjugate area-controlled synthesis of multiple-color carbon dots and application in sensors and optoelectronic devices. Sens. Actuators B Chem. 2021, 329, 129263. [Google Scholar] [CrossRef]
  21. Guo, J.; Ye, S.; Li, H.; Song, J.; Qu, J. Novel fluorescence probe based on bright emitted carbon dots for ClO detection in real water samples and living cells. Spectrochim. Acta Part A Mol. Biomol. Spectrosc. 2020, 240, 118592. [Google Scholar] [CrossRef]
  22. Luo, J.; Wang, K.; Hua, X.; Wang, W.; Li, J.; Zhang, S.; Chen, S. Pyridinic-N Protected Synthesis of 3D Nitrogen-Doped Porous Carbon with Increased Mesoporous Defects for Oxygen Reduction. Small 2019, 15, 1805325. [Google Scholar] [CrossRef] [PubMed]
  23. Jiang, L.; Ding, H.; Lu, S.; Geng, T.; Xiao, G.; Zou, B.; Bi, H. Photoactivated Fluorescence Enhancement in F,N-Doped Carbon Dots with Piezochromic Behavior. Angew. Chem. Int. Ed. 2020, 59, 9986–9991. [Google Scholar] [CrossRef] [PubMed]
  24. Long, P.; Feng, Y.; Cao, C.; Li, Y.; Han, J.; Li, S.; Peng, C.; Li, Z.; Feng, W. Self-Protective Room-Temperature Phosphorescence of Fluorine and Nitrogen Codoped Carbon Dots. Adv. Funct. Mater. 2018, 28, 1800791. [Google Scholar] [CrossRef]
  25. Li, C.-L.; Ou, C.-M.; Huang, C.-C.; Wu, W.-C.; Chen, Y.-P.; Lin, T.-E.; Ho, L.-C.; Wang, C.-W.; Shih, C.-C.; Zhou, H.-C.; et al. Carbon dots prepared from ginger exhibiting efficient inhibition of human hepatocellular carcinoma cells. J. Mater. Chem. B 2014, 2, 4564–4571. [Google Scholar] [CrossRef] [PubMed]
  26. Pang, S.; Liu, S. Dual-emission carbon dots for ratiometric detection of Fe3+ ions and acid phosphatase. Anal. Chim. Acta 2020, 1105, 155–161. [Google Scholar] [CrossRef] [PubMed]
  27. Senol, A.M.; Bozkurt, E. Facile green and one-pot synthesis of seville orange derived carbon dots as a fluorescent sensor for Fe3+ ions. Microchem. J. 2020, 159, 105357. [Google Scholar] [CrossRef]
  28. Desai, M.L.; Basu, H.; Saha, S.; Singhal, R.K.; Kailasa, S.K. Investigation of silicon doping into carbon dots for improved fluorescence properties for selective detection of Fe3+ ion. Opt. Mater. 2019, 96, 109374. [Google Scholar] [CrossRef]
  29. Wang, C.; Shi, H.; Yang, M.; Yan, Y.; Liu, E.; Ji, Z.; Fan, J. Facile synthesis of novel carbon quantum dots from biomass waste for highly sensitive detection of iron ions. Mater. Res. Bull. 2020, 124, 110730. [Google Scholar] [CrossRef]
  30. Wu, H.; Pang, L.-F.; Fu, M.-J.; Guo, X.-F.; Wang, H. Boron and nitrogen codoped carbon dots as fluorescence sensor for Fe3+ with improved selectivity. J. Pharm. Biomed. Anal. 2020, 180, 113052. [Google Scholar] [CrossRef]
Scheme 1. One-pot hydrothermal synthesis of green fluorescent FNCDs.
Nanomaterials 12 01487 sch001
Figure 1. (a) TEM image and (b) particle size distribution histogram of FNCDs.
Nanomaterials 12 01487 g001
Figure 2. (a) FT-IR spectra and (b) XPS survey spectra of FNCDs. Corresponding high-resolution (c) O 1s and (d) N 1s XPS profiles.
Nanomaterials 12 01487 g002
Figure 3. (a) Absorption (black), excitation (red), and emission (blue) spectra of the FNCDs. Inset: images of the N-CDs solution under visible light (left) and 365 nm UV light (right). (b) 3D fluorescence spectrum of the FNCDs (the colors from blue to red represent the fluorescence intensity from weak to strong).
Nanomaterials 12 01487 g003
Figure 4. (a) Fluorescence intensity of FNCDs in the presence of different ions. (b) Change in the fluorescence intensity after adding different ions to the FNCDs/Fe3+ reaction system. (c) Fluorescence lifetime spectra of FNCDs and FNCDs with different concentrations Fe3+ (excitation and emission wavelengths: 450 and 512 nm). (d) The fluorescence lifetime of FNCDs after adding different concentrations of Fe3+.
Nanomaterials 12 01487 g004
Figure 5. (a) Linear fitting of the relative fluorescence vs. concentration plot and (b) emission spectra of the FNCDs at various Fe3+ concentrations (from top to bottom: 0.2, 50, 100, 150, 200, 250, 300 μM).
Nanomaterials 12 01487 g005
Table 1. Recovery of Fe3+ in actual water samples.
SamplesDetection Amount (μM)Adding Fe3+ (μM)Found Fe3+ (μM)Recovery (%)RSD (n = 3, %)
Laboratory water-4039.0897.71.0
8077.8597.30.7
120114.9695.80.6
Dormitory water-4037.4393.60.3
8086.00107.50.6
120125.69104.71.1
Publisher’s Note: MDPI stays neutral with regard to jurisdictional claims in published maps and institutional affiliations.

