
Aptamer-Adjusted Carbon Dot Catalysis-Silver Nanosol SERS Spectrometry for Bisphenol A Detection


Abstract
:1. Introduction
2. Results and Discussion
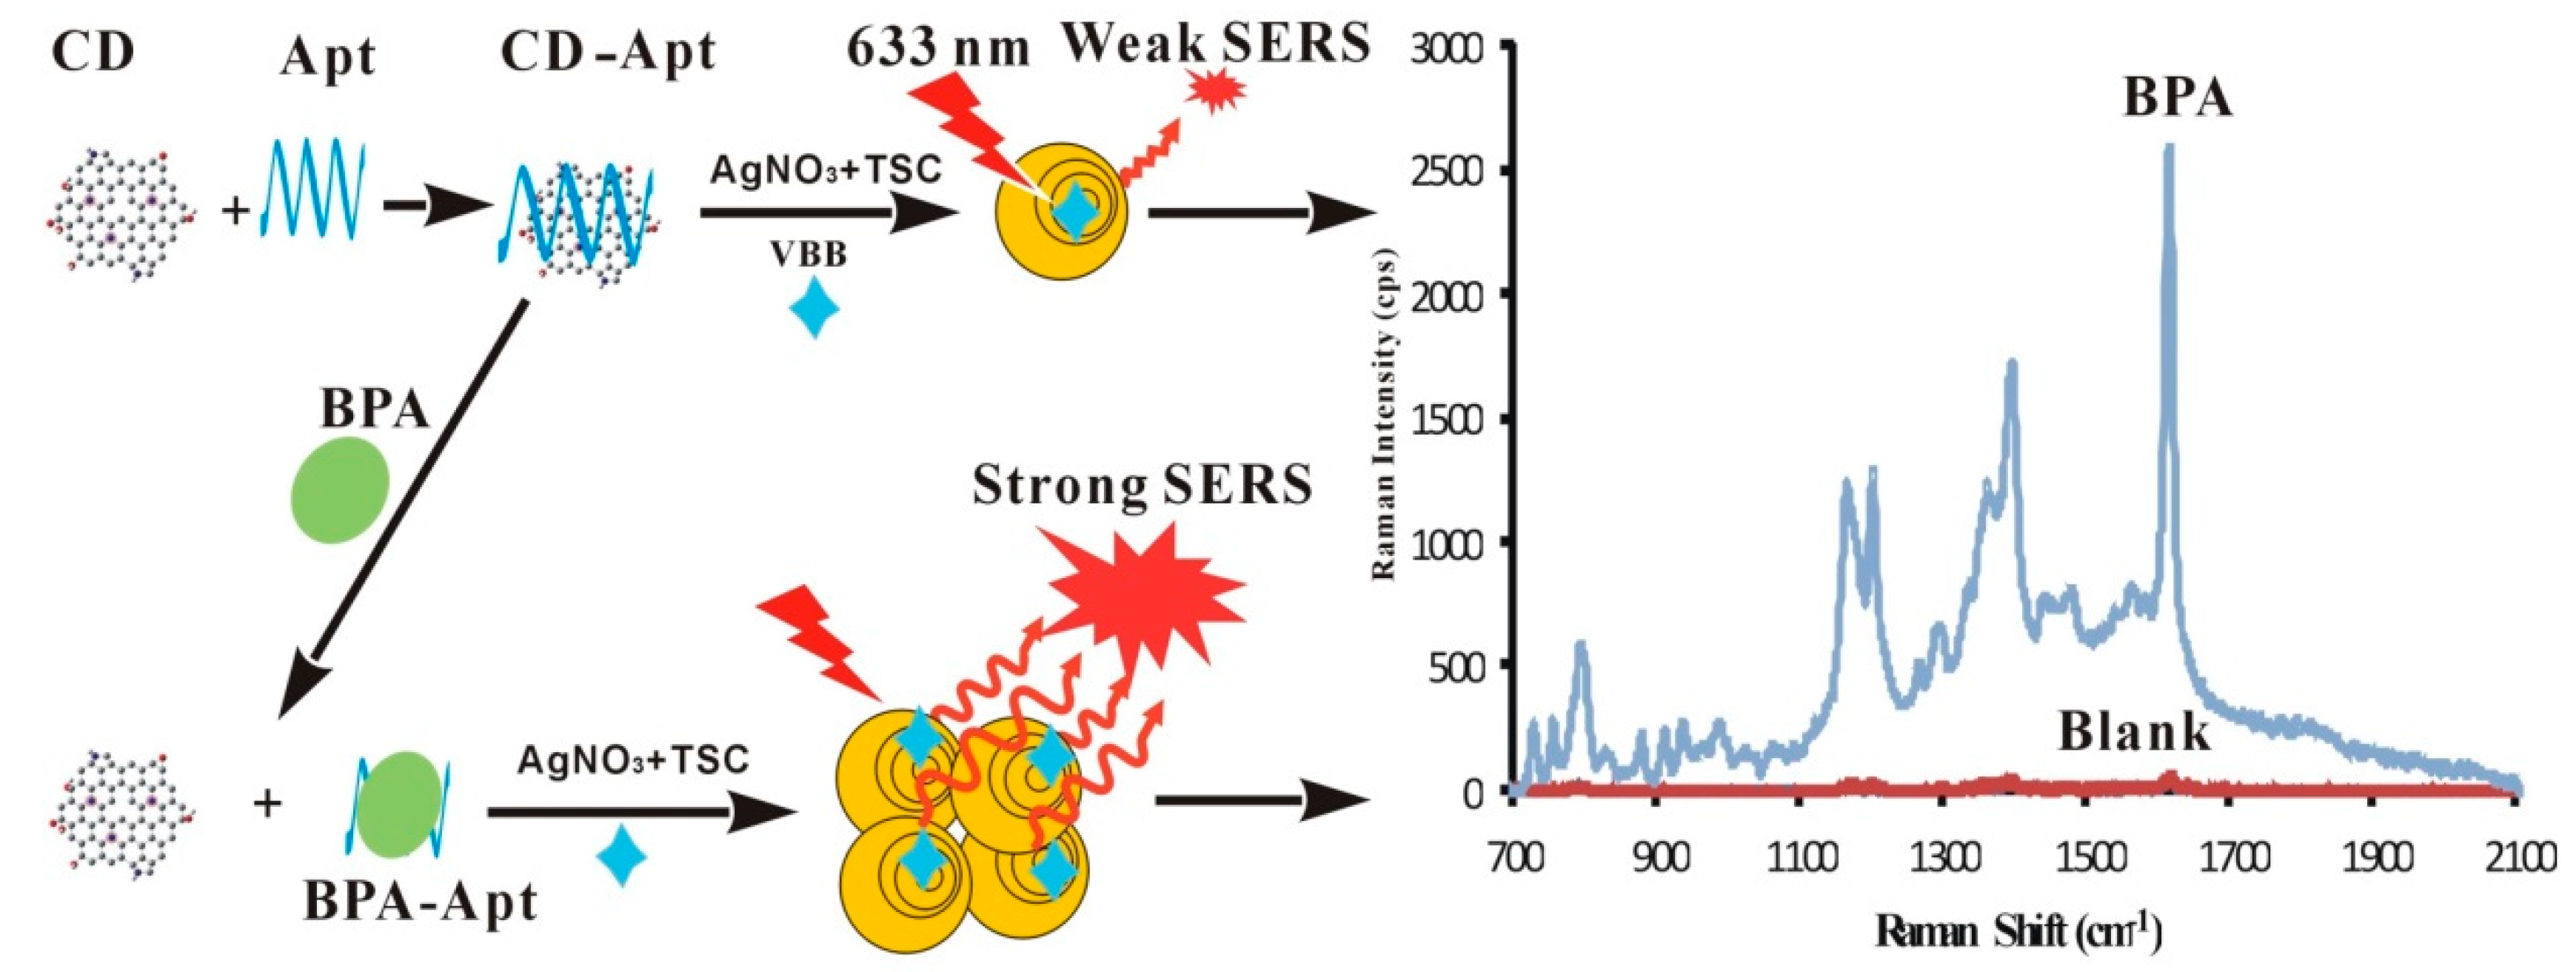
2.1. Principle
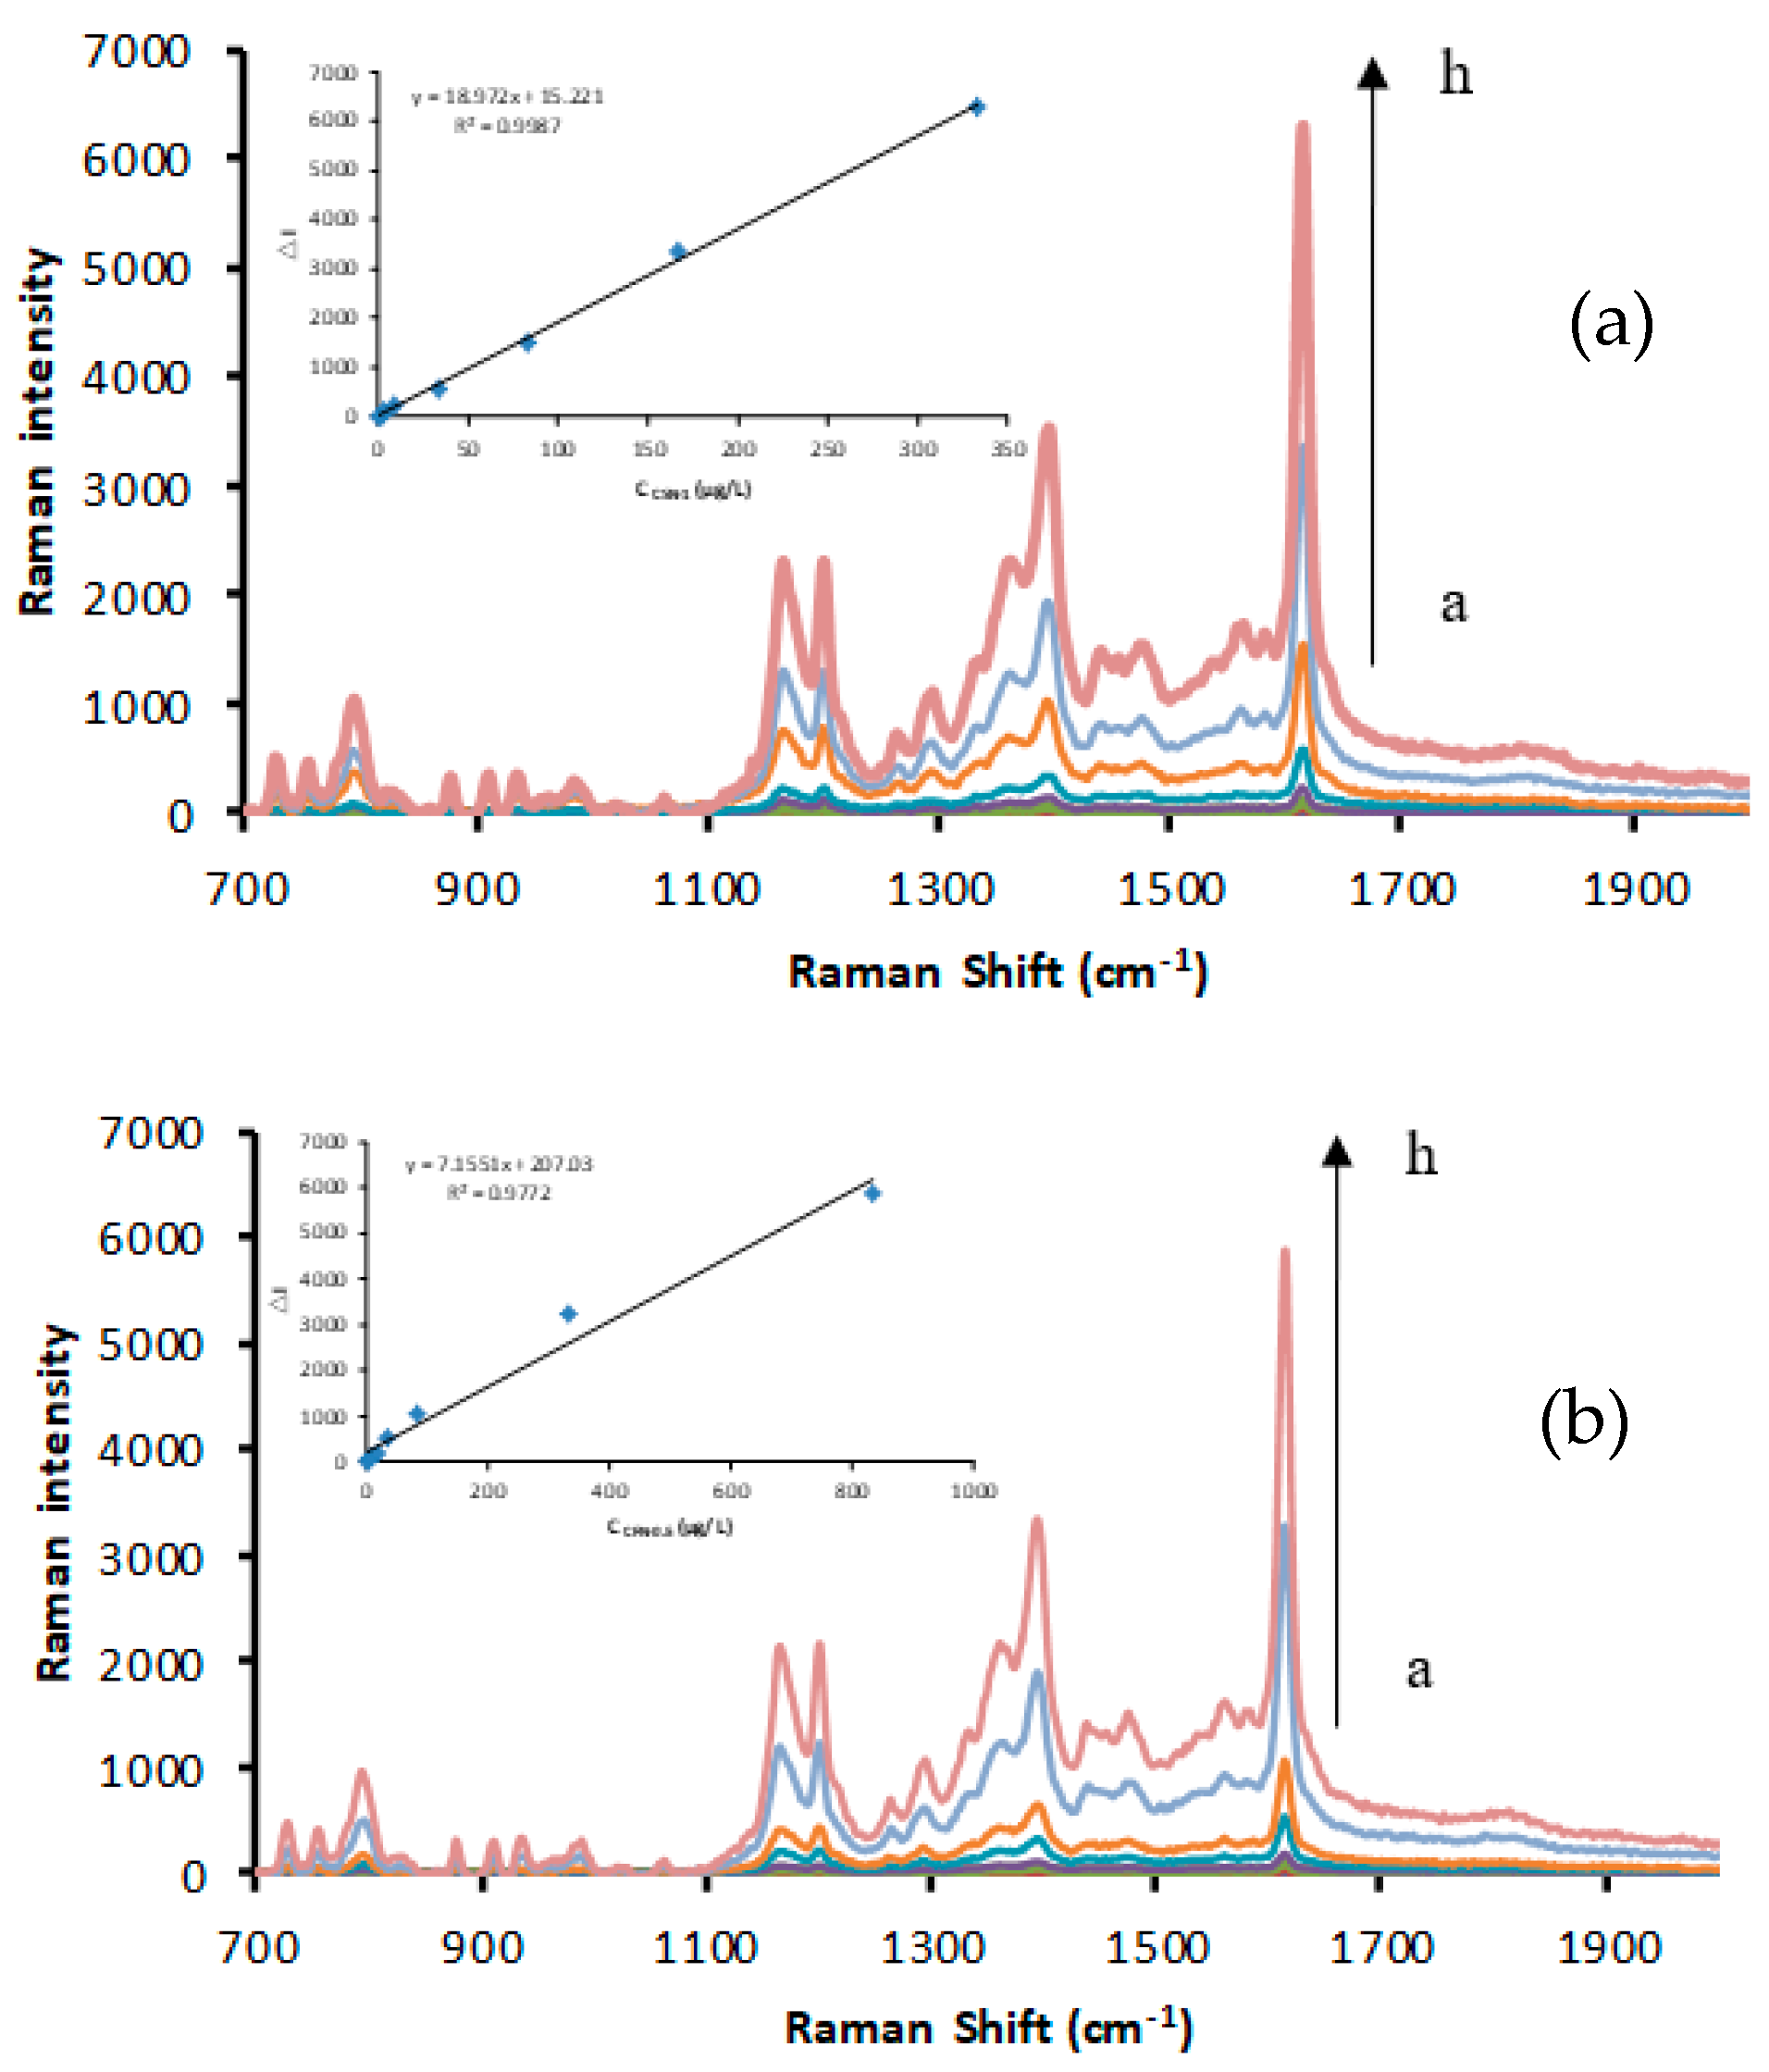
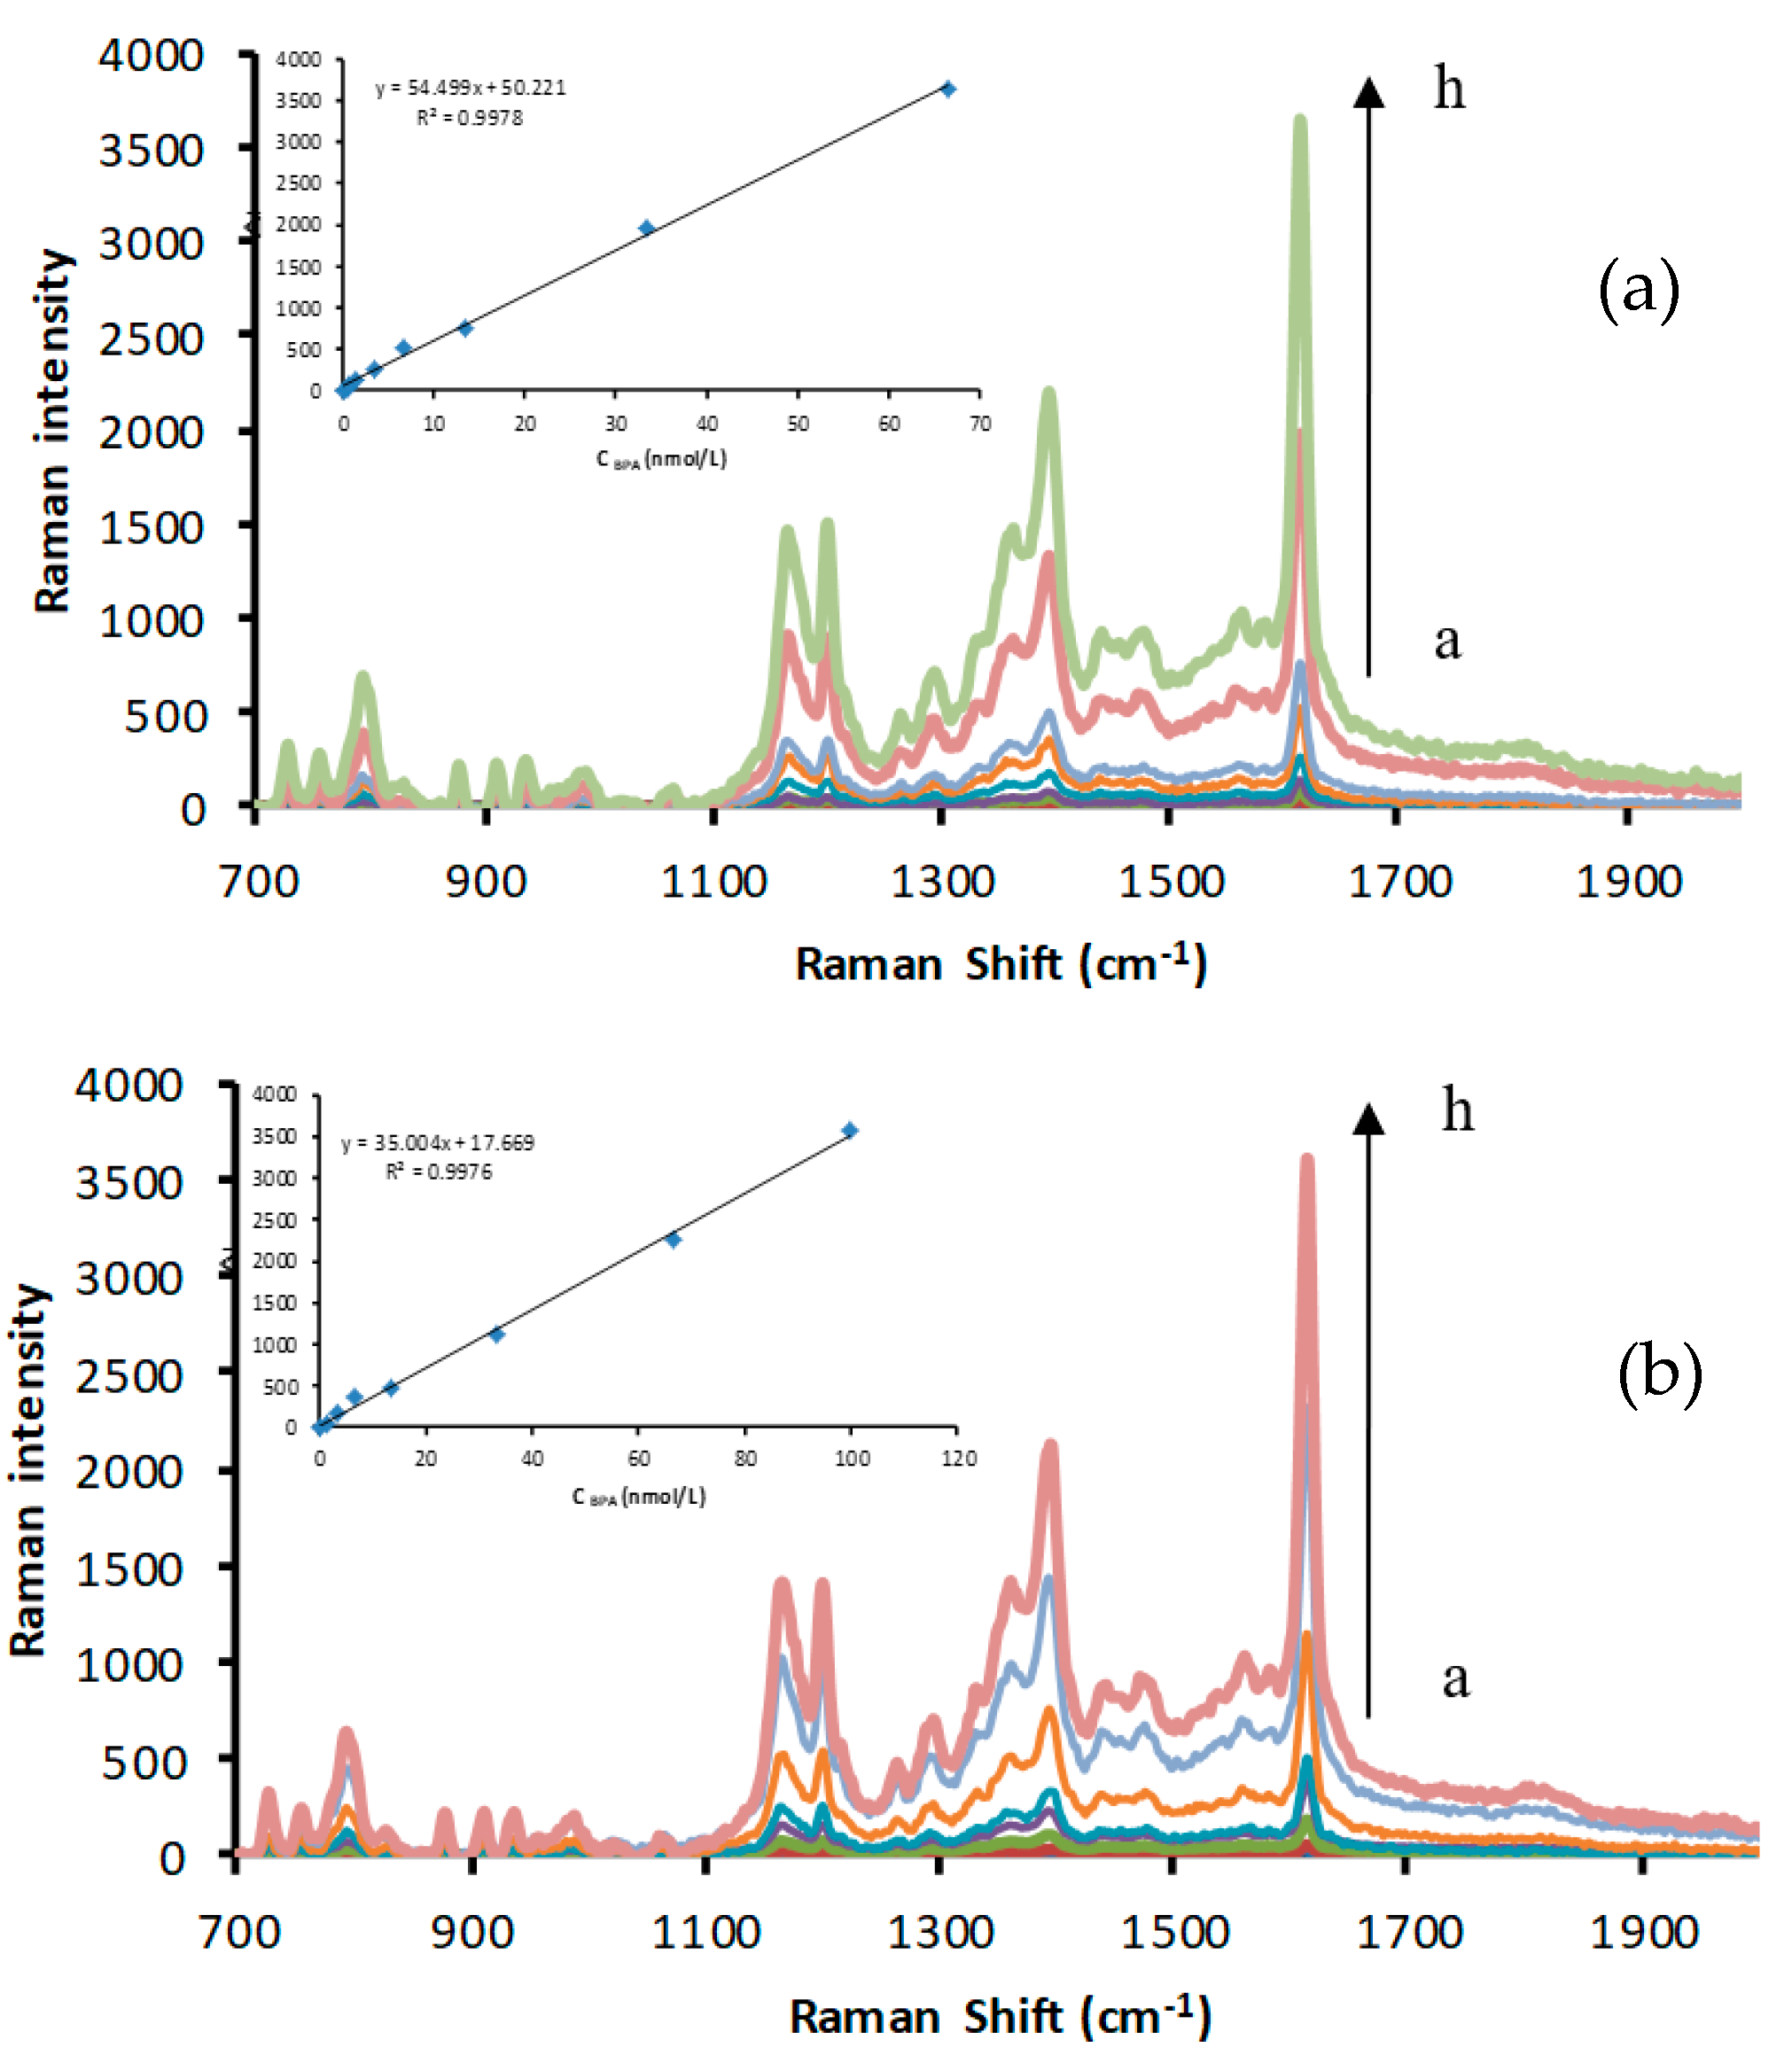
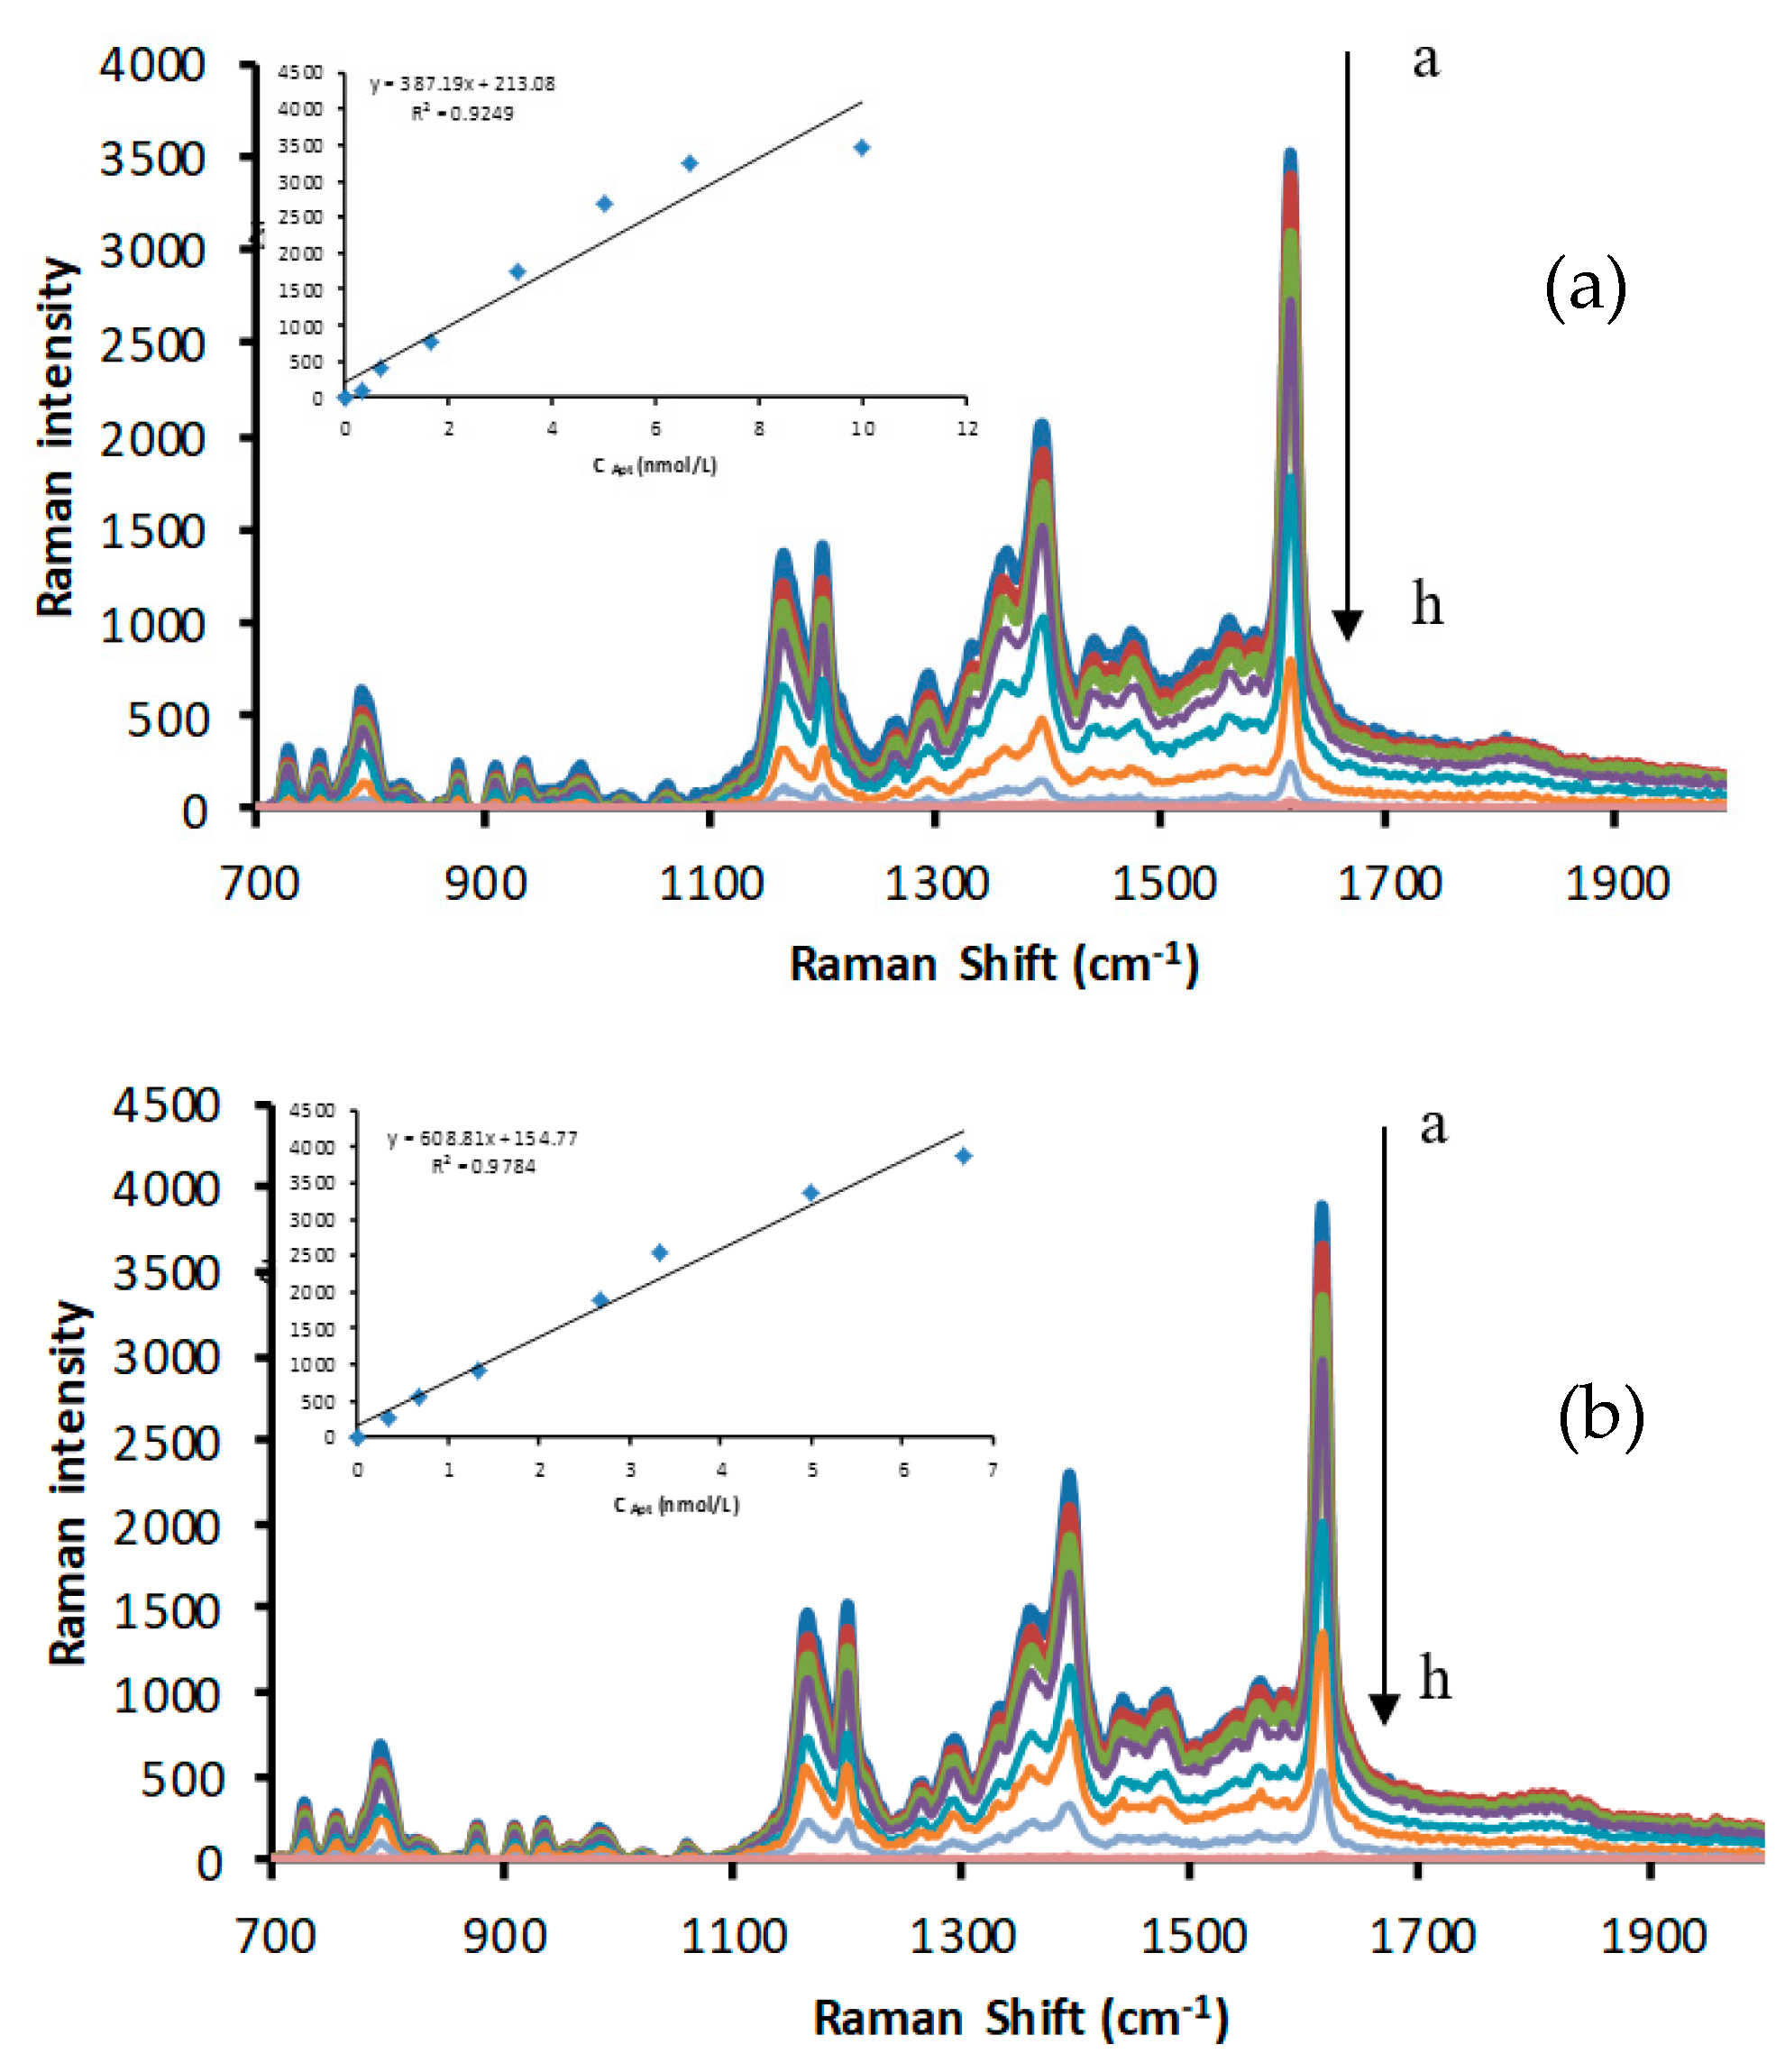
2.2. SERS Spectra
2.3. The Catalytic Effect of CDs and the Inhibition of the Apt
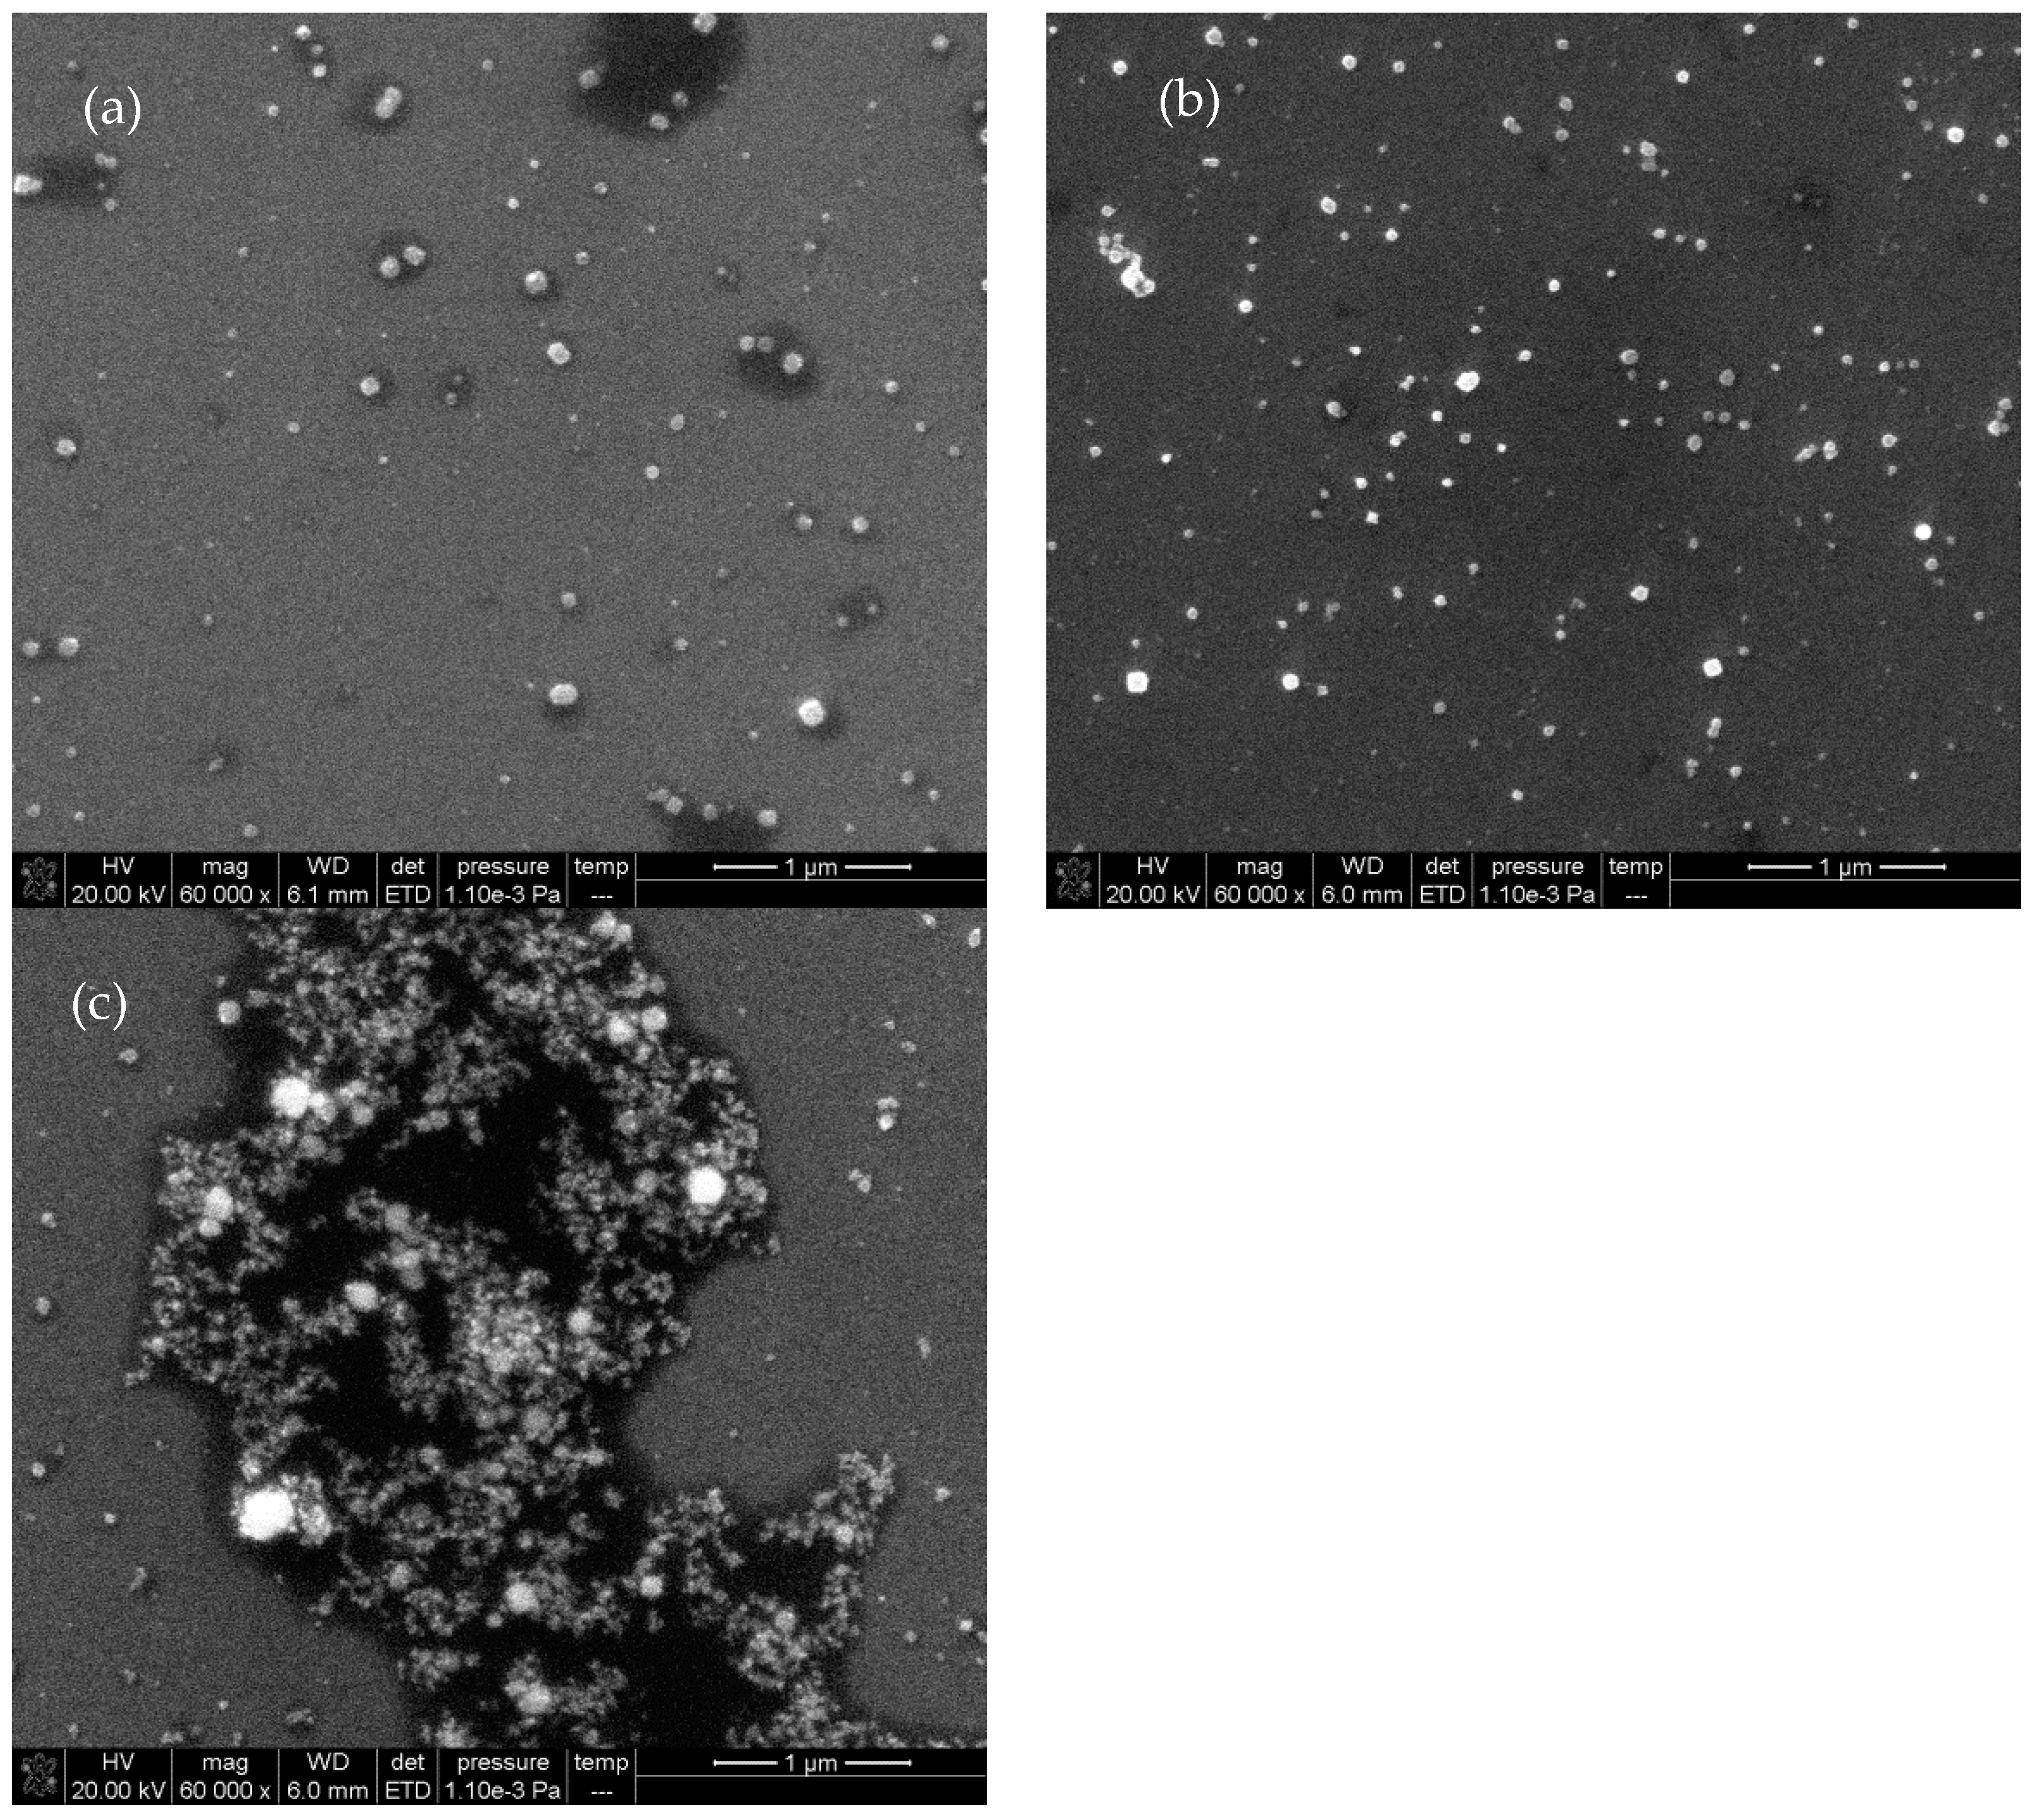
2.4. Scanning Electron Microscopy (SEM)
2.5. Optimization of Catalysis Conditions
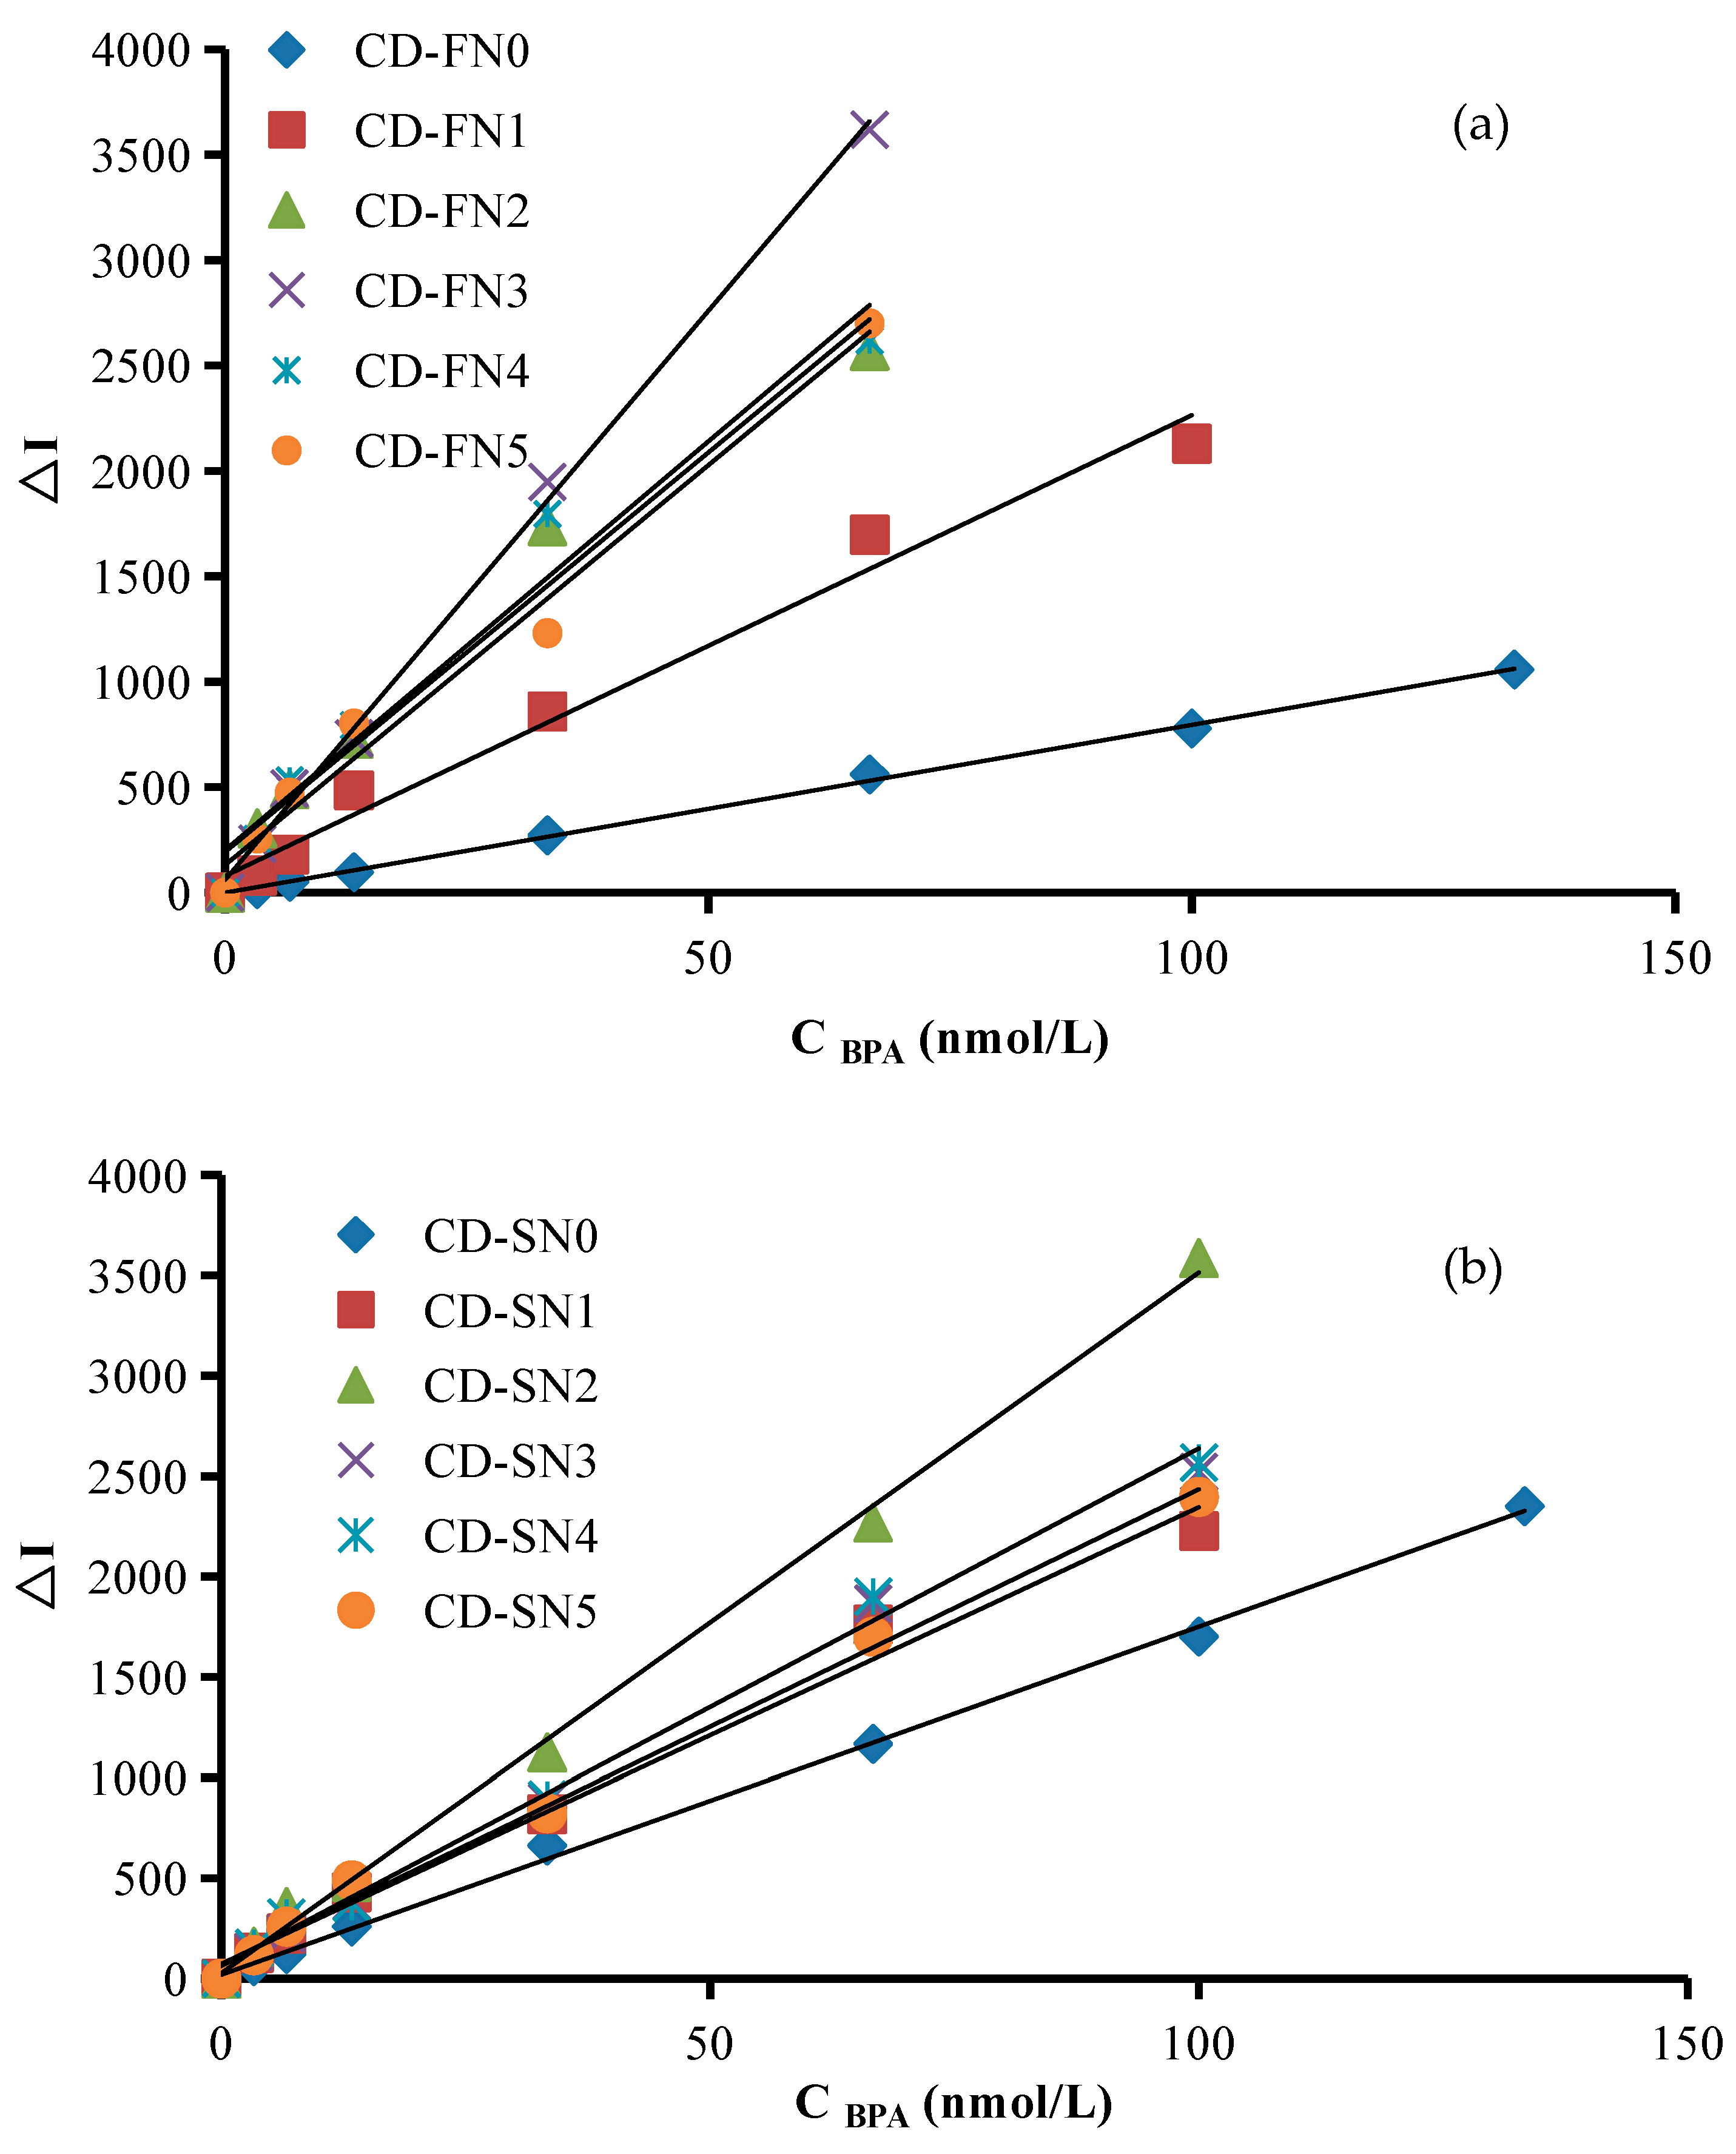
2.6. Working Curve
2.7. Influence of Substances
2.8. Sample Analysis
3. Materials and Methods
3.1. Apparatus
3.2. Reagents
3.3. Procedure
4. Conclusions
Supplementary Materials
Author Contributions
Funding
Institutional Review Board Statement
Informed Consent Statement
Data Availability Statement
Acknowledgments
Conflicts of Interest
References
- Lao, Y.H.; Phua, K.K.; Leong, K.W. Aptamer nanomedicine for cancer therapeutics: Barriers and potential for translation. ACS Nano 2015, 9, 2235–2254. [Google Scholar] [CrossRef] [PubMed]
- Sun, H.; Zu, Y. A highlight of recent advances in aptamer technology and its application. Molecules 2015, 20, 11959–11980. [Google Scholar] [CrossRef] [PubMed] [Green Version]
- Zhou, J.; Le, V.; Kalia, D.; Nakayama, S.; Mikek, C.; Lewis, E.A.; Sintim, H.O. Diminazene or berenil, a classic duplexminor groove binder, binds to G-quadruplexes with low nanomolar dissociation constants and the amidine groups are also critical for G-quadruplex binding. Mol. Biosyst. 2014, 10, 2724–2734. [Google Scholar] [CrossRef] [Green Version]
- Cho, Y.S.; Lee, E.J.; Lee, G.H.; Hah, S.S. Aptamer selection for fishing of palladium ion using graphene oxide-adsorbed nanoparticles. Bioorg. Med. Chem. Lett. 2015, 25, 5536–5539. [Google Scholar] [CrossRef] [PubMed]
- Nameghi, M.A.; Danesh, N.M.; Ramezani, M.; Hassani, F.V.; Abnous, K.; Taghdisi, S.M. A fluorescent aptasensor based on a DNA pyramid nanostructure for ultrasensitive detection of ochratoxin A. Anal. Bioanal. Chem. 2016, 408, 5811–5818. [Google Scholar] [CrossRef] [PubMed]
- Abnous, K.; Danesh, N.M.; Ramezani, M.; Emrani, A.S.; Taghdisi, S.M. A novel colorimetric sandwich aptasensor based on an indirect competitive enzyme-free method for ultrasensitive detection of chloramphenicol. Biosens. Bioelectron. 2016, 78, 80–86. [Google Scholar] [CrossRef] [PubMed]
- Tang, M.L.; Wen, G.Q.; Luo, Y.H.; Kang, C.Y.; Liang, A.H.; Jiang, Z.L. A label-free DNAzyme-cleaving fluorescencemethod for the determination of trace Pb2+ based on catalysis of AuPd nanoalloy on thereduction of rhodamine 6G. Luminescence 2015, 30, 296–302. [Google Scholar] [CrossRef]
- Yuan, B.Y.; Zhou, Y.; Guo, Q.P.; Wang, K.M.; Yang, X.H.; Meng, X.X.; Wan, J.; Tan, Y.Y.; Huang, Z.X.; Xie, Q.; et al. A signal-on split aptasensor for highly sensitive and specific detection of tumor cells based on FRET. Chem. Commun. 2016, 52, 1590–1593. [Google Scholar] [CrossRef]
- Le Ru, E.; Etchegoin, P.G. Principles of Surface-Enhanced Raman Spectroscopy and Related Plasmonic Effects, 1st ed.; Elsevier: Amsterdam, The Netherlands, 2009. [Google Scholar]
- Camden, J.P.; Dieringer, J.A.; Wang, Y.; Masiello, D.J.; Marks, L.D.; Schatz, G.C.; Van Duyne, R.P. Probing the structure of single-molecule surface-enhanced Raman scattering hot spots. J. Am. Chem. Soc. 2008, 130, 12616–12617. [Google Scholar] [CrossRef]
- Anker, J.N.; Hall, W.P.; Lyandres, O.; Shah, N.C.; Zhao, J.; Van Duyne, R.P. Biosensing with plasmonic nanosensors. Nat. Mater. 2008, 7, 442–453. [Google Scholar] [CrossRef]
- Kabashin, A.V.; Evans, P.; Pastkovsky, S.; Hendren, W.; Wurtz, G.A.; Atkinson, R.; Pollard, R.; Podolskiy, V.A.; Zayats, A.V. Plasmonic nanorod metamaterials for biosensing. Nat. Mater. 2009, 8, 867–871. [Google Scholar] [CrossRef] [PubMed]
- McFarland, A.D.; Van Duyne, R.P. Single silver nanoparticles as real-time opti-cal sensors with zeptomole sensitivity. Nano Lett. 2003, 3, 1057–1062. [Google Scholar] [CrossRef] [Green Version]
- Marinakos, S.M.; Chen, S.; Chilkoti, A. Plasmonic detection of a model analyte inserum by a gold nanorod sensor. Anal. Chem. 2007, 79, 5278–5283. [Google Scholar] [CrossRef] [PubMed]
- Kajikawa, K.; Mitsui, K. Optical fiber biosensor based on localized surface plasmon resonance in gold nanoparticles. Optics East 2004, 5593, 494–501. [Google Scholar]
- Potara, M.; Gabudean, A.M.; Astilean, S. Solution-phase, dual LSPR-SERS plas-monic sensors of high sensitivity and stability based on chitosan-coatedanisotropic silver nanoparticles. J. Mater. Chem. 2011, 21, 3625–3633. [Google Scholar] [CrossRef]
- Chen, J.W.; Jiang, J.H.; Gao, X.; Liu, G.K.; Shen, G.L.; Yu, R.Q. A new aptameric biosensor for cocaine Based on surface-enhanced Raman scattering spectroscopy. Chem.-A Eur. J. 2008, 14, 8374–8382. [Google Scholar] [CrossRef]
- Duan, N.; Shen, M.F.; Wu, S.J.; Zhao, C.X.; Ma, X.Y.; Wang, Z.P. Graphene oxide wrapped Fe3O4@Au nanostructures as substrates for aptamer-based detection of vibrio parahaemolyticus by surface-enhanced Raman spectroscopy. Microchim. Acta 2017, 184, 2653–2660. [Google Scholar] [CrossRef]
- Chung, E.; Jeon, J.; Yu, J.M.; Lee, C.; Choo, J. Surface-enhanced Raman scattering aptasensor for ultrasensitive trace analysis of bisphenol A. Biosens. Bioelectron. 2015, 64, 560–565. [Google Scholar] [CrossRef]
- Luo, Y.; Jing, Q.; Li, C.; Liang, A.; Wen, G.; He, X.; Jiang, Z. Simple and sensitive SERS quantitative analysis of sorbic acid in highly active gold nanosol substrate. Sens. Actuators B Chem. 2018, 255, 3187–3193. [Google Scholar] [CrossRef]
- Li, C.N.; Liu, Y.Y.; Liang, A.H.; Jiang, Z.L. SERS quantitative analysis of trace ferritin based on immunoreactionregulation of graphene oxide catalytic nanogold reaction. Sens. Actuators B 2018, 263, 183–189. [Google Scholar] [CrossRef]
- Ouyang, H.; Ling, S.; Liang, A.; Jiang, Z. A facile aptamer-regulating gold nanoplasmonic SERS detection strategy for trace lead ions. Sens. Actuators B 2018, 258, 739–744. [Google Scholar] [CrossRef]
- Liang, A.H.; Li, C.N.; Li, D.; Luo, Y.H.; Wen, G.Q.; Jiang, Z.L. A facile and sensitive peptide-modulating graphene oxide nanoribbon catalytic nanoplasmon analytical platform for human chorionic gonadotropin. Int. J. Nanomed. 2017, 12, 8725–8734. [Google Scholar] [CrossRef] [PubMed] [Green Version]
- Lin, L.P.; Rong, M.C.; Luo, F.; Chen, D.M.; Wang, Y.R.; Chen, X. Luminescent graphene quantum dots as new fluorescent materials for environmental and biological applications. TrAC Trends Anal. Chem. 2014, 54, 83–102. [Google Scholar] [CrossRef]
- Du, Y.; Guo, S.J. Chemically doped fluorescent carbon and graphene quantum dots for bioimaging, sensor, catalytic and photoelectronic applications. Nanoscale 2016, 8, 2532–2543. [Google Scholar] [CrossRef]
- Zheng, X.T.; Ananthanarayanan, A.; Luo, K.Q.; Chen, P. Glowing graphene quantum dots and carbon dots: Properties, syntheses, and biological applications. Small 2015, 11, 1620–1636. [Google Scholar] [CrossRef]
- Guo, Y.L.; Liu, X.Y.; Yang, C.D.; Wang, X.D.; Wang, D.; Iqbal, A.; Liu, W.S.; Qin, W.W. Synthesis and peroxidase-like activity of cobalt@carbon-dots hybrid material. ChemCatChem 2015, 7, 2467–2474. [Google Scholar] [CrossRef]
- Sooksin, S.; Promarak, V.; Ittisanronnachai, S.; Ngeontae, W. A highly selective fluorescent enhancement sensor for Al3+ based nitrogen-doped carbon dots catalyzed by Fe3+. Sens. Actuators B Chem. 2018, 262, 720–732. [Google Scholar] [CrossRef]
- Li, N.; Liu, S.G.; Dong, J.X.; Fan, Y.Z.; Ju, Y.J.; Luo, H.Q.; Li, N.B. Using high-energy phosphate as energy-donor and nucleus growth-inhibitor to prepare carbon dots for hydrogen peroxide related biosensing. Sens. Actuators B Chem. 2018, 262, 780–788. [Google Scholar] [CrossRef]
- Wang, J.B.; Han, S.Q.; Fan, Z.Y.; Chen, Y.Y.; Zhang, L.F.; Jiang, F.Y. Carbon dots-catalyzed chemiluminescence for the determination of trace isonaphthol. J. Chin. Chem. Soc. 2017, 64, 486–492. [Google Scholar] [CrossRef]
- Long, Y.J.; Wang, X.L.; Shen, D.J.; Zheng, H.Z. Detection of glucose based on the peroxidase-like activity of reduced state carbon dots. Talanta 2016, 159, 122–126. [Google Scholar] [CrossRef]
- Wang, B.; Liu, F.; Wu, Y.Y.; Chen, Y.F.; Weng, B.; Li, C.M. Synthesis of catalytically active multielement-doped carbon dots and application for colorimetric detection of glucose. Sens. Actuators B Chem. 2018, 255, 2601–2607. [Google Scholar] [CrossRef]
- Yang, W.Q.; Huang, T.T.; Zhao, M.M.; Luo, F.; Weng, W.; Wei, Q.H.; Lin, Z.Y.; Chen, G.N. High peroxidase-like activity of iron and nitrogen co-doped carbon dots and its application in immunosorbent assay. Talanta 2017, 164, 1–6. [Google Scholar] [CrossRef] [PubMed] [Green Version]
- Kang, J.H.; Kundo, F.; Katayama, Y. Review: Human exposure to bisphenol A. Toxicology 2006, 226, 79–89. [Google Scholar] [CrossRef] [PubMed]
- Erler, C.; Novak, J. Bisphenol A exposure: Human risk and health policy. J. Pediatr. Nurs.-Nurs. Care Child. Fam. 2010, 25, 400–407. [Google Scholar] [CrossRef] [PubMed]
- WHO. Joint FAO/WHO Expert Meeting to Review Toxicological and Health Aspects of Bisphenol a: Summary Report Including Report of Stakeholders Meeting on Bisphenol A; Food and Agriculture Organization of the United Nations: Rome, Italy; World Health Organization: Geneva, Switzerland, 2010. [Google Scholar]
- Rochester, J.R. Bisphenol A and human health: A review of the literature, Reprod. Reprod. Toxicol. 2013, 42, 132–155. [Google Scholar] [CrossRef] [PubMed]
- Michałowicz, J. Bisphenol A sources, toxicity and biotransformation. Environ. Toxicol. Pharmacol. 2014, 37, 738–758. [Google Scholar] [CrossRef] [PubMed]
- Takino, A.; Tsuda, T.; Kojima, M.; Harada, H.; Muraki, K.; Wada, M. Development of Analytical Method for Bisphenol A in Canned Fish and Meat by HPLC. J. Food Hyg. Soc. Jpn. 2009, 40, 325–333. [Google Scholar] [CrossRef]
- Zhou, Q.H.; Jin, Z.H.; Li, J.; Wang, B.; Wei, X.Z.; Chen, J.Y. A novel air-assisted liquid-liquid microextraction based on in-situ phase separation for the HPLC determination of bisphenols migration from disposable lunch boxes to contacting water. Talanta 2018, 189, 116–121. [Google Scholar] [CrossRef]
- Zhang, D.W.; Yang, J.Y.; Ye, J.; Xu, L.R.; Xu, H.C.; Zhan, S.S.; Xia, B.; Wang, L.M. Colorimetric detection of bisphenol A based on unmodified aptamer and cationic polymer aggregated gold nanoparticles. Anal. Biochem. 2016, 499, 51–56. [Google Scholar] [CrossRef]
- Xu, J.Y.; Li, Y.; Bie, J.X.; Jiang, W.; Guo, J.J.; Luo, Y.L.; Shen, F.; Sun, C.Y. Colorimetric method for determination of bisphenol A based on aptamer-mediated aggregation of positively charged gold nanoparticles. Microchim Acta 2015, 182, 2131–2138. [Google Scholar] [CrossRef]
- Maroto, A.; Kissingou, P.; Diascorn, A.; Benmansour, B.; Deschamps, L.; Stephan, L.; Cabon, J.Y.; Giamarchi, P. Direct laser photo-induced fluorescence determination of bisphenol A. Anal. Bioanal. Chem. 2011, 401, 3011–3017. [Google Scholar] [CrossRef] [PubMed]
- Li, Y.; Xu, J.Y.; Wang, L.K.; Huang, Y.J.; Guo, J.J.; Cao, X.Y.; Shen, F.; Luo, Y.L.; Sun, C.Y. Aptamer-based fluorescent detection of bisphenol A usingnonconjugated gold nanoparticles and CdTe quantum dots. Sens. Actuators B 2016, 222, 815–822. [Google Scholar] [CrossRef]
- Zhan, T.R.; Song, Y.; Li, X.J.; Hou, W.G. Electrochemical sensor for bisphenol A based on ionic liquid functionalized Zn-Al layered double hydroxide modified electrode. Mater. Sci. Eng. C 2016, 64, 354–361. [Google Scholar] [CrossRef] [PubMed]
- Yao, D.M.; Liang, A.H.; Yin, W.Q.; Jiang, Z.L. Resonance light scattering determination of trace bisphenol A with signal amplification by aptamer-nanogold catalysis. Luminescence 2014, 29, 516–521. [Google Scholar] [CrossRef] [PubMed]
- Yao, D.M.; Wen, G.Q.; Jiang, Z.L. A highly sensitive and selective resonance Rayleigh scattering method for bisphenol A detection based on the aptamer-nanogold catalysis of the HAuCl4-vitamin C particle reaction. RSC Adv. 2016, 3, 13353–13356. [Google Scholar] [CrossRef]
- Lei, H.Y.; Hu, Y.L.; Li, G.K. A dual-functional membrane for bisphenol A enrichment and resonance amplification by surface-enhanced Raman scattering. Chin. Chem. Lett. 2018, 29, 509–512. [Google Scholar] [CrossRef]
- De, B.C.; Dumont, E.; Hubert, C.; Sacré, P.Y.; Netchacovitch, L.; Chavez, P.F.; Hubert, P.; Ziemons, E. A simple approach for ultrasensitive detection of bisphenols by multiplexed surface-enhanced Raman scattering. Anal. Chim. Acta 2015, 888, 118–125. [Google Scholar]
- Jabeen, S.; Dines, T.J.; Withnall, R.; Leharne, S.A.; Chowdhry, B.Z. Surface-enhanced Raman scattering studies of rhodanines: Evidence for substrate surface-induced dimerization. Phys. Chem. Chem. Phys. 2009, 11, 7476–7483. [Google Scholar] [CrossRef]
- Zhou, F.Q.; Zhang, L.; Liu, A.; Shen, Y.; Yuan, J.P.; Yu, X.J.; Feng, X.; Xu, Q.; Cheng, C.G. Measurement of phenolic environmental estrogens in human urine samples by HPLC–MS/MS and primary discussion the possible linkage with uterine leiomyoma. J. Chromatogr. B 2013, 938, 80–85. [Google Scholar] [CrossRef]


| Test Method | Nanocatalyst | Working Curve | Linearly Range | Coefficient (R2) | Limit of Detection |
|---|---|---|---|---|---|
| SERS | CD-FN0 | = 7.96 C − 0.81 | 3.33–133.33 nmol/L | 0.9988 | 1.2 nmol/L |
| CD-FN1 | = 22.12 C + 59.70 | 1.33–100 nmol/L | 0.983 | 0.8 nmol/L | |
| CD-FN2 | = 39.16 C + 132.51 | 0.67–66.67 nmol/L | 0.9709 | 0.2 nmol/L | |
| CD-FN3 | = 54.50 C + 50.22 | 0.33–66.67 nmol/L | 0.9978 | 0.1 nmol/L | |
| CD-FN4 | = 40.13 C + 136.5 | 0.67–66.67 nmol/L | 0.966 | 0.3 nmol/L | |
| CD-FN5 | = 38.49 C + 104.61 | 0.67–66.67 nmol/L | 0.984 | 0.3 nmol/L | |
| CD-SN0 | = 17.31 C + 18.75 | 3.33–133.33 nmol/L | 0.9984 | 2.0 nmol/L | |
| CD-SN1 | =22.93 C + 58.28 | 1.33–100 nmol/L | 0.9886 | 0.8 nmol/L | |
| CD-SN2 | = 35.00 C + 17.67 | 1.33–100 nmol/L | 0.9976 | 0.5 nmol/L | |
| CD-SN3 | = 25.67 C + 32.60 | 1.33–100 nmol/L | 0.996 | 0.6 nmol/L | |
| CD-SN4 | = 25.98 C + 46.79 | 1.33–100 nmol/L | 0.9946 | 0.7 nmol/L | |
| CD-SN5 | = 23.81 C + 57.91 | 1.33–100 nmol/L | 0.9949 | 0.7 nmol/L | |
| CD | = 34.12 C + 46.86 | 0.67–66.67 nmol/L | 0.9896 | 0.3 nmol/L | |
| CDGN | = 15.07 C + 45.55 | 0.67–66.67 nmol/L | 0.9759 | 0.5 nmol/L | |
| CDCa | = 19.09 C + 47.84 | 0.67–66.67 nmol/L | 0.9851 | 0.45 nmol/L | |
| CD-CN1 | = 8.66 C − 0.48 | 1.33–100 nmol/L | 0.997 | 0.7 nmol/L | |
| CD-CN2 | = 31.47 C + 56.14 | 0.67–66.67 nmol/L | 0.9938 | 0.3 nmol/L | |
| CD-CN3 | = 25.21 C + 45.16 | 0.67–66.67 nmol/L | 0.9889 | 0.4 nmol/L | |
| CD-CN4 | = 21.85 C + 41.74 | 0.67–66.67 nmol/L | 0.9928 | 0.4 nmol/L | |
| CD-CN5 | = 18.39 C + 44.54 | 0.67–66.67 nmol/L | 0.9812 | 0.5 nmol/L | |
| Ag nanoparticle (AgNP) | = 27.24 C + 38.92 | 0.67–66.67 nmol/L | 0.9938 | 0.3 nmol/L |
Publisher’s Note: MDPI stays neutral with regard to jurisdictional claims in published maps and institutional affiliations. |
© 2022 by the authors. Licensee MDPI, Basel, Switzerland. This article is an open access article distributed under the terms and conditions of the Creative Commons Attribution (CC BY) license (https://creativecommons.org/licenses/by/4.0/).
Share and Cite
Xie, Y.; Ma, L.; Ling, S.; Ouyang, H.; Liang, A.; Jiang, Z. Aptamer-Adjusted Carbon Dot Catalysis-Silver Nanosol SERS Spectrometry for Bisphenol A Detection. Nanomaterials 2022, 12, 1374. https://doi.org/10.3390/nano12081374
Xie Y, Ma L, Ling S, Ouyang H, Liang A, Jiang Z. Aptamer-Adjusted Carbon Dot Catalysis-Silver Nanosol SERS Spectrometry for Bisphenol A Detection. Nanomaterials. 2022; 12(8):1374. https://doi.org/10.3390/nano12081374
Chicago/Turabian StyleXie, Yuqi, Lu Ma, Shaoming Ling, Huixiang Ouyang, Aihui Liang, and Zhiliang Jiang. 2022. "Aptamer-Adjusted Carbon Dot Catalysis-Silver Nanosol SERS Spectrometry for Bisphenol A Detection" Nanomaterials 12, no. 8: 1374. https://doi.org/10.3390/nano12081374
APA StyleXie, Y., Ma, L., Ling, S., Ouyang, H., Liang, A., & Jiang, Z. (2022). Aptamer-Adjusted Carbon Dot Catalysis-Silver Nanosol SERS Spectrometry for Bisphenol A Detection. Nanomaterials, 12(8), 1374. https://doi.org/10.3390/nano12081374