Abstract
The surface plasmon resonance (SPR) effect and the hetero-junction structure play crucial roles in enhancing the photocatalytic performances of catalysts for the water-splitting reaction. In this study, a series of double perovskites LaFe1−xNixO3 was synthesized. LaFe1−xNixO3 particles were then decorated with sea urchin-like Au nanoparticles (NPs) with the average size of approximately 109.83 ± 8.48 nm via electrophoresis. The d-spacing became narrow and the absorption spectra occurred the redshift phenomenon more when doping increasing Ni mole concentrations for the raw LaFe1−xNixO3 samples. From XPS analysis, the Ni atoms were inserted into the lattice of the matrix, resulting in the defect of the oxygen vacancy, and NiO and Fe2O3 were formed. This hybrid structure was the ideal electrode for photoelectrochemical hydrogen production. The photonic extinction of the Au-coated LaFe1−xNixO3 was less than 2.1 eV (narrow band gap), and the particles absorbed more light in the visible region. According to the Mott–Schottky plots, all the LaFe1−xNixO3 samples were the n-type semiconductors. Moreover, all the band gaps of the Au-coated LaFe1−xNixO3 samples were higher than 1.23 eV (H+/H2). Then, the hot electrons from the Au NPs were injected via the SPR effect, the coupling effect between LaFe1−xNixO3 and Au NPs, and the more active sites from Au NPs into the conduction band of the semiconductor, improving the hydrogen efficiency. The H2 efficiency of the Au-coated LaFe1−xNixO3 measured in ethanol was approximately ten times larger than the that of Au-coated LaFe1−xNixO3 measured in 1-butanol at any testing temperature because ohmic and kinetic losses occurred in the latter solvent. Thus, the activation energies of ethanol at any testing temperature were smaller. The maximum real H2 production was up to 43,800 μmol g−1 h−1 in ethanol. The redox reactions among metal ions, OH*, and oxides were consecutively proceeded under visible light illumination.
1. Introduction
The development of alternative catalysts for the oxygen evolution reaction (OER) and hydrogen evolution reaction (HER) by tuning the structure and composition of catalysts based on transition metals, for example, metal oxides (or hydroxides), phosphates, chalcogenides, and metal–carbon materials [1], has attracted significant research attention. In particular, materials with the ABO3 perovskite structure have been found to serve as catalysts with high activities, selectivities, and stabilities [2] owing to their optimum electronic and chemical structures. Especially, double perovskites have received attention in recent years, because double perovskites (AA’BB’O6), in which the A- and B-site elements are substituted by a transition metal, possess several intriguing chemical and physical properties, such as electronic structures that range from insulating to metallic, half-metallic spin-polarized electrical conductivity, and superconductivity [3]. Guan et al. also reported that B-sites coordinated with O anions are considered as the p-band center, and are also identified as the active sites for absorption and desorption reaction intermediates [4]. Accordingly, the double perovskite structure of LaFe1−xNixO3 has been extensively studied. In this structure, Ni3+ is in the low spin state (t62g, e1g), and the conduction band is formed by the hybridization of Ni3+ eg and O2− 2p orbitals [5], which provide the design and selection for the photocatalytic applications. To compare with traditional materials, double perovskites possess the superior performance about the screening effect. The better the screening effect, the lower the probability of charge recombination and the stronger the B-O covalency due to the impurity of Ni. This is because d holes of electrons are in s and p states of Ni, and the impurity of charge is screened mainly by d electrons at surrounding Ni atoms [6]. This research has demonstrated that the HER activity of an Ni surface can be reinforced by NiO, or Ni(OH)2 formation due to HO-H bonds, and then H+ is profoundly and proficiently converted into H2 [7].
The photocatalytic performances of perovskites can be considerably improved by tuning their surface areas and intrinsic activities [8,9]. The electronic properties of perovskites are also important factors [10]. Simultaneous reduction–oxidization reactions are facilitated by tailoring their electronic structure to permit the easy and rapid transport of electrons to the surfaces of the catalysts [11,12,13]. The band gap of the optimal photocathode is approximately 1.2 eV to establish the optimum HER process [14]. This kind of photocathode possesses high solar-to-hydrogen (STH) efficiency and the unassisted water-splitting reaction, which means that there is only one key step of artificial photosynthesis converting solar light energy into chemical fuels [15]. There are some factors, which were the electronic band gap, exposed active sites, and diverse and adjustable chemical structure, to improve the efficiency of the photoelectrochemical (PEC) cell [16].
Many methods can be used to develop the efficiency of the water-splitting reaction. The optical property of metal nanoparticles which induce the SPR effect is generally taken advantage of. The sensitivity of SPR, as well as its spatial distribution and resonant energy, depend on the nanoparticle structure, composition, and environment [17]. The light–matter interaction occurs when Au NPs are incorporated into the photoactive material at the interface between the semiconductor and Au NP The enhanced scattering and absorption efficiencies result from the excitation of SPR with the stronger near-field intensity at the boundary of Au nanostructures [18]. The sharp, well-defined tips and spikes in star-shaped nanoparticles (NPs) result in enhanced surface Raman scattering, and consequently, these structures exhibit improved SPR effect [19].
This study compared the activation energy of LaFe1−xNixO3 in different solvents. LaFeO3 were doped with varying concentrations of Ni to synthesize the double perovskite structure of LaFe1−xNixO3 with a narrow band gap. Electrophoresis was used to synthesize urchin-like Au NPs, and a hetero-junction photocathode was used to combine LaFe1−xNixO3 with Au NPs. To use the electrophoresis method was convenient and non-expensive. This hybrid structure demonstrated appropriate stability for water splitting. Such materials have been used to catalyze reactions involving short- and long-chain hydrocarbons, ethanol and 1-butanol, respectively, to generate the photocatalytic H2 production. The results obtained herein can aid in enhancing the application of perovskites in the energy conservation field. The primary aims of this study were (1) 3D bulk structure of LaFe1−xNixO3 synthesis using the hydrothermal method; (2) LaFe1−xNixO3 decorated with Au nanoparticles, forming the hetero-junction electrode; (3) light-driven hydrogen generation in ethanol and 1-butanol tested; (4) the charges of Fe, Ni, and hydroxyl transferring each other; and (5) SPR effect of Au nanoparticles having the key role in catalytic behavior.
2. Materials and Methods
2.1. Synthesis of LaFe1−xNixO3 (LFNO) Bulk Materials
First, 0.2 mol La(NO3)3•6H2O (Alfa Aesar, Tewsbury, MA, USA, 99.9%) and 0.2 mol Fe(NO3)3•9H2O (Alfa Aesar, Tewsbury, MA, USA, 98.0%) were mixed with 160 mL of deionized water (DI water, Thermo-Scientific, Rochester, NY, USA, MicroPure UV, 18.2 MΩ-cm). Additionally, Ni(NO3)2•6H2O (Alfa Aesar, Tewsbury, MA, USA, 98%) was added. LaFe1−xNixO3 materials with La:Fe:Ni in the molar ratio of 1:1−x:x, where x = 0.00, 0.01, 0.03, 0.05, and 0.07, were prepared. Subsequently, the solution was stirred for 30 min at 25 °C, after which 0.5 g of polyvinylpyrrolidone (PVP, Sigma-Alorich, St. Louis, MO, USA, 99%) was added, and the mixture was stirred for 1 h at 25 °C. The resulting solution was poured into an autoclave, which was then placed in a drying oven (WahFu, Taiwan, JB-27) at 160 °C for 12 h. After the hydrothermal reaction, the obtained powders, which were directly reacted in the mixture, were washed using DI water and alcohol five times in a centrifuge (HsiangTai, Taiwan, CN-820) at 4000 rpm. Finally, the powders were placed on a baker and dried in the drying oven at 150 °C for 4 h. Using the hydrothermal method can result in high purity, high quality, and narrow particle size. The hydrothermal method can also control stoichiometry, distribution, morphology, uniformity, cause fewer defects, dense particles, high crystallinity, excellent reproducibility, microstructure, high reactivity, and sintering ability. [20]. From Yoshimura’s research [21], the particle size of BaTiO3 using the hydrothermal method was the smallest compared with other synthesis processes, such as ball-milling, solid-state reaction, co-precipitation, etc.
2.2. Spin-Coating LFNO Powder on ITO (Indium-Tin-Oxide) Glass
First, ITO glass (Ruilong, Taiwan, 7Ω) with the dimensions 20 × 20 × 0.7 mm3 was treated using ozone for 10 min. A gel solution with the following components was prepared: 0.1 g of LFNO, 500 μL of Nafion (Aldrich, Milwaukee, WI, USA, 5 wt %), and 3 mL of DI water. The gel solution was stirred for 2 h at 25 °C, after which 45 μL of the gel solution was dropped with a pipe in a spin-coater (Apisc, Taiwan, SP-M1-S) running at 6500 rpm for 15 s at 25 °C. The coated glass was then dried in the oven at 150 °C for 6 h.
2.3. Decoration of Sea Urchin-like Au NPs
Electrophoresis was conducted using an electrochemical analyzer (CHI, Model 6000E Series, Austin, TX, USA). Coated glass was used as the working electrode, and a Pt wire was connected with the counter and reference electrodes. An Au colloid was prepared by mixing 50 mL of 5 × 10⁻⁴ M HAuCl4•3H2O (Alfa Aesar, Tewsbury, MA, USA, 99.99%) and 5 mL of 4.5 × 10⁻² M sodium citrate dihydrate (J.T Baker, Suite 100 Bridgewater, NJ, USA, 99.0%). Thereafter, an Au solution consisting of 90 μL of Au colloid, 45 mL of 10−4 M HAuCl4•3H2O, 7.5 mL of 3.0 × 10⁻³ hydroquinone (J.T Baker, Suite 100 Bridgewater, NJ, USA, 99.0%), and 60 μL of 2 wt % sodium citrate dihydrate was prepared. The solution was mixed thoroughly, and the coated glass was introduced into the Au solution. A voltage of 2 V was applied for 2 h for electrophoresis. There were some reasons to use electrophoresis method: (1) electrophoresis is direct and not complicated to load the Au NPs on the thin films, (2) electrophoresis can save time, (3) electrophoresis only needs a small volume of samples, and (4) electrophoresis has a reasonable cost. In this study, the larger surface area, which induces more active sites, and the star-like morphology of Au NPs can enhance the SPR effect.
2.4. A Analysis of Properties
The morphology was observed via scanning electron microscopy (SEM, ZEISS-AURIGA AFE-SEM, Jena, Germany); energy dispersive X-ray spectroscopy (EDS) was conducted in conjunction with SEM. The crystal planes were observed via high-resolution transmission electron microscopy (HR-TEM, JEOL JEM-3010, Tokyo, Japan). X-ray photoelectron spectroscopy (XPS, Thermo K-Alpha, X-ray source: Al K-α, Rochester, NY, USA) was conducted to obtain the binding state of each element. The valence band energies of the compounds were obtained from ultraviolet photoelectron spectroscopy (UPS) plots (Thermo VG-Scientific, Sigma Probe, UPS source: He(Ⅰ), Thermo VG-Scientific). The photon energy of the incident light was 21.1 eV.
Ultraviolet-visible (UV-vis) spectroscopy (PerkinElmer, Lambda 950, Waltham, MASS, USA) was conducted to obtain the absorbance wavelengths and band gaps from 400 to 800 nm. The crystal phases were analyzed using an X-ray analytical system (Bruker AXS Gmbh, Karlsruhe, Germany). Electrochemical analysis was conducted using several methods, such as Mott-Schottky plots, cyclic voltammetry (C-V) curves, and linear sweep voltammetry (LSV) curves. The C-V and LSV curves were measured in 0.1 M KOH solution. LSV was conducted under illumination air mass (AM) 1.5G (1000 W/m2). Furthermore, the H2 evolutions in ethanol (J.T Baker, Suite 100 Bridgewater, NJ, USA, 99.9%) and 1-butanol (Duksan, Seoul, South Korea,99.9%) were determined from the corresponding I–V curves, with the applied voltage ranging from 0 to 1.5 V; testing was also conducted at different temperatures under AM 1.5G.
3. Results and Discussion
3.1. Phase and Morphology Analyses
Figure 1 shows the XRD analysis of the raw LFNO. From Figure 1 the diffraction peaks can be matched to the orthorhombic perovskite structure with the Pnma space group (JCPDS no. 37-1493) [22]. The orthorhombic structure peaks are located at 24.02°, 33.08°, 35.61°, 40.93°, 49.37°, 54.00°, 57.57°, 69.60°, 71.78°, 75.35°, and 77.69°. Both La2O3 (JCPDS no. 73-2141) and La(OH)3 (JCPDS 13-1481) [23] phases are observed, and La2O3 and La(OH)3 exhibit hexagonal structures [24]. The peaks corresponding to La(OH)3 are 39.36° and 43.46°, while the peaks of La2O3 are 62.44° and 64.02°. In general, a higher intensity of XRD peaks indicates better crystallinity; thus, the lattice arrangement was highly ordered for the samples regardless of the Ni concentration.
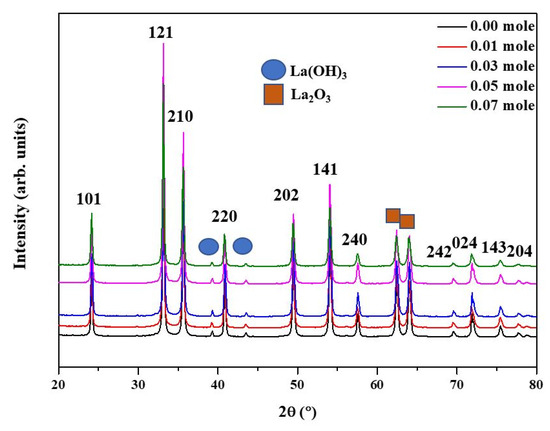
Figure 1.
X-ray patterns of the raw LFNO samples with different Ni concentrations.
The particle size increases as the Ni concentration increases due to the difference in the ionic radius of Fe3+ and Ni2+ [25]; the particle sizes shown in Figure 2 are listed in Table S1. The specimen where x = 0.07 Ni has the largest particle size, approximately 7.82 ± 0.80 μm, because La2O3 and La(OH)3 appear in the matrix and enlarge the coverage area. Moreover, the morphologies of the sea urchin-like Au NPs decorated on the LFNO thin film are shown in Figure 3. The flower-like Au NPs are successfully adhered to the films for all LFNO samples with different Ni concentrations. The average size of the Au NPs is approximately 109.83 ± 8.48 nm.
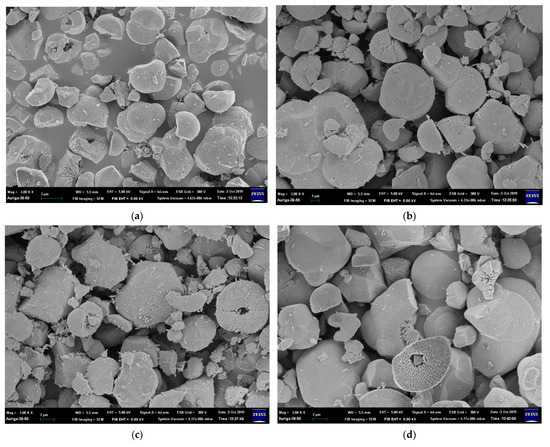
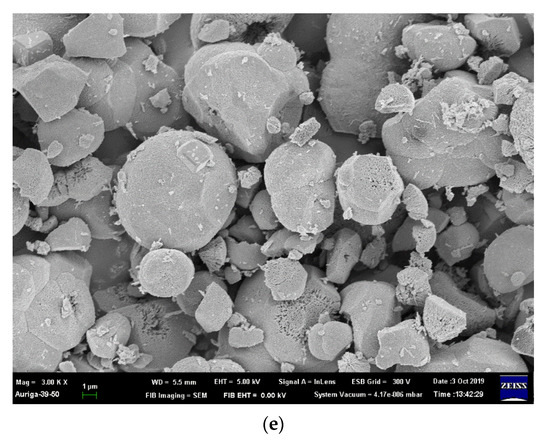
Figure 2.
FE-SEM images of the raw LaFe1−xNixO3 in (a) x = 0.00 mol, (b) x = 0.01 mol, (c) x = 0.03 mol, (d) x = 0.05 mol, and (e) x = 0.07 mol.
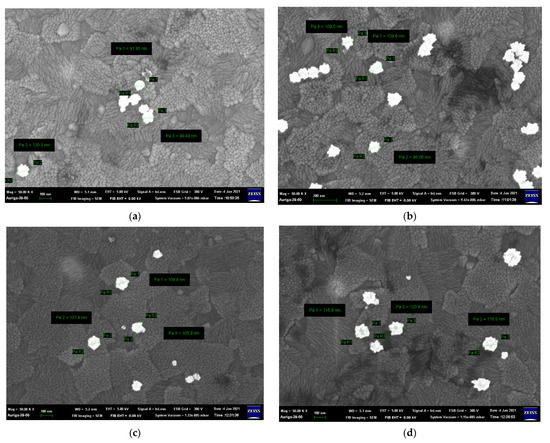

Figure 3.
FE-SEM images of the Au-coated LaFe1−xNixO3 in (a) x = 0.00 mol, (b) x = 0.01 mol, (c) x = 0.03 mol, (d) x = 0.05 mol, and (e) x = 0.07 mol.
3.2. Crystalline Analysis
Figure 4 and Figure 5 show the selected area diffractions (SAD) results and HR-TEM images of the raw LFNO powders, respectively. The SAD results, shown in Figure 4, are consistent with the XRD patterns. These raw LFNO powders exhibit high degrees of crystallinity, and the orthorhombic perovskite structures are dominant. As shown in the HR-TEM images in Figure 5, the d-spacing decreases when the sample is doped with a higher Ni concentration, which occurs because Ni atoms and NiO NPs induce lattice shrinkage [26]. Thus, the hydrogen molecules (H+) cannot be accommodated on the denser interlayer spacing, and hydrogen gas (H2) can be much more rapidly released. Then, the d-spacing is decreased with high Ni concentrations, and H+ or H2 is not incorporated into the lattices of the raw LFNO samples. Therefore, the H2 generation efficiency is improved.
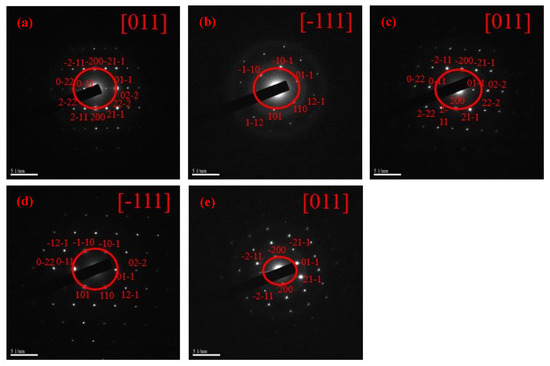
Figure 4.
SAD of the raw LFNO samples in (a) x = 0.00 mol, (b) x = 0.01 mol, (c) x = 0.03 mol, (d) x = 0.05 mol, and (e) x = 0.07 mol.
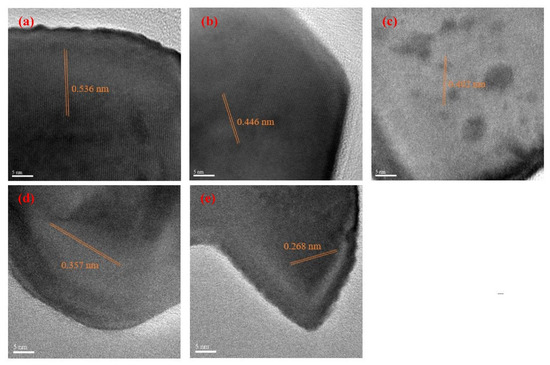
Figure 5.
HR-TEM of the raw LFNO samples in (a) x = 0.00 mol, (b) x = 0.01 mol, (c) x = 0.03 mol, (d) x = 0.05 mol, and (e) x = 0.07 mol.
3.3. Component Analysis
The EDX analysis results of the Au-coated LFNO are shown in Figure 6, wherein the elemental quantitative analyses are presented in sub-figures (c), (f), (i), (l), and (o). These results confirm that sea urchin-like Au NPs are adhered to each LFNO thin film.
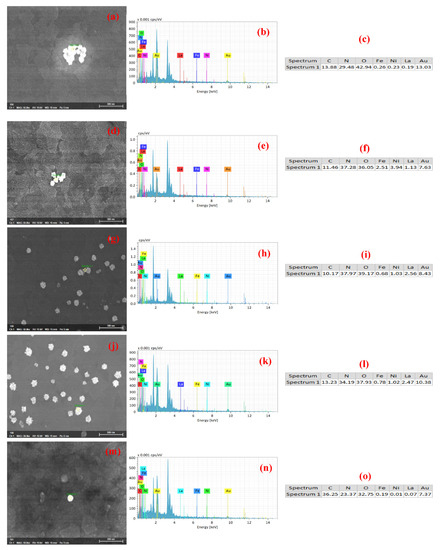
Figure 6.
EDS analysis of the Au-coated LaFe1.00Ni0.00O3 sample in (a) original image, (b) energy spectrum, and (c) elemental composition (at %). EDS analysis of the Au-coated LaFe0.99Ni0.01O3 sample in (d) original image, (e) energy spectrum, and (f) elemental composition (at %). EDS analysis of the Au-coated LaFe0.97Ni0.03O3 sample in (g) original image, (h) energy spectrum, and (i) elemental composition (at %). EDS analysis of the Au-coated LaFe0.95Ni0.05O3 sample in (j) original image, (k) energy spectrum, and (l) elemental composition (at %). EDS analysis of the Au-coated LaFe0.93Ni0.07O3 sample in (m) original image, (n) energy spectrum, and (o) elemental composition (at %).
Figure 7 shows the XPS patterns of all samples. Figure 7a,d,g,j,m are the O 1s state, and there are two peaks to show up for all O 1s state curves. One peak with intensity up to approximately 530.20 eV is corresponding to the oxygen vacancy (Ov). Protons from the moist environment are exchanged with doped holes and oxygen vacancies formed by B-site cation doping [27], thus generating the more oxygen vacancies. Then, Ni is doped into the lattice of LaFeO3 also to induce the Ov enrichment. Another peak is the metal–oxygen (M-O) bond. The M-O bonds of Figure 7a,d,g,j,m indicate Fe-O bonds [28] and Ni-O bonds [29]. Thus, Fe2O3 and NiO are demonstrated to precipitate into the matrix. No other oxygen states are indicated. Based on Figure 7b,e,h,k,n, La 3d and Ni 2p orbits are overlapped. The peaks corresponding to the normal network structure of La3+ 3d5/2 and 3d3/2 are at approximately 838.3 and 847.7 eV, respectively. The La state in these results is consistent with the results reported in previous studies [30]. La2O3 is deposited, La-O bonds are decomposed, and oxygen atoms arrive at the interface to induce oxidation. Some peaks of La state disappear due to NiO formation. The La 3d3/2 orbit overlaps with the Ni 2p3/2 orbit. Only one peak of Ni2+ exists at approximately 870.3 eV [31], and no traces of other Ni states are observed. As seen in Figure 7c,f,i,l,o, one peak of Fe 2p3/2 exists at approximately 711.3 eV, and another peak of Fe 2p1/2 is at approximately 724.9 eV [32]. Fe is maintained at the +3 state, and no other valence sates are observed.
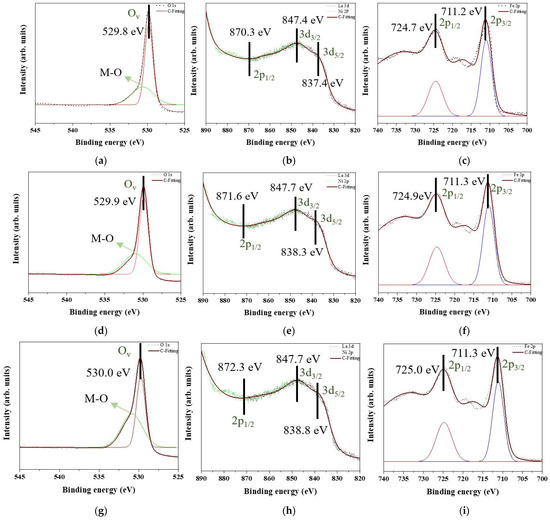
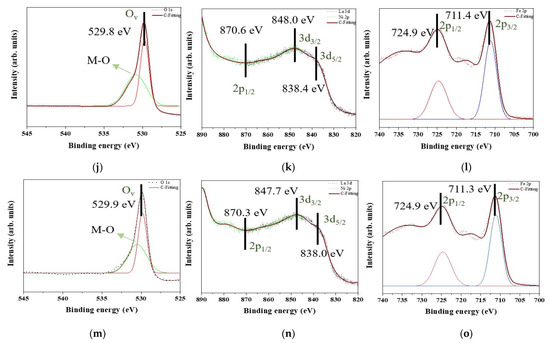
Figure 7.
XPS patterns of the raw LaFe1.00Ni0.00O3 sample in (a) O 1s, (b) La 3d and Ni 2p, and (c) Fe 2p. XPS patterns of the raw LaFe0.99Ni0.01O3 sample in (d) O 1s, (e) La 3d and Ni 2p, and (f) Fe 2p. XPS patterns of the raw LaFe0.97Ni0.03O3 sample in (g) O 1s, (h) La 3d and Ni 2p, and (i) Fe 2p. XPS patterns of the raw LaFe0.95Ni0.05O3 sample in (j) O 1s, (k) La 3d and Ni 2p, and (l) Fe 2p. XPS patterns of the raw LaFe0.93Ni0.07O3 sample in (m) O 1s, (n) La 3d and Ni 2p, and (o) Fe 2p.
3.4. Absorbance Spectra of LFNO
The UV-vis spectra of raw and Au-coated LFNO are shown in Figure 8a,c, respectively. The energy gap (Eg) and photonic extinction (PE) are determined from the UV-vis spectra, and these two energy levels are calculated with Equation (1) [33]. The diagram of (αhυ)n vs. energy is shown in Figure 8b,d. In Equation (1), α is the absorption coefficient, hν is the photo energy, B is a constant, and n is defined the direct semiconductor (n = 2) or the indirect semiconductor (n = 1/2) [34]. Thereafter, a Tauc plot is used to measure Eg and PE. A value of n = 2 indicates that LFNO is a direct band gap material. Table S2 shows the parameters of the energy and absorbance wavelengths, obtained from Equation (1) and Figure 8b,d for different Ni concentrations. The following observations are noted: (1) Eg decreases as the Ni concentration increases because the NiO can be the active center of the infrared emission [35]; (2) PE tends to move to the visible region after the materials are decorated with sea urchin-like Au NPs; and (3) the maximum absorbance wavelength is augmented. In particular, the PE of Au-coated LaFe0.93Ni0.07O3 is only 1.99 eV, which can be attributed to the following reasons: (1) metal nanostructures scatter light strongly on the sharp tips of sea urchin-like Au NPs; therefore, the SPR are enhanced by several orders of magnitude compared with the incident light and tunes into the near-infrared region [36]; (2) a larger particle size induces the rough surface that can disperse the incident light; and (3) the intrinsic property of the LFNO sample contributes to the light absorbance. Moreover, after coating Au NPs, the PEs are also higher than 1.23 eV (H+/H2), meaning the photo–electro–chemical reaction is more toward HER. As seen in Figure 8e, the maximum absorbance wavelength of the prepared Au colloid solution is 535.2 nm. Therefore, the SPR band is at −2.32 eV (vs. vacuum).
(αhυ)n = B(hυ − Eg)
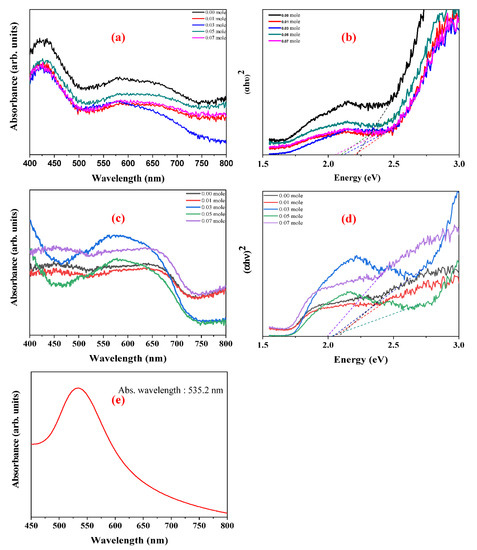
Figure 8.
UV−vis spectra in (a) the raw LFNO samples, (c) the Au−coated LFNO samples, and (e) the Au colloid solution. (αhν)2 vs. energy in (b) the raw LFNO samples, and (d) the Au-coated LFNO samples. Energy was calculated from the Tauc plot.
3.5. Photo–Electro–Chemical Characteristics of Raw LFNO Powders
The valence band level, EVB, is calculated using Equation (2) [37], where hν is 21.1 eV, EFB is the electron binding energy, and ΦSA is the work function. Figure 9a–c show the UPS results for all LaFe1−xNixO3 for each Ni concentration. EFB and ΦSA are measured from the Tauc plot shown in Figure 9b,c, respectively. Finally, the EVB is estimated using Equation (2) and Figure 9b,c. In addition, the conduction band energy, ECB, is evaluated.
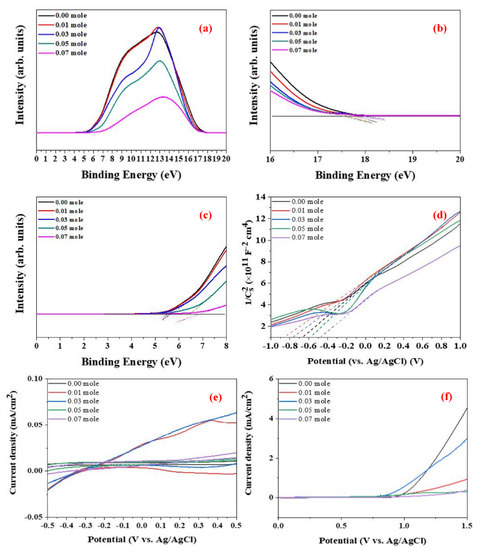
Figure 9.
UPS spectra of the raw LFNO samples in (a) total, (b) electron binding energy, EFB, and (c) work function, ΦSA; these two parameters were calculated from the Tauc plots. (d) Electrochemical analysis in Mott−Schottky plots from which Fermi levels were calculated. (e) C−V curves of the raw LFNO samples in 0.1 M KOH, and (f) LSV of the raw LFNO samples in 0.1 M KOH solution under AM 1.5G.
Figure 9d shows the Mott–Schottky plots of the samples, where the slope crossover with the potential axis indicates the Fermi level. The carrier density is calculated using Equation (3) [38], where ξ is the dielectric constant of the film, ξ0 is the vacuum permittivity, e is the electric charge potential, T is the temperature in Kelvin, k is the Boltzmann constant, V is the applied voltage, VFB is the flat-band potential, ND is the donor density, and CSC is the space charge capacitance. The carrier density increases as the Ni concentration increases, and greater carrier density means that electric and thermal conductivity are promoted. All raw LFNO powders are n-type semiconductors based on the positive slopes of Figure 9d.
EVB = hυ − (EFB − ΦSA)
1/C2SC = 2[V − VFB − (kT/e)]/ξξ0eND
Figure 9e shows the C-V curves, and Figure 9f presents the LSV results. As the Ni concentration increases, the detection range of the redox reaction becomes broader, and LaFe0.93Ni0.07O3 demonstrates the broadest detection range. Additionally, the oxidation reaction is suppressed as the Ni concentration increases. For LSV, LaFe0.93Ni0.07O3 exhibits the largest HER potential. This result implies that the increased particle size with a high Ni concentration can contribute to a large number of active sites and macro-pores for oxygen transportation [39]. Table S3 shows the values of anodic (Epa), cathodic (Epc), and HER derived from the C-V curves and LSV analysis.
3.6. H2 Evolution and Activation Energy of the Au-Coated LFNO
Figure 10a–h show the I-V characteristics of the Au-coated LFNO in ethanol and 1-butanol at different temperatures. The H2 efficiency is calculated using Equation (4) [40], where η is the applied bias compensated solar-to-hydrogen efficiency, Ps is the energy of light irradiation, Iop is the photo-current density, Vop is the applied voltage, and the water electrolysis voltage is 1.23 V. From Figure 10 and Equation (4), the following phenomena are observed. First, the slopes and current densities of the samples tested using ethanol are larger than those of the samples tested using 1-butanol. Second, the H2 efficiencies of all specimens measured in ethanol are approximately 10 times larger than those measured in 1-butanol at any testing temperature. The reason for this is that the resistance of 1-butanol is higher than the resistance of ethanol, as 1-butanol has four carbon atoms in one molecule. The higher resistance results in a loss of conductivity (ohmic loss) and proton activity (kinetic loss) [41]. Equation (5) [42] is used to calculate the real production, where η is the H2 generation efficiency, Ps is the light power (1000 W/m2), A is the area (10−4 m2 for all samples), 237.1 × 10³ is the energy required for forming one mol of H2, and 2.0158 is the molecular weight of one mol of H2. The parameters listed in Tables S4 and S5 represent the data obtained from Figure 10 and Equation (4). Tijare et al. found that LaFeO3, owing to the high visible-light activity, demonstrated the maximum H2 generation (3315 μmol g−1 h−1) [43]. Moreover, the H2 evolution rate of CdS-Au/MoS2 was up to 7010 μmol g−1 h−1 [19]. In this study, the real H2 production of all samples is a lot larger than 3315 μmol g−1 h−1, regardless of the temperature or solvent. However, in this study, the greatest amount of real H2 production is approximately 43,800 μmol g−1 h−1 in ethanol. Some representative perovskites (PVKs) for photocatalytic water splitting are listed in Table 1 [44,45,46,47,48,49,50,51,52,53,54,55,56,57,58,59].
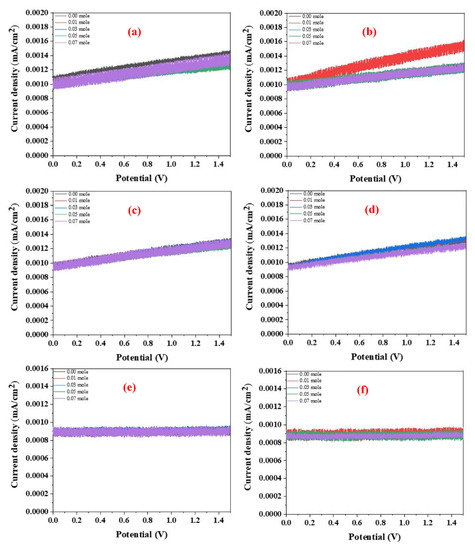
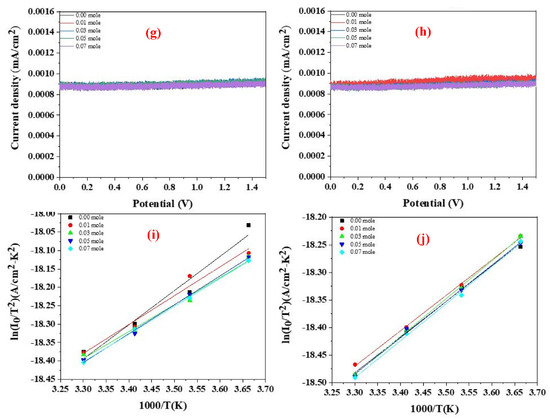
Figure 10.
I−V curves of the Au−coated LFNO samples in ethanol with different temperatures under AM 1.5G in (a) at 0 °C, (b) at 10 °C, (c) at 20 °C, and (d) at 30 °C. I−V curves of the Au−coated LFNO samples in 1−butanol with different temperatures under AM 1.5G in (e) at 0 °C, (f) at 10 °C, (g) at 20 °C, and (h) at 30 °C. Richardson plots of the Au−coated LFNO samples were tested in (i) ethanol and (j) 1−butanol.

Table 1.
The comparison of the photocatalytic HER performance of PVKs.
The activation energies, Ea, are obtained using the Richardson plot and Equation (6) [60], where I0 is the reverse saturation current in the I-V curves, T is the temperature in Kelvin, k is the Boltzmann constant, Φbo is the zero bias effective barrier height, q is the electronic charge, A is the working electrode area, and A* is the Richardson constant. Figure 10i,j show the Richardson plots for samples tested in ethanol and 1-butanol, respectively. From these results, the Ea of all Au-coated LFNO specimens measured in ethanol are smaller than the Ea measured in 1-butanol. This result implies that electrons are rapidly and easily transferred to H+ in ethanol, thereby generating more H2. For the definition of the kinetic loss, the sequential proton loss electron transfer mechanism includes two steps: (1) the deprotonation of the antioxidant, and (2) the transfer of an electron to the free radical. The compounds that can react these continuous processes result in the radical adduct formation, hydrogen transfer, and single electron transfer [61]. For 1-butanol, the low activation energy indicates that the pKa is also low, resulting in the slow proton exchange reaction. The values of the activation energies of each Au-coated specimen obtained from Equation (6) and Figure 10i,j are presented in Table S6.
η = |1.23 − Vop| × Iop/Ps (Ps:1000 [W/m2])
Real production:
[μmolg−1h−1] = η × Ps × A × 237.2 × 10³ [J/mol] × (2.0158 [mol/g] × 3600 [s]) × 106
I0 = AA*T2exp(−qΦb0/kT)
3.7. Energy Level Diagram and Scheme of H2 Generation
Figure 11a shows the energy level diagram of the raw LFNO samples with different Ni concentrations. The values of EVB, Eg, ECB, EFB, and water splitting for the energy level vs. vacuum are shown. Table S7 indicates the parameters of the energy level diagram of raw LFNO (vs. vacuum) from Figure 11a. All the band gaps of the raw LFNO samples are greater than 1.23 eV (H+/H2). Thus, these materials are suitable to act as photocathodes.
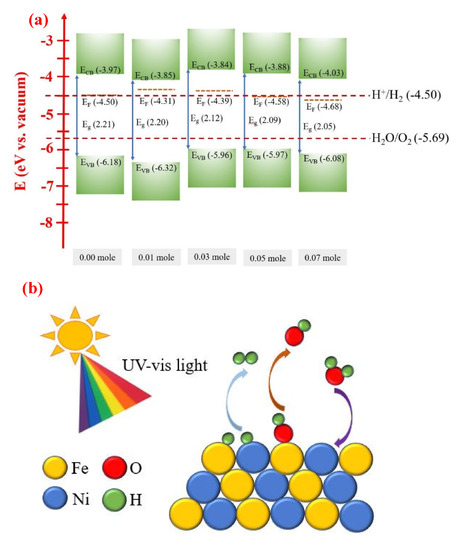
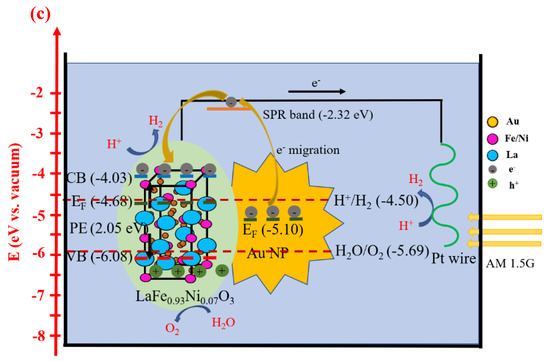
Figure 11.
(a) Energy level diagram of the raw LFNO samples with different Ni mol concentrations, (b) the main reactions of photogenerated charges of the raw LFNO samples under AM 1.5G, and (c) H2 evolution scheme of the Au-coated LaFe0.93Ni0.07O3 sample under AM 1.5G.
Figure 11b shows the main reactions of raw LFNO samples under AM 1.5G, and the Fenton-like reaction happens. When the light is luminated on the samples in the solvent, the photogenerated charges, the electrons, and OH• radicals appear. Then, the electrons transfer to Fe3+, and OH• radicals move to Fe2+. The redox reactions are repeated and recycled between Fe3+ and Fe2+. The reduction reaction of Fe3+ to Fe2+ and the oxidization reaction of Fe2+ to Fe3+ are described by Equation (7) and Equation (8) [62]. The prime amounts of OH• radicals are produced using Fe3+ under AM 1.5G, and OH• radicals also simultaneously react with NiO. Equation (9) [63] indicates the oxygen gas generated under the visible light. Ni–Fe compounds are beneficial for the water dissociation into H+ and OH− ions [64].
Fe3+ + H2O2 → Fe2+ + OH• + H+
Fe2+ + H2O2 → Fe3+ + OH• + OH−
O2 + H+ + e− + hυ → 1/2 H2O2 + 1/2 O2
Furthermore, Figure 11c shows the H2 evolution scheme of the Au-coated LaFe0.93Ni0.07O3 sample under AM 1.5G. Subsequently, Au supports the more optimized condition, which adds the extra active sites and allows the electrons to transfer rapidly for the hydrogen adsorption and the hydrogen gas formation. The hot electrons overcome the barrier at the interface between Au NPs and LaFe0.93Ni0.97O3 owing to SPR. The SPR energy is −2.32 eV. Therefore, more electrons are tunneled to the conduction band of LaFe0.93Ni0.97O3, leading to H2 generation. For Au-loaded semiconductors, the abilities of harvesting and absorbing light are promoted [65]. In this study, connecting the optical and electrocatalytic reactive interface between the LFNO semiconductor and the Au NP as a PEC cell can drastically enhance the H2 production efficiency in ethanol. This hybrid structure is satisfied with these conditions, the narrow band gaps, the rough surface, the contributions of SPR of Au NPs, and the coupling effect between LFNO-Au. Importantly, the energy in loss is decreaseddue to the plasmon-induced carriers of Au NPs [66], and there are the added active sites which arise from Au NPs. Thus, the photogenerated hot electrons provide high efficiency to generate the H2 reduction reaction.
4. Conclusions
In this work, double perovskite LaFe1−xNixO3 decorated with urchin-like Au NPs were synthesized. All raw LaFe1−xNixO3 powders exhibited high crystallinities, as indicated by the XRD and SAD patterns. In addition, La2O3 and La(OH)3 were found to co-exist. With the increasing Ni concentration, the following advantages were noted: (1) the generation of more active sites, (2) a lower band gap, (3) a higher carrier density, (4) a wider range of redox reaction, (5) HER potential toward a more positive value, and (6) smaller d-spacing. After coating with Au NPs, the PEs of all specimens reduced below 2.10 eV, and the absorbance wavelength occurred in the redshift due to the light scattering using Au NPs, the rough surface, and the intrinsic property of the samples. More light in the visible region was absorbed and harvested due to the hybrid structure. Moreover, larger specimen particle sizes induced more active sites. The average size of the sea urchin-like Au NPs was approximately 109.83 ± 8.48 nm. All the band gaps of the raw LFNO samples were higher than 1.23 eV (H+/H2). The H2 efficiency was 10 times higher in ethanol than that in 1-butanol because ohmic and kinetic losses resulted in the electrons or protons transferring on the surface of the electrode slowly in 1-butanol. That ethanol had lower activation energy resulted in the charges and protons transferring rapidly. The redox reactions were recycled among Fe3+, Fe2+, NiO, and hydroxyl. More photogenerated carriers were tunneled from Au NPs to the ECB of the raw LFNO samples due to the SPR, the coupling effect, and the additionally active sites from Au NPs. This heterojunction structure was proven to develop the HER process.
Supplementary Materials
The following supporting information can be downloaded at: https://www.mdpi.com/article/10.3390/nano12040622/s1, Table S1: Particle sizes of the raw LFNO samples with different Ni concentrations, Table S2: UV-vis properties of the raw and Au-coated LFNO samples with different Ni concentrations, Table S3: Electrochemical properties of the raw LFNO samples with different Ni concentrations in 0.1 M KOH solution, Table S4: Hydrogen efficiency and real production of the Au-coated LFNO samples with different Ni concentrations in ethanol under AM 1.5G at different temperatures, Table S5: Hydrogen efficiency and real production of the Au-coated LFNO samples with different Ni concentrations in 1-butanol under AM 1.5G at different temperatures, Table S6: Activation energy, Ea, of the Au-coated LFNO samples with different Ni concentrations in ethanol and 1-butanol, Table S7: Parameters of the energy level diagram (vs. vacuum) of the raw LFNO samples with different Ni concentrations.
Author Contributions
Conceptualization, Y.-H.S. and H.-W.T.; methodology, writing—original draft preparation, and instrument analysis, H.-W.T.; supervision and project administration, Y.-H.S. All authors have read and agreed to the published version of the manuscript.
Funding
This research was supported by the Ministry of Science and Technology of Taiwan (grant no. M109-2221-E-024-MY3).
Institutional Review Board Statement
Ethical review and approval were waived for this study due to not involving human, or any animal experiment.
Informed Consent Statement
Not applicable.
Data Availability Statement
Image files must not be manipulated or adjusted in any way that could lead to misinterpretation of the information provided by the original image. Irregular manipulation includes (1) introduction, enhancement, moving, or removing features from the original image, (2) grouping of images that should obviously be presented separately (e.g., from different parts of the same gel, or from different gels), or (3) modifying the contrast, brightness or color balance to obscure, eliminate or enhance some information.
Acknowledgments
The authors are grateful to the Center of Micro/Nano Science and Technology, Taiwan, for providing assistance.
Conflicts of Interest
The authors declare no conflict of interest.
References
- Wang, H.P.; Wang, J.; Pi, Y.C.; Shao, Q.; Tan, Y.M.; Huang, X.Q. Double perovskite LaFexNi1-xO3 nanorods enable efficient oxygen evolution electrocatalysis. Angew. Chem. Int. Ed. Engl. 2019, 58, 2316–2320. [Google Scholar] [CrossRef] [PubMed]
- Hwang, J.; Rao, R.R.; Giordano, L.; Katayama, Y.; Yu, Y.; Shao-Horn, Y. Perovskites in catalysis and electrocatalysis. Science 2017, 358, 751–756. [Google Scholar] [CrossRef] [PubMed] [Green Version]
- Hossain, A.; Bandyopadhyay, P.; Roy, S. An overview of double perovskites A2 B′B″O6 with small ions at A site: Synthesis, structure and magnetic properties. J. Alloys Compd. 2018, 740, 414–427. [Google Scholar] [CrossRef]
- Guan, D.; Zhou, J.; Huang, Y.-C.; Dong, C.-L.; Wang, J.-Q.; Zhou, W.; Shao, Z. Screening highly active perovskites for hydrogen-evolving reaction via unifying ionic electronegativity descriptor. Nat. Commun. 2019, 10, 1–8. [Google Scholar] [CrossRef]
- Idrees, M.; Nadeem, M.; Mehmood, M.; Atif, M.; Chae, K.H.; Hassan, M.M. Impedance spectriscopic investigation of delocali-zation effect of disorder induced by Ni doping in LaFeO3. J. Phys. D Appl. Phys. 2011, 44, 1–12. [Google Scholar] [CrossRef]
- Kanamori, J. The screening of excess d holes by s and p electrons in nickel. Laser Processing Chem. 1981, 29, 102–108. [Google Scholar]
- Liu, X.G.; Wg, X.; Yuan, X.T.; Dong, W.J.; Huang, Q.F. Rational composition and structural design of in situ grown nick-el-based electrocatalysts for efficient water electrolysis. J. Mater. Chem. A 2016, 4, 167–172. [Google Scholar] [CrossRef]
- Huang, H.; Li, K.; Chen, Z.; Luo, L.; Gu, Y.; Zhang, D.; Ma, C.; Si, R.; Yang, J.; Peng, Z.; et al. Achieving remarkable activity and durability toward oxygen reduction reaction based on ultrathin Rh-doped Pt nanowires. J. Am. Chem. Soc. 2017, 139, 8152–8159. [Google Scholar] [CrossRef]
- Yin, J.; Li, Y.X.; Lv, F.; Lu, M.; Sun, K.; Wang, W.; Wang, L.; Cheng, F.G.; Li, Y.F.; Xi, P.X. Oxygen vacancies dominated NiS2/CoS2 interface porous nanowires for portable Zn-air batteries driven water splitting devices. Adv. Mater. 2017, 29, 1–8. [Google Scholar] [CrossRef]
- Wang, J.; Cui, W.; Liu, Q.; Xing, Z.; Asiri, A.M.; Sun, X. Recent progress in cobalt-based heterogeneous catalysts for electrochemical water splitting. Adv. Mater. 2016, 28, 215–230. [Google Scholar] [CrossRef]
- Peng, Y.; Wang, L.; Luo, Q.; Cao, Y.; Dai, Y.; Li, H.; Zheng, X.; Yan, W.; Yang, J.; Zeng, J. Molecular-level insight into how hydroxyl groups boost catalytic activity in CO2 hydrogenation into methanol. Chem. 2018, 4, 613–625. [Google Scholar] [CrossRef] [Green Version]
- Jiang, K.; Siahrostami, S.; Zheng, T.; Hu, Y.; Hwang, S.; Stavitski, E.; Peng, Y.; Dynes, J.; Gangisetty, M.; Su, D.; et al. Isolated Ni single atoms in graphene nanosheets for high-performance CO2 reduction. Energy Environ. Sci. 2018, 11, 893–903. [Google Scholar] [CrossRef]
- Pi, Y.; Shao, Q.; Wang, P.; Lv, F.; Guo, S.; Guo, J.; Huang, X. Trimetallic oxyhydroxide coralloids for efficient oxygen evolution electrocatalysis. Angew. Chem. Int. Ed. 2017, 56, 4502–4506. [Google Scholar] [CrossRef]
- Wang, H.; Xia, Y.; Li, H.; Wang, X.; Yu, Y.; Jiao, X.; Chen, D. Highly active deficient ternary sulfide photoanode for photoelectrochemical water splitting. Nat. Commun. 2020, 11, 1–11. [Google Scholar] [CrossRef] [PubMed]
- Wang, Y.; Wu, Y.; Schwartz, J.; Sung, S.H.; Hovden, R.; Mi, Z. A single-junction cathodic approach for stable unassisted solar water splitting. Joule 2019, 3, 2444–2456. [Google Scholar] [CrossRef]
- Chandrasekaran, S.; Yao, L.; Deng, L.; Bowen, C.; Zhang, Y.; Chen, S.; Lin, Z.; Peng, F.; Zhang, P. Recent advances in metal sulfides: From controlled fabrication to electrocatalytic, photocatalytic and photoelectrochemical water splitting and beyond. Chem. Soc. Rev. 2019, 48, 4178–4280. [Google Scholar] [CrossRef]
- Nicoletti, O.; de la Peña, F.; Leary, R.K.; Holland, D.; Ducati, C.; Midgley, P. Three-dimensional imaging of localized surface plasmon resonances of metal nanoparticles. Nature 2013, 502, 80–84. [Google Scholar] [CrossRef]
- Moon, C.W.; Choi, M.J.; Hyun, J.K.; Jang, H.W. Enhancing photoelectrochemical water splitting with plasmonic Au nano-particles. Nanoscale Adv. 2021, 3, 5981–6006. [Google Scholar] [CrossRef]
- Liebig, F.; Henning, R.; Sarhan, R.M.; Prietzel, C.; Schmitt, C.N.Z.; Bargheer, M.; Koetz, J. A Simple One-step procedure to synthesise gold nanostars in concentrated aqueous surfactant solution. RSC Adv. 2019, 9, 23633–23641. [Google Scholar] [CrossRef] [Green Version]
- Yoshimura, M.; Byrappa, K. Hydrothermal processing of materials: Past, present and future. J. Mater. Sci. 2008, 43, 2085–2103. [Google Scholar] [CrossRef]
- Yoshimura, M. Soft solution processing: Concept and realization of direct fabrication of shaped ceramics (nano-crystals, whiskers, films, and/or patterns) in solutions without post-firing. J. Mater. Sci. 2006, 41, 1299–1306. [Google Scholar] [CrossRef]
- Lin, Q.; Yang, X.; Lin, J.; Guo, Z.; He, Y. The structure and magnetic properties of magnesium-substituted LaFeO3 perovskite negative electrode material by citrate sol-gel. Int. J. Hydrog. Energy 2018, 43, 12720–12729. [Google Scholar] [CrossRef]
- Singh, A.; Palakollu, V.; Pandey, A.; Kanvah, S.; Sharma, S. Green synthesis of 1,4-benzodiazepines over La2O3 and La(OH)3 catalysts: Possibility of Langmuir–Hinshelwood adsorption. RSC Adv. 2016, 6, 103455–103462. [Google Scholar] [CrossRef] [Green Version]
- Kang, J.-G.; Kim, Y.-I.; Cho, D.W.; Sohn, Y. Synthesis and physicochemical properties of La(OH)3 and La2O3 nanostructures. Mater. Sci. Semicond. Process. 2015, 40, 737–743. [Google Scholar] [CrossRef]
- Simoes, M.C.; Hughes, K.J.; Ingham, D.B.; Ma, L.; Pourkashanian, M. Estimation of the thermochemical radii and ionic volumes of complex ions. Inorg. Chem. 2017, 56, 7566–7573. [Google Scholar] [CrossRef]
- Liu, B.; Liu, L.R.; Liu, X.J.; Xiao, Y.S. Varian of crystal structure in nickel nanoparticles filled in carbon nanotubes. Mat. Sci. Technol. 2012, 28, 1345–1348. [Google Scholar] [CrossRef]
- Chen, Q.; El Gabaly, F.; Akgul, F.A.; Liu, Z.; Mun, B.S.; Yamaguchi, S.; Braun, A. Observation of oxygen vacancy filling under water vapor in ceramic proton conductors in situ with ambient pressure XPS. Chem. Mater. 2013, 25, 4690–4696. [Google Scholar] [CrossRef]
- Yin, R.Y.; Liu, M.Y.; Tang, R.; Yin, L.W. CdS nanoparticle-modified α-Fe2O3/TiO2 nanorod array photoanode for efficient photoelectro-chemical water oxidation. Nanoscale Res. Lett. 2017, 12, 1–8. [Google Scholar] [CrossRef] [Green Version]
- Qiu, Y.; Gao, R.; Yang, W.; Huang, L.; Mao, Q.; Yang, J.; Sun, L.; Hu, Z.; Liu, X. Understanding the enhancement mechanism of A-site-deficient LaxNiO3 as an oxygen redox catalyst. Chem. Mater. 2020, 32, 1864–1875. [Google Scholar] [CrossRef]
- Wong, H.; Iwai, H.; Kakushima, K.; Yang, B.L.; Chu, P. XPS study of the bonding properties of lanthanum oxide/silicon interface with a trace amount of nitrogen incorporation. J. Electrochem. Soc. 2010, 157, 49–52. [Google Scholar] [CrossRef] [Green Version]
- Grosvenor, A.P.; Biesinger, M.C.; Smart, R.S.C.; McIntyre, N.S. New interpretations of XPS spectra of nickel metal and oxides. Surf. Sci. 2006, 600, 1771–1779. [Google Scholar] [CrossRef]
- Cao, K.; Cao, E.; Zhang, Y.J.; Hao, W.T.; Sun, L.; Peng, H. The influence of nonstoichiometry on electrical transport and ethanol sensing characteristics for nanocrystalline LaFexO3-δ Sensors. Sens. Actuat. B 2016, 230, 592–599. [Google Scholar] [CrossRef]
- Sumalatha, C.; Doddoji, R.; Venkateswarlu, M.; Rani, P.R.; Swapna, K.; Mahamuda, S.; Rao, A. White light emission from Dy3+-doped ZnO + Bi2O3 + BaF2 + B2O3 + TeO2 glasses: Structural and spectroscopic properties. Spectrochim. Acta Part A Mol. Biomol. Spectrosc. 2020, 240, 1–9. [Google Scholar] [CrossRef]
- Warkhade, S.K.; Gaikwad, G.; Zodape, S.P.; Pratap, U.; Maldhure, A.V.; Wankhade, A. Low temperature synthesis of pure anatase carbon doped titanium dioxide: An efficient visible light active photocatalyst. Mater. Sci. Semicond. Process. 2017, 63, 18–24. [Google Scholar] [CrossRef]
- Li, N.; Yuan, H.; Xu, L.; Zeng, Y.; Qiang, B.; Wang, Q.J.; Zheng, S.; Cai, H.; Lee, L.Y.T.; Singh, N.; et al. Tailorable infrared emission of microelectromechanical system-based thermal emitters with NiO films for gas sensing. Opt. Express 2021, 29, 19084–19093. [Google Scholar] [CrossRef]
- Niu, W.; Chua, Y.A.A.; Zhang, W.; Huang, H.; Lu, X. Highly symmetric gold nanostars: Crystallographic control and surface-enhanced Raman scattering property. J. Am. Chem. Soc. 2015, 137, 10460–10463. [Google Scholar] [CrossRef] [PubMed]
- Greczynski, G.; Hultman, L. X-ray photoelectron spectroscopy: Towards reliable binding energy referencing. Prog. Mater. Sci. 2020, 107, 1–46. [Google Scholar] [CrossRef]
- Harriangton, S.P.; Devine, T.M. Analysis of electrodes displaying frequency dispersion in Mott-Schottky tests. J. Electrochem. Soc. 2008, 155, 381–386. [Google Scholar] [CrossRef]
- Lin, H.; Liu, P.; Wang, S.; Zhang, Z.; Dai, Z.; Tan, S.; Chen, D. A highly efficient electrocatalyst for oxygen reduction reaction: Three-dimensionally ordered macroporous perovskite LaMnO3. J. Power Sources 2019, 412, 701–709. [Google Scholar] [CrossRef]
- Hisatomi, T.; Kubota, J.; Domen, K. Recent advances in semiconductors for photocatalytic and photoelectrochemical water splitting. Chem. Soc. Rev. 2014, 43, 7520–7535. [Google Scholar] [CrossRef]
- Mehrabadi, B.A.T.; Dinh, H.N.; Bender, G.; Weidner, J.W. Effect of system contaminants on the performance of a proton exchange membrane fuel cell. J. Electrochem. Soc. 2016, 163, 1527–1534. [Google Scholar] [CrossRef]
- Tamiolakis, I.; Liu, D.; Xiao, F.-X.; Xie, J.; Papadas, I.T.; Salim, T.; Liu, B.; Zhang, Q.; Choulis, S.A.; Armatas, G.S. Mesoporous implantable Pt/SrTiO3: C,N nanocuboids delivering enhanced photocatalytic H2-production activity via plasmon-induced interfacial electron transfer. Appl. Catal. B Environ. 2018, 236, 338–347. [Google Scholar] [CrossRef]
- Hu, C.-C.; Lee, Y.-L.; Teng, H. Efficient water splitting over Na1−xKxTaO3 photocatalysts with cubic perovskite structure. J. Mater. Chem. 2011, 21, 3824–3830. [Google Scholar] [CrossRef]
- Li, J.; Zeng, J.; Jia, L.; Fang, W. Investigations on the effect of Cu2+/Cu1+ redox couples and oxygen vacancies on photocatalytic activity of treated LaNi1-xCuxO3 (x = 0.1, 0.4, 0.5). Int. J. Hydrog. Energy 2010, 35, 12733–12740. [Google Scholar] [CrossRef]
- Wang, X.; Hisatomi, T.; Wang, Z.; Song, J.; Qu, J.; Takata, T.; Domen, K. Core–shell-structured LaTaON2 transformed from LaKNaTaO5 plates for enhanced photocatalytic H2 evolution. Angew. Chem. Int. Ed. 2019, 58, 10666–10670. [Google Scholar] [CrossRef]
- Oshima, T.; Ichibha, T.; Oqmhula, K.; Hibino, K.; Mogi, H.; Yamashita, S.; Fujii, K.; Miseki, Y.; Hongo, K.; Lu, D.; et al. Two-dimensional Peroskite Oxynitride K2LaTa2O6N with an H+/K+ exchangeability in aqueous solution forming a stable photocatalyst for visible-light H2 evolution. Angew. Chem. Int. Ed. 2020, 59, 9736–9743. [Google Scholar] [CrossRef]
- Zhang, G.; Sun, S.; Jiang, W.; Miao, X.; Zhao, Z.; Zhang, X.; Qu, D.; Zhang, D.; Li, D.; Sun, Z. A Novel perovskite SrTiO3-Ba2FeNbO6 solid solution for visible light photocatalytic hydrogen production. Adv. Energy Mater. 2017, 7, 1–7. [Google Scholar]
- Zhang, F.; Yamakata, A.; Maeda, K.; Moriya, Y.; Takata, T.; Kubota, J.; Teshima, K.; Oishi, S.; Domen, K. Cobalt-modified porous single-crystalline LaTiO2N for highly efficient water oxidation under visible light. J. Am. Chem. Soc. 2012, 134, 8348–8351. [Google Scholar] [CrossRef]
- Lv, M.; Sun, X.; Wei, S.; Shen, C.; Mi, Y.; Xu, X. Ultrathin lanthanum tantalate perovskite nanosheets modified by Nitrogen doping for efficient photocatalytic water splitting. ACS Nano. 2017, 11, 11441–11448. [Google Scholar] [CrossRef] [PubMed]
- Dong, B.; Cui, J.; Liu, T.; Gao, Y.; Qi, Y.; Li, D.; Xiong, F.; Zhang, F.; Li, C. Development of novel perovskite-like oxide photo-catalyst LiCuTa3O9 with dual functions of water reduction and oxidation under visible light irradiation. Adv. Energy Mater. 2018, 8, 1–7. [Google Scholar] [CrossRef]
- Pan, C.; Takata, T.; Nakabayashi, M.; Matsumoto, T.; Shibata, N.; Ikuhara, Y.; Domen, K. A Complex perovskite-type oxyni-tride: The first photocatalyst for water splitting operable at up to 600 nm. Angew. Chem. Int. Ed. 2015, 54, 2955–2959. [Google Scholar] [CrossRef] [PubMed]
- Wei, Z.; Liu, J.; Fang, W.; Qin, Z.; Jiang, Z.; Shangguan, W. A visible-light driven novel layered perovskite oxyhalide Bi4MO8X (M = Nb, Ta; X = Cl, Br) constructed using BiOX (X = Cl, Br) for enhanced photocatalytic hydrogen evolution. Catal. Sci. Technol. 2018, 8, 3774–3784. [Google Scholar] [CrossRef]
- Wang, T.; Yue, D.; Li, X.; Zhao, Y. Lead-free double perovskite Cs2AgBiBr6/RGO composite for efficient visible light photo-catalytic H2 Evolution. Appl. Catal. B. 2020, 268, 1–7. [Google Scholar] [CrossRef]
- Ju, D.; Zheng, X.; Liu, J.; Chen, Y.; Zhang, J.; Cao, B.; Xiao, H.; Mohammed, O.F.; Bakr, O.M.; Tao, X. Reversible band gap narrowing of Sn-based hybrid perovskite single crystal with excellent phase stability. Angew. Chem. Int. Ed. 2018, 57, 14868–14872. [Google Scholar] [CrossRef] [Green Version]
- Cai, C.; Teng, Y.; Wu, J.H.; Li, J.Y.; Chen, H.Y.; Chen, J.H.; Kuang, D.B. In situ photosynthesis of an MAPBI3/CoP hybrid heterojunction for efficient photocatalytic hydrogen evolution. Adv. Funct. Mater. 2020, 30, 1–8. [Google Scholar] [CrossRef]
- Wu, Y.; Wang, P.; Guan, Z.; Liu, J.; Wang, Z.; Zheng, Z.; Jin, S.; Dai, Y.; Whangbo, M.-H.; Huang, B. Enhancing the photocatalytic hydrogen evolution activity of mixed-halide perovskite CH3NH3PbBr3–xIx achieved by bandgap funneling of charge carriers. ACS Catal. 2018, 8, 10349–10357. [Google Scholar] [CrossRef]
- Guan, Z.; Wu, Y.; Wang, P.; Zhang, Q.; Wang, Z.; Zheng, Z.; Liu, Y.; Dai, Y.; Whangbo, M.-H.; Huang, B. Perovskite photocatalyst CsPbBr3-xIx with a bandgap funnel structure for H2 evolution under visible light. Appl. Catal. B: Environ. 2019, 245, 522–527. [Google Scholar] [CrossRef]
- Liao, C.-H.; Huang, C.-W.; Wu, J.C.S. Hydrogen production from semiconductor-based photocatalysis via water splitting. Catalysts 2012, 2, 490–516. [Google Scholar] [CrossRef] [Green Version]
- Tijare, S.N.; Joshi, M.V.; Padole, P.S.; Mangrulkar, P.A.; Rayalu, S.S.; Labhsetwar, N.K. Photocatalytic hydrogen generation through water splitting on nano-crystalline LaFeO3 perovskite. Int. J. Hydrog. Energy 2012, 37, 10451–10456. [Google Scholar] [CrossRef]
- Jyothi, I.; Yang, H.-D.; Shim, K.-H.; Janardhanam, V.; Kang, S.-M.; Hong, H.; Choi, C.-J. Temperature dependency of Schottky barrier parameters of Ti Schottky contacts to Si-on-insulator. Mater. Trans. 2013, 54, 1655–1660. [Google Scholar] [CrossRef] [Green Version]
- Diduk, R.A.; Galano, A.; Tan, D.X.; Reiter, R.J. The key role of the sequential proton loss electron transfer mechanism on the free radical scavenging activity of some melatonin-related compounds. Theor. Chim. Acta 2016, 135, 38. [Google Scholar] [CrossRef]
- Baba, Y.; Yatagai, T.; Harada, T.; Kawase, Y. Hydroxyl radical generation in the photo-Fenton process: Effects of carboxylic acids on iron redox cycling. Chem. Eng. J. 2015, 277, 229–241. [Google Scholar] [CrossRef]
- Jung, O.; Pegis, M.L.; Wang, Z.; Banerjee, G.; Nemes, C.T.; Hoffeditz, W.L.; Hupp, J.T.; Schmuttenmaer, C.A.; Brudvig, G.W.; Mayer, J.M. Highly active NiO photocathodes for H2O2 production enabled via outersphere electron Transfer. J. Am. Chem. Soc. 2018, 140, 4079–4084. [Google Scholar] [CrossRef] [PubMed]
- Xue, S.; Haid, R.W.; Kluge, R.M.; Ding, X.; Garlyyev, B.; Fichtner, J.; Watzele, S.; Hou, S.; Bandarenka, A.S. Enhancing the hydrogen evolution reaction cctivity of platinum electrodes in alkaline media using nickel–iron clusters. Angew. Chem. Int. Ed. 2020, 59, 10934–10938. [Google Scholar] [CrossRef]
- Sönnichsen, C.; Franzl, T.; Wilk, T.; von Plessen, G.; Feldmann, J.; Wilson, O.; Mulvaney, P. Drastic reduction of plasmon damping in gold nanorods. Phys. Rev. Lett. 2002, 88, 1–4. [Google Scholar] [CrossRef]
- Takakura, R.; Oshikiri, T.; Ueno, K.; Shi, X.; Kondo, T.; Masuda, H.; Misawa, H. Water splitting using a three-dimensional plasmonic photoanode with titanium oxide nano-tunnels. Green Chem. 2017, 19, 2398–2405. [Google Scholar] [CrossRef]
Publisher’s Note: MDPI stays neutral with regard to jurisdictional claims in published maps and institutional affiliations. |
© 2022 by the authors. Licensee MDPI, Basel, Switzerland. This article is an open access article distributed under the terms and conditions of the Creative Commons Attribution (CC BY) license (https://creativecommons.org/licenses/by/4.0/).