Abstract
An approach to the detection of F− ions in food samples was developed based on a “switch-off-on” fluorescence probe of silicon nanoparticles (SiNPs). The fluorescence of the synthetic SiNPs was gradually quenched in the presence of Fe3+ ion and slightly recovered with the addition of F− ion owing to the formation of a stable and colorless ferric fluoride. The fluorescence recovery exhibited a good linear relationship (R2 = 0.9992) as the concentration of F− ion increased from 0 to 100 μmol·L−1. The detection limit of the established method of F− ion was 0.05 μmol·L−1. The recovery experiments confirmed the accuracy and reliability of the proposed method. The ultraviolet–visible spectra, fluorescence decays, and zeta potentials evidenced the fluorescence quenching mechanism involving the electron transfer between the SiNPs and Fe3+ ion, while the fluorescence recovery resulted from the formation of ferric fluoride. Finally, SiNPs were successfully applied to detect F− ions in tap water, Antarctic krill, and Antarctic krill powder.
1. Introduction
Silicon nanoparticles (SiNPs) have attracted extensive attention in several fields because of their availability in abundance, excellent optical properties, and biocompatibility [1,2,3,4,5,6]. At present, SiNPs feature the metrics of low cost, simple preparation, good water solubility, controllable surface, and high fluorescence quantum yield, which enable them to be environmentally friendly fluorescence probes [7,8,9]. Over the past two decades, tremendous progress has been made in the fluorescence sensor region of SiNPs for intrinsic nontoxicity, which are deemed to be suitable alternatives to traditional II–VI quantum dots [10,11]. Previous works have reported the successful use of SiNPs for the detection of Cu2+ [12], Hg2+ [13], dopamine [14], heparin [15], 2,4,6-trinitrophenol [16], phosphatase [17], glutathione [18], nitrite [19], chromium [20], cysteine [21], chlorogenic acid [22], and tetracycline [23]. However, there are few studies regarding the use of SiNPs as a probe for the detection of F− ion.
As an essential element, fluorine plays an important role in many aspects of human health, such as dental care and clinical treatment for osteoporosis [24,25]. However, abnormal levels of F− ions can damage aquatic organisms and plants, and lead to several human health issues, including dental health issues, osteoporosis, and acute stomach ulcers [26,27,28]. Therefore, there is a demand for rapid and accurate quantitative methods for the detection of F− ions. Thus far, various determination approaches for F− ions have been developed using the colorimetric method [29,30], ion chromatography [31], gas chromatography [32], and the fluorescence method [33,34]. Among these strategies, the fluorescence method, based on optical probes, has been widely investigated owing to its simplicity, high sensitivity, good selectivity, fast response, and intuitiveness [35,36,37,38,39]. F− ions exhibit the highest charge density, smallest ionic radius, a hard Lewis basic nature, and the most electronegative atom, which enable them to easily combine with metal ions to form the stable compounds [40]. According to this mechanism, many researchers have designed fluorescence sensors to detect the metal ions and F− ions, e.g., Mg [41], Al [42,43,44], Fe-EDTA [45], Ca [46], Hg [47], and Eu [48]. To the best of our knowledge, fluorescence SiNPs have not been used as an environmentally friendly material for the detection of F− ions based on the formation of FeFn- compounds.
Herein, we developed a facile determination approach for F− ions utilizing novel fluorescence SiNPs based on an “off-on” mechanism, as illustrated in Scheme 1. The synthetic SiNPs simultaneously featured bright blue fluorescence with a fluorescence quantum yield of 73.8% and excellent photostability. In a previous study [49], we found that the fluorescence of SiNPs was quenched by Fe3+ ion. In this work, we demonstrate that the quenched fluorescence of SiNPs can be restored by the addition of F− ion because of the formation of a stable colorless ferric fluoride. The fluorescence quenching and recovery mechanisms were investigated by using ultraviolet–visible (UV–vis) absorption and fluorescence decay curves. The fluorescence intensity recovery and the F− ion concentrations ranging from 0 to 100 μmol·L−1 exhibited a good linear relationship with a correlation coefficient of 0.9992 and a lower limit detection of 0.05 μmol·L−1. A recovery assay demonstrated the accuracy and reliability of the developed method for the detection of F− ion in water and food samples.
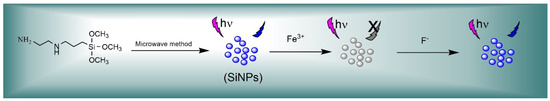
Scheme 1.
Detection of F− ions based on an off-on fluorescence SiNPs.
2. Experimental Section
2.1. Materials
N-[3-(trimethoxysilyl)propyl]ethylenesiamine (DAMO, ≥99.5%), trisodium citrate dehydrate (SC, ≥99.0%), and glycerol were purchased from J&K Scientific Ltd. (Beijing, China). Trimethylol aminomethane (Tris, ≥99.0%), HCl, NaF, NaCl, NaBr, Na2SO4, NaNO3, NaHCO3, Na3PO4, Na2HPO4, NaH2PO4, NaAc, and NaSCN were purchased from Sinopharm Chemical Reagent Co., Ltd. (Shanghai, China). 1,10-Phenanthroline (99%) was provided by Shanghai Aladdin Biochemical Technology Co., Ltd. (Shanghai, China). Fe3+ standard solution (1 mg·mL−1) and F− standard solution (1 mg mL−1) were purchased from the National Non-Ferrous Metal and Electronic Materials Analysis and Testing Center. Ultrapure water was used for all the experiments. All the reagents were used without further purification. The Antarctic krill (Euphausia superba) sample was provided by China′s 36th Antarctic Scientific Expedition.
2.2. Instruments
The microwave reactor was purchased from Xi’an Yu Hui Instrument Co., Ltd. (Shaanxi, China). A JEM-2100F transmission electron microscope (JEOL, Tokyo, Japan) was used to capture transmission electron microscopy (TEM) images and high-resolution transmission electron microscopy (HRTEM) images at an acceleration voltage of 200 kV. X-ray photoelectron spectroscopy (XPS) was performed using a Thermo ScientificTM K-AlphaTM+ (Waltham, MA, USA) spectrometer equipped with a monochromatic Al Kα X-ray source (1486.6 eV) operating at 100 W (Thermo, Waltham, MA, USA). All peaks were calibrated according to the binding energy of the C1s peak (284.8 eV) of adventitious carbon. Inductively coupled plasma emission spectroscopy (ICP-OES) was performed using an iCAP 7000 spectrometer (Thermo, Waltham, MA, USA). It should be noted that the content of SiNPs refers to the Si element not the nanoparticles in this work, which was measured by ICP-OES. The Fourier transform infrared (FTIR) spectrum was recorded using a Nicolet IS5 FTIR absorption spectrophotometer (Thermo, Waltham, MA, USA). A UV-4100 spectrophotometer (Shimadzu, Kyoto, Japan) and an F97Pro fluorescence spectrophotometer (Lingguang, Shanghai, China) were employed to measure the UV–vis absorption spectra and fluorescence spectra, respectively. Fluorescence spectra were measured using an excitation slit of 10 nm, an emission slit of 10 nm, and a gain voltage of 650 V. The relative fluorescence quantum yield (RFQY) was estimated using freshly prepared quinine sulfate in 0.1 mol·L−1 H2SO4 as a contrast. The absolute fluorescence quantum yield (AFQY) was measured using an FS5 fluorescence spectrometer (Edinburgh, UK). The fluorescence decay curves were measured using an FLS-920 fluorescence spectrometer (Edinburgh, UK) equipped with a 405 nm excitation laser.
2.3. Preparation of SiNPs
The fluorescence SiNPs were prepared according to a previously reported method [49]. Briefly, 8 mL of glycerol solution was added to a 100 mL flask with argon gas, and 0.3180 g of SC was subsequently added to the Ar-saturated glycerol solution. After the solution was sharply stirred for 20 min, 3 mL of DAMO was added dropwise. The transparent precursor solution was stirred for another 10 min, transferred to an atmospheric microwave reactor, and reacted at 180 °C for 15 min. SiNPs were yielded when the color of the solution was dark brown. Dialysis (molecular weight cut-off: 1000 Da) was performed to remove excess reagents.
2.4. Fluorescence Assay with F− Ions
50 μL of 44.08 mg·L−1 SiNPs solution, 45 μL of 10 mmol·L−1 Fe3+ standard solutions, and a series of different volumes of F− standard solutions were added to the centrifugal tubes. Tris-HCl (pH 7.2) reagent was used to fix the final volume to 1.5 mL. The ultimate concentrations of SiNPs and Fe3+ ions were 1.5 and 300 μmol·L−1, respectively. After mixing for 1 min and standing for another 10 min, the fluorescence emission spectra of the solutions were measured at an excitation wavelength of 370 nm with a fluorescent cuvette. Three separate parallel replicates were used for each experiment.
2.5. Anion Selectivity Assays
Stock anion solutions of F−, Cl−, Br−, SO42−, NO3−, HCO3−, PO43−, HPO42−, H2PO4−, Ac− and SCN- were prepared by dissolving their sodium compounds in deionized water. A series of 50 μL of 44.08 mg·L−1 SiNPs solution, 45 μL of 10 mmol·L−1 Fe3+ standard solution, and the aforementioned stock anion solutions were added to the centrifugal tubes. Tris-HCl (pH 7.2) reagent was used to fix the final volume to 1.5 mL. The ultimate concentrations of SiNPs, Fe3+, and anions were 1.5 mg·L−1, 300 μmol·L−1, and 1 mmol·L−1, respectively. After stirring for 1 min and standing for another 10 min, the mixed solutions were subjected to fluorescence measurements at an excitation wavelength of 370 nm. Three separate parallel replicates were used for each experiment.
2.6. Detection of F− Ions in Food Samples
1.00 ± 0.02 g of the homogenized samples (i.e., Antarctic krill and Antarctic krill powder) was accurately weighed in the centrifugal tubes. A certain volume of H2O (20 mL for the Antarctic krill and 60 mL for the Antarctic krill powder) was added to the samples. After stirring for 1 min, the reactions were subjected to ultrasonic extraction for 30 min and centrifuged for 10 min at a speed of 10,000 rpm. After filtration through a 0.22 μm microporous membrane, the solution was diluted 15-fold for further measurements.
3. Results and Discussion
3.1. Structures of SiNPs
Figure 1 displays the structures of the as-prepared SiNPs. As observed in Figure 1A, the SiNPs appeared as monodispersed, spherical particles. The HRTEM image (Figure 1B) revealed that the lattice distance of the as-prepared SiNPs was 0.32 nm, which was attributed to the Si (111) crystal plane. The size distribution histogram in Figure 1C shows that the average size of SiNPs was 1.78 ± 0.02 nm (N = 210). FTIR evidenced the functional groups on the surfaces of the SiNPs, as described in Figure 1D. The absorption peak at 1120 cm−1 was attributed to the stretching vibration of the Si-O bond [50]. The strong absorption peaks of 1573 cm−1, 3418 cm−1, and 2935 cm−1 were assigned to the bending and the stretching vibrations of the N-H bond and the stretching vibrations of the C-H bond, respectively [51], which demonstrated the successful synthesis of SiNPs.
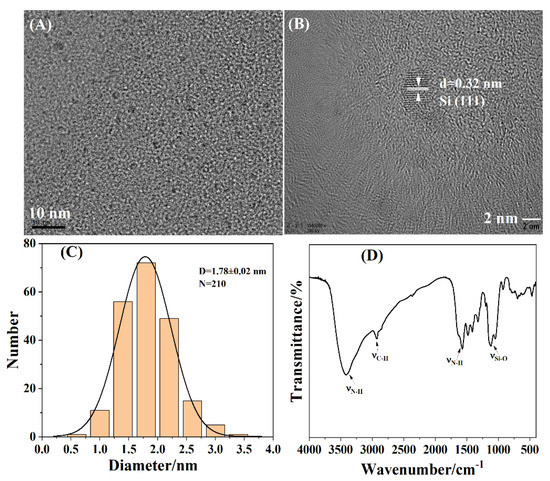
Figure 1.
Structural characterizations of the as-prepared SiNPs: (A) TEM images; (B) HRTEM images; (C) size distribution histogram; (D) FTIR spectrum.
The XPS profiles further confirmed the surface composition of the SiNPs, as shown in Figure 2. The survey XPS spectrum (Figure 2A) verified that the surfaces of the SiNPs comprised C, N, O, and Si elements. In the C 1s spectrum (Figure 2B), three peaks at 285.1, 286.4, and 288.0 eV were attributed to the C-C/C-Si, C-O, and C=O bonds, respectively [52]. The peaks at 399.9 and 400.5 eV in the N1s spectrum (Figure 2C) were ascribed to the N-C and N-H bonds [53]. The three peaks in the O 1s spectrum (Figure 2D) were located at 531.0, 532.2, and 533.7 eV, which were assigned to C=O, C-O, and Si-O bonds, respectively [54]. Figure 2E shows the presence of Si-C (102.5 eV) and Si-O (103.4 eV) in the Si 2p spectrum [55]. The results of the XPS profiles are consistent with those of FTIR.
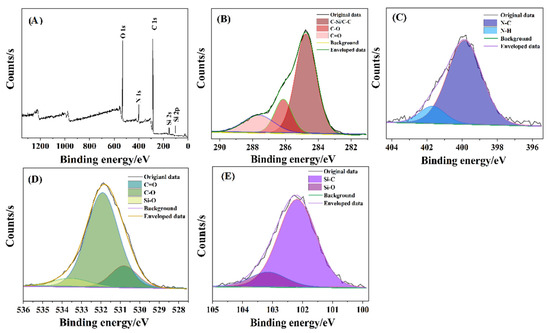
Figure 2.
XPS profiles of SiNPs: (A) Survey; (B) C 1s; (C) N 1s; (D) O 1s; (E) Si 2p.
3.2. Optical Characterizations of SiNPs
Figure 3 shows the optical characterizations of the resulting SiNPs. As shown in Figure 3A, the SiNPs exhibited a strong absorption peak at 360 nm, an excitation peak at 370 nm, and an emission peak at 462 nm. A possible mechanism for the fluorescence emission of SiNPs was similar to the quantum dots, which emitted the fluorescence if the size was less than its Exciton Bohr radius [56]. TEM and HRTEM images above indicated that the average size of the as-prepared SiNPs was 1.78 nm, which was less than silicon’s Exciton Bohr radius of 5 nm [57]. Hence, the synthetic SiNPs could emit fluorescence under excitation. The insets in Figure 3A show that the SiNPs solution appeared transparent under white light illumination and emitted bright blue fluorescence under UV irradiation at 365 nm. The RFQY and AFQY of the SiNPs were 73.8% and 78.9%, respectively (Figure 3B,C), proving the strong fluorescence properties of SiNPs. The results were in agreement with those reported in a previous study [58]. Figure 3D shows that the fluorescence intensity of SiNPs was unchanged after 240 min of irradiation, which demonstrated the strong fluorescence stability of the as-prepared SiNPs.
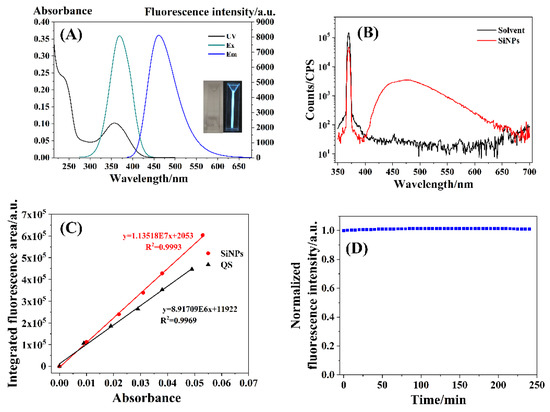
Figure 3.
(A) UV–vis absorption spectrum (UV), fluorescence excitation spectrum (Ex), and fluorescence emission spectrum (Em) of the as-prepared SiNPs. Inset: the as-prepared SiNPs aqueous solution under white light (left) and 365 nm UV light (right); (B) the absolute fluorescence quantum yield spectra; (C) the relative fluorescence quantum yield spectra; (D) optical stability.
The emission wavelength of the as-prepared SiNPs remained almost unchanged (Figure 4) at excitation wavelengths ranging from 300 to 430 nm and 600 to 850 nm, which suggested that the as-synthesized SiNPs exhibited wavelength-independent emission behavior and excellent up-conversion fluorescence. These results were consistent with those of previous studies [59,60].
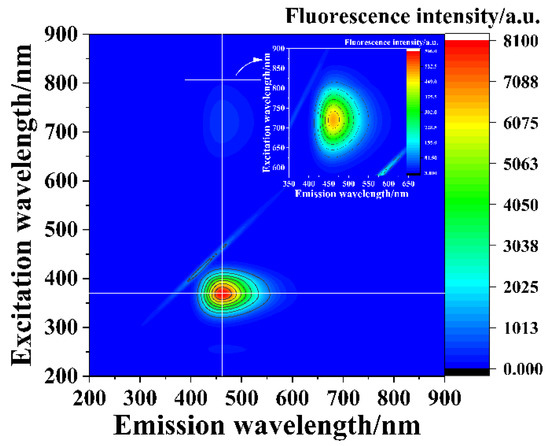
Figure 4.
Excitation–emission map of the as-prepared SiNPs.
3.3. Detection of F− Ions with the As-Prepared SiNPs
As shown in Figure 5A, the fluorescence intensity of the SiNPs (black line in Figure 5A) firstly decreased with the addition of Fe3+ ions (red line in Figure 5A) and subsequently partially recovered by the further addition of F− ions (blue line in Figure 5A). However, the fluorescence intensity of the aqueous solution containing SiNPs and F− ions (green line in Figure 5A) was identical to that of SiNPs alone, which indicated that F− ions did not influence the fluorescence of SiNPs. More than ten anions (F−, Cl−, Br−, SO42−, NO3−, HCO3−, PO43−, HPO42−, H2PO4−, Ac− and SCN−) were utilized to investigate the selectivity of the SiNPs and SiNPs–Fe system for anions. As displayed in Figure 5B, the anions scarcely influenced the fluorescence of SiNPs. Noticeably, the fluorescence intensities of the SiNPs–Fe system hardly changed in the presence of Cl−, Br−, SO42−, NO3−, HCO3−, PO43−, HPO42−, H2PO4−, Ac−, and SCN−, except in the case of F− ions (Figure 5B), which indicated the high selectivity of the SiNPs–Fe system for F− ions over other anions.
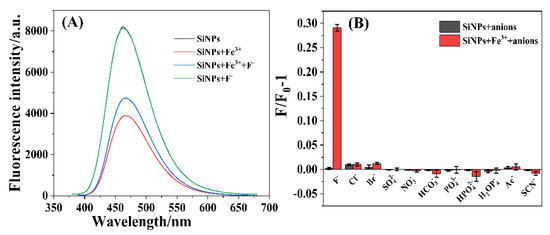
Figure 5.
(A) Fluorescence spectra of SiNPs (black line), SiNPs+Fe3+ (red line), SiNPs + Fe3+ + F− (blue line), and SiNPs + F− (green line); (B) anion selectivity assays of the SiNPs and SiNPs–Fe system with anion concentration of 1 mmol·L−1 at 370 nm excitation.
Based on the fluorescence recovery after the addition of F− ions into the SiNPs–Fe system, we developed a novel method for the detection of F− ions. First, we investigated the effect of the detection conditions on the fluorescence intensity of the SiNPs. As shown in Figure 6A, the fluorescence intensity slightly decreased and reached a plateau approximately 10 min after adding the F− ions, which indicated that a reliable detection could be achieved within 10 min. Figure 6B shows the influence of the pH on the fluorescence intensity, evidently demonstrating that the fluorescence of the SiNPs–Fe system significantly decreased at low pH values, which might have resulted from the surface structure of SiNPs–Fe system being changed in the strongly acidic environment. However, the fluorescence intensity was stable in the pH range of 5–8. Considering the aforementioned effects, Tris-HCl buffer (10 mmol·L−1 pH 7.2) was used to ensure a stable pH during the detection of F− ions.
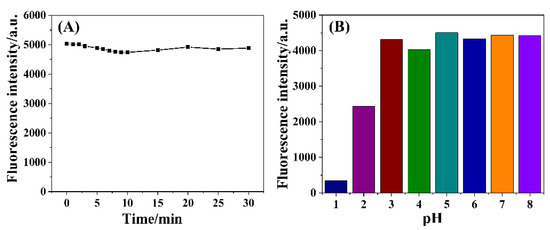
Figure 6.
(A) Effect of the detection time on the fluorescence intensity; (B) influence of the pH on the fluorescence intensity.
Under the optimal detection conditions, the fluorescence intensities of the SiNPs–Fe system gradually increased as the concentration of F− increased from 0 to 300 μmol·L−1 (Figure 7A). Figure 7B shows the relationship between F/F0-1 (where F0 and F refer to the fluorescence intensities of the SiNPs–Fe system in the absence and presence of F− ions, respectively) and the concentrations of F− ions in the range of 0–300 μmol·L−1. In the upper illustration of Figure 7B, the letters of “E,” “C,” “S,” and “F” refer to the SiNPs–Fe system incubated with 0, 50, 100, and 200 μmol·L−1 F− ions for 10 min, respectively. The gradual changed in the brightness of the letters resulted from the fluorescence recovery of the SiNPs–Fe system depending on the F− ion concentration. The lower illustration in Figure 7B shows a good linear relationship (R2 = 0.9992) between F/F0-1 and the concentrations of F− ions varying from 0 to 100 μmol·L−1. The limit of detection (LOD) for F− was found to be 0.05 μmol·L−1 (S/N = 3). Table 1 summarizes the previously reported detection methods using distinct fluorescence nanoparticles, which showed that the described method was comparable with those reported in other studies.
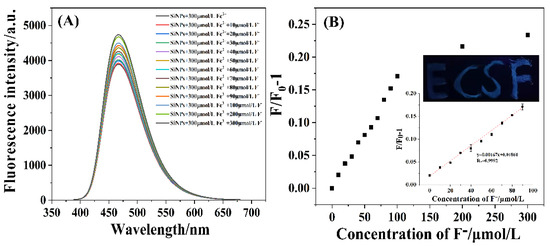
Figure 7.
(A) Fluorescence spectra of as-prepared SiNPs incubated with 300 μmol·L−1 Fe3+ ions and various concentrations of F− ions; (B) relationship between F/F0-1 and the concentration of F− ions ranging from 0 to 300 μmol·L−1. Upper illustration: fluorescence images of the “E,” “C,” “S,” and “F” letters drawn using the SiNPs–Fe system in the presence of 0, 50, 100, and 200 μmol·L−1 F− ions, respectively. Lower illustration: the linear relationship between F/F0-1 and F− ion concentration increasing from 0 to 100 μmol·L−1.

Table 1.
Comparison employing fluorescent probes to detect F− ions.
3.4. Fluorescence Recovery Mechanism between SiNPs–Fe System and F− Ions
The fluorescence recovery mechanism of the SiNPs–Fe system in the presence of F− ions was investigated by UV–vis absorption spectra, fluorescence decay, and zeta potential measurements. As shown in Figure 8A, there was no obvious absorption peak of F− ions (blue-green line in Figure 8A), and the absorption peaks of SiNPs (black line in Figure 8A) and aqueous Fe3+ ions (yellow line in Figure 8A) were located at 360 and 300 nm, respectively. Figure S1 displays the UV absorption spectra of SiNPs, Fe3+ ion, as well as the excitation (Ex) and emission (Em) spectra of SiNPs. The UV absorption spectrum of Fe3+ ions (red line) slightly overlapped with the UV absorption spectrum (black line) and the excitation spectrum (green line) of SiNPs, which was likely to cause the excitation of SiNPs to be weakened. Therefore, the possible fluorescence quenching mechanisms between SiNPs and Fe3+ ions may originate from electron transfer [65]. Additionally, the solutions of the SiNPs–Fe system turned red with the Fe3+ concentration increasing from 0 to 50 μmol·L−1 in the presence of 1,10-Phenanthroline (Figure S2a,b), which indicated the formation of Fe2+ ions, further demonstrating that electron transfer was responsible for the fluorescence quenching mechanism of SiNPs and Fe3+ ions. Meanwhile, the SiNPs–Fe system (red line in Figure 8A) exhibited two absorption peaks at 360 and 300 nm, which were attributed to SiNPs and Fe3+ ions, respectively. The absorbance of the SiNPs–Fe system at 360 nm was almost invariant with an increase in the F− ion concentration from 0 to 100 μmol·L−1, while, at the same time, the absorbance at 300 nm decreased, which indicated that the presence of F− ions affected the Fe3+ ions rather than the SiNPs, probably due to the formation of stable colorless compounds [FeF6]3− [66]. In addition, the absorbance of the SiNPs–Fe system at 300 nm in the presence of 100 μmol·L−1 of F− ions (gray line in Figure 8A) was nearly equivalent to that of the solution containing Fe3+–F− ions (green line in Figure 8A), which further indicated the presence of the colorless [FeF6]3−. Figure 8B displays the fluorescence decay curves, which further evidence the interaction between SiNPs, Fe3+ ions, and F− ions. The fluorescence lifetime of the SiNPs decreased with the addition of Fe3+ ions, but did not recover with the subsequent addition of F− ions, which suggested a dynamic quenching between SiNPs and Fe3+ ions [67]. The zeta potential of the SiNPs was 19.8 mV and drastically declined to 0.493 mV upon the addition of Fe3+ ions, but slightly increased to 1.72 mV with the subsequent addition of F− ions, which was attributed to the interaction between F− ions and Fe3+ ions on the surfaces of the SiNPs to restore the zeta potential of the SiNPs–Fe system (Figure 8C).
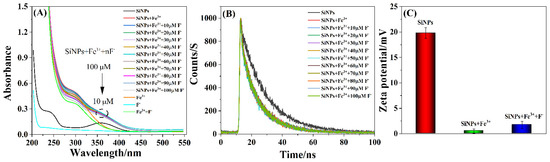
Figure 8.
(A) UV–vis absorption spectra, (B) the fluorescence decay curves, and (C) the zeta potentials of the SiNPs, SiNPs+Fe3+, and SiNPs+Fe3++F− systems.
3.5. Detection of F− Ions in Real Samples
Tap water, Antarctic krill, and Antarctic krill powder were used to evaluate the accuracy and reliability of the as-synthesized SiNPs to detect F− ions in real samples. The F− ion content in tap water was 21.90 μmol·L−1, measured using the established fluorescence (FL) method (the first column in Table 2), which was close to the value of 26.31 μmol·L−1 measured using a fluoride ion selective electrode (FISE, the last column in Table 2) method, thus verifying the accuracy of the proposed method. The recoveries of the standard addition assays were 87.8%, 110.2%, and 102.2% for 20, 50, and 70 μmol·L−1 spiked concentrations of F− ions in tap water, respectively, with the relative standard deviations (RSDs) of 9.65%, 6.08%, and 2.68%, respectively, which further demonstrated the accuracy and feasibility of the developed method. The levels of water-soluble F− ions were measured to be 196 and 23.0 mg·kg−1 in the Antarctic krill and Antarctic krill powder by the proposed method, respectively, which were almost consistent with those of 199 and 22.4 mg·kg−1 detected by the FISE method, respectively. The results confirmed the accuracy and reliability of the as-synthesized SiNPs for the detection of F− in real samples. According to the average percentages of 15% (the water-soluble fluorine vs. the total fluorine [68]), the fluorine content was high, at 1300 mg·kg−1 in the Antarctic krill. Nevertheless, the fluorine content of human intake would not exceed the standard of 100 mg·kg−1 based on the regulations of the USA Food and Drug Administration (FDA). Hence, Antarctic krill cannot be eaten directly as food, and needs to be pre-treated (e.g., defluorination) before eating.
Table 2.
Standard addition assays based on fluorescent SiNPs in tap water.
4. Conclusions
We developed a facile and feasible method for the detection of F− ions based on a novel fluorescence probe with excellent optical silicon nanoparticles (SiNPs). The fluorescence of SiNPs was quenched in the presence of Fe3+ ions and restored upon the addition of F− ions. The recovery of fluorescence intensity linearly depended on the F− concentration varying from 0 to 100 μmol·L−1 (R2 = 0.9992) with a detection limit of 0.05 μmol·L−1. UV–vis absorption spectra, fluorescence decay curves, and zeta potential measurements verified the fluorescence recovery mechanism via the formation of a stable and colorless ferric fluoride compound. Moreover, the SiNPs were successfully used to detect F− ions in tap water and food samples. The results demonstrated the accuracy and reliability of the established method based on SiNPs.
Supplementary Materials
The following are available online at https://www.mdpi.com/article/10.3390/nano12020213/s1, Figure S1: The UV absorption spectra of SiNPs, Fe3+ ion, as well as the excitation (Ex) and the emission (Em) spectra of SiNPs, Figure S2: The images of SiNPs and Fe3+ with the concentration increasing from 0 to 50 μmol·L−1 in the absence (a) and the presence (b) of 1,10-Phenanthroline.
Author Contributions
Experiment Performer and Manuscript Preparation, H.Y. and L.Z.; Major Advisor, Results Discussion, and Manuscript Preparation, H.C. and Y.C.; Material Characterization, H.Y., L.Z. and X.R.; Draft Writing, H.Y. and L.Z.; Results Discussion and Manuscript Editing, H.Y., L.Z., Y.C. and H.C.; Mechanism Interpretation, X.R.; Data Analysis and Preparation, H.Y. and L.Z.; Results Discussion and Financial Support, Y.C. and H.C. All authors have read and agreed to the published version of the manuscript.
Funding
This research was funded by the National Key R&D Program of China (No. 2017YFC1600706) and the Central Public Interest Scientific Institution Basal Research Fund (East China Sea Fisheries Research Institute) (No. 2019T12).
Institutional Review Board Statement
Not applicable.
Informed Consent Statement
Not applicable.
Data Availability Statement
Data sharing is not applicable.
Acknowledgments
We are grateful to the 36th Antarctic Expedition of China for supplying the samples of Antarctic krill.
Conflicts of Interest
The authors declare no conflict of interest.
References
- Zhang, X.M.; Qin, Y.P.; Ye, H.L.; Ma, X.T.; He, X.W.; Li, W.Y.; Zhang, Y.K. Silicon nanoparticles coated with an epitope-imprinted polymer for fluorometric determination of cytochrome C. Microchim. Acta 2018, 185, 173. [Google Scholar] [CrossRef] [PubMed]
- Wu, Y.J.; Chen, Y.A.; Huang, C.L.; Su, J.T.; Hsieh, C.T.; Lu, S.Y. Small highly mesoporous silicon nanoparticles for high per-formance lithium ion based energy storage. Chem. Eng. J. 2020, 400, 125958. [Google Scholar] [CrossRef]
- Liu, X.Y.; Lu, J.; Jiang, J.L.; Jiang, Y.; Gao, Y.; Li, W.R.; Zhao, B.; Zhang, J.J. Enhancing lithium storage performance by strongly binding silicon nanoparticles sandwiching between spherical graphene. Appl. Surf. Sci. 2021, 539, 148191. [Google Scholar] [CrossRef]
- Dou, Y.K.; Shang, Y.; He, X.W.; Li, W.Y.; Li, Y.H.; Zhang, Y.K. Preparation of a ruthenium-complex-functionalized two-photon-excited red fluorescence silicon nanoparticle composite for targeted fluorescence imaging and photodynamic therapy in vitro. ACS Appl. Mater. Interfaces 2019, 11, 13954–13963. [Google Scholar] [CrossRef] [PubMed]
- Jia, C.; Zhang, M.; Zhang, Y.; Ma, Z.B.; Xiao, N.N.; He, X.W.; Li, W.Y.; Zhang, Y.K. Preparation of dual-template epitope imprinted polymers for targeted fluorescence imaging and targeted drug delivery to pancreatic cancer BxPC-3 cells. ACS Appl. Mater. Interfaces 2019, 11, 32431–32440. [Google Scholar] [CrossRef]
- Qin, Y.T.; Peng, H.; He, X.W.; Li, W.Y.; Zhang, Y.K. pH-responsive polymer-stabilized ZIF-8 nanocomposites for fluorescence and magnetic resonance dual-modal imaging-guided chemo-/photodynamic combinational cancer therapy. ACS Appl. Mater. Interfaces 2019, 11, 34268–34281. [Google Scholar] [CrossRef] [PubMed]
- Ahire, J.H.; Chambrier, I.; Mueller, A.; Bao, Y.; Chao, Y. Synthesis of D-mannose capped silicon nanoparticles and their in-teractions with MCF-7 human breast cancerous cells. ACS Appl. Mater. Interfaces 2013, 5, 7384–7391. [Google Scholar] [CrossRef]
- He, Y.; Su, Y.Y.; Yang, X.B.; Kang, Z.H.; Xu, T.T.; Zhang, R.Q.; Fan, C.H.; Lee, S.T. Photo and pH stable, highly luminescent silicon nanospheres and their bioconjugates for immunofluorescent cell imaging. J. Am. Chem. Soc. 2009, 131, 4434–4438. [Google Scholar] [CrossRef]
- Dou, Y.K.; Chen, Y.; He, X.W.; Li, W.Y.; Li, Y.H.; Zhang, Y.K. Synthesis of Water-dispersible Mn2+ functionalized silicon na-noparticles under room temperature and atmospheric pressure for fluorescence and magnetic resonance dual-modality im-aging. Anal. Chem. 2017, 89, 11286–11292. [Google Scholar] [CrossRef] [PubMed]
- Ye, H.L.; Cai, S.J.; Li, S.; He, X.W.; Li, W.Y.; Li, Y.H.; Zhang, Y.K. One-pot microwave synthesis of water-dispersible, high fluorescence silicon nanoparticles and their imaging applications in vitro and in vivo. Anal. Chem. 2016, 88, 11631–11638. [Google Scholar] [CrossRef]
- Park, J.H.; Gu, L.; von Maltzahn, G.; Ruoslahti, E.; Bhatia, S.N.; Sailor, M.J. Biodegradable luminescent porous silicon nano-particles for in vivo applications. Nat. Mater. 2009, 8, 331–336. [Google Scholar] [CrossRef] [PubMed]
- Zhao, J.; Deng, J.; Yi, Y.; Li, H.; Zhang, Y.; Yao, S. Label-free silicon quantum dots as fluorescent probe for selective and sensi-tive detection of copper ions. Talanta 2014, 125, 372–377. [Google Scholar] [CrossRef]
- Zhang, J.; Yu, S.H. Highly photoluminescent silicon nanocrystals for rapid, label free and recyclable detection of mercuric ions. Nanoscale 2014, 6, 4096–4101. [Google Scholar] [CrossRef] [PubMed]
- Zhang, X.; Chen, X.; Kai, S.; Wang, H.Y.; Yang, J.; Wu, F.G.; Chen, Z. Highly sensitive and selective detection of dopamine using one-pot synthesized highly photoluminescent silicon nanoparticles. Anal. Chem. 2015, 87, 3360–3365. [Google Scholar] [CrossRef]
- Ma, S.D.; Chen, Y.L.; Feng, J.; Liu, J.J.; Zuo, X.W.; Chen, X.G. One-step synthesis of water-dispersible and biocompatible silicon nanoparticles for selective heparin sensing and cell imaging. Anal. Chem. 2016, 88, 10474–10481. [Google Scholar] [CrossRef]
- Han, Y.; Chen, Y.; Feng, J.; Liu, J.; Ma, S.; Chen, X. One-pot synthesis of fluorescent silicon nanoparticles for sensitive and se-lective determination of 2,4,6-trinitro-phenol in aqueous solution. Anal. Chem. 2017, 89, 3001–3008. [Google Scholar] [CrossRef] [PubMed]
- Li, Z.; Ren, X.; Hao, C.; Meng, X.; Li, Z. Silicon quantum dots with tunable emission synthesized via one-step hydrothermal method and their application in alkaline phosphatase detection. Sens. Actuators B 2018, 260, 426–431. [Google Scholar] [CrossRef]
- Ma, H.; Li, X.R.; Liu, X.Y.; Deng, M.; Wang, X.D.; Iqbal, A.; Liu, W.S.; Qin, W.W. Fluorescent glutathione probe based on MnO2–Si quantum dots nanocomposite directly used for intracellular glutathione imaging. Sens. Actuators B 2018, 255, 1687–1693. [Google Scholar] [CrossRef]
- Wei, N.; Wei, M.X.; Huang, B.H. One-pot facile synthesis of green-emitting fluorescent silicon quantum dots for the highly selective and sensitive detection of nitrite in food samples. Dyes Pigm. 2021, 184, 108848. [Google Scholar] [CrossRef]
- Zhu, L.; Peng, X.; Li, H.; Zhang, Y.; Yao, S. On–off–on fluorescent silicon nanoparticles for recognition of chromium(VI) and hydrogen sulfide based on the inner filter effect. Sens. Actuators B 2017, 238, 196–203. [Google Scholar] [CrossRef]
- Liu, L.; Zhu, G.; Zeng, W.; Yi, Y.; Lv, B.; Qian, J.; Zhang, D. Silicon quantum dot-coated onto gold nanoparticles as an optical probe for colorimetric and fluorometric determination of cysteine. Mikrochim. Acta 2019, 186, 98. [Google Scholar] [CrossRef]
- Liu, Y.L.; Lei, C.; Zan, M.H.; Peng, J.H.; Wang, P.H.; Pang, X.P.; Zhang, Y.; Li, L.; Dong, W.F.; Mei, Q. Cyan-emitting silicon quantum dots as a fluorescent probe directly used for highly sensitive and selective detection of chlorogenic acid. Talanta 2021, 233, 122465. [Google Scholar] [CrossRef]
- Li, X.R.; Ma, H.; Deng, M.; Iqbal, A.; Liu, X.Y.; Li, B.; Liu, W.S.; Li, J.; Qin, W. Europium functionalized ratiometric fluores-cent transducer silicon nanoparticles based on FRET for the highly sensitive detection of tetracycline. J. Mater. Chem. C 2017, 5, 2149–2152. [Google Scholar] [CrossRef]
- Jeong, S.; Kim, D.; Kim, Y.T.; Yoon, H.O. A rapid screening of fluorine contents in soil with a consideration of chemical bind-ing by wavelength dispersive X-ray fluorescence spectrometry. Spectrochim. Acta Part B 2018, 149, 261–266. [Google Scholar] [CrossRef]
- Kainth, S.; Mehta, A.; Mishra, A.; Basu, S. Implementation of a logic gate by chemically induced nitrogen and oxygen rich C-dots for the selective detection of fluoride ions. New J. Chem. 2018, 42, 12162–12171. [Google Scholar] [CrossRef]
- Cametti, M.; Rissanen, K. Highlights on contemporary recognition and sensing of fluoride anion in solution and in the solid state. Chem. Soc. Rev. 2013, 42, 2016–2038. [Google Scholar] [CrossRef] [PubMed]
- Zheng, X.J.; Zhu, W.C.; Liu, D.; Ai, H.; Huang, Y.; Lu, Z.Y. Highly selective colorimetric/fluorometric dual-channel fluoride ion probe, and its capability of difffferentiating cancer cells. ACS Appl. Mater. Interfaces 2014, 6, 7996–8000. [Google Scholar] [CrossRef]
- Liu, Z.P.; Liu, L.L.; Sun, M.H.; Su, X.G. A novel and convenient near-infrared flfluorescence “turn offeon” nanosensor for de-tection of glucose and fluoride anions. Biosens. Bioelectron. 2015, 65, 145–151. [Google Scholar] [CrossRef]
- Yamaguchi, S.; Akiyama, S.; Tamao, K. Colorimetric fluoride ion sensing by boron-containing p-electron systems. J. Am. Chem. Soc. 2001, 123, 11372–11375. [Google Scholar] [CrossRef]
- Zhu, B.C.; Kan, H.; Liu, J.K.; Liu, H.Q.; Wei, Q.; Du, B. A highly selective ratiometric visual and red-emitting fluorescent du-al-channel probe for imaging fluoride anions in living cells. Biosens. Bioelectron. 2014, 52, 298–303. [Google Scholar] [CrossRef]
- Villagran, C.; Deetlefs, M.; Pitner, W.R.; Hardacre, C. Quantification of halide in ionic liquids using ion chromatography. Anal. Chem. 2004, 76, 2118–2123. [Google Scholar] [CrossRef]
- Yahyavi, H.; Kaykhaii, M.; Mirmoghaddam, M. Recent developments in methods of analysis for fluoride determination. Crit. Rev. Anal. Chem. 2016, 46, 106–121. [Google Scholar] [CrossRef]
- Kumar, V.V.; Ramadevi, D.; Ankathi, V.M.; Pradhan, T.K.; Basavaiah, K. Development of porphyrin-based chemosensor for highly selective sensing of fluoride ion in aqueous media. Microchem. J. 2020, 157, 105028. [Google Scholar] [CrossRef]
- Xiao, L.W.; Ren, L.L.; Jing, X.M.; Li, Z.; Wu, S.G.; Guo, D.Y. A selective naphthalimide-based colorimetric and fluorescent chemosensor for “naked-eye” detection of fluoride ion. Inorg. Chim. Acta 2020, 500, 119207. [Google Scholar] [CrossRef]
- Goswami, U.; Dutta, A.; Raza, A.; Kandimalla, R.; Kalita, S.; Ghosh, S.S.; Chattopadhyay, A. Transferrin-copper nanoclus-ter-doxorubicin nanoparticles as targeted theranostic cancer nanodrug. ACS Appl. Mater. Interfaces 2018, 10, 3282–3294. [Google Scholar] [CrossRef]
- Feng, J.; Chen, S.; Yu, Y.L.; Wang, J.H. Red-emission hydrophobic porphyrin structure carbon dots linked with transferrin for cell imaging. Talanta 2020, 217, 121014. [Google Scholar] [CrossRef] [PubMed]
- Lang, Y.; Shi, L.; Lan, L.; Zhao, Z.; Yang, D.; Fu, Y.; Tang, Y.; Zhang, X. Visualized detection of apo-transferrin based on cy-anine dye supramolecular assembly. Spectrochim. Acta Part A 2019, 215, 334–339. [Google Scholar] [CrossRef]
- Banerjee, A.; Grazon, C.; Pons, T.; Bhatia, D.; Valades-Cruz, C.A.; Johannes, L.; Krishnan, Y.; Dubertret, B. A novel type of quantum dot-transferrin conjugate using dna hybridization mimics intracellular recycling of endogenous transferrin. Nanoscale 2017, 9, 15453–15460. [Google Scholar] [CrossRef]
- Wang, Y.; Chen, J.T.; Yan, X.P. Fabrication of transferrin functionalized gold nanoclusters/graphene oxide nanocomposite for turn-on near-infrared fluorescent bioimaging of cancer cells and small animals. Anal. Chem. 2013, 85, 2529–2535. [Google Scholar] [CrossRef] [PubMed]
- Li, L.; Shi, L.H.; Jia, J.; Jiao, Y.; Gao, Y.Y.; Liu, Y.; Dong, C.; Shuang, S.M. “On-off-on” detection of Fe3+ and F−, biological im-aging, and its logic gate operation based on excitation-independent blue-fluorescent carbon dots. Spectrochim. Acta Part A 2020, 227, 117716. [Google Scholar] [CrossRef] [PubMed]
- Gharami, S.; Sarkar, D.; Ghosh, P.; Acharyya, S.; Aich, K.; Murmu, N.; Mondal, T.K. A coumarin based azo-phenol ligand as efficient fluorescent “OFF-ON-OFF” chemosensor for sequential detection of Mg2+ and F−: Application in live cell imaging and as molecular logic gate. Sens. Actuators B 2017, 253, 317–325. [Google Scholar] [CrossRef]
- Dwivedi, R.; Singh, D.P.; Chauhan, B.S.; Srikrishna, S.; Panday, A.K.; Choudhury, L.H.; Singh, V.P. Intracellular application and logic gate behavior of a ‘turn off-on-off’ type probe for selective detection of Al3+ and F− ions in pure aqueous medium. Sens. Actuators B 2018, 258, 881–894. [Google Scholar] [CrossRef]
- Tang, X.; Zhu, Z.; Liu, R.J.; Ni, L.; Qiu, Y.; Han, J.; Wang, Y. A novel OFF-ON-OFF fluorescence probe based on coumarin for Al3+ and F− detection and bioimaging in living cells. Spectrochim. Acta Part A 2019, 211, 299–305. [Google Scholar] [CrossRef]
- Alshammari, A.H.; Alqahtani, Z.; Suah, F.B.M.; Nizar, S.A.; Dunbar, A. Low cost, high sensitivity detection of waterborne Al3+ cations and F− anions via the fluorescence response of a morin derivative dye. Anal. Chim. Acta 2020, 1105, 1–10. [Google Scholar] [CrossRef]
- Wang, N.; Chai, H.J.; Dong, X.L.; Zhou, Q.; Zhu, L.H. Detection of Fe (III)EDTA by using photoluminescent carbon dot with the aid of F− ion. Food Chem. 2018, 258, 51–58. [Google Scholar] [CrossRef]
- Yao, K.; Chang, Y.X.; Li, B.; Yang, H.; Xu, K.X. A novel coumarin-based fluorescent sensor for Ca2+ and sequential detection of F− and its live cell imaging. Spectrochim. Acta Part A 2019, 216, 385–394. [Google Scholar] [CrossRef]
- Zhang, Y.F.; Tu, Q.; Chen, L.; Li, N.; Yang, L.; Zhang, X.X.; Yuan, M.S.; Wang, J.Y. A fluorescein-based AND-logic FPSi probe for the simultaneous detection of Hg2+ and F−. Talanta 2019, 202, 323–328. [Google Scholar] [CrossRef] [PubMed]
- Luan, F.F.; Xiao, G.X.; Zhang, Y.X.; Li, S.Q.; Hu, Z.Q.; Du, H.L.; Guo, D.C. Synthesis, fluorescence properties and F− detection performance of Eu (III) complexes based on the novel coumarin Schiff base derivatives. J. Mol. Liq. 2020, 320, 114439. [Google Scholar] [CrossRef]
- Ye, H.L.; Shang, Y.; Wang, H.Y.; Ma, Y.L.; He, X.W.; Li, W.Y.; Li, Y.H.; Zhang, Y.K. Determination of Fe (Ⅲ) ion and cellular bioimaging based on a novel photoluminescent silicon nanoparticles. Talanta 2021, 230, 122294. [Google Scholar] [CrossRef] [PubMed]
- Dasog, M.; Yang, Z.Y.; Regli, S.; Atkins, T.M.; Faramus, A.; Singh, M.P.; Muthuswamy, E.; Kauzlarich, S.M.; Tilley, R.D.; Veinot, J.G.C. Chemical insight into the origin of red and blue photoluminescence arising from freestanding silicon nanocrystals. ACS Nano 2013, 7, 2676–2685. [Google Scholar] [CrossRef]
- Zhong, L.; Peng, F.; Bao, F.; Wang, S.Y.; Ji, X.Y.; Yang, L.; Su, Y.Y.; Lee, S.T.; He, Y. Large-scale aqueous synthesis of fluores-cent and biocompatible silicon nanoparticles and their use as highly photostable biological probes. J. Am. Chem. Soc. 2013, 135, 8350–8356. [Google Scholar] [CrossRef] [PubMed]
- Ding, H.; Yu, S.B.; Wei, J.S.; Xiong, H.M. Full-color light-emitting carbon dots with a surface-state-controlled luminescence mechanism. ACS Nano 2016, 10, 484–491. [Google Scholar] [CrossRef] [PubMed]
- Yan, F.; Sun, Z.; Zhang, H.; Sun, X.; Jiang, Y.; Bai, Z. The fluorescence mechanism of carbon dots, and methods for tuning their emission color: A review. Microchim. Acta 2019, 186, 583. [Google Scholar] [CrossRef] [PubMed]
- Chu, P.K.; Li, L. Characterization of amorphous and nanocrystalline carbon films. Mater. Chem. Phys. 2006, 96, 253–277. [Google Scholar] [CrossRef]
- Purkait, T.K.; Iqbal, M.; Islam, M.A.; Mobarok, M.H.; Gonzalez, C.M.; Hadidi, L.; Veinot, J.G.C. Alkoxy-terminated Si surfaces: A new reactive platform for the functionalization and derivatization of silicon quantum dots. J. Am. Chem. Soc. 2016, 138, 7114–7120. [Google Scholar] [CrossRef]
- Alivisatos, A.P. Semiconductor Clusters, Nanocrystals, and Quantum Dots. Science 1996, 271, 933–937. [Google Scholar] [CrossRef] [Green Version]
- Kůsová, K.; Hapala, P.; Valenta, J.; Jelínek, P.; Cibulka, O.; Ondič, L.; Pelant, I. Direct Bandgap Silicon: Tensile-Strained Silicon Nanocrystals. Adv. Mater. Interfaces 2014, 1, 1300042. [Google Scholar] [CrossRef]
- Wu, F.G.; Zhang, X.D.; Kai, S.Q.; Zhang, M.Y.; Wang, H.Y.; Myers, J.N.; Weng, Y.X.; Liu, P.D.; Gu, N.; Chen, Z. One-step synthesis of superbright water-soluble silicon nanoparticles with photoluminescence quantum yield exceeding 80%. Adv. Mater. Interfaces 2015, 2, 1500360. [Google Scholar] [CrossRef]
- Li, S.; Zhang, Y.; He, X.W.; Li, W.Y.; Zhang, Y.K. Multifunctional mesoporous silica nanoplatform based on silicon nanopar-ticles for targeted two-photon-excited fluorescence imaging-guided chemo/photodynamic synergetic therapy in vitro. Talanta 2020, 209, 120552. [Google Scholar] [CrossRef]
- Geng, X.; Li, Z.H.; Hu, Y.L.; Liu, H.F.; Sun, Y.Q.; Meng, H.M.; Wang, Y.W.; Qu, L.B.; Lin, Y.H. One-pot green synthesis of ultra-bright n-doped fluorescent silicon nanoparticles for cellular imaging by using ethylenediaminetetraacetic acid disodium salt as an effective reductant. ACS Appl. Mater. Interfaces. 2018, 10, 27979–27986. [Google Scholar] [CrossRef]
- Kumar, G.G.V.; Kesavan, M.P.; Sivaraman, G.; Rajesh, J. Colorimetric and NIR fluorescence receptors for F− ion detection in aqueous condition and its Live cell imaging. Sens. Actuators B 2018, 255, 3194–3206. [Google Scholar] [CrossRef]
- Liu, J.M.; Lin, L.P.; Wang, X.X.; Jiao, L.; Cui, M.L.; Jiang, S.L.; Cai, W.L.; Zhang, L.H.; Zheng, Z.Y. Zr(H2O)2EDTA modulated luminescent carbon dots as fluorescent probes for fluoride detection. Analyst 2013, 138, 278–283. [Google Scholar] [CrossRef] [PubMed]
- Mohapatra, S.; Sahu, S.; Nayak, S.; Ghosh, S.K. Design of Fe3O4@SiO2@carbon quantum dot based nanostructure for fluores-cence sensing, magnetic separation, and live cell imaging of fluoride ion. Langmuir 2015, 31, 8111–8120. [Google Scholar] [CrossRef] [PubMed]
- Zhang, Z.Y.; Chen, X.Y.; Wang, J.L. Bright blue emissions N-doped carbon dots from a single precursor and their application in the trace detection of Fe3+ and F−. Inorg. Chim. Acta 2021, 515, 120087. [Google Scholar] [CrossRef]
- Tang, X.D.; Yu, H.M.; Bui, B.L.; Wang, Y.; Xing, C.; Wang, S.Y.; Chen, M.L.; Hu, Z.Z.; Chen, W. Nitrogen-doped fluores-cence carbon dots as multi-mechanism detection for iodide and curcumin in biological and food samples. Bioact. Mater. 2021, 6, 1541–1554. [Google Scholar] [CrossRef]
- Hou, W.; Wang, T.Y.; Zhou, B.; Wang, H.Y.; Li, L.D. Synthesis and formation mechanistic investigation of nitrogen-doped carbon dots with high quantum yields and yellowish-green fluorescence. Nanoscale 2016, 8, 11185–11193. [Google Scholar] [CrossRef]
- Li, S.H.; Li, Y.C.; Cao, J.; Zhu, J.; Fan, L.Z.; Li, X.H. Sulfur-doped graphene quantum dots as a novel fluorescent probe for highly selective and sensitive detection of Fe3+. Anal. Chem. 2014, 86, 10201–10207. [Google Scholar] [CrossRef]
- Moren, M.; Malde, M.K.; Olsen, R.E.; Hemre, G.I.; Dahl, L.; Karlsen, Q.; Julshamn, K. Fluorine accumulation in atlantic salmon (salmo salar), atlantic cod (gadus morhua), rainbow trout (onchorhyncus mykiss) and atlantic halibut (hippoglossus hippoglossus) fed diets with krill or amphipod meals and fish meal based diets with sodium fluoride. Aquaculture 2007, 269, 525–531. [Google Scholar] [CrossRef]
Publisher’s Note: MDPI stays neutral with regard to jurisdictional claims in published maps and institutional affiliations. |
© 2022 by the authors. Licensee MDPI, Basel, Switzerland. This article is an open access article distributed under the terms and conditions of the Creative Commons Attribution (CC BY) license (https://creativecommons.org/licenses/by/4.0/).