Abstract
Biochar from spent malt rootlets was employed as the template to synthesize hybrid biochar-ceria materials through a wet impregnation method. The materials were tested for the activation of persulfate (SPS) and subsequent degradation of sulfamethoxazole (SMX), a representative antibiotic, in various matrices. Different calcination temperatures in the range 300–500 °C were employed and the resulting materials were characterized by means of N2 adsorption and potentiometric mass titration as well as TGA, XRD, SEM, FTIR, DRS, and Raman spectroscopy. Calcination temperature affects the biochar content and the physicochemical properties of the hybrid materials, which were tested for the degradation of 500 μg L−1 SMX with SPS (in the range 200–500 mg L−1) in various matrices including ultrapure water (UPW), bottled water, wastewater, and UPW spiked with bicarbonate, chloride, or humic acid. Materials calcined at 300–350 °C, with a surface area of ca. 120 m2 g−1, were the most active, yielding ca. 65% SMX degradation after 120 min of reaction in UPW; materials calcined at higher temperatures as well as bare biochar were less active. Degradation decreased with increasing matrix complexity due to the interactions amongst the surface, the contaminant, and the oxidant. Experiments in the presence of scavengers (i.e., methanol, t-butanol, and sodium azide) revealed that sulfate and hydroxyl radicals as well as singlet oxygen were the main oxidative species.
1. Introduction
Over the last few decades, nanotechnology has gained huge interest due to its extensive application in various fields including, among others, catalysis, electronics, optics, energy, and the environment. The design and controlled synthesis of advanced nanomaterials with unique properties make them highly attractive in these fields. The demand for more active, environmentally friendly, low-cost materials has resulted in tremendous interest in the preparation of nanostructured materials with active surface functional groups and, thus, high surface reactivity. Two very interesting materials with many environmental applications are CeO2 [,] and biochar [,]. The reason for this is their unique characteristics. Specifically, CeO2 is a very promising material that can be used as a catalyst or support in several catalytic applications. Combined with Cu is the state-of-the-art catalyst for the preferential oxidation of CO [] since it presents a high amount of oxygen vacancies, a controllable ratio of Ce3+/Ce4+, high oxygen storage capacity, and moderate surface area [,,].
Nano CeO2 may exhibit improved properties and catalytic functions, which are significantly affected by the preparation conditions []. It has been reported in the literature and demonstrated by computational studies that the morphology of the nano CeO2 affects the catalytic activity. Generally, the (110) and (100) surfaces are catalytically more active than (111) [,]. Specifically, the higher activity for the CO oxidation can be obtained with nanorods of CeO2, which are exposed to the (110) and (100) planes []. The hydrothermal method can be applied for the preparation of different forms of nano CeO2 [].
The main disadvantage of CeO2 is that pure ceria exhibits low activity since the active surface oxygen species are rather limited; moreover, CeO2 is an insulator at room temperature, thus electron transfer is limited []. This can be dramatically changed if pure CeO2 is doped with transition metal ions. Then, the deposition of metal cations (M) on CeO2 can alter the electronic and geometric configuration and thus the properties of the mixed material. This approach is well-studied and researchers have concluded that new sites with high activity can be formed, interactions between Ce and M can alter the electrons configuration, and new oxygen vacancies can be formed during sub-surface and bulk incorporation of metal ions into CeO2 [,,].
In a recent review, the synthesis and characterization of CeO2 nanoparticles of different morphology were discussed []. Although many methods have been applied for the synthesis of CeO2 nanoparticles, the combined use of biochar (BC) as a template and Ce precursors for the preparation of CeO2 has not been investigated. On the other hand, CeO2 deposition on biochar to produce hybrid materials with enhanced adsorption capacity [], interesting electrocatalytic properties [], or superior degradation ability for textile dyes in sonocatalytic oxidation [] has been reported; in these cases, CeO2 nanoparticles were prepared with the hydrothermal method and then mixed with BC as a suspension in acetone. Moreover, novel carbonaceous materials (i.e., CeO2-encapsulated nitrogen-doped biochar) have significant activity for oxygen reduction []. The biomass precursor of this value-added biochar material was biomimetically prepared via a hydroponic operation in the Ce-enriched solution. The enhanced activity was partially due to high oxygen vacancies of the hybrid material.
Biochar is the solid material prepared from the pyrolysis of biomass under a limited or no oxygen atmosphere, during which part of the organic phase decomposes to gases. Interestingly, the properties of the biochars are different compared to raw biomass. These new unique properties are desirable for many applications where biochars are employed as absorbers [], support in catalytic processes [,,], transesterification catalysts for the production of biodiesel, [], supercapacitors [], and persulfate activators for the oxidation of organic contaminants in water [,,,]. Depending on the raw biomass and pyrolysis conditions, biochars can exhibit high surface area, hierarchical pore structure, plenty of surface groups, stability, and in some cases, a high amount of mineral deposits. Furthermore, its surface can interact with metal ions or even nanoparticles and stabilize them.
Pharmaceutically active compounds such as antibiotics, antihypertensive and non-steroidal anti-inflammatory drugs as well as their metabolites are classified as emerging micro-contaminants and are detected in wastewater, surface water, and groundwater at concentrations ranging from ng L−1 to mg L−1. Antibiotics are widely used against bacterial infections or to prevent infections; several studies have reported antibiotic occurrence in wastewater treatment plant effluents at concentrations from 0.1 to 2.5 μg L−1 []. Although this range of concentration is small, it can be harmful to human and animal health and augment the antimicrobial resistance [].
In this work, biochar from malt spent rootlets was prepared at 850 °C. This biochar has moderate surface area and a high amount of minerals []. Treatment with H2SO4 can remove the minerals and significantly increase the specific surface area []. For this reason, the biochar was treated with H2SO4 and then used as a template for the preparation of hybrid material BC-CeO2 with different BC to CeO2 ratio. The produced materials were characterized with various physicochemical methods and used for the degradation of sulfamethoxazole, a representative antibiotic drug, in various water matrices via oxidation with persulfates. To the best of our knowledge, this is the first report on (i) the use of biochar as a template and its influence on the physicochemical properties of CeO2, and (ii) the application of the as-prepared hybrid materials to promote the sulfate radical-induced advanced oxidation of antibiotic SMX in environmentally relevant matrices. From this perspective, the innovation of this work embodies two different but related disciplines, namely (i) material synthesis, where a novel catalytic material capable of activating persulfate is described, and (ii) environmental remediation, focusing on the treatment of micro-contaminants of emerging concern.
2. Materials and Methods
2.1. Materials
The precursor salt Ce(NO3)3·6H2O (analytical grade, CAS number: 10277-43-7) and sulfamethoxazole (SMX, C10H11N3O3S, 99+%, CAS number: 723-46-6) were purchased from Sigma-Aldrich (St. Louis, MO, USA). Sodium persulfate (SPS, Na2S2O8 99%, CAS number: 7775-27-1) was purchased from Scharlau (Barcelona, Spain). Most of the experiments were carried out in ultrapure water (UPW: pH = 6.5). Other matrices included (i) commercially available bottled water (BW: pH = 7.7, conductivity 355 μS cm−1, containing (in mg L−1): 237 bicarbonate; 3.7 chloride; 7.8 sulfate; 1.1 nitrate; 75.5 calcium; 5.1 magnesium; 2.1 sodium; and 0.65 potassium ions); (ii) secondary treated wastewater (WW) taken from the University of Patras campus treatment plant (pH = 8, conductivity = 1.682 mS cm−1, total organic C = 2.46 mg L−1, chemical oxygen demand = 48.53 mg L−1, total suspended solids = 22 mg L−1, [Cl−] = 262.41 mg L−1, [PO43−] = 14.98 mg L−1, [HCO3−] = 278 mg L−1, [Br−] = 165.64 mg L−1, [Ca2+ ] = 112 mg L−1); and (iii) UPW spiked with various water constituents such as humic acid (HA: CAS number: 1415-93-6), bicarbonate (CAS number: 144-55-8), chloride (CAS number: 7647-14-5), sodium azide (NaN3: CAS number: 26628-22-8), t-butanol (CAS number: 75-65-0), and methanol (CAS number: 67-56-1); all these were purchased from Sigma-Aldrich (St. Louis, MO, USA).
2.2. Sample Preparation
The biochar used in this study was prepared from spent malt rootlets under pyrolysis at 850 °C with limited O2 atmosphere. The prepared biochar was treated with 1 M H2SO4 under reflux for 30 min. The treatment was conducted in order to increase the surface area of the sample and remove the deposits of minerals present in the raw biomass. After treatment, the BC was filtered, washed with 1 L of triply distilled water, and dried for 2 h at 120 °C. More details on the preparation of the sample and its properties can be found in [].
To deposit the Ce precursor on the biochar surface, about 3 g of treated biochar was immersed in 150 mL of solution containing 11.1 g of Ce(NO3)3 6H2O. The suspension was placed in a round bottom bottle in a rotary evaporator system. Then, the suspension was left to equilibrate for 30 min under atmospheric pressure at 70 °C. After that, vacuum was applied and the water was evaporated. The mixed solid was dried at 120 °C for 1 h and then calcined at different temperatures for 2 h. The samples were denoted as BC/Ce-X, where X is the calcination temperature. An additional sample (BC/Ce-300-5 h) was calcined at 300 °C for 5 h.
2.3. Physicochemical Characterization
The prepared samples were characterized with various physicochemical methods. Briefly, specific surface area (SSA) and pore size distribution was performed with N2 adsorption isotherms at liquid N2 temperature in a Tristar 3000 porosimeter (Micromeritics). X-ray diffraction peaks were recorded with a Bruker D8 Advance diffractometer (Billerica, MA, USA) equipped with a nickel-filtered CuKa (1.5418 Å) radiation source. The biochar morphology was examined by scanning electron microscopy (SEM JEOL JSM6300) equipped with EDS. Fourier transform infrared analysis was performed in a Perkin Elmer Spectrum RX FTIR system (Waltham, MA, USA). The samples were diluted in KBr (1% w/w sample) and pressed in pellet form with 8 atm pressure. The point of zero charge was determined using the potentiometric mass titration method []. A suspension of 0.1 g in 75 mL of NaNO3 0.03 M was titrated with 0.1 M HNO3 from pH 11 to 2 and the titration curve was compared with the corresponding curve of the solution. The section point of the two curves is the point of zero charge of the solid sample. The thermogravimetric analysis of the samples was performed in a TGA Perkin Elmer system (Waltham, MA, USA) under an air atmosphere with a flow of 20 mL min−1. The heating rate was 10 °C min−1 in the temperature range of 80–700 °C. Diffuse reflectance spectroscopy (DRS) was performed using a UV–Vis spectrophotometer (Varian Cary 3) equipped with an integration sphere. The spectra of the solid samples were recorded in the range of 200–800 nm using PTFE or commercial CeO2 as references. The powder samples were mounted in a quartz cell, which provided a sample thickness >3 mm to guarantee the “infinite” sample thickness. Raman spectra were taken on a Micro Raman Spectroscopy system (Jobin–Yvon Horiba LabRam–HR) with a 514 nm line of an Ar ion laser at room temperature. A 50× microscope objective lens was used to focus the laser beam and collection of the scattered light. Typical spectrum acquisition time was 5 s.
2.4. Catalytic Activity
A stock solution of SMX (50 mg L−1) in UPW was prepared and used for all the catalytic tests. In a typical run, 120 mL of an aqueous solution containing 500 μg L−1 SMX and 90 mg L−1 BC were loaded into a beaker under stirring at ambient temperature. After 20 min of equilibration, SPS was added. Samples of 1.2 mL were periodically drawn from the reactor, an excess of methanol was added (5 mol L−1) to quench the reaction and the samples were filtered and analyzed using high-performance liquid chromatography (HPLC) (Waters Alliance 2695, Waters 2996 Milford, PA, USA). More details about the catalytic tests and analysis can be found in [].
3. Results and Discussion
3.1. Samples Characterization
The biochar from malt spent rootlets had a moderate specific surface area, SSA, of 100 m2 g−1 a point of zero charge, pzc, equal to 8.2 and 32% minerals. Following treatment with H2SO4, the concentration of minerals diminished since they were soluble in acidic solution, while SSA increased considerably to 428 m2 g−1. The microporosity was also high (190 m2 g−1) and the pzc shifted to more acidic values. These properties make the treated biochar an ideal candidate for the preparation of hybrid ceria–biochar materials. The low value of pzc ensures a positively charged surface, where cations can be deposited. The high SSA favors the adsorption of considerable quantities of cations, while the micropores can prevent the formation of bulk precipitates during drying. The deposition of Ce ions can easily be performed with wet impregnation, during which Ce(III) ions interact with the biochar surface through electrostatic adsorption because of the low value of pzc. The high value of SSA and microporosity allows for the deposition of well-dispersed Ce particles. Finally, the calcination process can provide the possibility of controlling the biochar content and, in parallel, to convert the Ce precursor form to CeO2 nanoparticles. With the regulation of calcination temperature, one can prepare hybrid materials BC–CeO2 with different biochar contents.
The prepared samples, alongside their properties, are presented in Table 1.

Table 1.
Physicochemical characteristics of the prepared samples.
Interestingly, increasing the calcination time from 2 to 5 h at 300 °C did not practically alter the properties of the prepared samples. Although longer calcination times were not tested at higher temperatures (where the BC content is lower), one could possibly expect to see detrimental effects on physicochemical properties such as SSA, Eg, and oxygen vacancies due to extensive sintering.
The adsorption/desorption isotherms for the hybrid samples are presented in Figure 1. The SSA was lower at higher temperatures of calcination. The samples calcined at 300–400 °C exhibited type IV with an H4 hysteresis loop, while for the BC/Ce-500 sample, the hysteresis loop was between H3 and H4. H4 loops are often found in micro-meso porous carbon materials []. The BC/Ce-500 sample also exhibited limited N2 adsorption at low P/Po values, suggesting low microporosity, in contrast with the other three samples. SSA values were higher than the commercial CeO2 with a SSA of 4 m2 g−1.
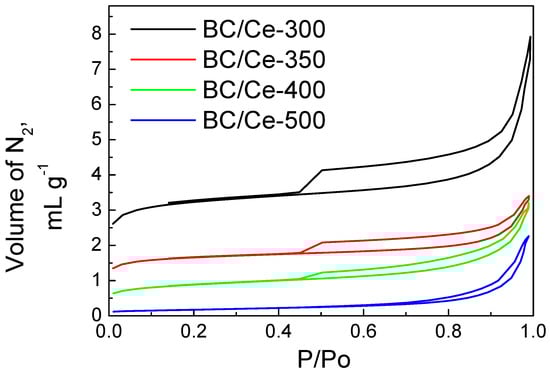
Figure 1.
The N2 adsorption–desorption isotherms for the prepared samples.
This was confirmed by the pore size distribution shown in Figure 2. The BC/Ce-500 had a limited amount of micropores (if any), in contrast with the other samples calcined at lower temperatures. For the BC/Ce-500 sample, there was a peak centered at about 85 nm, while the main peak was at 60 nm for the other samples; an additional peak was centered at 13 nm for BC/Ce-400. This increment in pore diameter was due to higher calcination temperature and the collapse of microporosity.
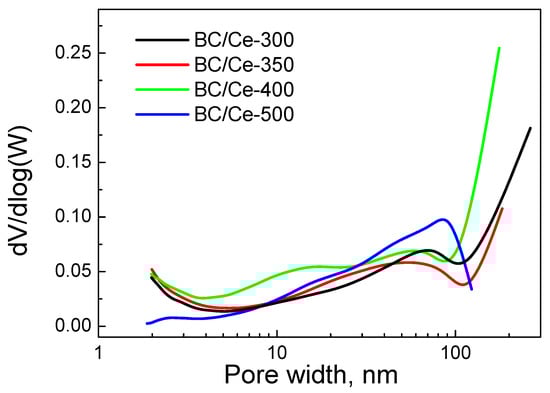
Figure 2.
Pore size distribution for the studied samples.
The TGA curves for the prepared samples as well as the mixed material before calcination (BC/Ce) are presented in Figure 3. The % mass left after TGA was due to the CeO2 content in each hybrid material and the difference from the starting mass is characteristic of the biochar content.
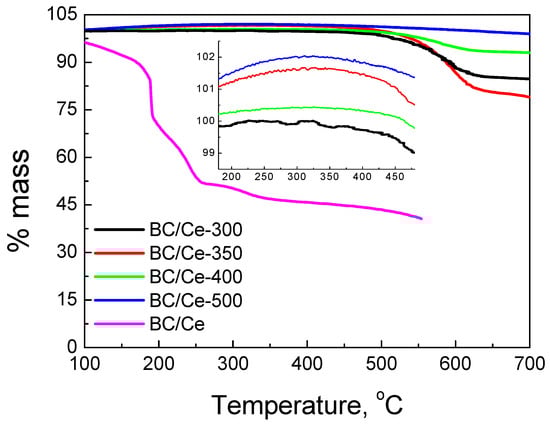
Figure 3.
TGA curves under an air atmosphere for the studied samples as well as the uncalcined one.
As can be seen, the amount of mass left after TGA was significant and depends on the calcination temperature (see also Table 1). This means that the amount of biochar left after calcination was limited and the samples mostly consisted of CeO2. The biochar content was 22% for the BC/Ce-350 sample and 16% for the BC/Ce-300 sample, while the other two samples calcined at higher temperatures had an even lower content. Although the BC/Ce-300 sample should be expected to have a higher BC content than the BC/Ce-350 sample, this discrepancy may be attributed to the low difference in the respective calcination temperatures.
For the starting material before calcination, there was first sharp mass decrease at 185 °C, which was followed by a second step at 190 °C. This step was completed at about 260 °C, while the mass was quite stable at higher temperatures. Therefore, a temperature up to 300 °C seems to be sufficient to transform the precursors to CeO2 nanoparticles. The mass left at temperatures higher than 550 °C was about 42% of the starting mass, very close to the value of the nominal CeO2 content (41%), which implies that the starting material is transformed to CeO2 at temperatures up to 500 °C.
The FTIR spectra of the prepared samples are presented in Figure 4, together with the spectra of BC and commercial CeO2. The FTIR peaks were more intense in the prepared materials in contrast with the commercial CeO2. This may be due to the different SSA values, which were higher in the prepared samples, suggesting the existence of more surface groups. On the other hand, the BC/Ce-300 and BC/Ce-350 samples had peaks with low intensity, suggesting that CeO2 was less bulk in these samples.
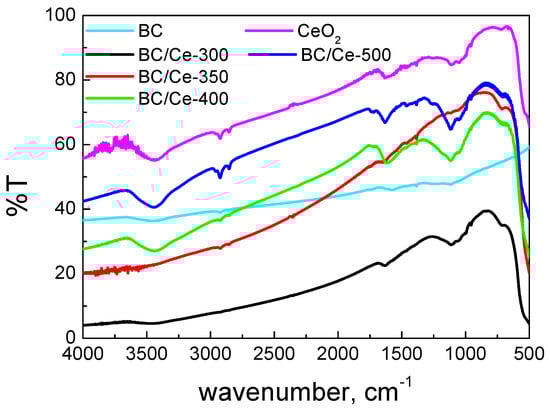
Figure 4.
FTIR spectra for the studied samples as well as the starting biochar and a commercial CeO2 sample.
The XRD patterns of the prepared samples, alongside the BC and commercial CeO2, are presented in Figure 5; the main peaks can be evidently attributed to CeO2. The average diameter of the CeO2 particles calculated from the Scherrer equation varied from 29.7 to 16 nm, while for the commercial CeO2, it was 46.2 nm.
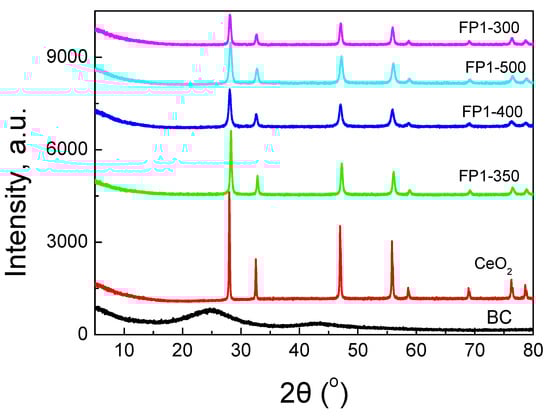
Figure 5.
XRD patterns for the studied samples as well as the starting biochar and a commercial CeO2 sample.
The acid–base behavior of the samples is presented in Figure 6. The potentiometric titration curves revealed that the two materials prepared at the lower calcination temperatures had a pzc near 7 (6.8 and 6.5 for the BC/Ce-300 and BC/Ce-350, respectively), while the two other samples had a pzc value equal to 3, pointing out the acidity of these samples. Generally, low pzc values have been reported for CeO2 when the precursor is Ce(III) salt, as in our case [].
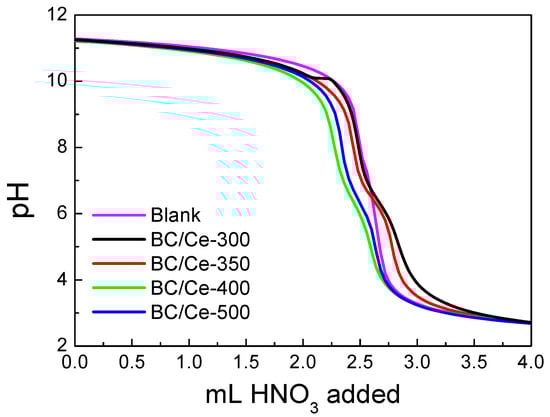
Figure 6.
Potentiometric mass titration curves for the studied samples as well as the corresponding solution titration curve.
SEM images of the prepared samples are presented in Figure 7, where the progressive removal of BC and the transformation to a more solid CeO2 phase could be observed. For the BC/Ce-350 sample (Figure 7b), BC could clearly be seen, while CeO2 formed around the carbon particles. This was less pronounced in the case of BC/Ce-300 (Figure 7a), although the calcination temperature was lower. There probably exists a minimum calcination temperature needed for the formation of CeO2 particles and the simultaneous burning of biochar.
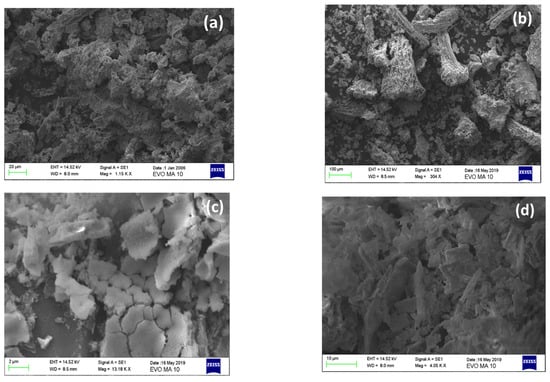
Figure 7.
SEM images for (a) BC/Ce-300, (b) BC/Ce-350, (c) BC/Ce-400, and (d) BC/Ce-500.
On the other hand, higher calcination temperatures lead to greater removal of the carbon phase, and thus CeO2 is better formed. Carbon removal in the form of volatile compounds results in CeO2 cracking and this facilitates the formation of the surface area of the sample; this can be seen in Figure 7c for the BC/Ce-400 sample. Even higher calcination temperatures may result in sintering of the CeO2 particles and, eventually, greater degree of agglomeration (Figure 7d). These findings are in accordance with the SSA values (Table 1) and the XRD results.
The DR spectra of the prepared samples are similar to that of CeO2, especially at wavelengths lower than 400 nm (Figure 8). In the UV and Vis near UV regions, the peaks are due to charge transfer between the Ce(IV) and O2− species. The DR spectrum of CeO2 showed three maxima at about 220, 270, and 330 nm. The peak at 220 nm was assigned to f-d transition of Ce(II), the band at 270 nm to surface sites, and the band at 330 nm to bulk sites [,,,]. The exact location of the peaks is highly influenced by the size of CeO2 crystallites. At wavelengths higher than 400 nm, CeO2 exhibits negligible absorbance and this is also the case for BC/Ce-500 (i.e., the sample with the minimum BC content). The other three samples exhibited a constant absorbance over the whole range of the Vis spectrum, which was due to the black color of the biochar. The absorbance intensity was well correlated to the BC content, with the BC/Ce-350 sample showing the higher intensity. For the prepared samples, the point where a sharp increase in absorbance occurred shifted at higher wavelengths. This implies a change in the distribution of electrons and can be confirmed from the energy gap values for each material. These values were between 3.08–3.12 eV for all the prepared samples and 3.32 eV for commercial CeO2 (Table 1). The observed red shift in the absorbance of the samples is correlated to the smaller size of CeO2 nanoparticles, in contrast with the commercial CeO2.
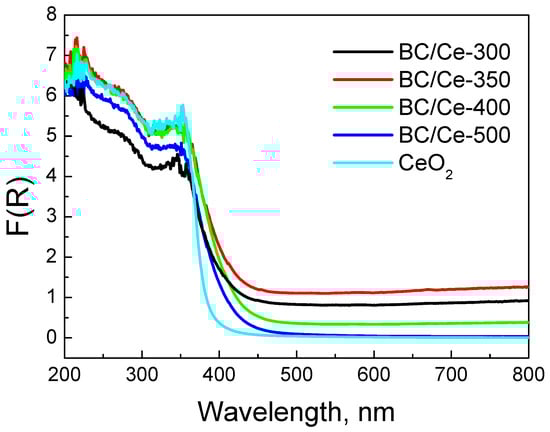
Figure 8.
DR spectra for the studied samples as well as a commercial CeO2 sample. The spectra were collected with PTFE disks as the reference.
Changes in electrons distribution are more clearly demonstrated in Figure 9, where commercial CeO2 was employed as the reference. Indeed, the peak centered at about 400 nm revealed that interactions were more pronounced for the samples with increased BC content.
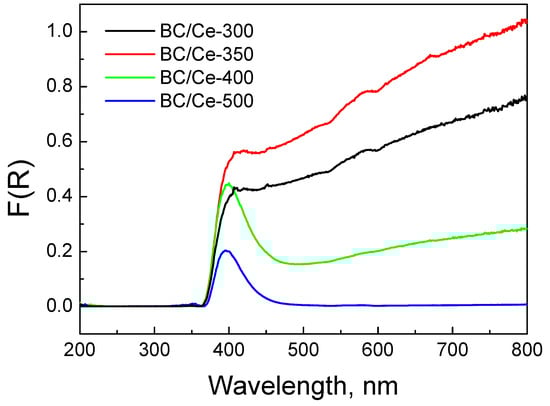
Figure 9.
DR spectra for the studied samples. The spectra were collected with commercial CeO2 as reference.
Figure 10 shows the normalized Raman spectra for the prepared samples. There was an intense peak centered between 460 and 464 cm−1, which corresponded to the F2g Raman vibrational mode of cubic fluorite lattice of CeO2 [,,]. The broadness and asymmetry of the peak imply the existence of nanosized CeO2 particles. The particle size as well as possible changes in composition associated with varying BC content influence the exact position and the broadening of the peak with a shift toward lower frequencies. There was another broad peak at about 600 cm−1, which can be attributed to oxygen vacancies of CeO2 [,]. It is interesting to note that this peak was broader and more intense for the samples with higher BC content.
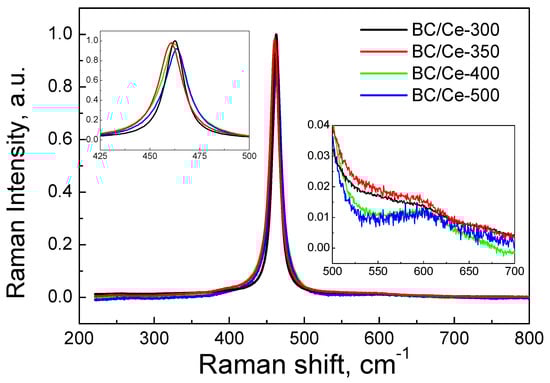
Figure 10.
Normalized Raman spectra for the studied samples.
3.2. Assessment of Catalytic Activity for the Degradation of SMX
Figure 11 shows the relative catalytic activity of the various prepared samples as well as bare biochar and ceria. The time-scale corresponded to the equilibration period where only adsorption occurred, followed by the oxidative degradation period. It must be clarified here that a common equilibration period of 20 min was employed in this work irrespective of the specific experimental conditions (i.e., type of BC-Ce material, SPS concentration, water matrix, etc.), which implies that the level of SMX adsorption might have not been completed during this period; however, the main scope of this work was to study the oxidative rather than the adsorptive removal of SMX. Commercial ceria is not capable of activating SPS and neither is BC/Ce-500, which contained only 2% BC and whose SSA was 14 m2 g−1 (Table 1); however, activity seems to increase with increasing BC content and SSA (i.e., 7%–69 m2 g−1, 16%–119 m2 g−1, and 22%–126 m2 g−1 for BC/Ce-400, BC/Ce-300, and BC/Ce-350, respectively. Bare BC with a SSA of 428 m2 g−1 exhibited good activity relative to that of BC/Ce-300 and BC/Ce-350 samples, although the hybrid samples have lower SSA. An additional run was performed with BC that had not been acid-treated (data not shown for brevity); its performance was comparable to that of the acid-treated sample. Considering that SMX degradation can be modeled by a pseudo-first order kinetic expression, data in Figure 11 can be employed to compute the apparent rate constants, k. The relative activity decreases in the order: BC/Ce-350 (8.9 × 10⁻³) ≈ BC/Ce-300 (8.2 × 10⁻³) > BC (7.4 × 10⁻³) > BC/Ce-400 (4.6 × 10⁻³) > CeO2 (1.4 × 10⁻³) ≈ BC/Ce-500 (1.3 × 10⁻³), with numbers in brackets corresponding to k values expressed in min−1. The dashed line (open symbols) shown in Figure 11 corresponds to a run with the BC/Ce-300 material that had been calcined for 5 h; interestingly, its catalytic activity was similar to that of the material calcined for 2 h (k = 7.8 × 10⁻³), implying that the calcination temperature rather than time is the crucial factor. This finding is also consistent with the similar properties of the two samples, as shown in Table 1.
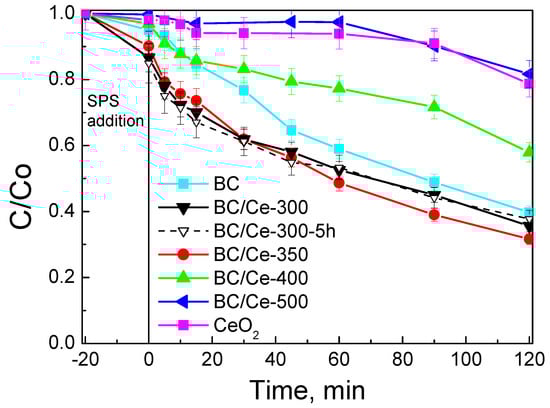
Figure 11.
Screening of various materials (90 mg L−1) for the removal of 500 μg L−1 SMX with 200 mg L−1 SPS in UPW and ambient pH.
Based on the results shown in Figure 11, subsequent activity tests were performed with the BC/Ce-350 material.
The influence of SPS concentration on SMX degradation is presented in Figure 12. In the absence of SPS, SMX removal can occur to a considerable extent due to adsorption only (i.e., 45% at the end of the experiment). The addition of SPS in the range 200–500 mg L−1 promotes SMX removal due to the reactions occurring between the generated radicals and SMX. Interestingly, the rate was not affected by the level of oxidant concentration used with the apparent rate constant being 9.1 ± 0.1 10−3 min−1; this value was about 2.5 times greater than that of pure adsorption.
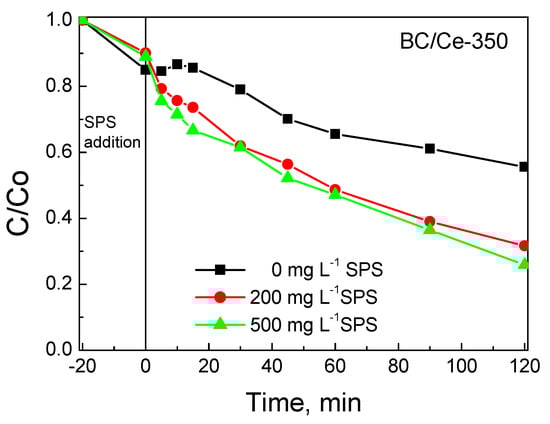
Figure 12.
Effect of SPS concentration on 500 μg L−1 SMX removal with 90 mg L−1 BC/Ce-350 in UPW and ambient pH.
It must be noted here that the minimum effective level of persulfates employed in environmental applications depends on several factors including the type of activation (homogeneous or heterogeneous), the recalcitrance of the contaminant under consideration, the quality of the aquatic phase and, in the case of chemical activators such as transition metals, carbocatalysts, etc., their concentration. On the other hand, there always exists an upper concentration threshold, above which persulfate may act as a self-scavenger and/or introduce secondary water pollution due to the release of sulfate salts in the environment []. From a managerial point of view, solid persulfate is more advantageous than liquid hydrogen peroxide employed in traditional Fenton chemistry since it is more stable, easier to handle, store, and transport, and has a lower market price.
Since the pzc value of BC/Ce-350 was 6.5 (Table 1), its surface was slightly positive at an ambient pH of 5, which favors the attraction of the negatively charged S2O82− anions. SMX, on the other hand, was neutral at pKa1 = 1.77 < pH < pka2 = 5.65 [,,,]. SMX was positively charged at pH < 1.4 (protonation of –NH2 group) and negatively charged at pH > 5.65 (deprotonation of –NH). To assess the effect of the initial solution pH on SMX removal, experiments were performed by adjusting the ambient pH = 5 to more acidic (pH = 3) or basic conditions (pH = 9), and the results are shown in Figure 13a for adsorption in the absence of an oxidant and 13b for oxidative degradation.
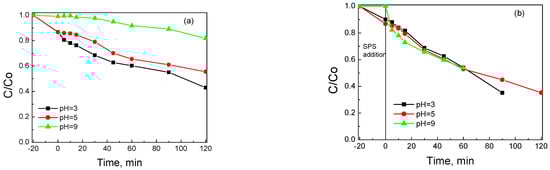
Figure 13.
Influence of solution pH on (a) adsorption without SPS and (b) degradation with 200 mg L−1 SPS of 500 μg L−1 SMX on 90 mg L−1 BC/Ce-350.
Lower pH values seem to favor SMX adsorption, which is limited at alkaline conditions where both the surface and SMX are negatively charged; the respective k values are 1.4 × 10⁻³, 3.9 × 10⁻³, and 5.4 × 10⁻³ min–1 at pH 9, 5, and 3, respectively. Unlike adsorption, the oxidative degradation of SMX does not seem to be affected by the initial solution pH (Figure 13b), with the k value being about 8.9 × 10⁻³ min–1 for all three experiments. This is probably due to the fact that the solution pH is not buffered and there is a fast pH decrease from the initial value of 9 or 5 to 6 or 3, respectively, upon the addition of SPS, whose activation initiates oxidation reactions as well as generates HSO4–, a moderate acid. For the run performed at pH = 3, this value did not change throughout the course of the reaction. In this respect, unbuffered systems are beneficial since the spontaneous pH shift to lower values favors SMX removal. The influence of pH on the adsorption and degradation of SMX was similar to that in a previous work [], where biochar from spent coffee grounds was employed as a SPS activator.
The effect of water matrix on SMX removal is depicted in Figure 14. Reactivity decreased with increasing matrix complexity (i.e., UPW (8.9 × 10⁻³) > BW (3.2 × 10⁻³) > WW (1.6 × 10⁻³)), with numbers in brackets showing k values in min−1. The role of the water matrix is associated with the various inorganic and organic, non-target species that are inherently present and may compete with SMX for the active catalytic sites and/or the oxidant.
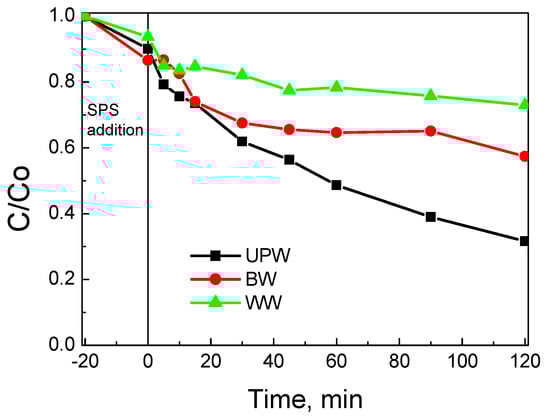
Figure 14.
Effect of water matrix on 500 μg L−1 SMX removal with 90 mg L−1 BC/Ce-350 and 200 mg L−1 SPS at ambient pH.
To shed light on such interplays, experiments were conducted in UPW spiked with various non-target species and the results are shown in Figure 15. The addition of 250 mg L−1 bicarbonate (this concentration is typical for BW) seriously impedes SMX removal, leading to a k value of 10−3 min−1 (i.e., nine times lower than in UPW). A possible explanation involves the detrimental role of carbonate ions that may (i) occupy catalytic sites, thus reducing SMX adsorption (as can be seen in Figure 15), and (ii) scavenge hydroxyl and sulfate radicals, while forming the less active carbonate radicals, in other words,
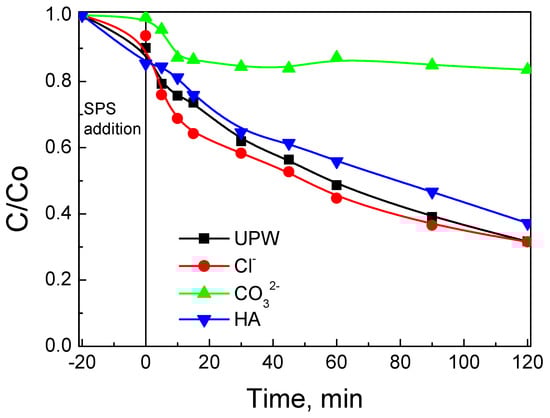
Figure 15.
Effect of inorganic ions and humic acid on 500 μg L−1 SMX removal with 90 mg L−1 BC/Ce-350 and 200 mg L−1 SPS in UPW at ambient pH.
The addition of 250 mg L−1 chloride has practically no effect on degradation although hydroxyl and sulfate radicals may now react with chloride to form various Cl-containing radicals, in other words,
In a final test, UPW was added to 10 mg L−1 humic acid (HA), an analogue of the organic matter typically found in natural waters (the chosen concentration corresponded to the organic carbon content of WW). The effect of HA was mildly negative, leading to a k value of 7 × 10⁻³ min−1; HA, a recalcitrant molecule against chemical oxidation, is likely to competitively consume oxidants as well as occupy catalytic sites, both of which are detrimental to SMX degradation.
Finally, the role of different scavengers was investigated (Figure 16). The addition of methanol (that reacts with both hydroxyl and sulfate radicals) or t-butanol (that preferentially reacts with hydroxyl radicals) at 10 g L−1 retarded SMX degradation with the apparent rate constant being 5.7 ± 0.1 × 10⁻³ min–1 (i.e., a 35% decrease compared to the run in UPW). This implies that other species are also involved in the degradation mechanism. An additional experiment was performed adding 100 mg L−1 NaN3, a well-known scavenger for singlet oxygen []; in this case, the k value decreased to 3.7 × 10⁻³ min–1, thus pointing out the crucial role of active oxygen species in the degradation process. As a matter of fact, the surface oxygen atoms of CeO2 may participate in the reaction, which is consistent with the high quantity of surface oxygen vacancies in the BC/Ce-350 sample, as has been demonstrated by TGA and Raman spectroscopy.
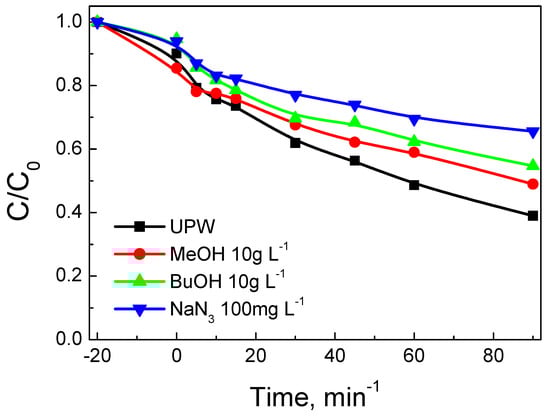
Figure 16.
Effect of methanol, t-butanol, and sodium azide on 500 μg L−1 SMX degradation with 90 mg L−1 BC/Ce-350 and 200 mg L−1 SPS in UPW at ambient pH.
Moreover, the interactions with biochar are important, as can be seen from the DR spectra (Figure 9). Such interactions change the electron distribution in CeO2 and regulate the surface reactivity. Figure 17 shows a correlation between the F(R) values of the prepared samples at 400 nm and the k values computed from the data of Figure 11. There appears to be a linear dependence, which implies that interactions are related to the occupied oxygen vacancies in CeO2 by the –OH groups of the CeO2 surface and/or the active oxygen species formed during SPS activation. The observed correlation suggests that the main active surface sites are these species, in accordance with the detrimental effect of NaN3.
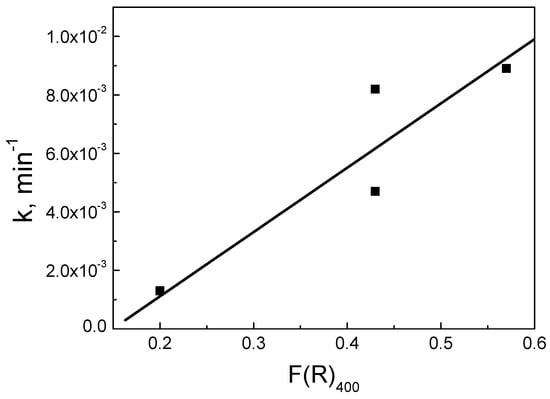
Figure 17.
Correlation of k values with the absorbance of the BC/Ce samples at 400 nm. Experimental conditions as shown in Figure 11.
4. Conclusions
In this work, hybrid materials based on biochar and CeO2 were prepared with a simple wet impregnation method, characterized by various techniques and eventually tested for their catalytic activity to activate persulfate and degrade a model antibiotic compound. The main conclusions are as follows:
- Changing the calcination temperature in the range of –500 °C affected the biochar content and the physicochemical properties of CeO2, but more importantly, determines the interactions between biochar and CeO2 and, eventually, the catalytic activity.
- Calcination at 300–350 °C yielded the more active materials for persulfate activation and sulfamethoxazole degradation; the latter following pseudo-first order kinetics with the rate depending on the operating conditions.
- The water matrix is crucial for process performance since various inorganic and/or organic species can interfere with the surface and/or the target contaminant for the oxidants and the active catalytic sites. Hybrid materials may minimize such competitive interactions that do not exist in model experiments performed in pure water. Should this be the case, hybrid materials are likely to outperform bare biochar in environmentally relevant systems.
- Radicals and singlet oxygen seem to be the main oxidative species, as indirectly evidenced by means of scavenging experiments.
Author Contributions
Conceptualization: J.V. and D.M.; Methodology: J.V.; Resources: D.M. and E.H.; Investigation: J.V., G.P. and P.N.; Writing: J.V., D.M. and E.H. All authors have read and agreed to the published version of the manuscript.
Funding
This research received no external funding.
Conflicts of Interest
The authors declare no conflict of interest.
References
- Fauzi, A.A.; Jalil, A.A.; Hassan, N.S.; Aziz, F.F.A.; Azami, M.S.; Hussain, I.; Saravanan, R.; Vo, D.-V.N. A critical review on relationship of CeO2-based photocatalyst towards mechanistic degradation of organic pollutant. Chemosphere 2022, 286, 131651. [Google Scholar] [CrossRef]
- Kappis, K.; Papadopoulos, C.; Papavasiliou, J.; Vakros, J.; Georgiou, Y.; Deligiannakis, Y.; Avgouropoulos, G. Tuning the Catalytic Properties of Copper-Promoted Nanoceria via a Hydrothermal Method. Catalysts 2019, 9, 138. [Google Scholar] [CrossRef] [Green Version]
- Kumar, A.; Singh, E.; Mishra, R.; Kumar, S. Biochar as environmental armour and its diverse role towards protecting soil, water and air. Sci. Total Environ. 2022, 806, 150444. [Google Scholar] [CrossRef]
- Ntzoufra, P.; Vakros, J.; Frontistis, Z.; Tsatsos, S.; Kyriakou, G.; Kennou, S.; Manariotis, I.D.; Mantzavinos, D. Effect of Sodium Persulfate Treatment on the Physicochemical Properties and Catalytic Activity of Biochar Prepared from Spent Malt Rootlets. J. Environ. Chem. Eng. 2021, 9, 105071. [Google Scholar] [CrossRef]
- Qin, J.; Lu, J.; Cao, M.; Hu, C. Synthesis of porous CuO–CeO2 nanospheres with an enhanced low-temperature CO oxidation activity. Nanoscale 2010, 2, 2739–2743. [Google Scholar] [CrossRef] [PubMed]
- Kašpar, J.; Fornasiero, P.; Graziani, M. Use of CeO2-based oxides in the three-way catalysis. Catal. Today 1999, 50, 285–298. [Google Scholar] [CrossRef]
- Mai, H.-X.; Sun, L.-D.; Zhang, Y.-W.; Si, R.; Feng, W.; Zhang, H.-P.; Liu, H.-C.; Yan, C.-H. Shape-Selective Synthesis and Oxygen Storage Behavior of Ceria Nanopolyhedra, Nanorods, and Nanocubes. J. Phys. Chem. B 2005, 109, 24380–24385. [Google Scholar] [CrossRef]
- Lykaki, M.; Pachatouridou, E.; Iliopoulou, E.; Carabineiro, S.A.; Konsolakis, M. Impact of the synthesis parameters on the solid state properties and the CO oxidation performance of ceria nanoparticles. RSC Adv. 2017, 7, 6160–6169. [Google Scholar] [CrossRef] [Green Version]
- Sayle, T.X.T.; Parker, S.C.; Catlow, C.R.A. The role of oxygen vacancies on ceria surfaces in the oxidation of carbon monoxide. Surf. Sci. 1994, 316, 329–336. [Google Scholar] [CrossRef]
- Conesa, J. Computer modeling of surfaces and defects on cerium dioxide. Surf. Sci. 1995, 339, 337–352. [Google Scholar] [CrossRef]
- Wu, Z.; Li, M.; Overbury, S.H. On the structure dependence of CO oxidation over CeO2 nanocrystals with well-defined surface planes. J. Catal. 2012, 285, 61–73. [Google Scholar] [CrossRef]
- Konsolakis, M. The role of Copper-Ceria interactions in catalysis science: Recent theoretical and experimental advances. Appl. Catal. B Environ. 2016, 198, 49–66. [Google Scholar] [CrossRef]
- Konsolakis, M.; Lykaki, M. Recent Advances on the Rational Design of Non-Precious Metal Oxide Catalysts Exemplified by CuOx/CeO2 Binary System: Implications of Size, Shape and Electronic Effects on Intrinsic Reactivity and Metal-Support Interactions. Catalysts 2020, 10, 160. [Google Scholar] [CrossRef] [Green Version]
- Puigdollers, A.R.; Schlexer, P.; Tosoni, S.; Pacchioni, G. Increasing oxide reducibility: The role of metal/oxide interfaces in the formation of oxygen vacancies. ACS Catal. 2017, 7, 6493–6513. [Google Scholar] [CrossRef] [Green Version]
- Chen, Y.; Lai, Z.; Zhang, X.; Fan, Z.; He, Q.; Tan, C.; Zhang, H. Phase engineering of nanomaterials. Nat. Rev. Chem. 2020, 4, 243–256. [Google Scholar] [CrossRef]
- Konsolakis, M.; Lykaki, M. Facet-Dependent Reactivity of Ceria Nanoparticles Exemplified by CeO2-Based Transition Metal Catalysts: A Critical Review. Catalysts 2021, 11, 452. [Google Scholar] [CrossRef]
- Li, R.; Deng, H.; Zhang, X.; Wang, J.J.; Awasthi, M.K.; Wang, Q.; Xiao, R.; Zhou, B.; Du, J.; Zhang, Z. High-efficiency removal of Pb(II) and humate by a CeO2–MoS2 hybrid magnetic biochar. Bioresour. Technol. 2019, 273, 335–340. [Google Scholar] [CrossRef]
- Melchionna, M.; Bevilacqua, M.; Fornasiero, P. The electrifying effects of carbon-CeO2 interfaces in (electro)catalysis. Mater. Today Adv. 2020, 6, 1000502. [Google Scholar] [CrossRef]
- Khataee, A.; Gholami, P.; Kalderis, D.; Pachatouridou, E.; Konsolakis, M. Preparation of novel CeO2-biochar nanocomposite for sonocatalytic degradation of a textile dye. Ultrason. Sonochem. 2018, 41, 503–513. [Google Scholar] [CrossRef]
- Pi, L.; Jiang, R.; Cai, W.; Wang, L.; Wang, Y.; Cai, J.; Mao, X. Bionic Preparation of CeO2-Encapsulated Nitrogen Self-Doped Biochars for Highly Efficient Oxygen Reduction. ACS Appl. Mater. Interfaces 2020, 12, 3642–3653. [Google Scholar] [CrossRef]
- Inyang, M.; Dickenson, E. The potential role of biochar in the removal of organic and microbial contaminants from potable and reuse water: A review. Chemosphere 2015, 134, 232–240. [Google Scholar] [CrossRef] [PubMed]
- Shen, B.; Chen, J.; Yue, S.; Li, G. A comparative study of modified cotton biochar and activated carbon based catalysts in low temperature SCR. Fuel 2015, 156, 47. [Google Scholar] [CrossRef]
- Hasa, B.; Martino, E.; Vakros, J.; Trakakis, G.; Galiotis, C.; Katsaounis, A. Effect of carbon support on the electrocatalytic properties of Pt-Ru catalysts. Chem. Electron. Chem. 2019, 6, 4970–4979. [Google Scholar]
- Mian, M.; Liu, G. Recent progress in biochar-supported photocatalysts: Synthesis, role of biochar, and applications. RSC Adv. 2018, 8, 14237. [Google Scholar] [CrossRef] [Green Version]
- Vakros, J. Biochars and their use as transesterification catalysts for biodiesel production: A short review. Catalysts 2018, 8, 562. [Google Scholar] [CrossRef] [Green Version]
- Vakros, J.; Manariotis, I.D.; Dracopoulos, V.; Mantzavinos, D.; Lianos, P. Biochar from Spent Malt Rootlets and Its Application to an Energy Conversion and Storage Device. Chemosensors 2021, 9, 57. [Google Scholar] [CrossRef]
- Tan, X.F.; Liu, Y.G.; Gu, Y.L.; Xu, Y.; Zeng, G.M.; Hu, X.J.; Liu, S.B.; Wang, X.; Liu, S.M.; Li, J. Biochar-based nano-composites for the decontamination of wastewater: A review. Bioresour. Technol. 2016, 212, 318–333. [Google Scholar] [CrossRef] [PubMed]
- Grilla, E.; Vakros, J.; Konstantinou, I.; Manariotis, I.D.; Mantzavinos, D. Activation of Persulfate by Biochar from Spent Malt Rootlets for the Degradation of Trimethoprim in the Presence of Inorganic Ions. J. Chem. Technol. Biotechnol. 2020, 95, 2348–2358. [Google Scholar] [CrossRef]
- Lykoudi, A.; Frontistis, Z.; Vakros, J.; Manariotis, I.D.; Mantzavinos, D. Degradation of Sulfamethoxazole with Persulfate Using Spent Coffee Grounds Biochar as Activator. J. Environ. Manag. 2020, 271, 111022. [Google Scholar] [CrossRef]
- Magioglou, E.; Frontistis, Z.; Vakros, J.; Manariotis, I.; Mantzavinos, D. Activation of Persulfate by Biochars from Valorized Olive Stones for the Degradation of Sulfamethoxazole. Catalysts 2019, 9, 419. [Google Scholar] [CrossRef] [Green Version]
- Rodriguez-Mozaz, S.; Vaz-Moreira, I.; Varela Della Giustina, S.; Llorca, M.; Barceló, D.; Schubert, S.; Berendonk, T.U.; Michael-Kordatou, I.; Fatta-Kassinos, D.; Martinez, J.L.; et al. Antibiotic residues in final effluents of European wastewater treatment plants and their impact on the aquatic environment. Environ. Int. 2020, 140, 105733. [Google Scholar] [CrossRef] [PubMed]
- Bengtsson-Palme, J.; Kristiansson, E.; Larsson, D.G.J. Environmental factors influencing the development and spread of antibiotic resistance. FEMS Microbiol. Rev. 2018, 42, fux053. [Google Scholar] [CrossRef]
- Kemmou, L.; Frontistis, Z.; Vakros, J.; Manariotis, I.D.; Mantzavinos, D. Degradation of antibiotic sulfamethoxazole by biochar–activated persulfate: Factors affecting the activation and degradation processes. Catal. Today 2018, 313, 128–133. [Google Scholar] [CrossRef]
- Ntaflou, M.; Vakros, J. Transesterification activity of modified biochars from spent malt rootlets using triacetin. J. Clean. Prod. 2020, 259, 120931. [Google Scholar] [CrossRef]
- Bourikas, K.; Vakros, J.; Kordulis, C.; Lycourghiotis, A. Potentiometric Mass Titrations: Experimental and Theoretical Establishment of a New Technique for Determining the Point of Zero Charge (PZC) of Metal (Hydr)Oxides. J. Phys. Chem. B 2003, 107, 9441–9451. [Google Scholar] [CrossRef]
- Avramiotis, E.; Frontistis, Z.; Manariotis, I.D.; Vakros, J.; Mantzavinos, D. On the Performance of a Sustainable Rice Husk Biochar for the Activation of Persulfate and the Degradation of Antibiotics. Catalysts 2021, 11, 1303. [Google Scholar] [CrossRef]
- Tala, W.; Chantara, S. Use of spent coffee ground biochar as ambient PAHs sorbent and novel extraction method for GC-MS analysis. Environ. Sci. Pollut. Res. 2019, 26, 13025–13040. [Google Scholar] [CrossRef] [PubMed]
- Gulicovski, J.J.; Bračko, I.; Milonjić, S.K. Morphology and the isoelectric point of nanosized aqueous ceria sols. Mater. Chem. Phys. 2014, 148, 868–873. [Google Scholar] [CrossRef]
- Papavasiliou, J.; Rawski, M.; Vakros, J.; Avgouropoulos, G. A Novel Post-Synthesis Modification of CuO-CeO2 Catalysts: Effect on Their Activity for Selective CO Oxidation. ChemCatChem 2018, 10, 2096–2106. [Google Scholar] [CrossRef]
- Araujo, V.D.; Bellido, J.D.A.; Bernardi, M.I.B.; Assaf, J.M.; Assaf, E.M. CuO–CeO2 catalysts synthesized in one-step: Characterization and PROX performance. Int. J. Hydrogen Energy 2012, 37, 5498–5507. [Google Scholar] [CrossRef]
- Aguilab, G.; Guerrerob, S.; Arayaa, P. Effect of the preparation method and calcination temperature on the oxidation activity of CO at low temperature on CuO–CeO2/SiO2 catalysts. Appl. Catal. A 2013, 462–463, 56–63. [Google Scholar] [CrossRef]
- Rao, G.R.; Mishra, B.G. A comparative UV–vis-diffuse reflectance study on the location and interaction of cerium ions in Al- and Zr-pillared montmorillonite clays. Mater. Chem. Phys. 2005, 89, 110–115. [Google Scholar] [CrossRef]
- Sun, S.; Mao, D.; Yu, J. Enhanced CO oxidation activity of CuO/CeO2 catalyst prepared by surfactant-assisted impregnation method. J. Rare Earths 2015, 32, 1268–1274. [Google Scholar] [CrossRef]
- Lopez, J.M.; Gilbank, A.L.; Garcia, T.; Solsona, B.; Agouram, S.; Torrente-Murciano, L. The prevalence of surface oxygen vacancies over the mobility of bulk oxygen in nanostructured ceria for the total toluene oxidation. Appl. Catal. B 2015, 174–175, 403–412. [Google Scholar] [CrossRef] [Green Version]
- Spanier, J.E.; Robinson, R.D.; Zhang, F.; Chan, S.-W.; Herman, I.P. Size-dependent properties of CeO2−y nanoparticles as studied by Raman scattering. Phys. Rev. B 2001, 64, 245407. [Google Scholar] [CrossRef] [Green Version]
- Wacławek, S.; Lutze, H.V.; Grübel, K.; Padil, V.V.T.; Cerník, M.; Dionysiou, D.D. Chemistry of persulfates in water and wastewater treatment: A review. Chem. Eng. J. 2017, 330, 44–62. [Google Scholar] [CrossRef]
- Schott, H.; Astigarrabia, E. Isoelectric points of some sulfonamides: Determination by microelectrophoresis and by calculations involving acid–base strength. J. Pharm. Sci. 1988, 77, 918–920. [Google Scholar] [CrossRef]
- Avisar, D.; Primor, O.; Gozlan, I.; Mamane, H. Sorption of sulfonamides and tetracyclines to montmorillonite clay. Water Air Soil Pollut. 2010, 209, 439–450. [Google Scholar] [CrossRef]
- Heo, J.; Yoon, Y.; Lee, G.; Kim, Y.; Han, J.; Park, C.M. Enhanced adsorption of bisphenol A and sulfamethoxazole by a novel magnetic CuZnFe2O4–biochar composite. Bioresour. Technol. 2019, 281, 179–187. [Google Scholar] [CrossRef] [PubMed]
- Bancirova, M. Sodium azide as a specific quencher of singlet oxygen during chemiluminescent detection by luminol and Cypridina luciferin analogues. Luminescence 2011, 26, 685–688. [Google Scholar] [CrossRef]
Publisher’s Note: MDPI stays neutral with regard to jurisdictional claims in published maps and institutional affiliations. |
© 2022 by the authors. Licensee MDPI, Basel, Switzerland. This article is an open access article distributed under the terms and conditions of the Creative Commons Attribution (CC BY) license (https://creativecommons.org/licenses/by/4.0/).