Article

Multifaceted Elevation of ROS Generation for Effective Cancer Suppression

1
Stem Cell Clinical Research Center, Shandong Provincial Hospital Affiliated to Shandong First Medical University, Jinan 250021, China
2
Department of Biomedical Engineering, School of Engineering, China Pharmaceutical University, Nanjing 210009, China
*
Author to whom correspondence should be addressed.
These authors contributed equally to this work.
Nanomaterials 2022, 12(18), 3150; https://doi.org/10.3390/nano12183150
Submission received: 15 July 2022 / Revised: 7 September 2022 / Accepted: 8 September 2022 / Published: 11 September 2022
(This article belongs to the Section Biology and Medicines)

Abstract

:
The in situ lactate oxidase (LOx) catalysis is highly efficient in reducing oxygen to H2O2 due to the abundant lactate substrate in the hypoxia tumor microenvironment. Dynamic therapy, including chemodynamic therapy (CDT), photodynamic therapy (PDT), and enzyme dynamic therapy (EDT), could generate reactive oxygen species (ROS) including ·OH and 1O2 through the disproportionate or cascade biocatalytic reaction of H2O2 in the tumor region. Here, we demonstrate a ROS-based tumor therapy by integrating LOx and the antiglycolytic drug Mito-LND into Fe3O4/g-C3N4 nanoparticles coated with CaCO3 (denoted as FGLMC). The LOx can catalyze endogenous lactate to produce H2O2, which decomposes cascades into ·OH and 1O2 through Fenton reaction-induced CDT and photo-triggered PDT. Meanwhile, the released Mito-LND contributes to metabolic therapy by cutting off the source of lactate and increasing ROS generation in mitochondria for further improvement in CDT and PDT. The results showed that the FGLMC nanoplatform can multifacetedly elevate ROS generation and cause fatal damage to cancer cells, leading to effective cancer suppression. This multidirectional ROS regulation strategy has therapeutic potential for different types of tumors.

1. Introduction

Reactive oxygen species (ROS) are active derivatives of oxygen metabolism in the microenvironment of all biological systems [1,2,3,4]. They act as a second messenger in cell signaling and are closely associated with various diseases, including cancers. It has been long postulated that cancer cells exhibit persistently high ROS levels as a consequence of genetic, metabolic, and microenvironment-associated alterations. The escalated ROS generation in cancer cells serves as an endogenous source of DNA-damaging agents that promote genetic instability and the development of drug resistance [5,6,7,8]. Although there are some negative effects of increased ROS in tumor cells, the biochemical features of ROS make it possible to explore non-surgical therapeutic strategies to kill cancer cells through ROS-mediated mechanisms.
Non-surgical therapeutic approaches based on ROS production for cancers have been developed, including chemodynamic therapy (CDT), radiotherapy, photodynamic therapy (PDT), and enzyme dynamic therapy (EDT) [9,10,11,12,13]. The CDT based on Fenton or Fenton-like reaction has focused on utilizing inorganic nanoparticles as nanoenzymes, which can produce the most toxic ROS (·OH) through the disproportionate reaction of H2O2 without external instruments [14,15,16,17]. Additionally, photodynamic therapy (PDT) relies on the light activation of photosensitizers to generate cytotoxic singlet oxygen (1O2) and induces cancer cell death through apoptosis or necrosis [18,19,20,21]. Furthermore, the enzyme dynamic therapy can effectively convert the endogenous ROS (˙O2 and H2O2) into highly reactive 1O2 by the cascade biocatalytic reaction of loaded superoxide dismutase and chloroperoxidase responsively in the tumor region [22].
There are one or more enzymes (e.g., oxidase, catalase, and peroxidase) participating in the H2O2 metabolism. Among them, oxidase can oxidize substrates and reduce oxygen to H2O2. Different from other oxidases, the in situ lactate oxidase (LOx) catalysis display high efficiency due to the abundant lactate substrate in the hypoxia tumor microenvironment (TME) and the ultralow O2 reaction threshold [23,24,25]. The extracellular level of lactate in the TME can be 20-fold higher than that under normal physiological conditions [26,27]. Recently, the strategy of consuming lactate into H2O2 in the TME by lactate oxidase has emerged. The lactate oxidase was loaded in well-designed nanomaterials and carried to accumulate in tumor tissues [25,28,29]. Despite this approach playing important roles in lactate degradation, it failed to utilize the H2O2 to further oxidize a variety of toxic substrates and decrease the production of lactate, which can be transformed from pyruvate at the end of glycolysis. Hence, the strategy of elevating ROS generation and lactate exhaustion might have a profound antitumor effect.
Herein, we designed and developed a pH-responsive nanoplatform to multifacetedly elevate ROS generation by integrating LOx and the antiglycolytic drug Mito-LND into Fe3O4/g-C3N4 nanoparticles coated with CaCO3 (denoted as FGLMC). The mechanisms of which are as follows (Scheme 1): (1) LOx consumes lactic acid in tumor cells, while oxidizing lactic acid to H2O2, which was further converted to ·OH by Fe3O4 NPs through Fenton-like reaction; (2) g-C3N4 combined with O2 under 660 nm activation can generate 1O2 to initiate PDT; (3) The antiglycolytic drug Mito-LND, which was obtained by connecting lonidamine (LND) and triphenylphosphine cation (TPP+) through a long alkyl chain, can accumulate and generate ROS in the mitochondria of tumor cells to cause mitochondrial dysfunction for further dynamic therapy enhancement. This nanoparticle platform based on the multifaceted elevation of ROS generation could achieve the purpose of efficient cancer treatment and has the potential to realize multiple functions of biomedical ROS regulation as a safe and efficient treatment strategy for ROS-related tumors.

2. Results and Discussion

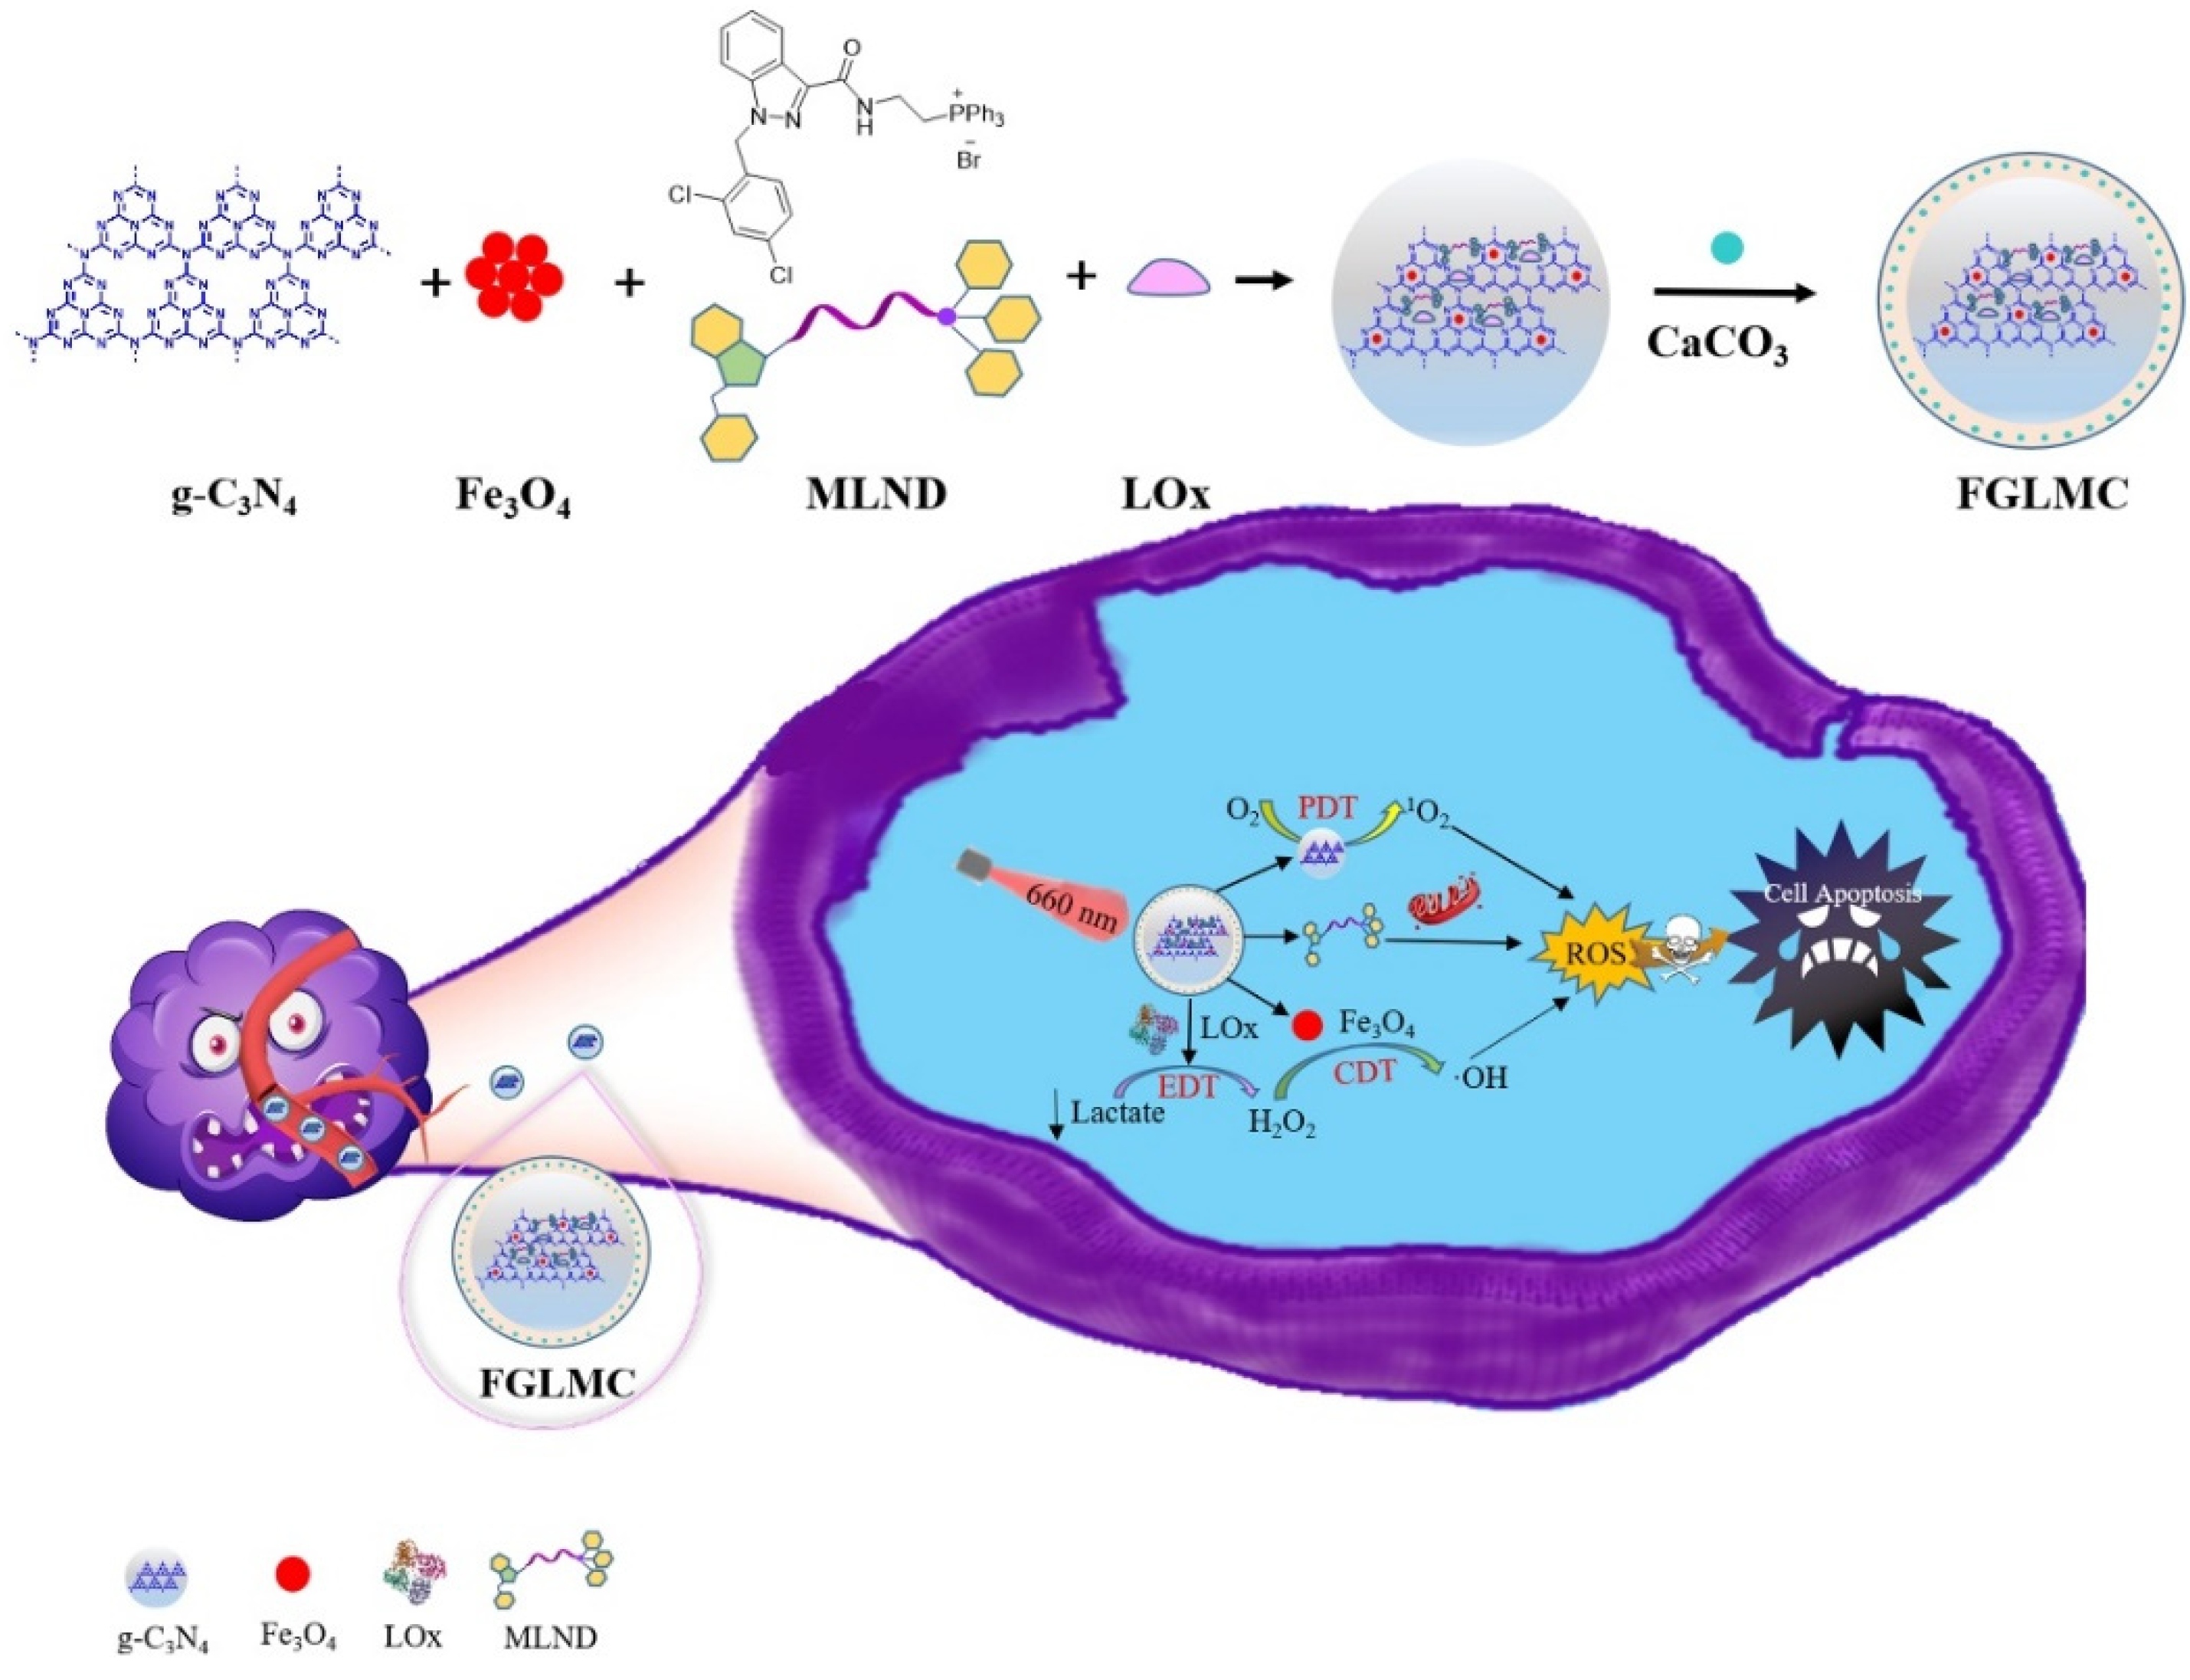
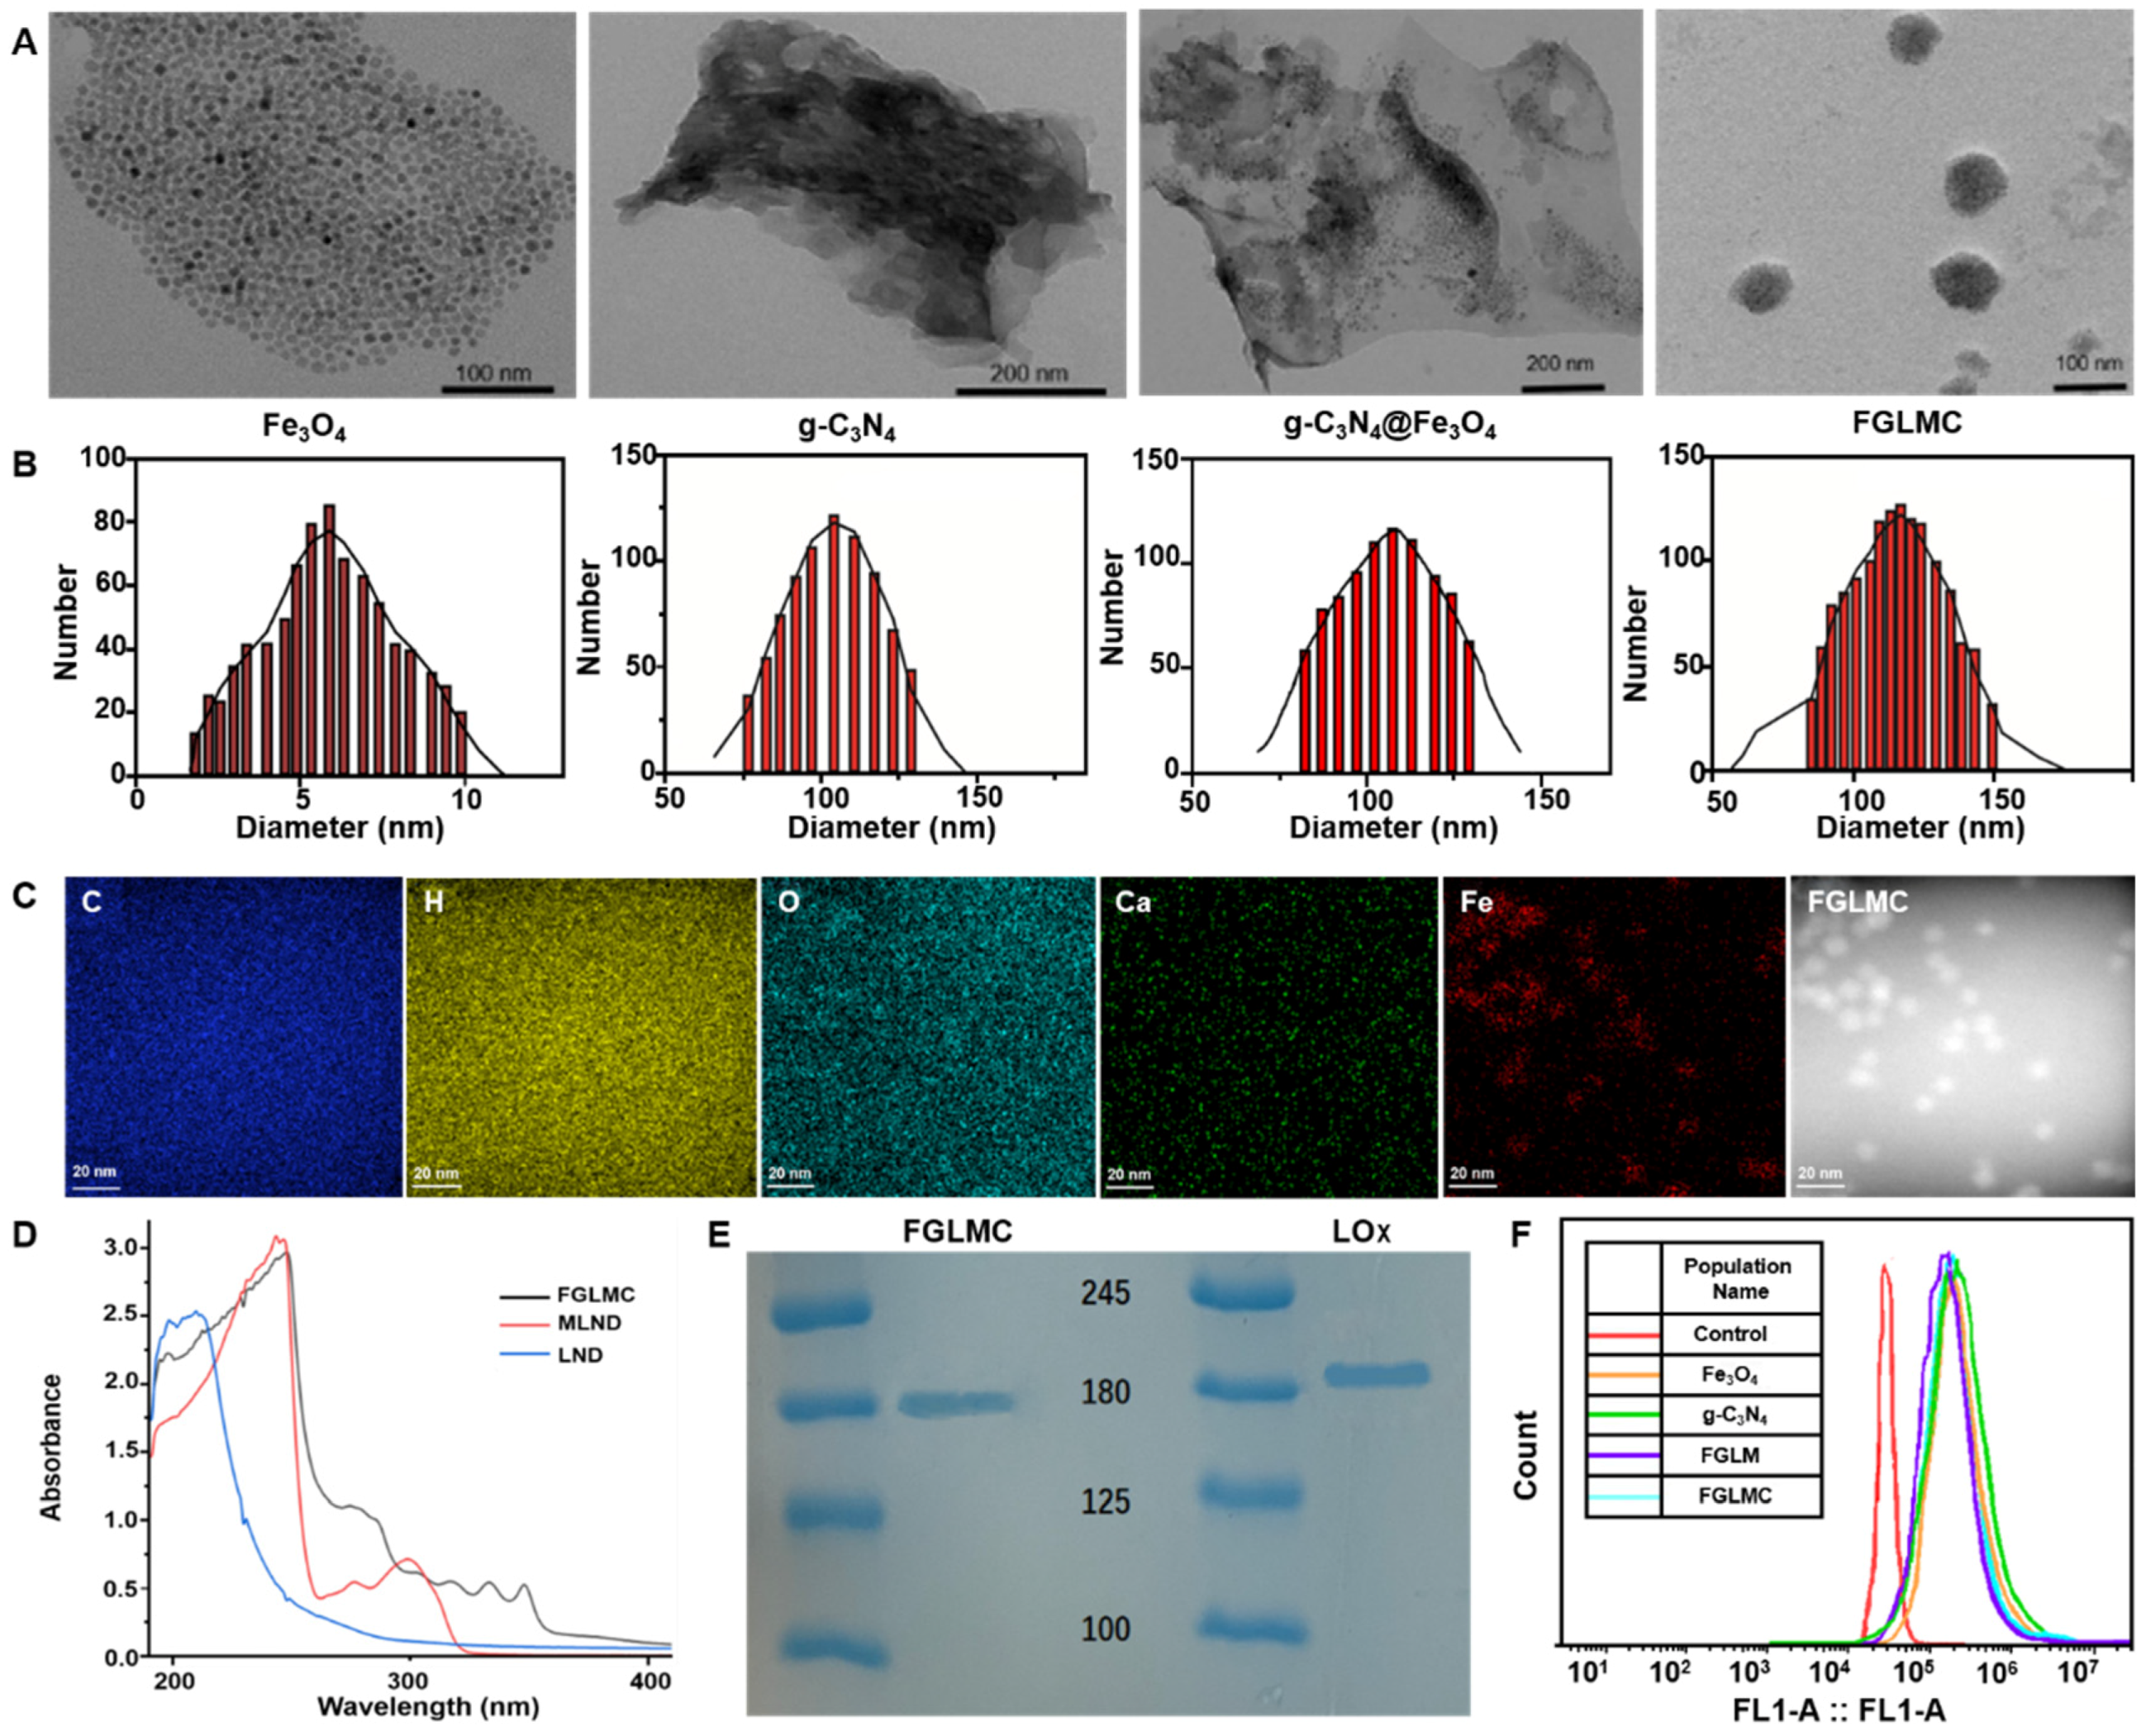
2.1. Synthesis and Characterization of FGLMC

The synthetic procedure for the nanoplatform FGLMC (Fe3O4-LOx-MLND@g-C3N4@CaCO3) involved two main steps. Firstly, the Lonidamine derivative (MLND) with mitochondrial targeting was obtained from Lonidamine and (2-aminoethyl) triphenylphosphonium bromide through amide condensation (Scheme S1). The structure of FGLMC was confirmed by 1H-NMR, 13C-NMR, and electrospray ionization mass spectrometry (ESI-MS) (Figure S1–S3). There were 22 aromatic hydrogen signals in the range δ 7.23–8.20 ppm, which was consistent with the five benzene ring skeletons of MLND. The NH signal at 8.93 ppm allowed us to confirm the successful construction of the amide bond. The single peak at 5.69 ppm was the result of the coupling of the methylene group with its adjacent N atom. The positions at 4.13 and 4.02 ppm corresponded to two adjacent methylene groups, respectively. Secondly, the Fe3O4@g-C3N4-LOx-MLND (FGLM) nanosystem was constructed by loading MLND, Fe3O4 nanoparticles, and LOx-NH2 on g-C3N4, which possess a sheet structure. Specifically, MLND and Fe3O4 nanoparticles, g-C3N4, and LOx-NH2 were sonicated together, placed in the dark, and then lyophilized to remove the solvent. Then, the CaCl2 powder was dissolved in an aqueous solution of FGLM and saturated with carbon dioxide, volatilized by ammonium bicarbonate in a sealed environment to obtain the final nanoplatform FGLMC encapsulated by CaCO3.
Transmission electron microscopy (TEM) (Figure 1A) and dynamic light scattering (DLS) (Figure 1B) determination indicated that Fe3O4 NPs presented regular squares and the diameter in an aqueous solution was about 5 nm. The g-C3N4 nanosheets had a sheet-like and porous structure with a diameter of 65 nm. In addition, it can be observed that the g-C3N4 nanosheets were loaded with uniform-sized Fe3O4 NPs and the diameter was 95 nm and the hydrated particle size was 115.4 nm. The surface of FGLMC was covered with a calcium carbonate film, and its hydrated particle size was 130 nm. In addition, the TEM-Element Mapping image of FGLMC indicated the presence of Ca elements, which further proved the successful loading of CaCO3 (Figure 1C). The ultraviolet-visible absorption spectroscopy revealed the successful encapsulation of MLND in FGLMC (Figure 1D).

2.1.1. LOx Loading

The successful loading of LOx was verified by sodium dodecyl sulfate-polyacrylamide gel electrophoresis (SDS-PAGE) and Coomassie Brilliant Blue Staining. It showed that the FGLMC group and the LOx group were on the same line, indicating that LOx was widely retained in the FGLMC nano-drug delivery system (Figure 1E).

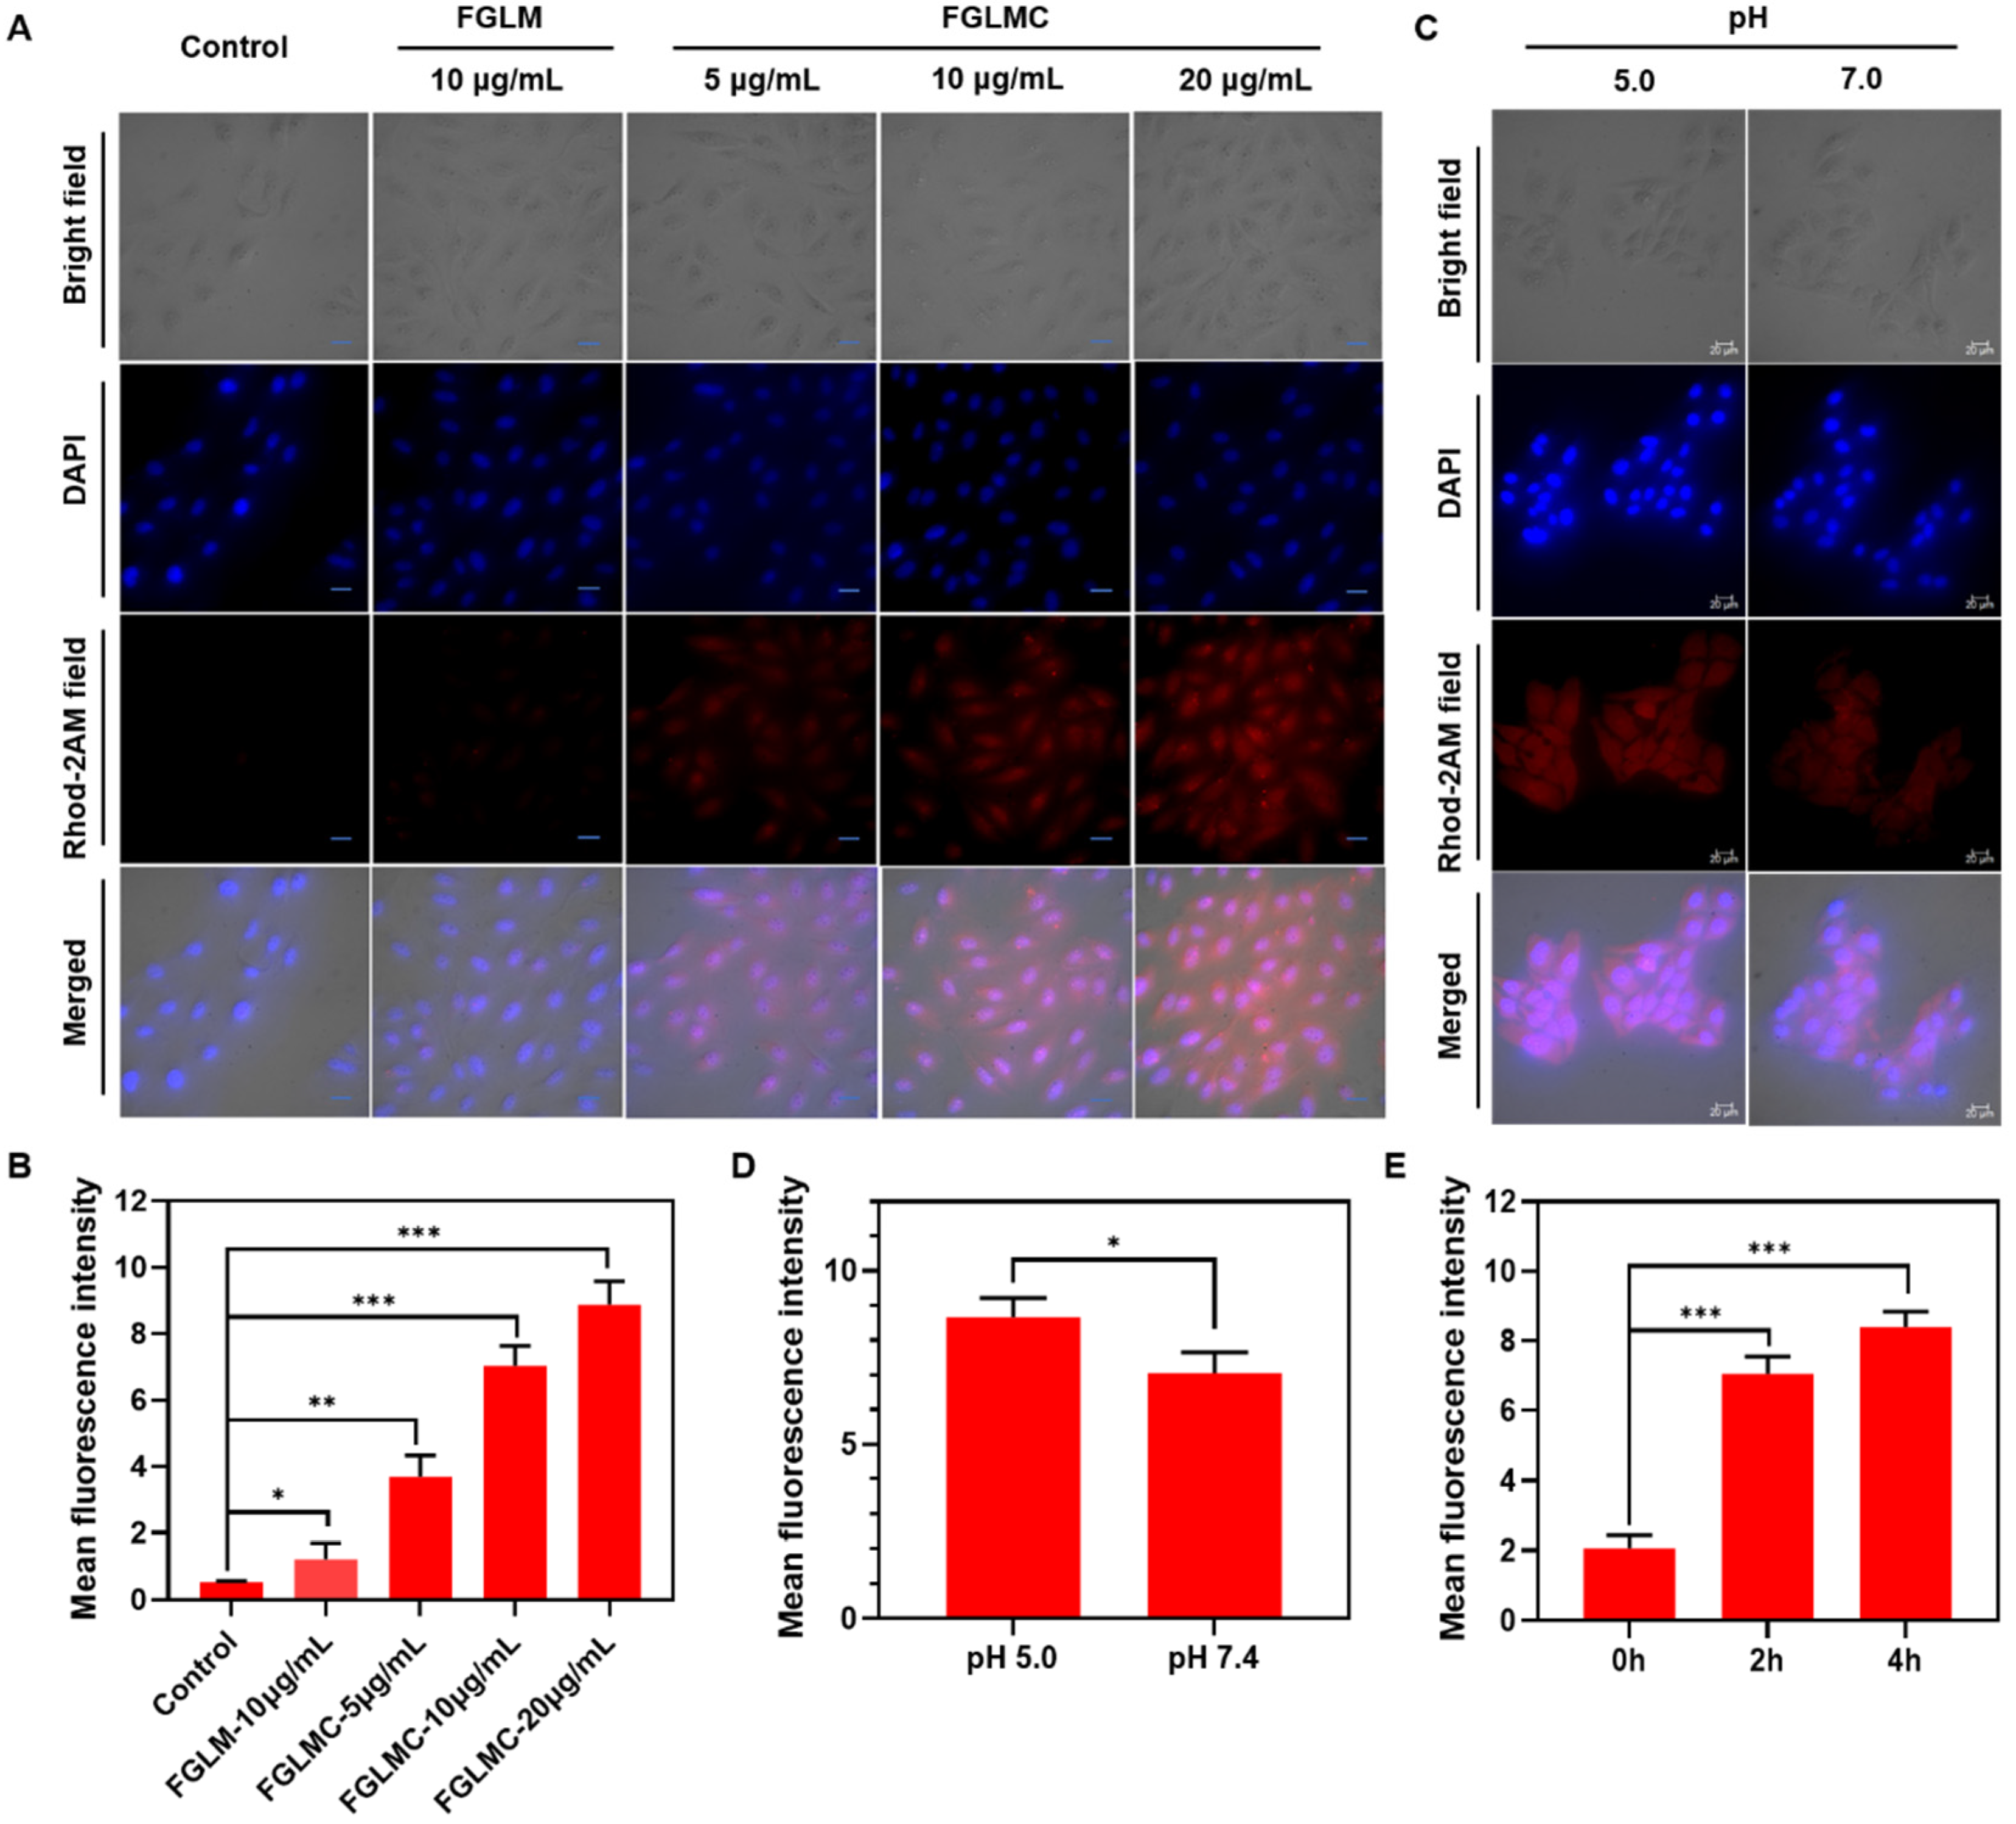
2.1.2. Mitochondrial Targeting

We further explored the mitochondrial targeting capabilities of different components by using the JC-1 mitochondrial membrane potential probe. After the MCF-7 cells were stained and performed by flow cytometry, we found that the FGLM and FGLMC groups showed superior membrane potential to the control group (Figure 1F).

2.1.3. Ca2+ Releasing
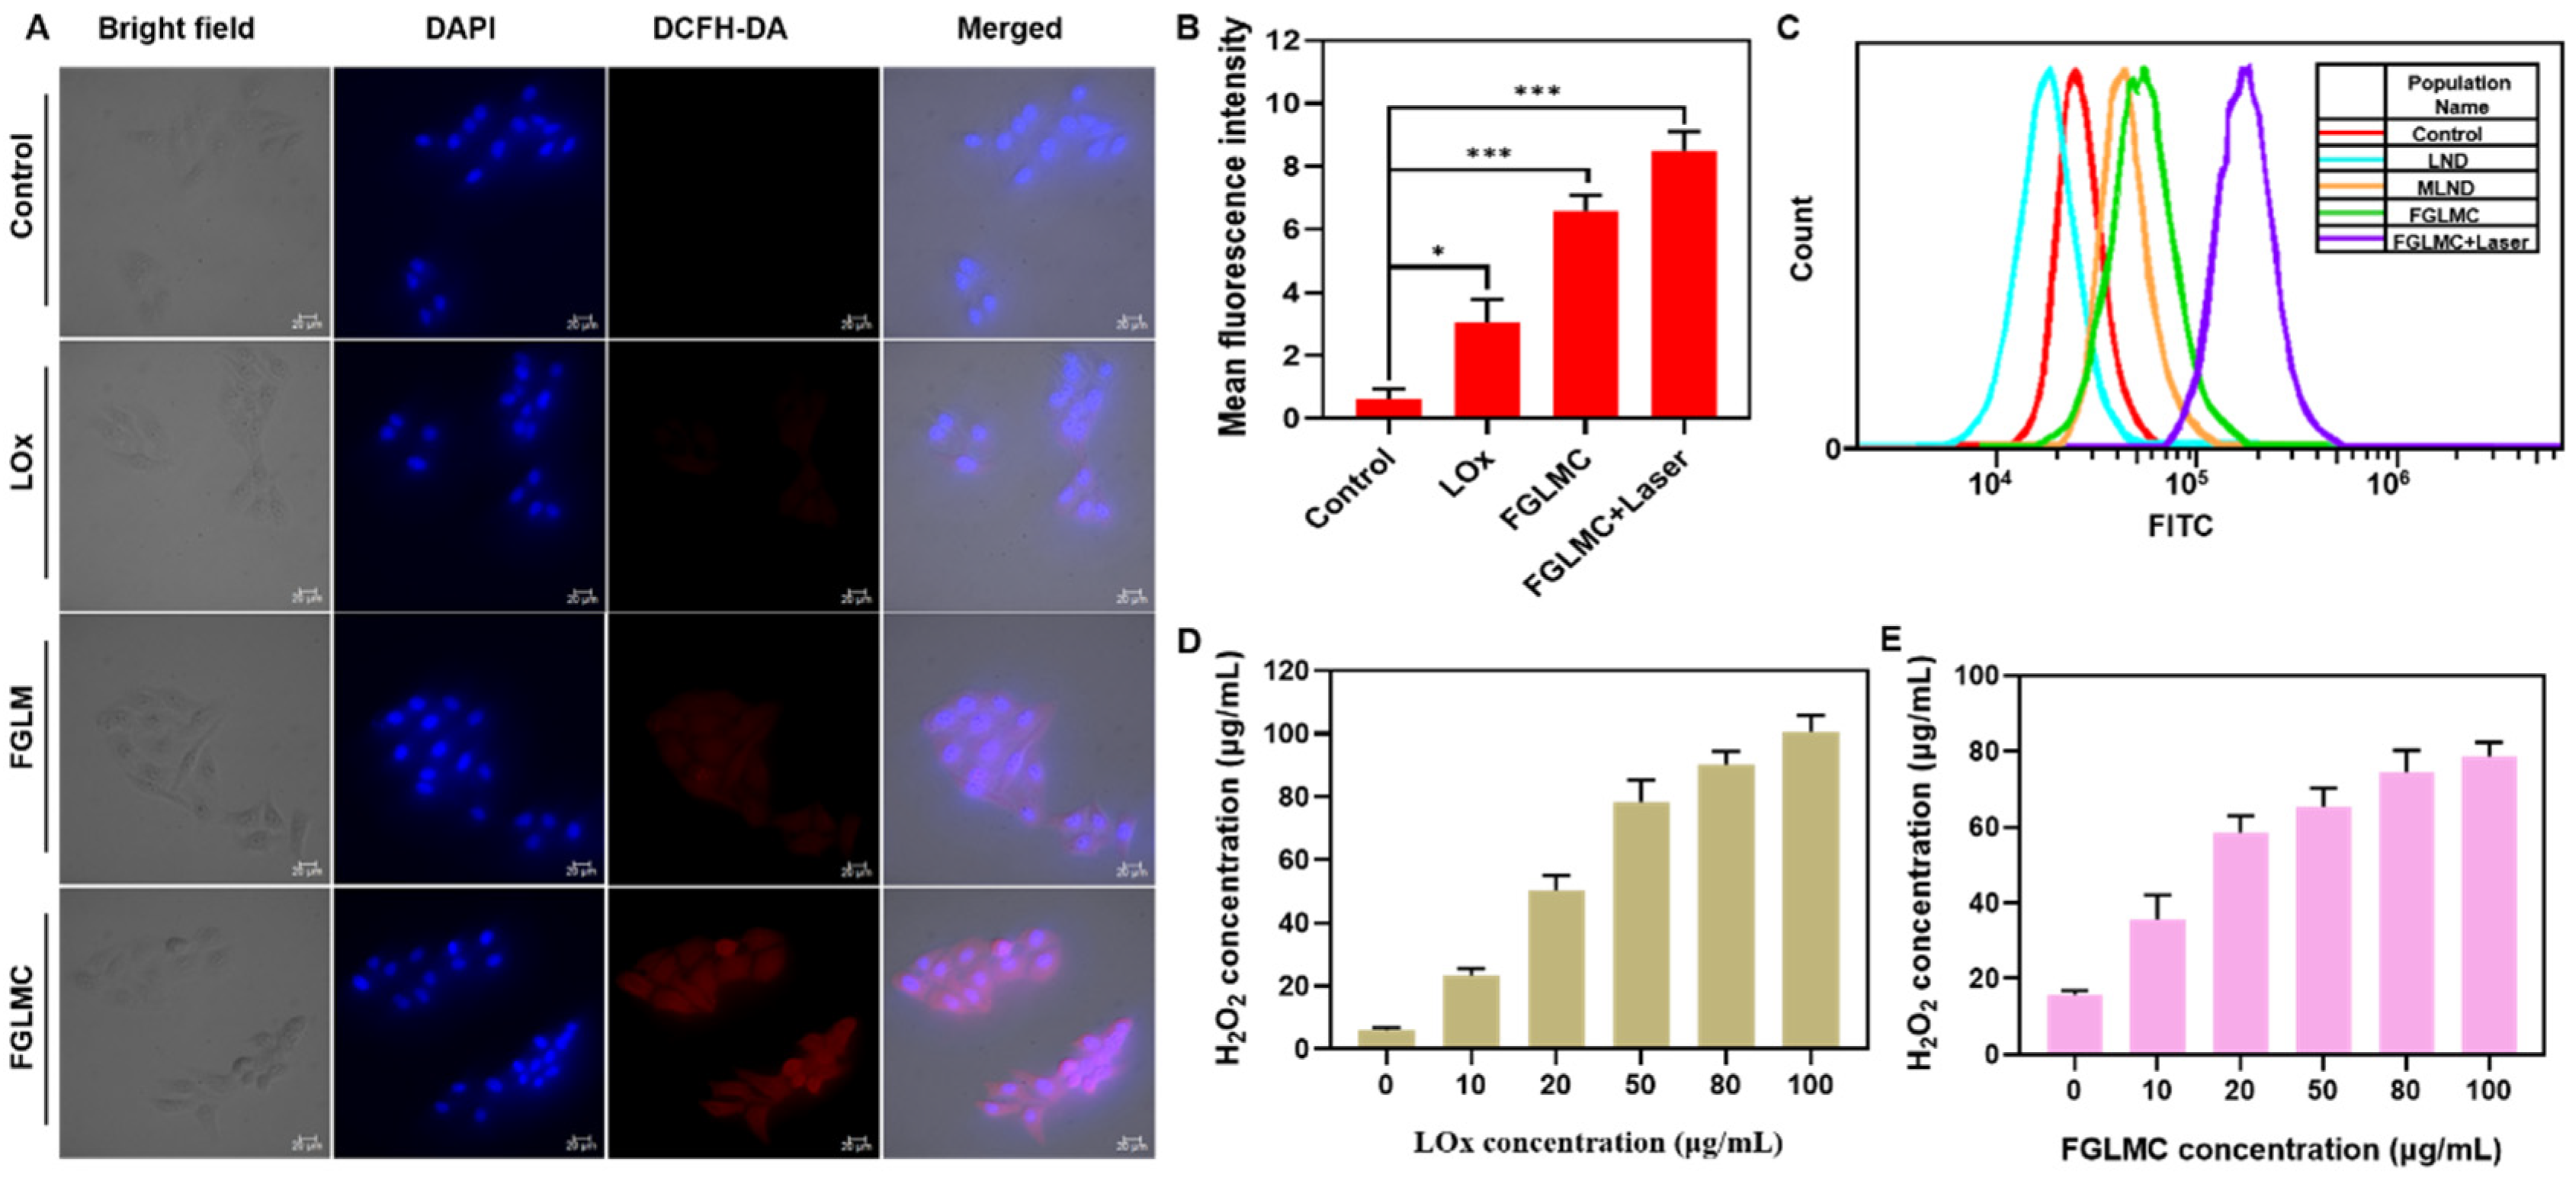
The fluorescence intensity and semi-quantitative results of the calcium ion indicator probe Rhod-2AM co-incubated with MCF-7 cells were used as the standard for Ca2+ release in the CaCO3 surface layer of FGLMC. First of all, the Ca2+ release of FGLM and different concentrations of FGLMC after co-incubation with MCF-7 cells were evaluated. The results showed that, compared with the control group (PBS treatment), there was no fluorescence signal in the cells after FGLM (10 μg mL−1) was incubated with MCF-7 cells for 2 h, indicating that there was no Ca2+ release in FGLM. In contrast, the fluorescence of Rhod-2AM grew stronger as the concentration of FGLMC increased. Furthermore, the fluorescence was the strongest when FGLMC had a concentration of 20 μg mL−1, which emphasized the successful coating of CaCO3 in FGLMC (Figure 2A). Additionally, the linear relationship between the fluorescence intensity and the concentration of FGLMC was also consistent with the semi-quantitative analysis (Figure 2B), which previously implied that the CaCO3 coating in FGLMC can cause tumor cell damage through Ca2+ overload. Next, the sensitivity of the CaCO3 coating to different pH environments was studied. It demonstrated that the fluorescence intensity of Rhod-2AM in pH 5.0 was higher than pH 7.4 (Figure 2C), and the semi-quantitative data also supported the above results (Figure 2D). Based on the above analysis, we concluded that FGLMC can respond and release Ca2+ to play a vital role in the acidic environment of tumors. The relationship between the release of Ca2+ in FGLMC and the incubation time was further detected. It was found that the fluorescence intensity of Rhod-2AM ameliorated with the extension of the incubation time of FGLMC and MCF-7 cells and reached the maximum Ca2+ release after incubating for 3 h (Figure S4), which was also consistent with the results of semi-quantitative analysis (Figure 2E). It revealed that the incubation time of FGLMC and tumor cells increased appropriately can enhance the release of Ca2+ to effectively damage tumor cells.

2.2. ROS Generation

Because of the outstanding Fenton-like activity of FGLMC in solution, 2′,7′-dichlorofluorescin diacetate (DCFH-DA) was employed as the ROS fluorescent probe to determine intracellular ROS generation. The inverted fluorescence image indicated that MCF-7 cells treated with PBS and LOx showed negligible fluorescence, implying relatively low ROS levels. Alternatively, there was an improved fluorescence signal when FGLMC was added, while without laser irradiation. Notably, strong green fluorescence was observed for the treatment of FGLMC and 660 nm laser irradiation, which demonstrated that FGLMC could generate much more ROS within MCF-7 cells (Figure 3A). Semi-quantitative analysis of the fluorescence intensity was also consistent with the above results (Figure 3B). Since LOx cannot penetrate the cell membrane, its function was severely limited by adding LOx alone. On the other hand, g-C3N4 could not absorb laser light when FGLMC was without laser irradiation, which caused the nanoplatform to not exert its PDT function. Therefore, only when FGLMC was irradiated with the 660 nm laser could the PDT effect of g-C3N4 be exerted to the greatest extent, and most ROS could be produced. In addition, flow cytometry was further applied to assess the ROS generating ability of different components. Compared with the control group (only PBS treatment), FGLMC exhibited more ROS generation than other groups, indicating that only co-loading of Fe3O4 and LOx can generate the maximum amount of ROS (Figure 3C).

2.3. H2O2 Detection

FGLMC NPs can consume lactic acid in tumor cells and oxidize it to H2O2 for further Fenton reaction with Fe3O4 and produce hydroxyl free radicals to synergistically enhance tumor lethality. Therefore, the H2O2 detection kit can be used to reveal the H2O2 production and lactic acid consumption capacity of FGLMC NPs. The generation of H2O2 was enhanced with the up-regulated concentration of the LOx in FGLMC. Moreover, the H2O2 concentration produced by 100 μg mL−1 of FGLMC was the same as that produced by 49.6 μg mL−1 of LOx. The loading rate of LOx in FGLMC was calculated as 49.6% (Figure 3D,E). All in all, the results confirmed that FGLMC has a strong ability to consume lactic acid and can oxidize lactic acid to H2O2.

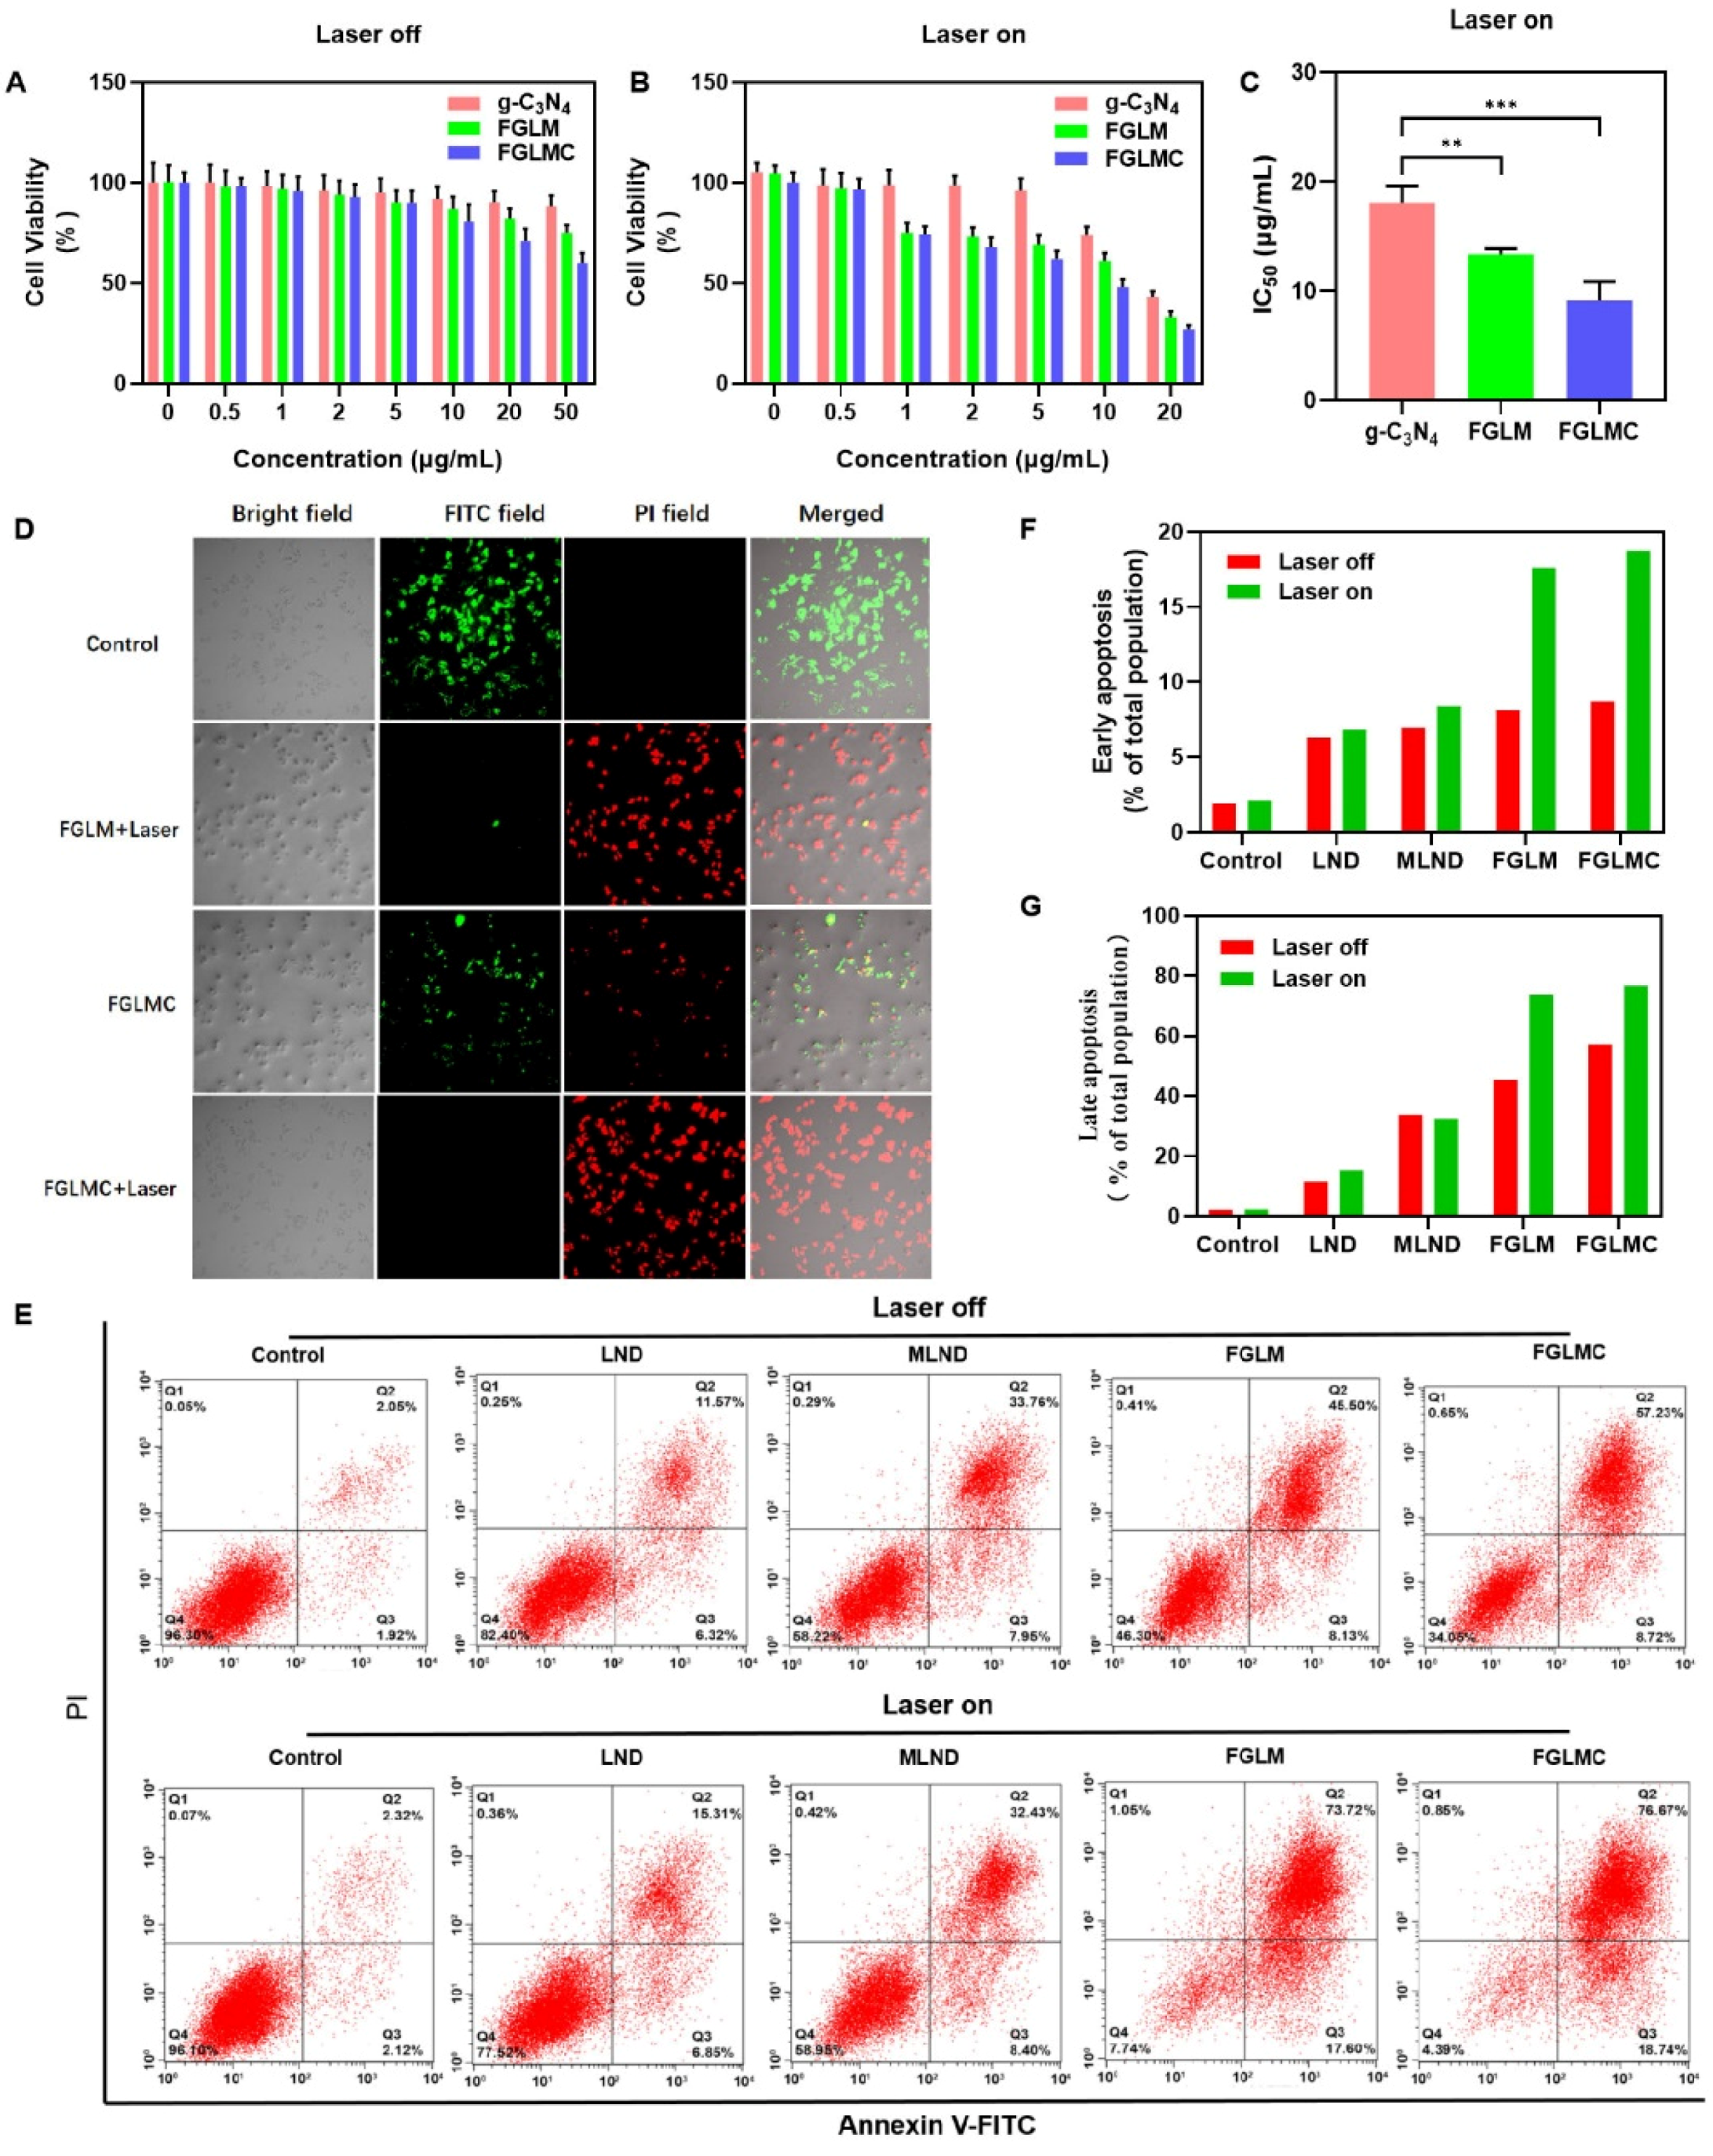
2.4. In Vitro Cytotoxicity

The methyl thiazolyl tetrazolium (MTT) assay was preliminary carried out to investigate the cytotoxicity of Fe3O4 and g-C3N4. The results showed that Fe3O4 and g-C3N4 were basically non-toxic to MCF-7 cells in the concentration range of 0–300 μg mL−1, indicating the safety of the two carrier materials (Figure S5).
In the absence of light irradiation (laser off), g-C3N4, FGLM, and FGLMC showed lower cytotoxicity at low doses. However, the all-active (laser on) three materials showed a certain degree of toxicity at high doses, especially the FGLMC group, which was attributed to the ROS-dependent promotion of cell death (Figure 4A,B). Under the laser-on conditions, there was a significant difference between the half-maximal inhibitory concentration (IC50) of g-C3N4 and FGLMC (p < 0.001) (Figure 4C). Such behavior could be explained by the fact that CDT and PDT synergistically enhanced ROS generation better than PDT individually. Furthermore, to fully prove the superiorities of FGLMC under 660 nm laser, CLSM images of calcein-AM and propidium iodide (PI) co-staining of dead/live cells after receiving different formulations were carried out. Compared to the control group and FGLMC without the laser group, FGLM and FGLMC with laser irradiation exhibited significant cell lethality. Furthermore, the MCF-7 cells incubated with FGLMC displayed the highest red fluorescence and negligible green fluorescence when exposed to the 660 nm laser irradiation, confirming the therapeutic synergistic effect of CaCO3 on killing cancer cells, which was consistent with the cell viability results (Figure 4D). Furthermore, cell apoptosis induced by different formulations was examined by flow cytometer after AV/PI co-staining. The FGLM and FGLMC group without a laser showed better early and late apoptosis rates than other treatments (Figure 4E). However, the apoptotic rate was significantly increased when the laser was on. It was worth mentioning that FGLMC induced the highest early (18.74%) and late (76.67%) apoptosis percentages (Figure 4F,G). These results jointly demonstrated that CDT, PDT, and Ca2+ overloading collaborated with MLND and exerted the best efficacy.

2.5. FGLMC Suppress Cancer Cell Migration and Invasion

As cell migration and invasion are critical for tumor growth and metastasis, Transwell assays and Scratch assays were performed. Microscopic images revealed that compared with the control group, the migration distance of MCF-7 cells was fundamentally unchanged after FGLMC treatment for 12 h. Nevertheless, the distance was relatively smaller after incubating for 24 h, and the cell spacing was significantly reduced after treatment for 48 h, which indicated that FGLMC can effectively inhibit cell proliferation and migration (Figure 5A). To compare the inhibitory ability of different drugs, LND, MLND, and FGLMC were cultured with MCF-7 cells for 24 h to observe cell spacing. Interestingly, FGLMC showed a cell migration inhibitory ability comparable to MLND, which was significantly different from the control group and the LND group (Figure 5B).
Western blotting was applied to further verify the effects of different formulations. Compared with the control and LND group, peroxiredoxin 3 (Prx3) in the cells treated with MLND was significantly oxidized, the degree of mitochondrial depolarization was strong, and the expression of Prx3 was reduced (Figure 5C). This can be attributed to the enhanced mitochondrial targeting ability after triphenylphosphine modification. In addition, due to the damage to mitochondria caused by Ca2+ overload, FGLMC exhibited the greatest inhibition of Prx3 expression. Moreover, a different concentration of FGLMC was added followed by 660 nm laser irradiation, the expression of Prx3 was suppressed, which revealed that PDT could also enhance mitochondria damaging capability (Figure S6). PINK1 is a mitochondrial-dependent protein kinase, which is located in the inner mitochondrial membrane of the cell, and its expression is generally very low. The expression of PINK1 in the MLND and FGLMC group was higher than that in the control and LND groups, which indicated that the treatment with the drug MLND would cause the mitochondria in the cells to depolarize and cause mitochondrial damage (Figure 5C). The quantitative analysis data of Prx3 and PINK1 indicate that mitochondrial damage is an important factor in cancer cell apoptosis (Figure 5D,E).

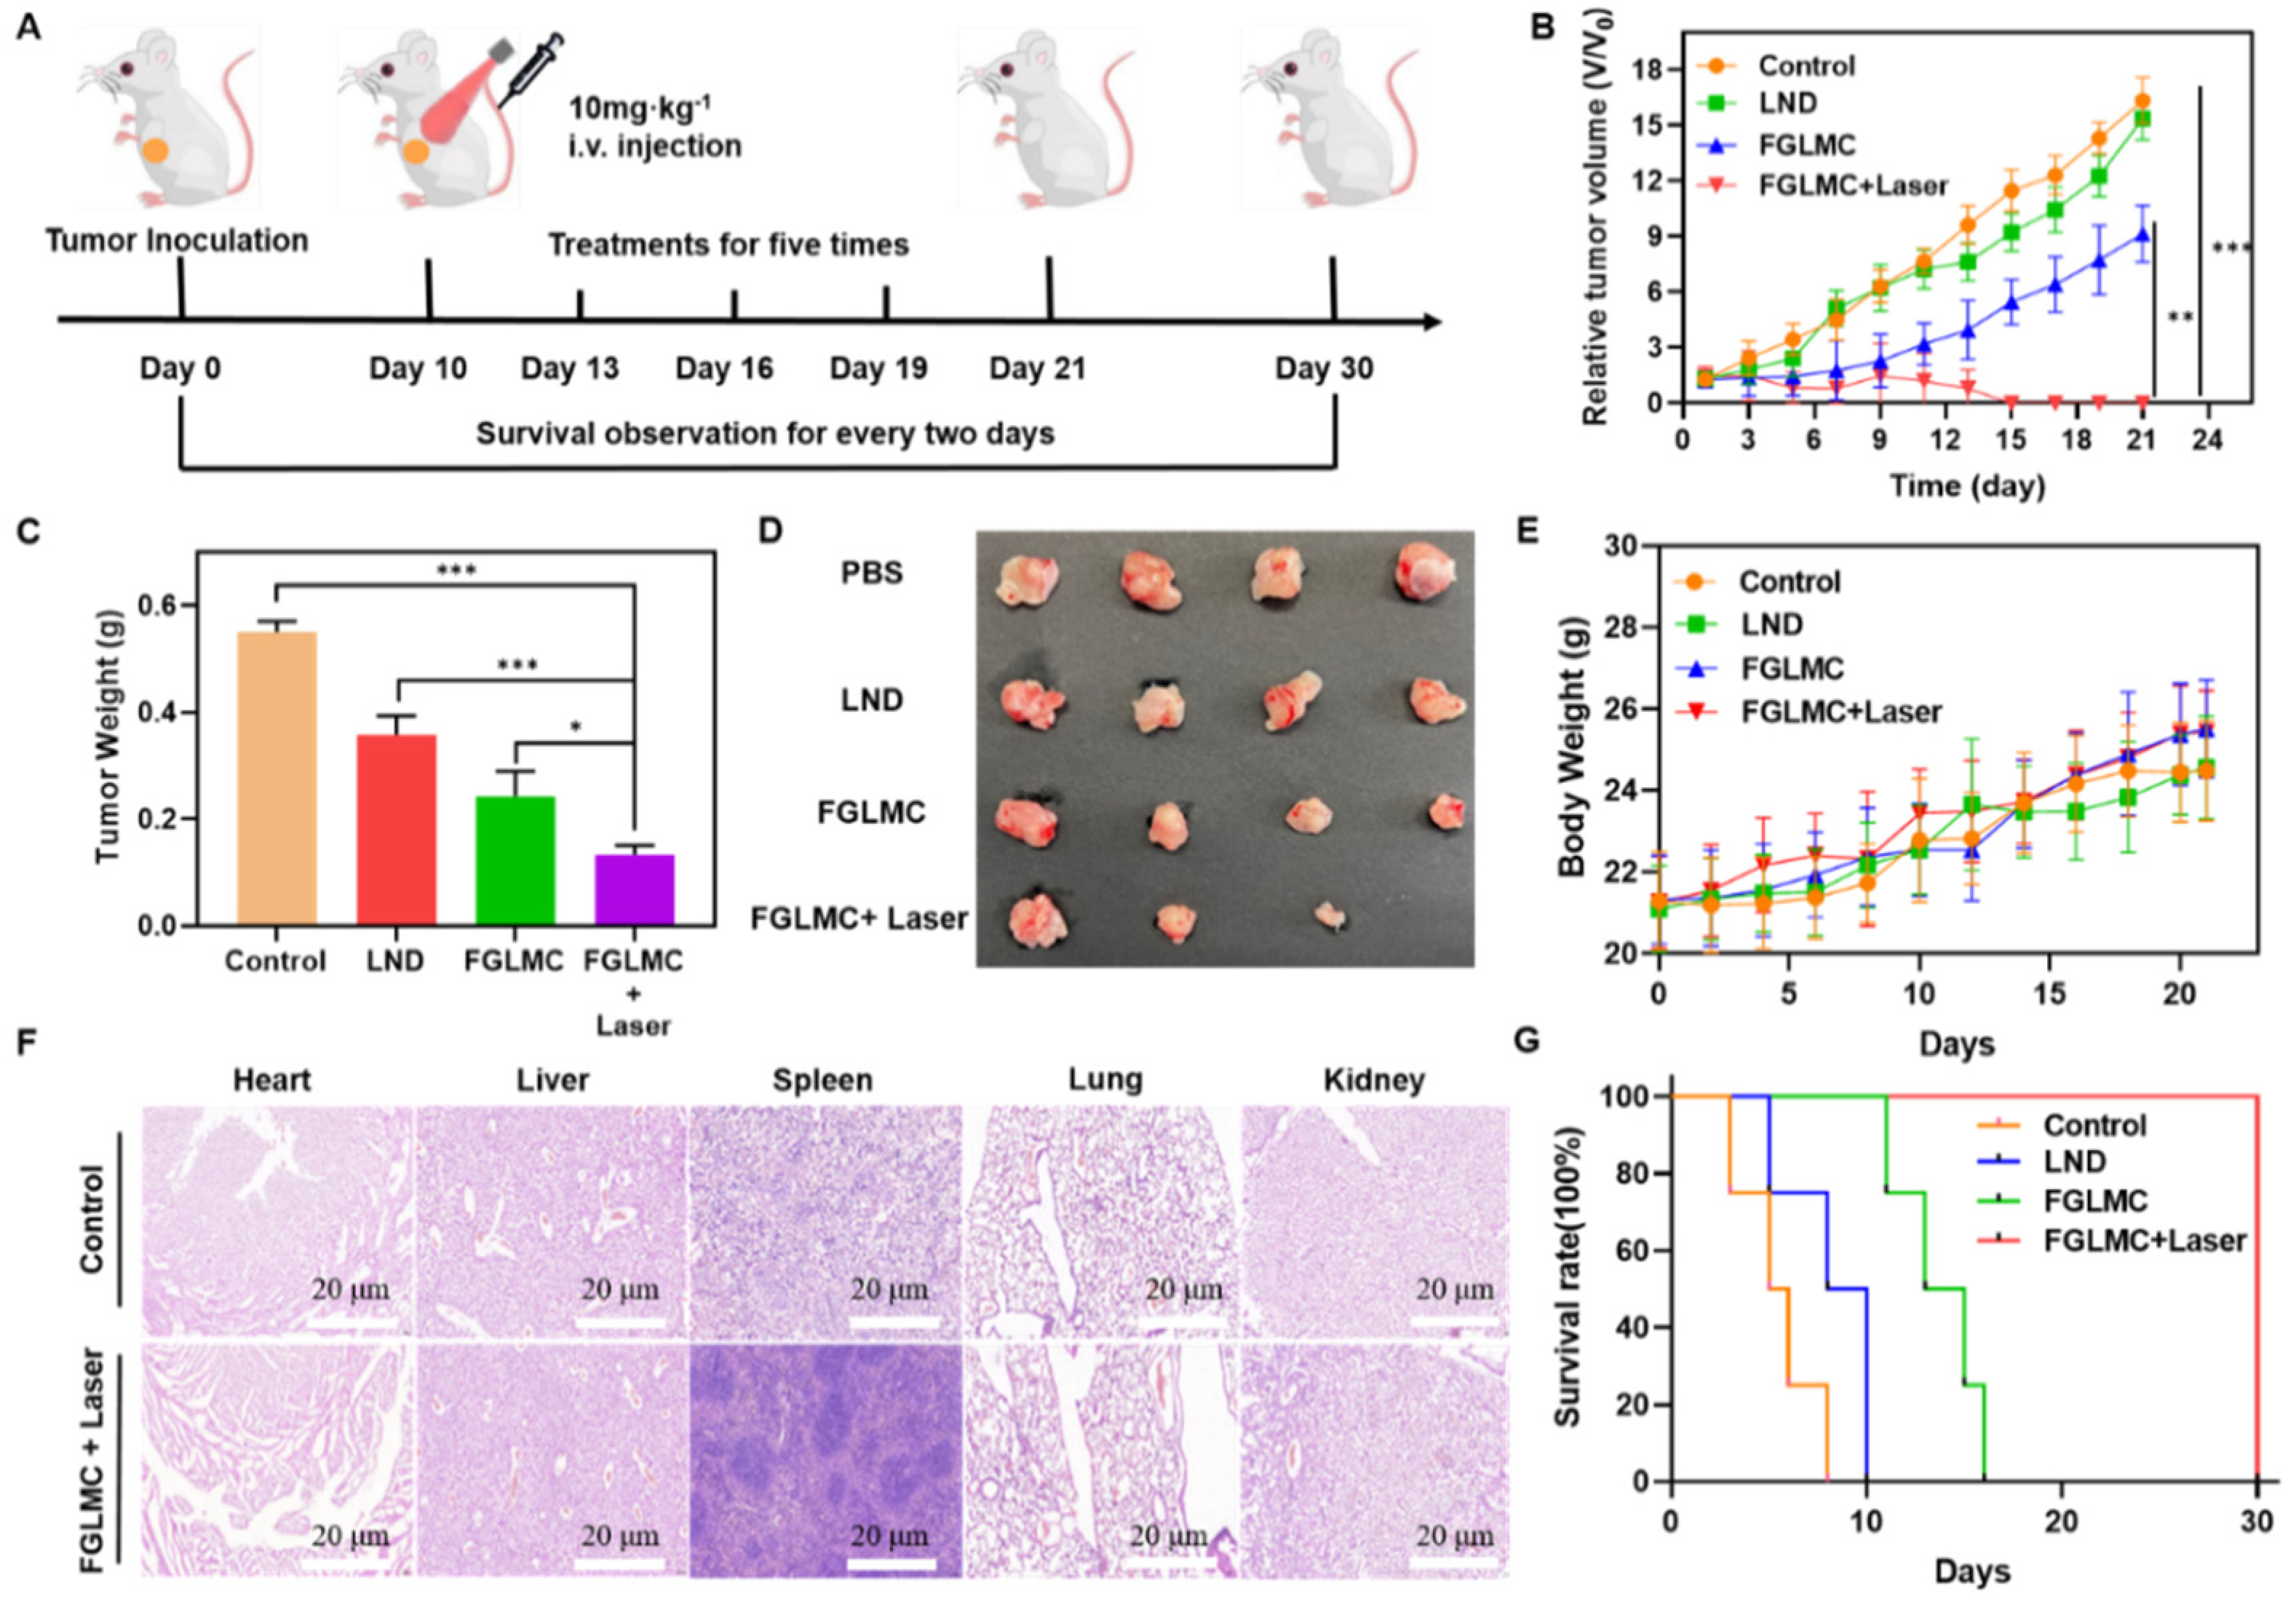
2.6. Antitumor Effect In Vivo

Studies were also carried out to examine the in vivo therapeutic efficacy of FGLMC. Mice bearing MCF-7 tumors were, respectively, injected with (1) PBS (25 μL); (2) LND (25 μL, 10 mg kg−1); (3) FGLMC (25 μL, 10 mg kg−1); (4) FGLMC + 660 nm laser (25 μL, 10 mg kg−1, 100 mW cm−2 for 5 min) (Figure 6A). After treatment, the tumor size was measured every other day in each group to identify the tumor growth inhibition effect. Compared with the rapid tumor growth curve of the PBS group, groups treated with LND and FGLMC displayed relatively slower growth rates. Furthermore, the FGLMC + 660 nm laser group showed significant tumor growth suppression (Figure 6B and Figure S7). The weights and images of tumors were well consistent with the measurement of tumor volume in vivo (Figure 6C,D). The body weights of mice in all groups increased, indicating that all formulations had negligible toxicity (Figure 6E). Similarly, images of hematoxylin and eosin (H&E) stain slices implied no obvious histological changes in major organs of the control and FGLMC + 660 nm laser group (Figure 6F). As expected, another mice treatment with FGLMC with 660 nm laser irradiation completely ablated the tumor during the 30 days, as well as produced the highest survival rate with notable elongation of life span compared to other groups, after which these mice were sacrificed (Figure 6G). These results were attributed to the synergistic effect of PDT and CDT to enhance the generation of ROS and the mitochondrial damage caused by chemotherapeutic and Ca2+ overload.

3. Conclusions

In summary, we successfully developed a versatile nanoparticle platform FGLMC based on multifaceted elevation of ROS generation by integrating LOx and the antiglycolytic drug Mito-LND into Fe3O4/g-C3N4 nanoparticles coated with CaCO3. The combination of dynamic therapy (CDT/PDT/EDT) synergistically enhanced ROS generation. Additionally, the antiglycolytic drug Mito-LND caused mitochondrial dysfunction and generated ROS for further dynamic therapy enhancement. Remarkably, this nanoplatform exhibited excellent ROS-generation ability and confirmed potent in vivo anticancer efficacy, as evidenced by the inhibition efficiency on MCF-7 tumor growth in a nude mice model with good biocompatibility. Briefly, the multifunctional collaborative nanoplatform provided a promising strategy for breast cancer therapy.

Supplementary Materials

The following supporting information can be downloaded at: https://www.mdpi.com/article/10.3390/nano12183150/s1, Scheme S1: Synthesis of MLND; Figure S1: 1H NMR of MLND; Figure S2: ESI-MS spectrum of MLND; Figure S3: Calcium release of FGLMC with different incubation times (Scale bars represent 20 μm); Figure S4: Cell viability of MCF-7 cells incubated with Fe3O4 and g-C3N4; Figure S5: (A) Western blot analysis and (B) quantification for the expression of Prx3 on MCF-7 cells treated with different concentrations; Figure S6: Digital photographs of MCF-7 tumor-bearing mice before and after different treatments. Reference [30] are cited in the Supplementary Materials.

Author Contributions

P.W. and H.T. conceived the idea, guided the project, and wrote the manuscript. H.W. and M.C. performed the experiments, analyzed the results and wrote the manuscript. Y.X. and T.L. helped in data analysis. H.W., M.C., Y.X., T.L., Y.G., P.W. and H.T. revised the manuscript. All authors have read and agreed to the published version of the manuscript.

Funding

This research was supported by the National Natural Science Foundation of China (NSFC 82071979, 82102372), the Natural Science Foundation of Jiangsu Province (Grants No BK20181331), and the Natural Science Foundation of Shandong Province (Grant No. ZR2020MC060).

Data Availability Statement

All data generated or analyzed during this study are included in this published article and its additional information files.

Acknowledgments

The author would like to thank all other members of Peng Wang’s laboratory for their daily experimental and management work.

Conflicts of Interest

The authors declared that they have no conflicts of interest.

References

  1. Moloney, J.N.; Cotter, T.G. ROS signalling in the biology of cancer. Semin. Cell Dev. Biol. 2018, 80, 50–64. [Google Scholar] [CrossRef] [PubMed]
  2. Perillo, B.; Di Donato, M.; Pezone, A.; Di Zazzo, E.; Giovannelli, P.; Galasso, G.; Castoria, G.; Migliaccio, A. ROS in cancer therapy: The bright side of the moon. Exp. Mol. Med. 2020, 52, 192–203. [Google Scholar] [CrossRef]
  3. Harris, I.S.; DeNicola, G.M. The Complex Interplay between Antioxidants and ROS in Cancer. Trends Cell Biol. 2020, 30, 440–451. [Google Scholar] [CrossRef] [PubMed]
  4. Chio, I.I.C.; Tuveson, D.A. ROS in cancer: The burning question. Trends Mol. Med. 2017, 23, 411–429. [Google Scholar] [CrossRef] [PubMed]
  5. Pelicano, H.; Carney, D.; Huang, P. ROS stress in cancer cells and therapeutic implications. Drug Resist. Updates 2004, 7, 97–110. [Google Scholar] [CrossRef] [PubMed]
  6. Wang, J.; Yi, J. Background: Two paradoxical ROS-manipulation strategies in cancer treatment. Cancer Biol. Ther. 2008, 7, 1875–1884. [Google Scholar] [CrossRef]
  7. Trachootham, D.; Alexandre, J.; Huang, P. Targeting cancer cells by ROS-mediated mechanisms: A radical therapeutic approach? Nat. Rev. Drug Discov. 2009, 8, 579–591. [Google Scholar] [CrossRef]
  8. Panieri, E.; Santoro, M.M. ROS homeostasis and metabolism: A dangerous liason in cancer cells. Cell Death Dis. 2016, 7, e2253. [Google Scholar] [CrossRef]
  9. Wang, X.; Zhong, X.; Liu, Z.; Cheng, L. Recent progress of chemodynamic therapy-induced combination cancer therapy. Nano Today 2020, 35, 100946. [Google Scholar] [CrossRef]
  10. Li, S.L.; Jiang, P.; Jiang, F.L.; Liu, Y. Recent Advances in Nanomaterial-Based Nanoplatforms for Chemo-dynamic Cancer Therapy. Adv. Funct. Mater. 2021, 31, 2100243. [Google Scholar] [CrossRef]
  11. Dolmans, D.E.; Fukumura, D.; Jain, R.K. Photodynamic therapy for cancer. Nat. Rev. Cancer 2003, 3, 380–387. [Google Scholar] [CrossRef] [PubMed]
  12. Wu, Q.; He, Z.; Wang, X.; Zhang, Q.; Wei, Q.; Ma, S.; Ma, C.; Li, J.; Wang, Q. Cascade enzymes within self-assembled hybrid nanogel mimicked neutrophil lysosomes for singlet oxygen elevated cancer therapy. Nat. Commun. 2019, 10, 240. [Google Scholar] [CrossRef] [PubMed]
  13. Schaue, D.; McBride, W.H. Opportunities and challenges of radiotherapy for treating cancer. Nat. Rev. Clin. Oncol. 2015, 12, 527–540. [Google Scholar] [CrossRef] [PubMed]
  14. Liu, C.; Wang, D.; Zhang, S.; Cheng, Y.; Yang, F.; Xing, Y.; Xu, T.; Dong, H.; Zhang, X. Biodegradable bio-mimic copper/manganese silicate nanospheres for chemodynamic/photodynamic synergistic therapy with simultaneous glutathione depletion and hypoxia relief. ACS Nano 2019, 13, 4267–4277. [Google Scholar] [CrossRef]
  15. Shi, L.; Wang, Y.; Zhang, C.; Zhao, Y.; Lu, C.; Yin, B.; Yang, Y.; Gong, X.; Teng, L.; Liu, Y.; et al. An Acidity-Unlocked Magnetic Nanoplatform Enables Self-Boosting ROS Generation through Upregulation of Lactate for Imaging-Guided Highly Specific Chemodynamic Therapy. Angew. Chem. Int. Ed. 2021, 60, 9562–9572. [Google Scholar] [CrossRef]
  16. Li, L.; Zang, Z.; Fan, W.; He, L.; Cui, C.; Zou, J.; Tang, W.; Jacobson, O.; Wang, Z.; Niu, G.; et al. In situ polymerized hollow mesoporous organosilica biocatalysis nanoreactor for enhancing ROS-mediated anti-cancer therapy. Adv. Funct. Mater. 2020, 30, 1907716. [Google Scholar] [CrossRef]
  17. Cui, X.; Zhang, J.; Wan, Y.; Fang, F.; Chen, R.; Shen, D.; Huang, Z.; Tian, S.; Xiao, Y.; Li, X.; et al. Dual Fenton Catalytic Nanoreactor for Integrative Type-I and Type-II Photodynamic Therapy Against Hypoxic Cancer Cells. ACS Appl. Bio Mater. 2019, 2, 3854–3860. [Google Scholar] [CrossRef]
  18. Won, M.; Koo, S.; Li, H.; Sessler, J.L.; Lee, J.Y.; Sharma, A.; Kim, J.S. An ethacrynic acid-brominated BODIPY photosensitizer (EA-BPS) construct enhances the lethality of reactive oxygen species in hypoxic tumor-targeted photodynamic therapy. Angew. Chem. Int. Ed. 2021, 60, 3196–3204. [Google Scholar] [CrossRef]
  19. Sun, Y.; Zhang, Y.; Gao, Y.; Wang, P.; He, G.; Blum, N.T.; Lin, J.; Liu, Q.; Wang, X.; Huang, P. Six Birds with One Stone: Versatile Nanoporphyrin for Single-Laser-Triggered Synergistic Phototheranostics and Robust Immune Activation. Adv. Mater. 2020, 32, e2004481. [Google Scholar] [CrossRef]
  20. Fu, L.-H.; Wan, Y.; Li, C.; Qi, C.; He, T.; Yang, C.; Zhang, Y.; Lin, J.; Huang, P. Biodegradable calcium phosphate nanotheranostics with tumor-specific activatable cascade catalytic reactions-augmented photodynamic therapy. Adv. Funct. Mater. 2021, 31, 2009848. [Google Scholar] [CrossRef]
  21. Sun, J.; Cai, X.; Wang, C.; Du, K.; Chen, W.; Feng, F.; Wang, S. Cascade reactions by nitric oxide and hydrogen radical for anti-hypoxia photodynamic therapy using an activatable photosensitizer. J. Am. Chem. Soc. 2021, 143, 868–878. [Google Scholar] [CrossRef] [PubMed]
  22. Qin, X.; Wu, C.; Niu, D.; Qin, L.; Wang, X.; Wang, Q.; Li, Y. Peroxisome inspired hybrid enzyme nanogels for chemodynamic and photodynamic therapy. Nat. Commun. 2021, 12, 5243. [Google Scholar] [CrossRef] [PubMed]
  23. Hui, S.; Ghergurovich, J.M.; Morscher, R.J.; Jang, C.; Teng, X.; Lu, W.; Esparza, L.A.; Reya, T.; Zhan, L.; Guo, J.Y.; et al. Glucose feeds the TCA cycle via circulating lactate. Nature 2017, 551, 115–118. [Google Scholar] [CrossRef]
  24. Tang, Y.; Jia, C.; Wang, Y.; Wan, W.; Li, H.; Huang, G.; Zhang, X. Lactate Consumption via Cascaded Enzymes Combined VEGF siRNA for Synergistic Anti-Proliferation and Anti-Angiogenesis Therapy of Tumors. Adv. Healthcare Mater. 2021, 10, 2100799. [Google Scholar] [CrossRef] [PubMed]
  25. Zhou, X.; Zhao, W.; Wang, M.; Zhang, S.; Li, Y.; Hu, W.; Ren, L.; Luo, S.; Chen, Z. Dual-Modal Therapeutic Role of the Lactate Oxidase-Embedded Hierarchical Porous Zeolitic Imidazolate Framework as a Nanocatalyst for Effective Tumor Suppression. ACS Appl. Mater. Interfaces 2020, 12, 32278–32288. [Google Scholar] [CrossRef] [PubMed]
  26. Faubert, B.; Li, K.Y.; Cai, L.; Hensley, C.T.; Kim, J.; Zacharias, L.G.; Yang, C.; Do, Q.N.; Doucette, S.; Burguete, D.; et al. Lactate Metabolism in Human Lung Tumors. Cell 2017, 171, 358–371.e9. [Google Scholar] [CrossRef] [PubMed]
  27. Liao, Z.-X.; Kempson, I.M.; Hsieh, C.-C.; Tseng, S.J.; Yang, P.-C. Potential therapeutics using tumor-secreted lactate in nonsmall cell lung cancer. Drug Discov. Today 2021, 26, 2508–2514. [Google Scholar] [CrossRef] [PubMed]
  28. Gao, F.; Tang, Y.; Liu, W.L.; Zou, M.Z.; Huang, C.; Liu, C.J.; Zhang, X.Z. Intra/extracellular lactic acid exhaustion for synergistic metabolic therapy and immunotherapy of tumors. Adv. Mater. 2019, 31, 1904639. [Google Scholar] [CrossRef]
  29. Liao, Z.-X.; Ou, D.-L.; Hsieh, M.-J.; Hsieh, C.-C. Synergistic effect of repolarization of m2 to m1 macro-phages induced by iron oxide nanoparticles combined with lactate oxidase. Int. J. Mol. Sci. 2021, 22, 13346. [Google Scholar] [CrossRef]
  30. Xu, G.; Zhang, H.; Wei, J.; Zhang, H.X.; Wu, X.; Li, Y.; Li, C.; Zhang, J.; Ye, J. Integrating the g-C3N4 nanosheet with B–H bonding decorated metal–organic framework for CO2 activation and photoreduction. ACS Nano 2018, 12, 5333–5340. [Google Scholar] [CrossRef]
Scheme 1. Scheme illustration of the composition of FGLMC and its therapeutic effect on breast cancer.
Nanomaterials 12 03150 sch001
Figure 1. Material characterization. (A) TEM images and (B) Hydrodynamic diameters of Fe3O4, g-C3N4, Fe3O4@g-C3N4, and FGLMC. (C) TEM-Element mapping of FGLMC (scale bar: 20 nm). (D) UV-vis absorption spectra of LND, MLND and FGLMC. (E) SDS-PAGE protein analysis of LOx. (F) Mitochondrial membrane potential detection.
Nanomaterials 12 03150 g001
Figure 2. Calcium release of (A) FGLM and FGLMC with different concentrations and (B) semi-quantitative analysis (Scale bars represent 20 μm, * p < 0.05, ** p < 0.005, *** p < 0.0005). (C) Calcium release of FGLMC under different pH conditions and (D) semi-quantitative analysis (Scale bars represent 20 μm, * p < 0.05). (E) Fluorescence semi-quantitative analysis of Ca2+ release with different incubation times (Scale bars represent 20 μm, *** p < 0.0005). Each value represents means ± SD (n = 3).
Nanomaterials 12 03150 g002
Figure 3. The detection mechanism of DCFH-DA for intracellular ROS. Confocal fluorescence images (A), the quantification of fluorescence intensity (B), and flow cytometry assay (C) for the generation of ROS with different treatments (Scale bars represent 20 μm, * p < 0.05 *** p < 0.0005). Detection of H2O2 incubated with different concentrations of (D) LOx and (E) FGLMC in MCF-7 cells. Each value represents means ± SD (n = 3).
Nanomaterials 12 03150 g003
Figure 4. Cytotoxicity of different components in MCF−7 cells. Viability of cells in response to formulation treatment (g−C3N4, FGLM, and FGLMC) without (A) or with (B) light irradiation (660 nm, 100 mW cm−2, 5 min) (n = 3). (C) IC50 value of three components in the presence of laser treatment (** p < 0.005, *** p < 0.0001). (D) Calcein-AM/PI double staining of MCF−7 cells treated with different formulations with or without laser irradiation (Scale bars represent 100 μm). (E) Annexin V/PI double staining of MCF-7 cells treated with different formulations with or without laser irradiation (Scale bars represent 100 µm). Statistical graph of (F) early apoptosis and (G) late apoptosis results. Error bars indicate SD (n = 3).
Nanomaterials 12 03150 g004
Figure 5. Migration and invasion evaluation. (A) Wound healing assay and (B) anti-invasion effects of different formulations on MCF-7 cells (The distance between the red dotted lines is the cell spacing after different treatments). (C) Western blot analysis for the expression of Prx3 and PINK1 on MCF-7 cells treated with different formulations. GAPDH was used as the loading control. Quantification of Prx3 (D) and PINK1 (E) expression intensity. Data are presented as mean ± SD (** p < 0.01, *** p < 0.005).
Nanomaterials 12 03150 g005
Figure 6. In vivo therapeutic effects of LND, FGLMC without or with laser. (A) Schematic illustration of the administration route for in vivo therapy. (B) Relative tumor volume, (C) tumor weight, (D) tumor image of MCF−7 tumors from different groups. (E) Bodyweight of MCF-7 tumor-bearing mice administrated with different formulations. (F) H&E−staining images of major organs (scale bar represents 100 μm). (G) The survival rate of MCF−7 tumor-bearing mice received different treatments. Error bars indicate SD (n = 4). (* p < 0.05, ** p < 0.01, *** p < 0.005).
Nanomaterials 12 03150 g006
Publisher’s Note: MDPI stays neutral with regard to jurisdictional claims in published maps and institutional affiliations.

