Abstract
Multifunctional nano-objects containing a magnetic heater and a temperature emissive sensor in the same nanoparticle have recently emerged as promising tools towards personalized nanomedicine permitting hyperthermia-assisted treatment under local temperature control. However, a fine control of nano-systems’ morphology permitting the synthesis of a single magnetic core with controlled position of the sensor presents a main challenge. We report here the design of new iron oxide core–silica shell nano-objects containing luminescent Tb3+/Eu3+-(acetylacetonate) moieties covalently anchored to the silica surface, which act as a promising heater/thermometer system. They present a single magnetic core and a controlled thickness of the silica shell, permitting a uniform spatial distribution of the emissive nanothermometer relative to the heat source. These nanoparticles exhibit the Tb3+ and Eu3+ characteristic emissions and suitable magnetic properties that make them efficient as a nanoheater with a Ln3+-based emissive self-referencing temperature sensor covalently coupled to it. Heating capacity under an alternating current magnetic field was demonstrated by thermal imaging. This system offers a new strategy permitting a rapid heating of a solution under an applied magnetic field and a local self-referencing temperature sensing with excellent thermal sensitivity (1.64%·K−1 (at 40 °C)) in the range 25–70 °C, good photostability, and reproducibility after several heating cycles.
1. Introduction
Nanoparticle induced hyperthermia is one of the promising treatments in the development of personalized nanomedicine that aims to improve the effectiveness and safety of conventional treatments and diagnosis [1,2]. Although the use of alternating magnetic fields that induce magnetic iron oxide nanoparticles to heat has already been approved in Europe to treat glioblastoma (NanoTherm®, Magforce, Berlin, Germany) [3], several progresses are needed to control the temperature and avoid overheating conducting that damages surrounding healthy tissues. In this connection, there is a lack of appropriate tools for fine and local temperature sensing because the insertion of needle thermocouples near the target area is an invasive approach with spatial resolution limited to the size of the probe [4]. A recently emerged all-in-one approach represents a significant breakthrough in this area [5,6,7]. It consists in the design of smart multifunctional nanoplatforms combining a magnetic heater able to generate local heat under an applied alternating current (AC) magnetic field with an emissive sensor to monitor the local temperature rise. The employment of emissive sensors is highly promising because they are able to remotely provide temperature-dependent signals leading to fine thermal imaging during the hyperthermia process with high resolution. The sensor function may be achieved by organic dyes [5], Ln3+-based complexes [8,9,10], silver sulfide nanoparticles [11,12], or ceramic Ln3+ containing nano-objects [13,14,15]. Magnetic iron oxide nanoparticles of an appropriate size have proved their efficiency as hyperthermia heater [5,15,16,17,18,19,20,21,22,23,24,25].
The ultimate goal therefore consists of the fine measurements of a local temperature elevation in the single magnetic heater/emissive sensor nano-system. However, the design of such nano-objects is very challenging, as it requires a perfect mastery of nanoparticles’ morphology and implies the synthesis of structurally well-defined monodisperse hybrid nano-systems. In this connection, several reported works may be classified in two strategies consisting of: (i) an encapsulation of heater (IONPs) and sensor nanoparticles in large mesoporous silica nano-objects [26] or phospholipidic [12] or polymeric capsules [13], or (ii) synthesis of core-shell systems, where the iron oxide core has been surrounded by a shell of polymers [5,9,14] or silica [8] containing luminescent species. However, to the best of our knowledge, the reported works did not achieve multifunctional magneto-luminescent nanoparticles with a good control of their morphology. Indeed, each noted example presents its own advantages and drawbacks, but in the most of them, except for three works [5,26,27], several aggregated magnetic nanoparticles are enclosed into the not-well-controlled shell, which is far from optimal for the efficient single heater/thermometer nano-system. Moreover, sensor species are often physically dispersed in the shell, which presents a risk of their release. Only one article reported on the covalent attachment of organic dye on the surface of single magnetic nanoparticles, which is not a reversible nor a self-referenced method for application in hyperthermia [5].
In this work, we report new multifunctional core@shell nano-objects containing a single magnetic IONP core surrounded by a silica shell with covalently attached Tb3+/Eu3+ based complexes acting as a self-referencing emissive sensor (Scheme 1). The silica shell has been chosen due to its protective role, biocompatibility, the possibility of the shell’s thickness control, and the well-developed surface chemistry allowing covalent attachment of targeted functions.
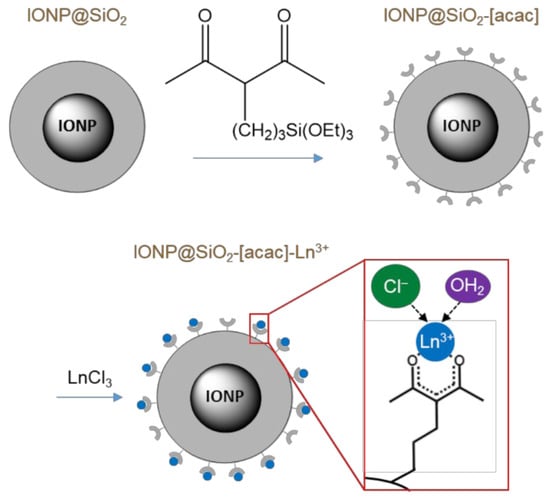
Scheme 1.
Synthesis of multifunctional heater–temperature sensor nanoplatform as IONP core@SiO2-acac/Ln3+ (Ln3+ = Tb3+/Eu3+) shell nano-objects. The Ln3+ complexes were covalently grafted at the surface of a silica shell functionalized with acac groups.
To the best of our knowledge, only two works noted the use of silica coating for the design of magnetic heater@silica shell platform with emissive temperature sensor [8,27]. In the article reported by A. Pralle’s group, an organic dye was loaded into the silica shell during the coating of MnFe2O4 nanoparticles [27]. In the second work of L. D. Carlos and colleagues, luminescent Ln3+ complexes were included in the silica shell to act as a self-referencing thermometer [8]. However, this latter system presented two of the aforementioned drawbacks linked with difficulty of the morphology control and a physical dispersion of the luminescent species. We employed here Tb3+/Eu3+-acetylacetonate (acac) moiety as emissive sensors due to numerous expected advantages: (i) they may be considered as self-referencing emissive sensors [28,29,30,31,32], (ii) they are expected to present high photothermal stability [8,9], (iii) they are expected to show good relative thermal sensitivity with the possibility to tune the working temperature range, and (iv) they can be covalently anchored to the silica shell through a modified acac ligand. The magnetic heater/emissive sensor nano-system obtained in this work presents a perfectly controlled core@shell morphology with a well definite IONP core and a silica shell with adjustable thickness comprising covalently grafted Tb3+/Eu3+-acac complexes. It is able to induce an important temperature rise under an applied AC magnetic field and to measure the temperature by emissive self-referencing sensing.
2. Materials and Methods
2.1. Materials
Ferric hydroxide oxide (hydrated, 30–50 mesh), oleic acid (90%), oleylamine (90%), n-docosane (99%), ammonia (30%), tetraethylorthosilicate (TEOS, 99%), (3-chloropropyl)-triethoxysilane (95%), (3-iodopropyl)trimethoxysilane (95%), sodium iodide, potassium tertbutoxide (tBuOK), tert-butanol (tBuOH), europium(III) chloride hexahydrate (99.9%, trace metals basis), terbium(III) chloride hexahydrate (99.9%, trace metals basis), acetylacetone, pentane, diethyl ether, cyclohexane, acetone, and ethanol were purchased from Merck. Triton X-100 and 1-hexanol (99%) were purchased from Alfa Aesar (Haverhill, MA, USA).
2.2. Synthesis
2.2.1. Synthesis of Iron Oxide Nanoparticles
The synthesis of the iron oxide nanoparticles (IONP/OA/OA) of ca. 26 nm was performed following a thermal decomposition method reported elsewhere with minor modifications [33]. Typically, the reaction occurs at high temperature by mixing an iron precursor (FeO(OH)) with a coordinating ligand (oleic acid) and a non-coordinating reaction solvent with a high-boiling point (n-docosane). First, a flask containing a mixture of FeO(OH) (2 mmol, 0.18 g), oleic acid (10 mmol, 3.2 g), and n-docosane (5.0 g) was connected to a Schlenk line to remove moisture and oxygen for 30 min at room temperature under vacuum and magnetic stirring. Subsequently, the flask was heated to 350 °C under argon flow at a heating rate of 10 °C/min. The solution was maintained at 350 °C for a further 90 min under stirring and argon flow. After this period, the heating source was removed. When the temperature of the solution reached 50 °C, pentane (15 mL) was added to the obtained nanoparticles. The nanoparticles were washed three times by dispersing in diethyl ether, followed by precipitation with ethanol (1:1 v/v), and then recovered using centrifugation (20,000 rpm, 10 min). Oleylamine (200 µL) was added to the collected material. The resultant oleate/oleylamine-capped IONPs (IONP/OA/OA) were finally dispersed in cyclohexane (15 mL).
2.2.2. Silica Coating of Iron Oxide Nanoparticles
The obtained hydrophobic IONP/OA/OA was coated with a silica shell. The adapted method consists of encapsulating the nanoparticles in a reverse microemulsion [34]. First, Triton X-100 (1.77 g), 1-hexanol (1.60 mL), and cyclohexane (7 mL) were vigorously mixed. After 1 h of magnetic stirring, the IONPs solution (0.5 mg in 0.5 mL of cyclohexane) was rapidly added. Stirring was continued for a further 1 h. Ammonia (6%, 0.5 mL) was added to form a water-in-oil microemulsion. The emulsion was stirred for 1 h to ensure a uniform distribution of nanocrystals within the micelles. Different amounts of TEOS (from 1.5 to 12 µL) were added in order to modulate the silica shell thickness from ca. 8 to 28 nm (see Figure 1a and Table S1), and the mixture was stirred at 500 rpm for 24 h. The nanoparticles were collected by centrifugation (20,000 rpm, 15 min), then washed with ethanol and recovered by centrifugation. The IONP@SiO2 core-shell nanoparticles were stored in 2 mL of ethanol until further use. The nanoparticles with silica shell of ca. 11 nm (2 µL of added TEOS) were chosen for further experiments because they combined the thinnest silica shell and a good organization of shell around the IONP core (Table S1). Therefore, their synthesis was successfully scaled up (×100 times) for further grafting of complexes.
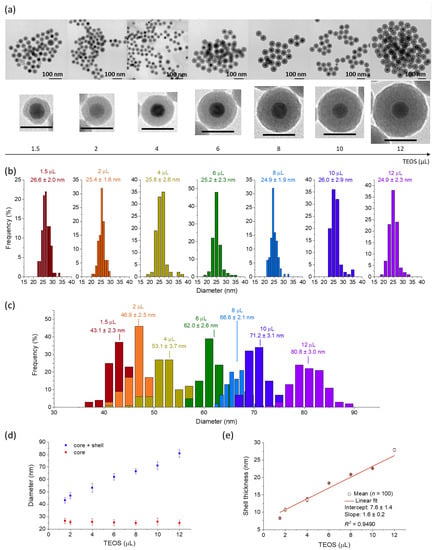
Figure 1.
(a) TEM images of IONP@SiO2 prepared by adding different amounts of TEOS along with their magnified images of single nanoparticles (scale bars represent 50 nm). Size distributions (n = 100) of (b) IONP core and (c) whole core-shell IONP@SiO2. (d) Core and core@shell diameters as a function of the added TEOS amount and (e) shell thickness as a function of the added TEOS amount. For (d,e), the error bars correspond to standard error of mean, n = 100.
2.2.3. Synthesis of Acetylacetonate-Functionalized Organosilane
The synthesis of compound [CH3C(O)]2CH(CH2)3-Si(OCH2CH3)3 (acac-silane) was performed from I(CH2)3Si(OCH2CH3)3 according with the method previously described [35]. First, I(CH2)3Si(OCH2CH3)3 was synthesized by reacting (3-chloropropyl)-triethoxysilane (30.0 g, 124.7 mmol) and sodium iodide (28.1 g, 187.1 mmol) at reflux in acetone (200 mL) for 72 h. The solvent was removed under vacuum and pentane was then added. The resulting suspension was filtered to remove the salts. The solvent was removed under vacuum. The product was distilled under reduced pressure and rendered a colorless oil. Second, [CH3C(O)]2CH(CH2)3-Si(OCH2CH3)3 was prepared by adding acetylacetone (15.0 g, 150 mmol) to a solution of tBuOK (11.2 g, 100 mmol) in tBuOH (100 mL) at room temperature. After stirring for 10 min, (3-iodopropyl)trimethoxysilane (33.2 g, 100 mmol) was added. The mixture was stirred and heated under reflux for 20 h. The solvent was removed under vacuum and the residue dissolved in pentane (200 mL). After filtration under argon, the filtrate was concentrated. The residual clear yellow liquid was distilled, yielding a colorless liquid.
2.2.4. Acetylacetonate-Functionalization of Silica-Coated Iron Oxide Nanoparticles
The grafting of acetylacetonate (acac) groups on the silica surface of nanoparticles was performed by dispersing the IONP@SiO2 (ca. 11 nm-silica shell) in toluene (33 mg in 40 mL) at 110 °C under reflux, and adding the acac-silane (100 µL). After overnight reaction, the acac-functionalized nanoparticles (IONP@SiO2-acac) were washed three times with ethanol (20,000 rpm, 20 min) and finally redispersed in ethanol (20 mL).
2.2.5. Complexation of Ln3+ with Acac-Functionalized Iron Oxide Nanoparticles
The complexation of lanthanide ions occurred by adding their chlorides solutions in ethanol (20 mM) in a defined molar ratio Tb3+:Eu3+ = 95:5 (0.95 mmol of TbCl3·6H2O and 0.05 mmol of EuCl3·6H2O) to the IONP@SiO2-acac in ethanol (4.2 mg in 2.5 mL). The mixture was stirred at 80 °C under reflux overnight. The Ln3+-containing nanoparticles (IONP@SiO2-acac/Ln3+) were washed three times with ethanol (20,000 rpm, 20 min) and finally redispersed in ethanol (2 mL). For analyses on powdered samples, the nanoparticle samples were collected using centrifugation (20,000 rpm, 10 min), then dried under normal air conditions to constant weight, followed by vacuum at room temperature.
Atomic percentages in IONP@SiO2-acac/Tb3+/Eu3+ detected by SEM-EDX: % Tb 3.87, % Eu 0.22, % Si 66.68, % Fe 28.54, % Cl 0.68. IR (InfraRed) band assignments are given in Table S1.
2.3. Characterizations
The size and shape of the obtained nanoparticles were observed by transmission electronic microscopy (TEM) at 100 kV (JEOL 1200 EXII). The images were analyzed using the ImageJ software to measure the size of nanoparticles (n = 100), assessed as the Feret’s diameter. The Origin software (Version 2020, OriginLab Corporation, Northampton, MA, USA) was used for statistical analysis on nanoparticle sizes. The size distributions of the nanoparticles were obtained using the frequency counts analysis of Origin software and given as an average diameter ± standard deviation. The average diameter corresponded to the mean values of measured Feret’s diameter. The standard deviation () has been classically calculated by the Origin software as:
where is the total number of data points (n = 100), is the th sample, is the th weight, and .
High resolution transmission electron microscopy (HRTEM) images were acquired using a JEOL 2200 FS (FEG) operated at 200 kV with a Gatan UltraScan 4000 (4 k × 4 k) CCD camera. The elemental mapping was recorded in scanning mode (STEM) with an Oxford Instruments XMaxN 100 TLE (100 mm2, windows less) EDX detector. Dynamic light scattering (DLS) measurements (Zetasizer Nano-series Malvern instrument, model ZEN3600) were used to determine the particle hydrodynamic diameter of colloidal suspensions.
The crystal structural characteristics were investigated by X-Ray diffraction (XRD) using a PANalytical X’Pert Powder analytical diffractometer mounted in a Debye−Scherrer configuration and equipped with Cu radiation (λ = 1.5418 Å) on powdered samples. Infrared (IR) spectra using attenuated total reflectance (ATR-IR) were recorded using powdered samples with a PerkinElmer Spectrum Two FT-IR Spectrometer. Quantifications of Tb, Eu, Si, and Fe elements were performed by using a scanning electron microscope and energy dispersive X-ray analysis (SEM-EDX) on an FEI Quanta FEG 200 instrument. The powders were deposited on an adhesive carbon film and analyzed under high vacuum. The quantification of the heavy elements was carried out with the INCA software, with a dwell time of 3 µs. Thermogravimetric analyses (TGA) under air atmosphere were obtained on powders with a thermal analyzer STA 409 Luxx® (Netzsch) in the temperature range 20–800 °C at a heating speed of 5 °C min−1. Brunauer–Emmett–Teller (BET) surface area was obtained with N2 sorption isotherms performed at 77 K using a Micromeritics Tristar unit (USA). Prior to the analysis, samples were degassed for 12 h at 100 °C under primary vacuum.
The emission and excitation spectra were recorded at 295 K using a spectrofluorimeter Edinburgh FLS-920. The excitation source was a 450 W Xe arc lamp. The spectra were corrected for detection and optical spectral response of the spectrofluorimeter. To obtain the thermal calibration curves, the emission spectra were measured at different temperatures in a Peltier-based temperature-controlled cuvette holder coupled to the spectrofluorometer. The colloidal solutions were maintained under magnetic stirring during thermal calibration measurements. A period of 100 s was given to allow the temperature to stabilize. Temperature accuracy was ±0.06 °C.
Magnetic measurements were performed using a SQUID MPMS-XL magnetometer working in the temperature range 1.8–350 K up to 7 T by using static (direct current (DC)) and dynamic (alternating current (AC)) modes in powdered samples. The data were corrected for the sample holder. The AC magnetic susceptibility measurements were carried out in the presence of a 3.5 Oe oscillating field in zero or applied external DC field. Temperatures associated to relaxation times (1/(2πf)) were extracted from the out-of-phase AC magnetic susceptibility, and the fit of the relaxation times was realized by using the Arrhenius equation:
where Ea is the barrier energy in cm−1; and the Vogel–Fulcher equation:
where T0 is an additional parameter which takes into account dipolar interactions [36].
Magnetothermia experiences were realized using an AC magnetic field generator (UltraFlex) at 350 kHz. The generating magnetic field is around 20 mT. The samples were in liquid state and isolated with polystyrene. The temperature of the liquid surface was measured using an OPTRIS PI 450 thermal camera.
2.4. Theoretical Procedures
The intramolecular energy transfer rates (IET) from the first triplet state (T1, ca. 27,000 cm–1 [37]) to the Ln3+ ion can be calculated considering the dipole–dipole (), dipole–multipole (), and exchange () mechanisms [38,39,40]:
where is the donor–acceptor states distance (assumed a reasonable value of 4.0 Å for both Eu3+ and Tb3+ complexes), and are the intensity parameters with the contribution of the forced electric dipole mechanism (Judd-Ofelt theory). The quantities are reduced matrix elements, and their values are tabulated in [41]. The term is the dipole strength of the donor state T1 involved in IET. The are the 4f radial integrals [42,43], is the state degeneracy (equal 3 for T1), and are the shielding factors [44,45,46]; is the spin operator in the ligand, is the dipole operator (its -component), and is the reduced matrix elements of the spin operator for the Ln3+ side, which were calculated previously using free-ion wavefunctions in the intermediate coupling scheme [40].
The (Equations (3)–(5)) is the spectral overlap factor that contains the energy mismatch conditions. Once the bandwidth at half-height for the ligands ( cm−1) is much larger than the lanthanides ( cm−1), , this factor can simply be obtained as follows [38]:
where the is the energy difference between the T1 donor state () and the lanthanide ion acceptor state, .
The forward energy transfer rates (, T1 → Ln3+) involving the Ln3+ as acceptor are calculated by the sum over all mechanisms in the same pathway labelled as :
The backward energy transfer rates (, Ln3+ → T1), that is, the energy returned from acceptor to donor state, are obtained with the same above equations, except for multiplying the energy mismatch conditions factors (Equation (S6)) by the Boltzmann’s factor when ,
where is the temperature and is Boltzmann’s constant.
The total IET rates ( and ) are obtained from the sum over all individual contributions:
The calculated rates involving the T1 state at room temperature are presented in Table S2 (Eu3+) and Table S3 (Tb3+).
The thermal behavior of the energy transfer rates is calculated using Boltzmann’s factor, and, in the case of Eu3+, the thermally coupled populations of the levels 7F0 and 7F1 are also considered. See [38,39,40,47,48] and references therein for more details on the IET rate calculations.
3. Results
3.1. Morphological and Structural Characterizations
The synthesis of IONP@SiO2-acac/Tb3+/Eu3+ nano-objects was performed using a three-step approach consisting first of the synthesis of core@shell IONP@SiO2 nanoparticles, the further covalent grafting of the acac ligand in the silica pores, and third, the coordination of the latter to the Tb3+/Eu3+ ions (Scheme 1).
The pristine magnetic IONPs of ca. 26 nm were prepared by a conventional thermal decomposition method at high temperature (350 °C) by mixing the iron precursor (FeO(OH)) with oleic acid (OA) and oleylamine (OA) as stabilizing agents and using n-docosane as a solvent with a high boiling point [33]. The TEM images (Figure S1a, Supporting Information (SI)) of oleate/oleylamine-capped IONPs (IONP/OA/OA) show spherical nanoparticles with a narrow size distribution presenting an average diameter of 25.5 ± 1.8 nm, as calculated from the core size distribution from TEM measurements (Figure S1, SI). A hydrodynamic diameter determined from the DLS measurements, which takes into account the presence of organic molecules anchored on the surface, is equal to 31.3 ± 9.7 nm (Figure S1c, SI).
The powder XRD pattern of the obtained sample (Figure S1d, SI) shows the main reflections attributed to the Fe3O4 phase. The peak at 2θ = 36.6° also reveals the presence of FeO phase, which suggests an incomplete oxidation of FeO at the core and an outer layer of Fe3O4 [49]. Note, however, that the presence of γ-Fe2O3 cannot be totally excluded. The subsequent silica coating of IONPs with a controlled silica shell of different thicknesses was performed through an optimized Stöber process in a reverse microemulsion system [34]. Note that the possibility to modulate the thickness of the silica shell around the iron oxide nanoparticles core has been described in the literature, but in different synthetic conditions and with different IONP cores [50]. In our system, the silica shell thickness can be linearly modulated between 8.3 ± 0.2 and 27.9 ± 0.4 nm by varying the silica precursor (TEOS) amount from 1.5 to 12 µL while keeping the IONP core size and spherical shape unmodified (Figure 1a, Table S1). The shell thicknesses (Figure 1e, Table S1) were determined from the TEM measurement-based particle size distributions as the difference between the average diameters of whole nanoparticles (Figure 2c, Table S1) and their diameters of the IONP core (Figure 2b, Table S1). All synthesized core@shell nanoparticles present a uniform and individual coating of single IONP core, except the thinner silica shell of ca. 8 nm (1.5 µL of TEOS). For the latter, some inhomogeneities of the silica shell organization around the core have been detected.
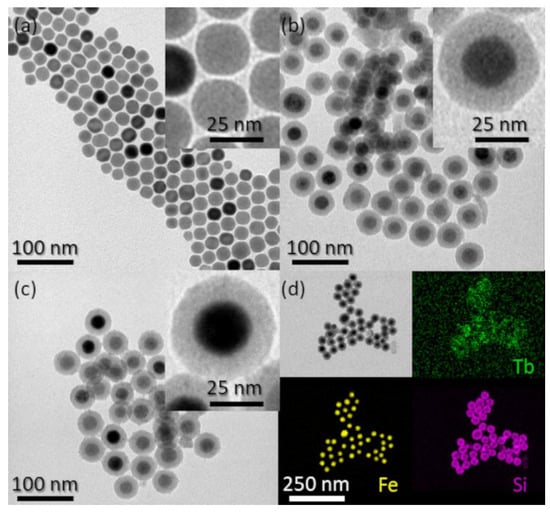
Figure 2.
TEM images of: (a) IONP/OA/OA, (b) IONP@SiO2-acac, and (c) IONP@SiO2-acac/Tb3+/Eu3+. (d) STEM-Bright Field image (BF) and STEM-EDX elemental mapping of IONP@SiO2-acac/Tb3+/Eu3+ with topochemical distribution of Tb (green), Fe (yellow), and Si (pink).
Therefore, IONP@SiO2 with the silica shell of ca. 11 nm (2 µL of TEOS) combining the thinner silica shell with a uniform coating of a single IONP core were selected for further grafting of Ln3+-based temperature sensor because of (i) the shortest distance between the Ln3+ based temperature sensor anchored to the silica shell and the IONP heater for the sake of an accurate temperature determination, and (ii) the expected lowest insulation effect of silica, which can reduce the magnetothermal heating [51]. First, a successful scale-up synthesis (×100) of these nanoparticles were performed. The as-obtained nanoparticles present very closed characteristics (Figure 2). Next, a covalent grafting of [CH3C(O)]2CH(CH2)3-Si(OCH2CH3)3 (acac-silane) on the silica surface of the IONP@SiO2 nanoparticles through the silane group and the further coordination of the acac moiety to Tb3+/Eu3+-ions (ratio Tb3+/Eu3+ = 19) was performed to achieve IONP@SiO2-acac/Tb3+/Eu3+ nano-objects (see Section 2.2.5 for the experimental details). The amount of acac ligands grafted to the silica surface of 15.2% was determined by the TGA analysis (Figure S2, Supporting Information). The atomic ratio of Fe, Si, Cl, Tb, and Eu in IONP@SiO2-acac/Tb3+/Eu3+ were determined by SEM-EDX analysis (see Section 2.2.5), which allowed us to calculate the ratio Ln3+:acac = 0.8:1. Moreover, the EDX confirmed the presence of both Tb3+ and Eu3+ ions, whereas the latter is in low amount (Tb3+/Eu3+ ratio = 17.5). Therefore, taking into account the aforementioned facts, as well as the presence of Cl−, we can assume that the majority of acac moieties have been coordinated to Ln3+ ions, being the first coordination sphere presumably completed by chlorides and water molecules.
IR spectra of nanoparticles synthesized in all steps are shown in Figure S4, Supporting Information. The IR spectrum of sample IONP@SiO2 clearly indicates the formation of the silica shell through the appearance of the conventional stretching vibrations ν(Si-O-Si) and ν(Si-OH) in the 700–1400 cm−1 spectral window. Moreover, the bands assigned to the free and coordinated to Ln3+ acac ligand may be observed on the IR spectra of samples IONP@SiO2 and IONP@SiO2-acac/Tb3+/Eu3+, respectively (Figure S4, Table S2, SI). However, due to the low intensity of the characteristic bands of the acac ligand and their overlapping with the bending vibrations of the OH groups from water, it was not possible to clearly state on the coordination of the lanthanide ions to the acac ligand in IONP@SiO2-acac/Tb3+/Eu3+.
TEM images of samples at different stages of preparation demonstrate that each single IONP core is surrounded by a clearly determined silica shell in IONP@SiO2, IONP@SiO2-acac, and IONP@SiO2-acac/Tb3+/Eu3+ (Figure 2b,c,d, Figure 1). The size distribution for the IONP@SiO2-acac/Tb3+/Eu3+ sample indicates an IONP core size of 26.0 ± 1.8 nm and a silica shell thickness of 11.2 ± 0.3 nm (Figure S5, SI). Note that the sizes and the shape of the IONP nanoparticles have not been altered by the silica coating, ligand grafting, and the coordination of Ln3+ (Figure 2, Figures S1 and S5, SI). Moreover, quasi monodispersed nanoparticles have been obtained in all steps (the standard deviations (SD) for all samples are less than 5% except one, for which it is less than 7%, see Figure 2c).
The topochemical distribution visualized by HAADF-STEM with the EDX mapping confirms the homogeneous distribution of Si and Tb3+ on the surface of IONP@SiO2-acac/Tb3+/Eu3+ nanoparticles, whereas Eu3+ could not be detected because of its very low amount (Figure 1d). This situation has already been seen in another work [9]. The DLS results (Figures S1c and S6, Supporting Information) indicate that the nanoparticles obtained in all steps are not aggregated.
3.2. Magnetic Characterization and Heating Property
The magnetic behavior of the IONP@SiO2-acac/Tb3+/Eu3+ nanoparticles was investigated in powder by using a SQUID-MPMS magnetometer working in the 1.8–350 K temperature range up to 5 T. A classical profile of the temperature dependence of the magnetization performed in the Zero Field Cooled (ZFC)/Filed Cooled (FC) modes under an applied field of 100 Oe with Tmax = 294 K can be observed in Figure 3. One can note the flatness (even decrease) of the FC curve as the temperature decreases, which can be interpreted as a hallmark of the superspin glass-like state at low temperature for the magnetic nanoparticles, rather than a superparamagnetic behavior [52].The field dependences of the magnetization at 1.8 K (black squares) and at 300 K (red circles) (Inset of Figure 3, Figure S7, SI) show the open hysteresis loop at low temperature with the coercive field of 908 Oe (at 1.8 K), whereas hysteresis is closed at 300 K. This static behavior is coherent with the previously reported results on IONPs [53].
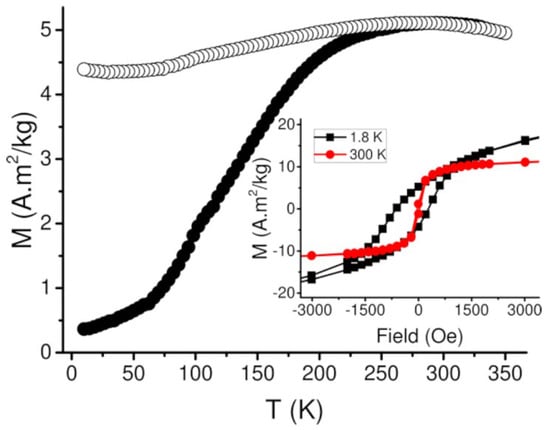
Figure 3.
ZFC-FC curves for IONP@SiO2-acac/Tb3+/Eu3+ measured under an applied magnetic field of 100 Oe. Inset: Variation of the magnetization as a function of magnetic field of IONP@SiO2-acac/Tb3+/Eu3+ at 1.8 K (black square) and 300 K (red circle) shown between −3 and 3 kOe.
The dynamic magnetic measurements were investigated using AC mode with different frequencies to determine the magnetic regime of these nanoparticles. The temperature dependence of the in-phase, χ′, and the out-of-phase, χ″, components of the AC susceptibility performed with frequencies ranging from 5 to 1201.9 Hz in a zero static field and with the oscillating field of 3 Oe shows a series of frequency dependent images, shown in Figure S8, SI. At 5 Hz, both, χ′ and χ″ responses present a maximum at 255 and 223 K, respectively, which shift toward higher temperatures as the frequency increases. This temperature dependence of the AC susceptibility is specific to the short-range magnetic ordering of nanoparticles. The temperature dependence of the relaxation time, τ, extracted from the maximum of the χ″ component is shown in Figure S9, SI. The τ vs. 1/T curve exhibits the occurrence of a rather complex dynamic behavior with the presence of low and high temperatures domains, which can be attributed to the presence of two magnetic regimes in these nanoparticles. The low temperature domain has been fitted with the Néel relaxation model (Figure S10, SI), which relates the blocking temperature with the relaxation time, τ = τ0exp(Ea/kBTB), where Ea = KV is the energy barrier and τ0 is the attempt time [54]. The best fit parameters gave the value of the energy barrier of 7853 ± 308 cm−1 and τ0 = 10−23.3 ± 0.8 s. Such a low value of τ0 is out of the 10−9–10−12 s−1 range usually observed for the pure superparamagnetic regime and has no physical meaning indicating that the Néel model is not appropriate to describe the dynamic of this system. However, such τ0 values rather suggest the presence of a superspin glass-like behavior with magnetic non-linearities and critical dynamic scaling below the freezing temperature [52]. Its origin may usually be induced by the presence of strong dipolar interactions and/or a spin frustration on the surface of the nanoparticles or in their volume [55]. Note that such low-temperature behavior is coherent with previously published results on IONP surrounded by organic molecules [53] or coated by a mesostructured silica shell [56]. For this reason, we verified whether the dynamic of the relaxation time in low temperature regime would exhibit critical reduction, as observed in canonical spin glasses or superspin glass-like nanoparticles. The frequency-dependent relaxation time has been fitted by the Vogel–Fulcher law, τ = τ0exp(Ea/kB(T − T0)), where T0 represents an additional parameter taking into account dipolar interactions between nanoparticles [36]. The obtained parameters (Ea = 7853 ± 345 cm−1, τ0 = 10−23.3 ± 0.9 s, and T0 = 5 × 10⁻¹¹ ± 1 × 10⁻⁶ K) indicated that T0 is very small and τ0 is not larger than the one obtained by using the Néel model (Figure S10, SI), suggesting that, in our system, the strength of the magnetostatic interactions is very low. This behavior is different in comparison to what we observed in the case of similar IONPs surrounded by organic molecules [53] and signify that the observed complex superspin glass-like behavior is induced by the presence of a complex interface with a silica shell leading to the surface and interface spin frustration [36]. Note that the presence of lanthanide ions did not importantly impact the magnetic behavior of the nanoparticles.
The heating capacity of IONP@SiO2-acac/Tb3+/Eu3+ was evaluated by measuring the temperature of ethanolic solutions (16 mg·mL−1) under an ac magnetic field (≈20 mT at a frequency of 350 kHz) by a thermal camera (Figure 4a). A rapid temperature rise up to approximately 48 °C suitable for a minimally invasive hyperthermia treatment [57] was observed in the 10 min of exposure (Figure 4b, red circles). In the absence of the nanoparticles (Figure 4b, black squares), the temperature increment is clearly lower (28 °C after 10 min of exposure). Although it is difficult to directly compare the heating capacity of IONP/OA/OA and IONP@SiO2-acac/Tb3+/Eu3+ because the measurements were done in different solvents, the temperature elevation at the macroscopic level for the latter is, however, strongly impacted by the silica shell (Figure S11, SI).
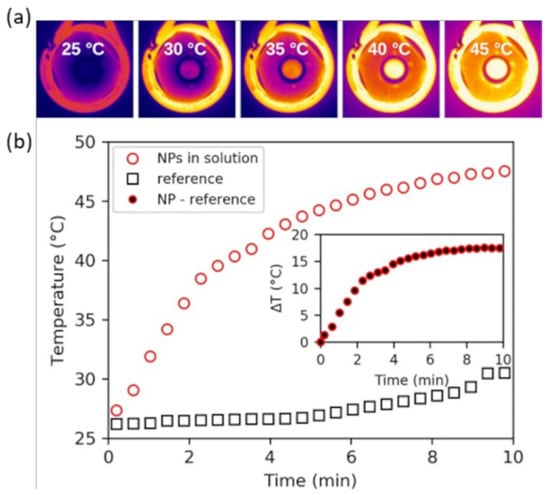
Figure 4.
(a) Thermal images of a vial containing the IONP@SiO2-acac-Ln3+ solution in the presence of the AC magnetic field (350 kHz, 20 mT). (b) Temperature measurements as a function of time of IONP@SiO2-acac/Ln3+ solution (red line) and ethanol (black line) subjected to an AC magnetic field. Inset: temporal evolution of the change in temperature (ΔT) calculated as the temperature difference between NPs in solution and reference.
3.3. Optical Characterization, Temperature Sensing, and Theoretical Modelling
The luminescence properties of IONP@SiO2-acac/Tb3+/Eu3+ were first investigated at room temperature. The excitation spectrum (Figure 5a and Figure S12, SI) measured by monitoring the Tb3+ main emission at 545 nm (5D4 → 7F5) shows a broad band with a maximum at 312 nm. This band accounts for the so-called antenna effect caused by the presence of the acac ligands and confirms their coordination to the lanthanide ions [58]. Note that the action of the β-diketones (such as acac) as antennas due to the high efficiency of energy transfer to Ln3+ is well known in the literature [59]. The emission spectrum (Figure 5b) recorded under excitation at 312 nm displays peaks at 489, 545, 590, 615, 651, and 699 nm, which are assigned to the characteristic intra-4f transitions arising from Tb3+ 5D4 to the 7FJ manifold (J = 6, 5, 4) [60] and Eu3+ 5D0 to the 7FJ manifold (J = 1, 2, 3, 4) [61]. The corresponding Dieke’s diagram is shown in Figure 6. The Tb3+ green emission (545 nm, 5D4 → 7F5) dominates the general intensity, followed by the Eu3+ red one (615 nm, 5D0 → 7F2). The excitation spectra recorded by monitoring the Eu3+ emission at 615 nm (5D0 → 7F4) and 698 nm (5D0 → 7F4) (Figure 5a) do not display any Tb3+ transitions precluding the occurrence of Tb3+-to-Eu3+ energy transfer. This is expected due to a random distribution of Ln3+ ions at the IONP surface, implying large Tb3+–Eu3+ distances [62,63]. The most plausible energy transfer mechanism is, thus, due to the intramolecular energy transfer (IET) from donor (triplet excited state of the ligand, T1) to acceptors Ln3+ levels, as depicted in Figure 6c.
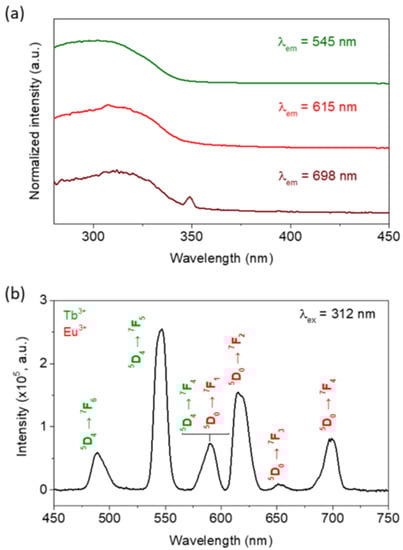
Figure 5.
(a) Room temperature excitation spectra of IONP@SiO2-acac/Tb3+/Eu3+ monitored at λem = 545, 615, and 698 nm. (b) Room temperature emission spectrum performed with λex = 312 nm for IONP@SiO2-acac/Tb3+/Eu3+. The Eu3+ and Tb3+ based transitions are written in red and green, respectively.
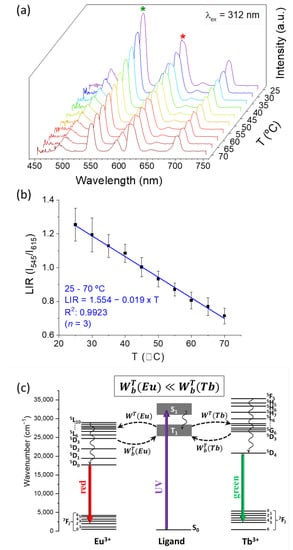
Figure 6.
(a) Emission spectra of IONP@SiO2-acac-Ln3+ (λex = 312 nm) recorded at temperatures between 25 and 70 °C. The green and red asterisk symbols indicate the Tb3+: 5D4 → 7F5 (530–565 nm) and Eu3+: 5D0 → 7F2 (603–637 nm) transitions, of which integrated areas were used to construct (b) the calibration curve LIR vs. temperature. The solid line represents a linear fitting. The error bars correspond to standard error of mean determined from three consecutive temperature cycles. (c) Simplified energy level diagram showing the intra-4f transitions observed in Figure 5b and the effect of the increase of the backward IET rates with the temperature; see SI for further details on the IET calculations.
Although SiO2-acac has a larger molecular framework than the precursor acac, both have conjugated systems located around the Ln3+ ion, and it is expected that the T1 states of the SiO2-acac do not shift greatly towards into the short wavelength region, in contrast to the T1 of the acac (T1 with energy lying above 25,500 cm−1) [37,64,65]. Therefore, we assumed a consistent value of T1 = 27,000 cm−1 for the SiO2-acac in the IET calculations. Thus, the IET rates from the ligand to Ln3+ ions were calculated according to Equations (3)–(5) [38,39,40,66]. The most relevant forward rates for Tb3+ are the T1 → [7F6 → 5G6] and T1 → [7F5 → 5G5], which together represent 90% of the total , whereas the backward is predominantly composed (~85% of the total rate) of four transitions from [5G6 → 7F6], [5G5 → 7F6], [5H5 → 7F5], and [5F5 → 7F5] → T1. However, the thermal effect involves the 5G6 and 5G5 levels due to their energy resonant condition with the T1 state (δ in the order of kBT); see pathways 3 and 5 in Table S4. However, the Eu3+ presented only the [7F1↔5G2] transition as the most important one for both forward (~85%) and backward rates (~99%); see pathway 13 in Table S3. Hence, once the 7F1 is involved, the thermal behavior of the Eu3+ is a direct consequence of the increase in the 7F1 population when temperature rises [62,67].
Our theoretical analysis showed that the total IET rates (forward rates, ligand-to-Ln3+, Figure 6c) is constant for the Tb3+, whereas it increases for the Eu3+ when the temperature rises (Figure 7). All back transfer rates (Ln3+-to-ligand, Figure 6c) increase with temperature, which may favor the emission intensities decreasing of the Eu3+ and Tb3+ ions, as observed in Figure 6a. However, the Tb3+ is more sensitive due to its relatively high , which represents a reasonable percentage of the forward (Figure 7b), reflecting a faster depopulation of the Tb3+ 5D4 than the Eu3+ 5D0 level when temperature increases.
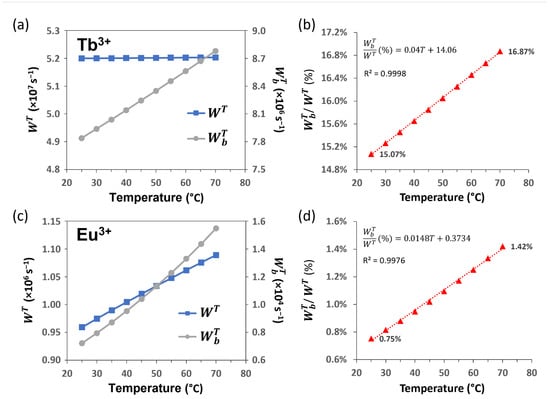
Figure 7.
IET rates involving the ligand T1 state. Forward and backward for (a) Tb3+ and (c) Eu3+ complexes (in s−1) as a function of the temperature; (b,d) show the growing behavior of the regarding the with temperature.
In order to verify if our nanoparticles can be used as an emissive thermometer, the emission spectra of IONP@SiO2-acac/Tb3+/Eu3+ were measured in the 25–70 °C temperature range under excitation at 312 nm (Figure 6a). The luminescence intensity ratio (LIR) between Tb3+ and Eu3+ main emissions (at 545 nm and 615 nm, respectively) shows a linear temperature dependence (Figure 6b), which enables the use of these nanoparticles as a self-referencing temperature sensor. The error bars represent the standard deviation of average values obtained upon three consecutive temperature cycles (Figure S14, SI). Note also that the absence of the Ln3+ ions leaching has been confirmed by taking the emission spectrum of remaining solution after removal of the nanoparticles by centrifugation after the first heating cycle. This emission spectrum free of nanoparticles did not present Ln3+ ions characteristic peaks.
The photo-stability was investigated by monitoring the emission spectra at room temperature after different periods of exposure to UV light (Figure S14, SI). The emission intensity was affected by UV-light irradiation with an estimated photo-degradation rate (i.e., emission intensity decrease per time) of less than 0.5% per minute for both, Tb3+ green and Eu3+ red transitions. Despite the photo-degradation effect resulting in the intensity decrease between cycles (Figure S14d, Supporting Information), the ratiometric feature of the sensing method offers the advantage of taking this variation into account in the thermometric parameter (LIR).
The calibration parameters and metrics related to the thermometric performance are provided in Table 1. The regression coefficient (R2) revealed excellent calibration linearity (R2 = 0.9923) in the operating temperature range 25–70 °C. The repeatability represents the variability among the measurements and is determined from the maximum relative standard deviation (RSD) [68]. The highest RSD observed among several heating cycles was 8.44%.

Table 1.
Calibration parameters of the thermometer IONP@SiO2-acac/Tb3+/Eu3+.
The relative thermal sensitivity (Sr) is the parameter used to describe and compare the sensing performance of different types of thermometers [67]. The Sr refers to the relative variation rate of the thermometric parameter (LIR in the present system) per degree of temperature, expressed as:
The highest Sr value observed was 1.64%·K−1 at 40 °C, which is satisfactory considering that high relative thermal sensitivities are frequently considered to be around 1%·K−1 [68]. Luminescent thermometers based on Tb3+/Eu3+-complexes covalently grafted to mesoporous silica using dipyridyl–pyridazine ligands presented the highest Sr of 1.32%·K−1 in the cryogenic range (−13 °C) and around 1.2%·K−1 in the physiological range [69].
Temperature uncertainty (or thermal resolution, δT) is the smallest temperature change that can be detected [68]. The δT value is correlated to Sr as follows:
where δLIR(T) is the standard deviation of LIR(T) determined from multiple heating cycles. According with this, the minimal thermal resolution found for the present system is 0.03 °C. This value is adequate considering the narrow temperature working range (41.8–45 °C) of hyperthermia [57], which demands high thermal resolution (≤0.1 °C) [70].
The thermometric performance of mixed Tb3+/Eu3+ compounds were recently summarized by Brites et al. [68]. The Tb3+/Eu3+-based thermometers are mostly molecular complexes or organic–inorganic hybrids presenting downshifted visible emission under UV-visible excitation. In these systems, the thermometric methods are based on energy transfer mechanisms between Tb3+ and Eu3+, as well as between Ln3+ and antenna ligands or host. In this sense, the temperature sensitivity of Tb3+ and Eu3+ emissions can be adjusted by varying the ligands [71] or the Tb3+/Eu3+ ratio [62]. The emissive level of Tb3+ (5D4) is energetically higher than the Eu3+ one (5D0), which favors its thermally driven depopulation caused by Tb3+-to-ligand energy transfer (Figure 6c) [9]. The higher thermal sensitivity of the Tb3+ green emission intensity compared to the Eu3+ red one enables the elaboration of ratiometric methods, in which the Eu3+ red emission works as a reference signal.
4. Conclusions
In summary, multifunctional magneto-luminescent core@shell IONP@SiO2 nanoparticles with covalently attached to the silica surface Tb3+/Eu3+(acac) moieties were synthesized and characterized. These nanoparticles present the clearly distinguished single IONP core of ca. 26 nm and the well-defined silica shell with controlled thickness. This system exhibits the Tb3+ and Eu3+ characteristic visible emissions and suitable magnetic properties that make it efficient as a nanoheater with a Ln3+-based emissive temperature sensor covalently coupled to it. The experimental investigations of photo-luminescence in solution coupled with theoretical modelling demonstrated the occurrence of an intramolecular energy transfer from donor (triplet excited state of the ligand, T1) to acceptors Ln3+ levels. The static and dynamic investigations of the magnetic behavior revealed that the nanoparticles exhibit a complex superspin glass-like behavior induced by surface and/or interface spin frustration that occurred in each nanoparticle, and the magnetostatic interactions do not importantly impact the magnetic regime. Note that this behavior is different in comparison with other similar IONPs with attached organic molecules on their surface or coated with mesostructured silica shell, for which the presence of dipolar interactions plays an important role in the appearance of a spin glass-like comportment. The freezing temperature occurred near room temperature, which permits the rapid heating of their solution up to 48 °C for 10 min under an applied ac magnetic field. In addition, the thermometer proposed here operates in a broad temperature range relevant for magnetothermia-related applications, with good photostability and reproducibility after multiple heating cycles. The possibility to design multifunctional magneto-luminescent nano-systems with a controlled morphology of a single nanoheater enwrapped by a thin silica shell containing an emissive thermometer opens new perspectives for accurate temperature detection during magnetic liquid hyperthermia therapy and represents the first step towards the local temperature measurements in unique magnetic nanoparticles. Given that the described Tb3+/Eu3+(acac) sensor should be excited in the UV domain and the emission occurs in the visible region, which is not compatible with the biological applications, the use of NIR-emissive complexes based on Nd3+, Er3+, or Yb3+ ions will constitute the next step of our study in the aim to design biologically relevant temperature sensors.
Supplementary Materials
The following supporting information can be downloaded at: https://www.mdpi.com/article/10.3390/nano12183109/s1. Figure S1: (a) TEM image of IONP/OA/OA and (b) corresponding particle size distribution (n = 100); (c) dynamic size distribution of IONP/OA/OA solution in cyclohexane estimated by DLS; (d) XRD pattern of IONP/OA/OA powder and reference diffraction peaks corresponding to Fe3O4 and FeO; Figure S2: TGA analyses obtained with a 5 °C min−1 heating rate under air for: (a) IONP@SiO2 (ca. 11 nm-shell) and (b) IONP@SiO2-acac; Figure S3: BET adsorption/desorption isotherms for nitrogen adsorption capacity of IONP@SiO2. Specific surface of 315 m2·g−1 has been estimated by Brunauer−Emmett−Teller (BET) method; Figure S4: IR spectra of IONP/OA/OA, IONP@SiO2, IONP@SiO2-acac/Ln3+, and acac-silane in: (a) the full analyzed range 4000–400 cm−1, (b) the magnification in the window 1800–1400 cm−1, (c) the magnification in the window 600–400 cm−1; Figure S5: Size distributions of (a) IONP@SiO2-acac and (b) IONP@SiO2-acac/Tb3+/Eu3+ (number of counted particles = 100); Figure S6: DLS size distribution of IONP@SiO2 (ca. 11 nm-shell), IONP@SiO2-acac, and IONP@SiO2-acac/Ln3+ dispersed in ethanol with average dynamic diameters of 159, 150, and 151 nm, respectively; Figure S7: Field dependence of the magnetization for IONP@SiO2-acac/Tb3+/Eu3+ nanoparticles at 1.8 K (black square), 10 K (blue diamond), and 300 K (red circle); Figure S8: Temperature dependence of: (a) in-phase, χ′, and (b) out-of-phase, χ″, components of the AC magnetic susceptibility performed at different frequencies for IONP@SiO2-acac/Tb3+/Eu3+ nanoparticles; Figure S9: Relaxation time vs. 1/T curve extracted from the frequency dependence of the out-of-phase component of the magnetic susceptibility; Figure S10: Low temperature region of relaxation time vs. 1/T curve extracted from the frequency dependence of the out-of-phase component of the AC magnetic susceptibility (black circle) and its theoretical fit by using the Arrhenius model (red line) and the Vogel–Fulcher model (blue dashed line) for IONP@SiO2-acac/Tb3+/Eu3+ nanoparticles; Figure S11: Temperature measurements as a function of time of IONP/OA/OA in cyclohexane (red) and IONP@SiO2-acac/Ln3+ solution in ethanol (blue) and reference (black) subjected to an AC magnetic field (≈ 20 mT at a frequency of 350 kHz); Figure S12: High-resolution spectrum of excitation spectrum monitored at λem = 698 nm. The peak at 348 nm is the half-order of the monitored wavelength; Figure S13: (a) Emission spectra (λex = 312 nm) at different temperatures for IONP@SiO2-acac/Tb3+/Eu3+ obtained upon three consecutive temperature cycles; (b) their respective normalized integrated intensities; and (c) LIR between 545 nm and 615 nm. Wavelength ranges for integrating areas: 530–565 nm (Tb3+:5D4 → 7F5) and 603–637 nm (Eu3+: 5D0 → 7F2). (d) Relative intensity of green and red emissions at 25 °C along the heating cycles; Figure S14: (a) Emission spectra of IONP@SiO2-acac/Ln3+ measured after different periods of exposure to excitation light (λex = 312 nm) and (b) relative intensities at 545 nm and 615 nm normalized to the spectrum measured at time t = 0. Wavelength ranges for integrating areas: 530–565 nm (Tb3+: 5D4 → 7F5) and 603–637 nm (Eu3+:5D0 → 7F2); Table S1: Size distribution of IONP@SiO2 core@shell nanoparticles and related amount of TEOS; Table S2: Band assignment for IR spectra of IONP/OA/OA, IONP@SiO2, IONP@SiO2-acac/Ln3+, and acac-silane; Table S3: IET rates (in s−1) from T1 (donor) to Eu3+ ion acceptor states; δ is the donor–acceptor energy difference (in cm−1); , , and are the dipole–dipole, dipole–multipole, and exchange rates (in s−1); and are the forward and backward energy transfer rates for each pathway at 25 °C; Table S4: IET rates (in s−1) from T1 (donor) to Tb3+ ion acceptor states; δ is the donor–acceptor energy difference (in cm−1); , , and are the dipole–dipole, dipole–multipole, and exchange rates (in s−1); and are the forward and backward energy transfer rates for each pathway at 25 °C.
Author Contributions
Conceptualization, S.S., K.N., G.F., J.L. and Y.G.; methodology, K.N., S.S., G.F., P.-E.M., L.D.C., J.L. and Y.G.; validation, K.N. and L.D.C.; formal analysis, E.O., K.N., A.N.C.N. and L.C.; investigation, B.B., K.N., S.S., A.N.C.N. and L.C.; resources, J.L. and Y.G.; data curation, K.N. and A.N.C.N.; writing—original draft preparation, K.N., J.L., A.N.C.N. and Y.G.; writing—review and editing, E.O., S.S., G.F., P.-E.M., L.D.C., J.L. and Y.G.; visualization, K.N. and Y.G.; supervision, S.S., L.D.C., P.-E.M., G.F., J.L. and Y.G.; project administration, J.L., L.D.C. and Y.G.; funding acquisition, J.L., L.D.C. and Y.G. All authors have read and agreed to the published version of the manuscript.
Funding
This research received no external funding.
Data Availability Statement
The data presented in this study are available on request from the corresponding authors.
Acknowledgments
J.L., K.N., G.F., L.C., P.-E.M. and Y.G. thank the University of Montpellier and CNRS for financial support, as well as for the project MAGCELL, which was co-financed by the European Union (European Regional Development Fund) as part of the support of interdisciplinary or innovative research projects in S3 fields of the Occitanie region. The work was also developed within the scope of the project CICECO-Aveiro Institute of Materials (UIDB/50011/2020 & UIDP/50011/2020) and The Shape of Water (PTDC/NAN-PRO/3881/2020) financed by Portuguese funds through the FCT/MEC and, when appropriate, co-financed by FEDER under the PT2020 Partnership Agreement. The support of the European Union’s Horizon 2020 FET Open program under grant agreement No. 801305 (NanoTBTech) is also acknowledged. Authors are grateful to Platform of Analysis and Characterization (PAC) of ICGM for magnetic and X-ray diffraction measurements and platform MEA for transmission electronic microscopy and STEM-BF/EDX measurements.
Conflicts of Interest
The authors declare no conflict of interest.
References
- Jaque, D.; Maestro, L.M.; del Rosal, B.; Haro-Gonzalez, P.; Benayas, A.; Plaza, J.L.; Martín Rodríguez, E.; Solé, J.G. Nanoparticles for photothermal therapies. Nanoscale 2014, 6, 9494–9530. [Google Scholar] [CrossRef]
- Gavilán, H.; Avugadda, S.K.; Fernández-Cabada, T.; Soni, N.; Cassani, M.; Mai, B.T.; Chantrell, R.; Pellegrino, T. Magnetic nanoparticles and clusters for magnetic hyperthermia: Optimizing their heat performance and developing combinatorial therapies to tackle cancer. Chem. Soc. Rev. 2021, 50, 11614–11667. [Google Scholar] [CrossRef] [PubMed]
- Healy, S.; Bakuzis, A.F.; Goodwill, P.W.; Attaluri, A.; Bulte, J.W.M.; Ivkov, R. Clinical magnetic hyperthermia requires integrated magnetic particle imaging. WIREs Nanomed. Nanobiotechnol. 2022, 14, e1779. [Google Scholar] [CrossRef] [PubMed]
- Rastinehad, R.; Anastos, H.; Wajswol, E.; Winoker, J.S.; Sfakianos, J.P.; Doppalapudi, S.K.; Carrick, M.R.; Knauer, C.J.; Taouli, B.; Lewis, S.C.; et al. Gold nanoshell-localized photothermal ablation of prostate tumors in a clinical pilot device study. Proc. Natl. Acad. Sci. USA 2019, 116, 18590–18596. [Google Scholar] [CrossRef]
- Riedinger, A.; Guardia, P.; Curcio, A.; Garcia, M.A.; Cingolani, R.; Manna, L.; Pellegrino, T. Subnanometer local temperature probing and remotely controlled drug release based on azo-functionalized iron oxide nanoparticles. Nano Lett. 2013, 13, 2399–2406. [Google Scholar] [CrossRef] [PubMed]
- Périgo, E.A.; Hemery, G.; Sandre, O.; Ortega, D.; Garaio, E.; Plazaola, F.; Teran, F.J. Fundamentals and advances in magnetic hyperthermia. Appl. Phys. Rev. 2015, 2, 041302. [Google Scholar] [CrossRef]
- Dutz, S.; Hergt, R. Magnetic particle hyperthermia—A promising tumour therapy? Nanotechnology 2014, 25, 452001. [Google Scholar] [CrossRef]
- Brites, D.; Lima, P.P.; Silva, N.J.; Millán, A.; Amaral, V.S.; Palacio, F.; Carlos, L.D. A luminescent molecular thermometer for long-term absolute temperature measurements at the nanoscale. Adv. Mater. 2010, 22, 4499–4504. [Google Scholar] [CrossRef]
- Pinol, R.; Brites, C.D.; Bustamante, R.; Martínez, A.; Silva, N.J.; Murillo, J.L.; Cases, R.; Carrey, J.; Estepa, C.; Sosa, C.; et al. Joining time-resolved thermometry and magnetic-induced heating in a single nanoparticle unveils intriguing thermal properties. ACS Nano 2015, 9, 3134–3142. [Google Scholar] [CrossRef]
- Zairov, R.R.; Dovzhenko, A.P.; Sapunova, A.S.; Voloshina, A.D.; Sarkanich, K.A.; Daminova, A.G.; Nizameev, I.R.; Lapaev, D.V.; Sudakova, S.N.; Podyachev, S.N.; et al. Terbium(III)-thiacalix [4]arene nanosensor for highly sensitive intracellular monitoring of temperature changes within the 303–313 K range. Sci. Rep. 2020, 10, 20541. [Google Scholar] [CrossRef]
- Shen, Y.; Santos, H.D.; Ximendes, E.C.; Lifante, J.; Sanz-Portilla, A.; Monge, L.; Fernández, N.; Chaves-Coira, I.; Jacinto, C.; Brites, C.D.S.; et al. Ag2S nanoheaters with multiparameter sensing for reliable thermal feedback during in vivo tumor therapy. Adv. Funct. Mater. 2020, 30, 2002730. [Google Scholar] [CrossRef]
- Ximendes, E.; Marin, R.; Shen, Y.; Ruiz, D.; Gómez-Cerezo, D.; Rodríguez-Sevilla, P.; Lifante, J.; Viveros-Méndez, P.X.; Gámez, F.; García-Soriano, D.; et al. Infrared-Emitting Multimodal Nanostructures for Controlled In Vivo Magnetic Hyperthermia. Adv. Mater. 2021, 33, 2100077. [Google Scholar] [CrossRef]
- Ortgies, H.; Teran, F.J.; Rocha, U.; de la Cueva, L.; Salas, G.; Cabrera, D.; Vanetsev, A.S.; Rähn, M.; Sammelselg, V.; Orlovskii, Y.V.; et al. Optomagnetic nanoplatforms for in situ controlled hyperthermia. Adv. Funct. Mater. 2018, 28, 1704434. [Google Scholar] [CrossRef]
- Xu, M.; Xue, B.; Wang, Y.; Wang, D.; Gao, D.; Yang, S.; Zhao, Q.; Zhou, C.; Ruan, S.; Yuan, Z. Temperature-Feedback Nanoplatform for NIR-II Penta-Modal Imaging-Guided Synergistic Photothermal Therapy and CAR-NK Immunotherapy of Lung Cancer. Small 2021, 17, 2101397. [Google Scholar] [CrossRef] [PubMed]
- Debasu, M.L.; Brites, C.D.S.; Balabhadra, S.; Oliveira, H.; Rocha, J.; Carlos, L.D. Nanoplatforms for Plasmon-Induced Heating and Thermometry. ChemNanoMat 2016, 2, 520–527. [Google Scholar] [CrossRef]
- Nigoghossian, K.; Ouellet, S.; Plain, J.; Messaddeq, Y.; Boudreau, D.; Ribeiro, S.J.L. Upconversion nanoparticle-decorated gold nanoshells for near-infrared induced heating and thermometry. J. Mater. Chem. B 2017, 5, 7109–7117. [Google Scholar] [CrossRef] [PubMed]
- Quintanilla, M.; García, I.; de Lázaro, I.; García-Alvarez, R.; Henriksen-Lacey, M.; Vranic, S.; Kostarelos, K.; Liz-Marzán, L.M. Thermal monitoring during photothermia: Hybrid probes for simultaneous plasmonic heating and near-infrared optical nanothermometry. Theranostics 2019, 9, 7298–7312. [Google Scholar] [CrossRef] [PubMed]
- Zhang, Z.; Suo, H.; Zhao, X.; Guo, C. 808 nm laser triggered self-monitored photo-thermal therapeutic nano-system Y2O3: Nd3+/Yb3+/Er3+@SiO2@Cu2S. Photonics Res. 2019, 8, 32. [Google Scholar] [CrossRef]
- Glais, E.; Maître, A.; Viana, B.; Chanéac, C. Experimental measurement of local high temperature at the surface of gold nanorods using doped ZnGa2O4 as a nanothermometer. Nanoscale Adv. 2021, 3, 2862–2869. [Google Scholar] [CrossRef]
- Rohani, S.; Quintanilla, M.; Tuccio, S.; de Angelis, F.; Cantelar, E.; Govorov, A.O.; Razzari, L.; Vetrone, F. Enhanced Luminescence, Collective Heating, and Nanothermometry in an Ensemble System Composed of Lanthanide-Doped Upconverting Nanoparticles and Gold Nanorods. Adv. Opt. Mater. 2015, 3, 1606–1613. [Google Scholar] [CrossRef]
- Debasu, M.L.; Ananias, D.; Pastoriza-Santos, I.; Liz-Marzán, L.M.; Rocha, J.; Carlos, L.D. All-in-one optical heater-thermometer nanoplatform operative from 300 to 2000 K based on Er3+ emission and blackbody radiation. Adv. Mater. 2013, 25, 4868–4874. [Google Scholar] [CrossRef] [PubMed]
- Huang, Y.; Rosei, F.; Vetrone, F. A single multifunctional nanoplatform based on upconversion luminescence and gold nanorods. Nanoscale 2015, 7, 5178–5185. [Google Scholar] [CrossRef] [PubMed]
- Jordan, A.; Scholz, R.; Maier-Hauff, K.; Johannsen, M.; Wust, P.; Nadobny, J.; Schirra, H.; Schmidt, H.; Deger, S.; Loening, S.; et al. Presentation of a new magnetic field therapy system for the treatment of human solid tumors with magnetic fluid hyperthermia. J. Magn. Magn. Mater. 2001, 225, 118–126. [Google Scholar] [CrossRef]
- Deatsch, E.; Evans, B.A. Heating efficiency in magnetic nanoparticle hyperthermia. J. Magn. Magn. Mater. 2014, 354, 163–172. [Google Scholar] [CrossRef]
- Figuerola, A.; di Corato, R.; Manna, L.; Pellegrino, T. From iron oxide nanoparticles towards advanced iron-based inorganic materials designed for biomedical applications. Pharmacol. Res. 2010, 62, 126–143. [Google Scholar] [CrossRef] [PubMed]
- Dong, J.; Zink, J.I. Taking the temperature of the interiors of magnetically heated nanoparticles. ACS Nano 2014, 8, 5199–5207. [Google Scholar] [CrossRef] [PubMed]
- Zhang, H.; Huang, H.; He, S.; Zeng, H.; Pralle, A. Monodisperse magnetofluorescent nanoplatforms for local heating and temperature sensing. Nanoscale 2014, 6, 13463–13469. [Google Scholar] [CrossRef]
- Brites, C.D.S.; Lima, P.P.; Silva, N.J.O.; Millán, A.; Amaral, V.S.; Palacio, F.; Carlos, L.D. Ratiometric highly sensitive luminescent nanothermometers working in the room temperature range. Applications to heat propagation in nanofluids. Nanoscale 2013, 5, 7572–7580. [Google Scholar] [CrossRef]
- Brites, C.D.S.; Lima, P.P.; Carlos, L.D. Tuning the sensitivity of Ln3+-based luminescent molecular thermometers through ligand design. J. Lumin. 2016, 169, 497–502. [Google Scholar] [CrossRef]
- Lin, L.; Li, Z.; Wang, Z.; Feng, Z.; Huang, F.; Dai, Q.; Zheng, Z. Hypersensitive and color-tunable temperature sensing properties of (Eu,Tb)(AcAc)3phen via phonon-assisted energy transfer. Opt. Mater. 2020, 110, 110532. [Google Scholar] [CrossRef]
- Kaczmarek, A.M.; Liu, Y.; Kaczmarek, M.K.; Liu, H.; Artizzu, F.; Carlos, L.D.; van der Voort, P. Developing luminescent ratiometric thermometers based on a covalent organic framework (COF). Angew. Chem. 2020, 132, 1948–1956. [Google Scholar] [CrossRef]
- Kaczmarek, A.M.; Maegawa, Y.; Abalymov, A.; Skirtach, A.G.; Inagaki, S.; van der Voort, P. Lanthanide-grafted bipyridine periodic mesoporous organosilicas (BPy-PMOs) for physiological range and wide temperature range luminescence thermometry. ACS Appl. Mater. Interfaces 2020, 12, 13540–13550. [Google Scholar] [CrossRef] [PubMed]
- Yu, W.W.; Falkner, J.C.; Yavuz, C.T.; Colvin, V.L. Synthesis of monodisperse iron oxide nanocrystals by thermal decomposition of iron carboxylate salts. Chem. Commun. 2004, 20, 2306–2307. [Google Scholar] [CrossRef] [PubMed]
- Zhang, X.; Clime, L.; Roberge, H.; Normandin, F.; Yahia, L.; Sacher, E.; Veres, T. pH-Triggered doxorubicin delivery based on hollow nanoporous silica nanoparticles with free-standing superparamagnetic Fe3O4 cores. J. Phys. Chem. C 2011, 115, 1436–1443. [Google Scholar] [CrossRef]
- Matsura, V.; Guari, Y.; Larionova, J.; Guérin, C.; Caneschi, A.; Sangregorio, C.; Lancelle-Beltran, E.; Mehdi, A.; Corriu, R.J.P. Synthesis of magnetic silica-based nanocomposites containing Fe3O4 nanoparticles. J. Mater. Chem. 2004, 14, 3026–3033. [Google Scholar] [CrossRef]
- Girtu, M.A. The dynamic susceptibility of a quasi-one-dimensional Mn porphyrin-based hybrid magnet: Cole-Cole analysis. J. Opt. Adv. Mater. 2002, 4, 85–92. [Google Scholar]
- Bhaumik, M.L.; El-Sayed, M.A. Mechanism and rate of the intramolecular energy transfer process in rare-earth chelates. J. Chem. Phys. 1965, 42, 787. [Google Scholar] [CrossRef]
- Neto, A.N.C.; Teotonio, E.E.S.; de Sá, G.F.; Brito, H.F.; Legendziewicz, J.; Carlos, L.D.; Felinto, M.C.F.C.; Gawryszewska, P.; Moura, R.T.; Longo, R.L.; et al. Modeling intramolecular energy transfer in lanthanide chelates: A critical review and recent advances. Handb. Phys. Chem. Rare Earths 2019, 56, 55–162. [Google Scholar]
- Malta, O.L. Ligand—Rare-earth ion energy transfer in coordination compounds. A theoretical approach. J. Lumin. 1997, 71, 229–236. [Google Scholar] [CrossRef]
- Kasprzycka, E.; Carneiro Neto, A.N.; Trush, V.A.; Jerzykiewicz, L.; Amirkhanov, V.M.; Malta, O.L.; Legendziewicz, J.; Gawryszewska, P. How minor structural changes generate major consequences in photophysical properties of RE coordination compounds; resonance effect, LMCT state. J. Rare Earths 2020, 38, 552–563. [Google Scholar] [CrossRef]
- Carnall, W.T.; Crosswhite, H.; Crosswhite, H.M. Energy Level Structure and Transition Probabilities in the Spectra of the Trivalent Lanthanides in LaF3; Office of Scientific and Technical Information (OSTI): Argonne, United States, 1978. [Google Scholar] [CrossRef]
- Smentek, L. Theoretical description of the spectroscopic properties of rare earth ions in crystals. Phys. Rep. 1998, 297, 155–237. [Google Scholar] [CrossRef]
- Edvardsson, S.; Klintenberg, M. Role of the electrostatic model in calculating rare-earth crystal-field parameters. J. Alloys Compd. 1998, 275–277, 230–233. [Google Scholar] [CrossRef]
- Carneiro Neto, N.; Moura, R.T., Jr. Overlap integrals and excitation energies calculations in trivalent lanthanides 4f orbitals in pairs Ln-L (L = Ln, N, O, F, P, S, Cl, Se, Br, and I). Chem. Phys. Lett. 2020, 757, 137884. [Google Scholar] [CrossRef]
- Carneiro Neto, N.; Moura, R.T.; Malta, O.L. On the mechanisms of non-radiative energy transfer between lanthanide ions: Centrosymmetric systems. J. Lumin. 2019, 210, 342–347. [Google Scholar] [CrossRef]
- Malta, O.L. Mechanisms of non-radiative energy transfer involving lanthanide ions revisited. J. Non-Cryst. Solids 2008, 354, 4770–4776. [Google Scholar] [CrossRef]
- Moura, R.T.; Oliveira, J.A.; Santos, I.A.; Lima, E.M.; Carlos, L.D.; Aguiar, E.C.; Carneiro Neto, A.N. Theoretical evidence of the singlet predominance in the intramolecular energy transfer in Ruhemann’s purple Tb(III) complexes. Adv. Theory Simul. 2021, 4, 2000304. [Google Scholar] [CrossRef]
- Aquino, L.E.N.; Barbosa, G.A.; Ramos, J.L.; Giese, S.O.K.; Santana, F.S.; Hughes, D.L.; Nunes, G.G.; Fu, L.; Fang, M.; Poneti, G.; et al. Seven-coordinate Tb3+ complexes with 90% quantum yields: High-performance examples of combined singlet-and triplet-to-Tb3+ energy-transfer pathways. Inorg. Chem. 2021, 60, 892–907. [Google Scholar] [CrossRef]
- Hou, Y.; Xu, Z.; Sun, S. Controlled synthesis and chemical conversions of FeO nanoparticles. Angew. Chem. 2007, 119, 6445–6448. [Google Scholar] [CrossRef]
- Ding, H.L.; Zhang, Y.X.; Wang, S.; Xu, J.M.; Xu, S.C.; Li, G.H. Fe3O4@SiO2 core/shell nanoparticles: The silica coating regulations with a single core for different core sizes and shell thicknesses. Chem. Mater. 2012, 24, 4572–4580. [Google Scholar] [CrossRef]
- Das, H.; Debnath, N.; Arai, T.; Kawaguchi, T.; Sakamoto, N.; Shinozaki, K.; Suzuki, H.; Wakiya, N. Superparamagnetic magnesium ferrite/silica core-shell nanospheres: A controllable SiO2 coating process for potential magnetic hyperthermia application. Adv. Powder Technol. 2019, 30, 3171–3181. [Google Scholar] [CrossRef]
- Parker, D.; Dupuis, V.; Ladieu, F.; Bouchaud, J.-P.; Dubois, E.; Perzynski, R.; Vincent, E. Spin-glass behavior in an interacting γ-Fe2O3 nanoparticle system. Phys. Rev. B 2008, 77, 104428. [Google Scholar] [CrossRef] [Green Version]
- Lartigue, L.; Innocenti, C.; Kalaivani, T.; Awwad, A.; Duque, M.d.S.; Guari, Y.; Larionova, J.; Guérin, C.; Montero, J.-L.G.; Barragan-Montero, V.; et al. Water-dispersible sugar-coated iron oxide nanoparticles. An evaluation of their relaxometric and magnetic hyperthermia properties. J. Am. Chem. Soc. 2011, 133, 10459–10472. [Google Scholar] [CrossRef] [PubMed]
- Néel, L. Théorie du traînage magnétique des ferromagnétiques en grains fins avec applications aux terres cuites. Ann. Géophys. 1949, 5, 99–136. [Google Scholar]
- Mydosh, J.A. Spin Glasses: An Experimental Introduction; Taylor and Francis: Washington, DC, USA, 1993. [Google Scholar]
- Perrier, M.; Gary-Bobo, M.; Lartigue, L.; Brevet, D.; Morère, A.; Garcia, M.; Maillard, P.; Raehm, L.; Guari, Y.; Larionova, J.; et al. Mannose-functionalized porous silica-coated magnetic nanoparticles for two-photon imaging or PDT of cancer cells. J. Nanopart. Res. 2013, 15, 1602–1609. [Google Scholar] [CrossRef]
- Pang, L.K. Hyperthermia in Oncology; CRC Press: Boca Raton, FL, USA, 2015. [Google Scholar]
- Binnemans, K. Lanthanide-based luminescent hybrid materials. Chem. Rev. 2009, 109, 4283–4374. [Google Scholar] [CrossRef]
- Reddy, M.L.P.; Divya, V.; Pavithran, R. Visible-light sensitized luminescent europium (III)-β-diketonate complexes: Bioprobes for cellular imaging. Dalton Trans. 2013, 42, 15249–15262. [Google Scholar] [CrossRef]
- Carnall, W.T.; Fields, P.R.; Rajnak, K. Electronic energy levels of the trivalent lanthanide aquo ions. III. Tb3+. J. Chem. Phys. 1968, 49, 4447–4449. [Google Scholar] [CrossRef]
- Carnall, W.T.; Fields, P.R.; Rajnak, K. Electronic energy levels of the trivalent lanthanide aquo ions. IV. Eu3+. J. Chem. Phys. 1968, 49, 4450–4455. [Google Scholar] [CrossRef]
- Trannoy, V.; Neto, A.N.C.; Brites, C.D.; Carlos, L.D.; Serier-Brault, H. Engineering of mixed Eu3+/Tb3+ metal-organic frameworks luminescent thermometers with tunable sensitivity. Adv. Opt. Mater. 2021, 9, 2001938. [Google Scholar] [CrossRef]
- Neto, N.C.; Moura, R.T.; Shyichuk, A.; Paterlini, V.; Piccinelli, F.; Bettinelli, M.; Malta, O.L. Theoretical and experimental investigation of the Tb3+→ Eu3+ energy transfer mechanisms in cubic A3Tb0.90Eu0.10(PO4)3 (A = Sr, Ba) materials. J. Phys. Chem. C 2020, 124, 10105–10116. [Google Scholar] [CrossRef]
- Zang, X.; Hong, Z.R.; Li, W.L.; Li, M.T.; Sun, X.Y. 1.4 μm band electroluminescence from organic light-emitting diodes based on thulium complexes. Appl. Phys. Lett. 2004, 84, 2679–2681. [Google Scholar] [CrossRef]
- Han, L.; Yang, D.; Li, W.; Chu, B.; Chen, Y.; Su, Z.; Zhang, D.; Yan, F.; Wu, S.; Wang, J.; et al. Intramolecular energy transfer between the triplet of ancillary ligand and the metal to ligand charge transfer state existed in heterocyclometalated iridium (III) complexes. Appl. Phys. Lett. 2009, 94, 163303. [Google Scholar] [CrossRef]
- Moura, R.T., Jr.; Carneiro Neto, A.N.; Aguiar, E.C.; Santos, C.V., Jr.; de Lima, E.M.; Faustino, W.M.; Teotonio, E.E.S.; Brito, H.F.; Felinto, M.C.F.C.; Ferreira, R.A.S.; et al. JOYSpectra: A web platform for luminescence of lanthanides. Opt. Mater. 2021, 11, 100080. [Google Scholar] [CrossRef]
- Carneiro Neto, N.; Mamontova, E.; Botas, A.M.P.; Brites, C.D.S.; Ferreira, R.A.S.; Rouquette, J.; Guari, Y.; Larionova, J.; Long, J.; Carlos, L.D. Rationalizing the thermal response of dual-center molecular thermometers: The example of an Eu/Tb coordination complex. Adv. Opt. Mater. 2021, 10, 2101870. [Google Scholar] [CrossRef]
- Brites, D.; Balabhadra, S.; Carlos, L.D. Lanthanide-based thermometers: At the cutting-edge of luminescence thermometry. Adv. Opt. Mater. 2019, 7, 1801239. [Google Scholar] [CrossRef]
- Kaczmarek, M.; Esquivel, D.; Laforce, B.; Vincze, L.; Van Der Voort, P.; Romero-Salguero, F.J.; van Deun, R. Luminescent thermometer based on Eu3+/Tb3+-organic-functionalized mesoporous silica. Luminescence 2018, 33, 567–573. [Google Scholar] [CrossRef]
- Quintanilla, M.; Liz-Marzan, L.M. Guiding rules for selecting a nanothermometer. Nano Today 2018, 19, 126–145. [Google Scholar] [CrossRef]
- Hatanaka, M.; Hirai, Y.; Kitagawa, Y.; Nakanishi, T.; Hasegawa, Y.; Morokuma, K. Organic linkers control the thermosensitivity of the emission intensities from Tb (III) and Eu (III) in a chameleon polymer. Chem. Sci. 2017, 8, 423–429. [Google Scholar] [CrossRef] [PubMed] [Green Version]
Publisher’s Note: MDPI stays neutral with regard to jurisdictional claims in published maps and institutional affiliations. |
© 2022 by the authors. Licensee MDPI, Basel, Switzerland. This article is an open access article distributed under the terms and conditions of the Creative Commons Attribution (CC BY) license (https://creativecommons.org/licenses/by/4.0/).