Article

Detailed Investigation of Factors Affecting the Synthesis of SiO2@Au for the Enhancement of Raman Spectroscopy

1
Department of Telecommunications, VSB Technical University of Ostrava, 708 00 Ostrava, Czech Republic
2
Future Materials & Devices Laboratory, Institute of Fundamental and Applied Sciences, Duy Tan University, Ho Chi Minh City 700000, Vietnam
3
Faculty of Natural Sciences, Duy Tan University, Da Nang City 550000, Vietnam
*
Author to whom correspondence should be addressed.
Nanomaterials 2022, 12(17), 3080; https://doi.org/10.3390/nano12173080
Submission received: 4 August 2022 / Revised: 28 August 2022 / Accepted: 1 September 2022 / Published: 5 September 2022

Abstract

:
The reaction time, temperature, ratio of precursors, and concentration of sodium citrate are known as the main factors that affect the direct synthesis process of SiO2@Au based on the chemical reaction of HAuCl4 and sodium citrate. Hence, we investigated, in detail, and observed that these factors played a crucial role in determining the shape and size of synthesized nanoparticles. The significant enhancement of the SERS signal corresponding to the fabrication conditions is an existing challenge. Our study results show that the optimal reaction conditions for the fabrication of SiO2@Au are a 1:21 ratio of HAuCl4 to sodium citrate, with an initial concentration of sodium citrate of 4.2 mM, and a reaction time lasting longer than 6 h at a temperature of 80 °C. Under optimal conditions, our synthesis process result is SiO2@Au nanoparticles with a diameter of approximately 350 nm. In particular, the considerable enhancement of Raman intensities of SiO2@Au compared to SiO2 particles was examined.

1. Introduction

Recently, the surface plasmon resonance properties of metal nanostructures have attracted significant attention from researchers because of their potential applications in various fields, e.g., materials science [1], biology [2], chemistry [3], and environmental analysis [4]. The plasmonic properties of metal nanoparticles significantly depend on the shape, size, and nature of the nanostructured materials employed [5,6]. Among applications based on the surface plasmon phenomena, surface-enhanced Raman scattering (SERS) has emerged as a strong analytical technique that considerably contributes to the enormous improvement of SERS-based sensing techniques [7,8]. SERS is a novel optical technique that combines nanotechnology with Raman scattering spectroscopy to produce an analytical tool with high sensitivity. It is based on the excitation of surface plasmon resonance to amplify the Raman signal on the metal surface [9]. Modern SERS techniques have been widely developed in recent years and opened a new step in many scientific fields, such as the environment, food, and biomedicine [10,11]. The SERS sensing technique has become a powerful analytical tool for researchers in the nanotechnology field to identify the component composition of substances and provide information about their molecular structure at low concentrations without destroying them [12,13,14]. In this technique, the SERS substrate plays a crucial role in determining the correction and effectiveness of the analytical tool. Therefore, developing new materials and optimal nanostructures is necessary to produce stable and efficient substrates for SERS. The nanostructures of noble metals, such as Au [15,16], Ag [17,18], and Cu [19,20], have been studied as excellent plasmonic materials and widely employed in plasmonic applications. Such nobble metals exhibit surface plasmonic resonances in the visible and NIR region [21].
The core-shell nanostructures have been discovered as efficient SERS substrates to amplify the Raman signal in which the cores are SiO2 spherical particles, and their shell components are composed of noble metal nanoparticles. The position of the surface plasmon band of core-shell nanostructures can be tuned according to the size, shape, and surface morphology [22,23]. Among these substrates, SiO2@Au nanoparticles have been extensively studied in many chemical and biomedical research fields over the past year due to their unique optoelectronic and physicochemical properties [24,25].
However, synthesizing a complete metal shell with uniform and high coverage around the silica core is challenging. Therefore, a series of strategies for the synthesis of SiO2@Au nanoparticles on SiO2 have been developed, such as gold electroless plating [26], the self-assembled monolayer method [27], the layer-by-layer cross-linking method [28], controlled seed growth [29], the ultrasound-assisted Stober method [30], and the sol-gel method [31]. The most common method for synthesizing SiO2@Au core-shell structure nanoparticles is through a two-step process that involves decorating a functionalized SiO2 surface with small gold seeds and the growth of a gold shell. Additionally, some studies have produced SiO2@Au nanoparticles through the direct growth of gold shells on SiO2 spheres without gold seeds. Michael et al. proposed coating a thin and uniform gold layer on bare silica nanoparticles by reducing a gold (I) chloride solution dissolved in acetonitrile with ascorbic acid [32]. Zhang et al. reported a facile method with a one-pot, one-step process for preparation SiO2@Au by heating a solution containing chloroauric acid (HAuCl4), 2-methylaminoethanol (2-MAE), CTAB, and TEOS at 80° [33].
In some approaches related to the deposition of gold seeds on SiO2 spheres, the functionalization of nanoparticles is essential to increase the absorption of Au seeds on the SiO2 surface and maintain the stability of the nanostructure during the synthesis process. The coverage level of the gold nanoparticles on the silica core is affected by the strength of attraction between the gold particles and the core, as well as by the force balance between the particles in the shell region [34,35]. Therefore, the surface of SiO2 spheres is commonly functionalized by organic agents with high adhesion with gold, such as (3-aminopropyl) trimethoxysilane (APTMS), polyethyleneimine (PEI), and 3-mercaptopropyltrimethoxysilane (MPTMS) [36,37].
An approach involving an amine-terminated coupling agent, which acts as an adhesive agent to attach gold nucleation to silica nanoparticles, was first proposed by Halas et al. [38]. The controlled shell growth method involving small gold seeds (diameters of 1 to 2 nm) acting as nucleation center on the surface of SiO2 spheres was proposed by Yukhymchuk et al. In this study, SiO2 spheres with a diameter of 160 to 210 nm were functionalized with positively charged amino groups before decoration with gold nanoparticles. A complete gold shell was formed by reducing gold salt with reducing agents of hydroxyl-amine muriatic NH2OH.HCl and sodium borohydride NaBH4 [39]. Moreover, Kandpal et al. synthesized SiO2@Au nanoparticles with a multistep process involving the combination of the citrate and borohydride methods. The authors started with the citrate method, reducing the HAuCl4 gold salt with trisodium citrate Na3(C6H5O7) at 80 for 30 min for deposition of gold nucleation on functionalized silica spheres with 3-aminopropyltriethoxysilane (APS). Then, the borohydride method was applied to develop gold nucleation for formation a gold shell, which reduces HAuCl4/K2CO3 solution with sodium borohydride (NaBH4). The obtained results demonstrate that the combination of the two methods resulted in the significant enhancement of the SERS signal compared to each of the methods alone [40]. The technique of grafting Au nanoparticles on trimethoxysilane (APTMS)-functionalized SiO2 spheres and then priming these nanoparticles with gold colloids of 2 nm and 10 nm before chemically reducing the gold salt with NaBH4 (5.3 mM) was investigated by Saini et al. The thickness of the gold shell is controlled by the ratio between the precursor particles and the gold salt solution. This method was proven to improv the SERS signal with a small amount of gold [41]. Wang et al. reported a fabrication process of SiO2@Au nanoparticles using the isotropic growth method of gold seeds (3–5 nm) on PEI-functionalized SiO2 spheres (diameter of 190 nm) by reducing gold salt with hydroxylamine hydrochloride (NH2OH.HCl) under ultrasound assistance instead of traditional methods. This approach successfully reduced the fabrication time and the time for completing the gold shell within 5 min. Moreover, the attained SiO2@Au nanoparticles were highly homogeneous and well-defined in size and shape [42]. Khurana et al. proposed synthesizing freckled SiO2@Au nanocomposites (NCs) by gold-seed-mediated growth on MPTMS-functionalized silica spheres. Freckled SiO2@Au NCs with SiO2 core sizes of 880 nm and 430 nm and a shell thickness in the range of 12–50 nm exhibited high surface consistency of the shell and excellent enhancement of the SERS signal [14]. Table 1 presents a review of the methods and related conditions for the fabrication of SiO2@Au. Although reports have presented the preparation process of Au@SiO2 using different methods, as well as the strong points of each method, no reports have been published showing factors affecting the synthesis of SiO2@Au nanomaterial in detail.
In this study, we present a deep view of factors that affect the synthesis of SiO2@Au material, including temperature, reaction time, the ratio of precursors, and the concentration of sodium citrate. The characteristics of the obtained SiO2@Au nanoparticles will be investigated using UV-Vis spectra, SEM, and DLS. The Raman spectroscopy of SiO2 spheres before and after coating Au nanoparticles will also be examined.

2. Materials and Methods

2.1. Materials

Non-functionalized Silica microspheres approximately 0.27 µm in the dry form with 100% solids were purchased from (Polyscience Asia Pacific Inc., Taipei, Taiwan). The surface group of non-functionalized SiO2 is normally silanol (SiOH), and the refractive index is around 1.43–1.46 (589 nm).
Gold (III) chloride solution (HAuCl4, 99.9%), polyethylenimine (-[-CH2-CH2-NH-]-), and sodium citrate dihydrate (HOC(COONa)(CH2COONa)2 2H2O) were purchased from of Sigma-Aldrich, St. Louis, MO, USA commercial suppliers. The gold (III) chloride solution has a composition Au of 17 wt.% and concentration of 30 wt.% in dilute HCl. Sodium citrate dihydrate is the trisodium salt of citric acid, which takes in citrate (3−). All chemicals were of analytical grade and used without further purification.

2.2. Preparation of SiO2@Au

SiO2@Au material was synthesized via chemical reduction pursuant to Scheme 1. A mixture of 0.01-g SiO2 spheres (approximately 270 nm in size) and PEI was dispersed in DI water under sonication for 20 min. Next, an HAuCl4 solution was gradually dropped into the mixture. The obtained mixture was then shaken for 60 min before adding sodium citrate at the investigated temperature. Factors affecting the preparation were examined, such as temperature, reaction time, the ratio of precursors, and the concentration of sodium citrate.

2.3. Characterization

The extinction spectra of the synthesized SiO2@Au nanoparticles were determined using a UV-Vis spectrometer V630 (V630, Jasco, Japan). This instrument operates with high speeds of up to 8000 nm/min and can measure wavelength ranges from 190 to 1100 nm. The images of surface morphologies of SiO2, SiO2@PEI, and SiO2@Au microspheres were observed and evaluated by a scanning electron microscope (S-4800 SEM, Hitachi, Japan) with an accelerating voltage range the electron beam in the range of 0.5 to 30kV. A DLS analytical instrument (Horiba, SZ-100Z2, Kyoto, Japan) was used to determine the size of SiO2 and SiO2@Au by measuring the intensity of the dynamic light scattering of these particles. The Raman scattering intensity was measured on a Raman spectrometer (Horiba Ihr 550, Kyoto, Japan) using a laser source with an excitation light wavelength of 532 nm and methylene blue analyte.

3. Results

3.1. Factors Affecting the Synthesis of SiO2@Au

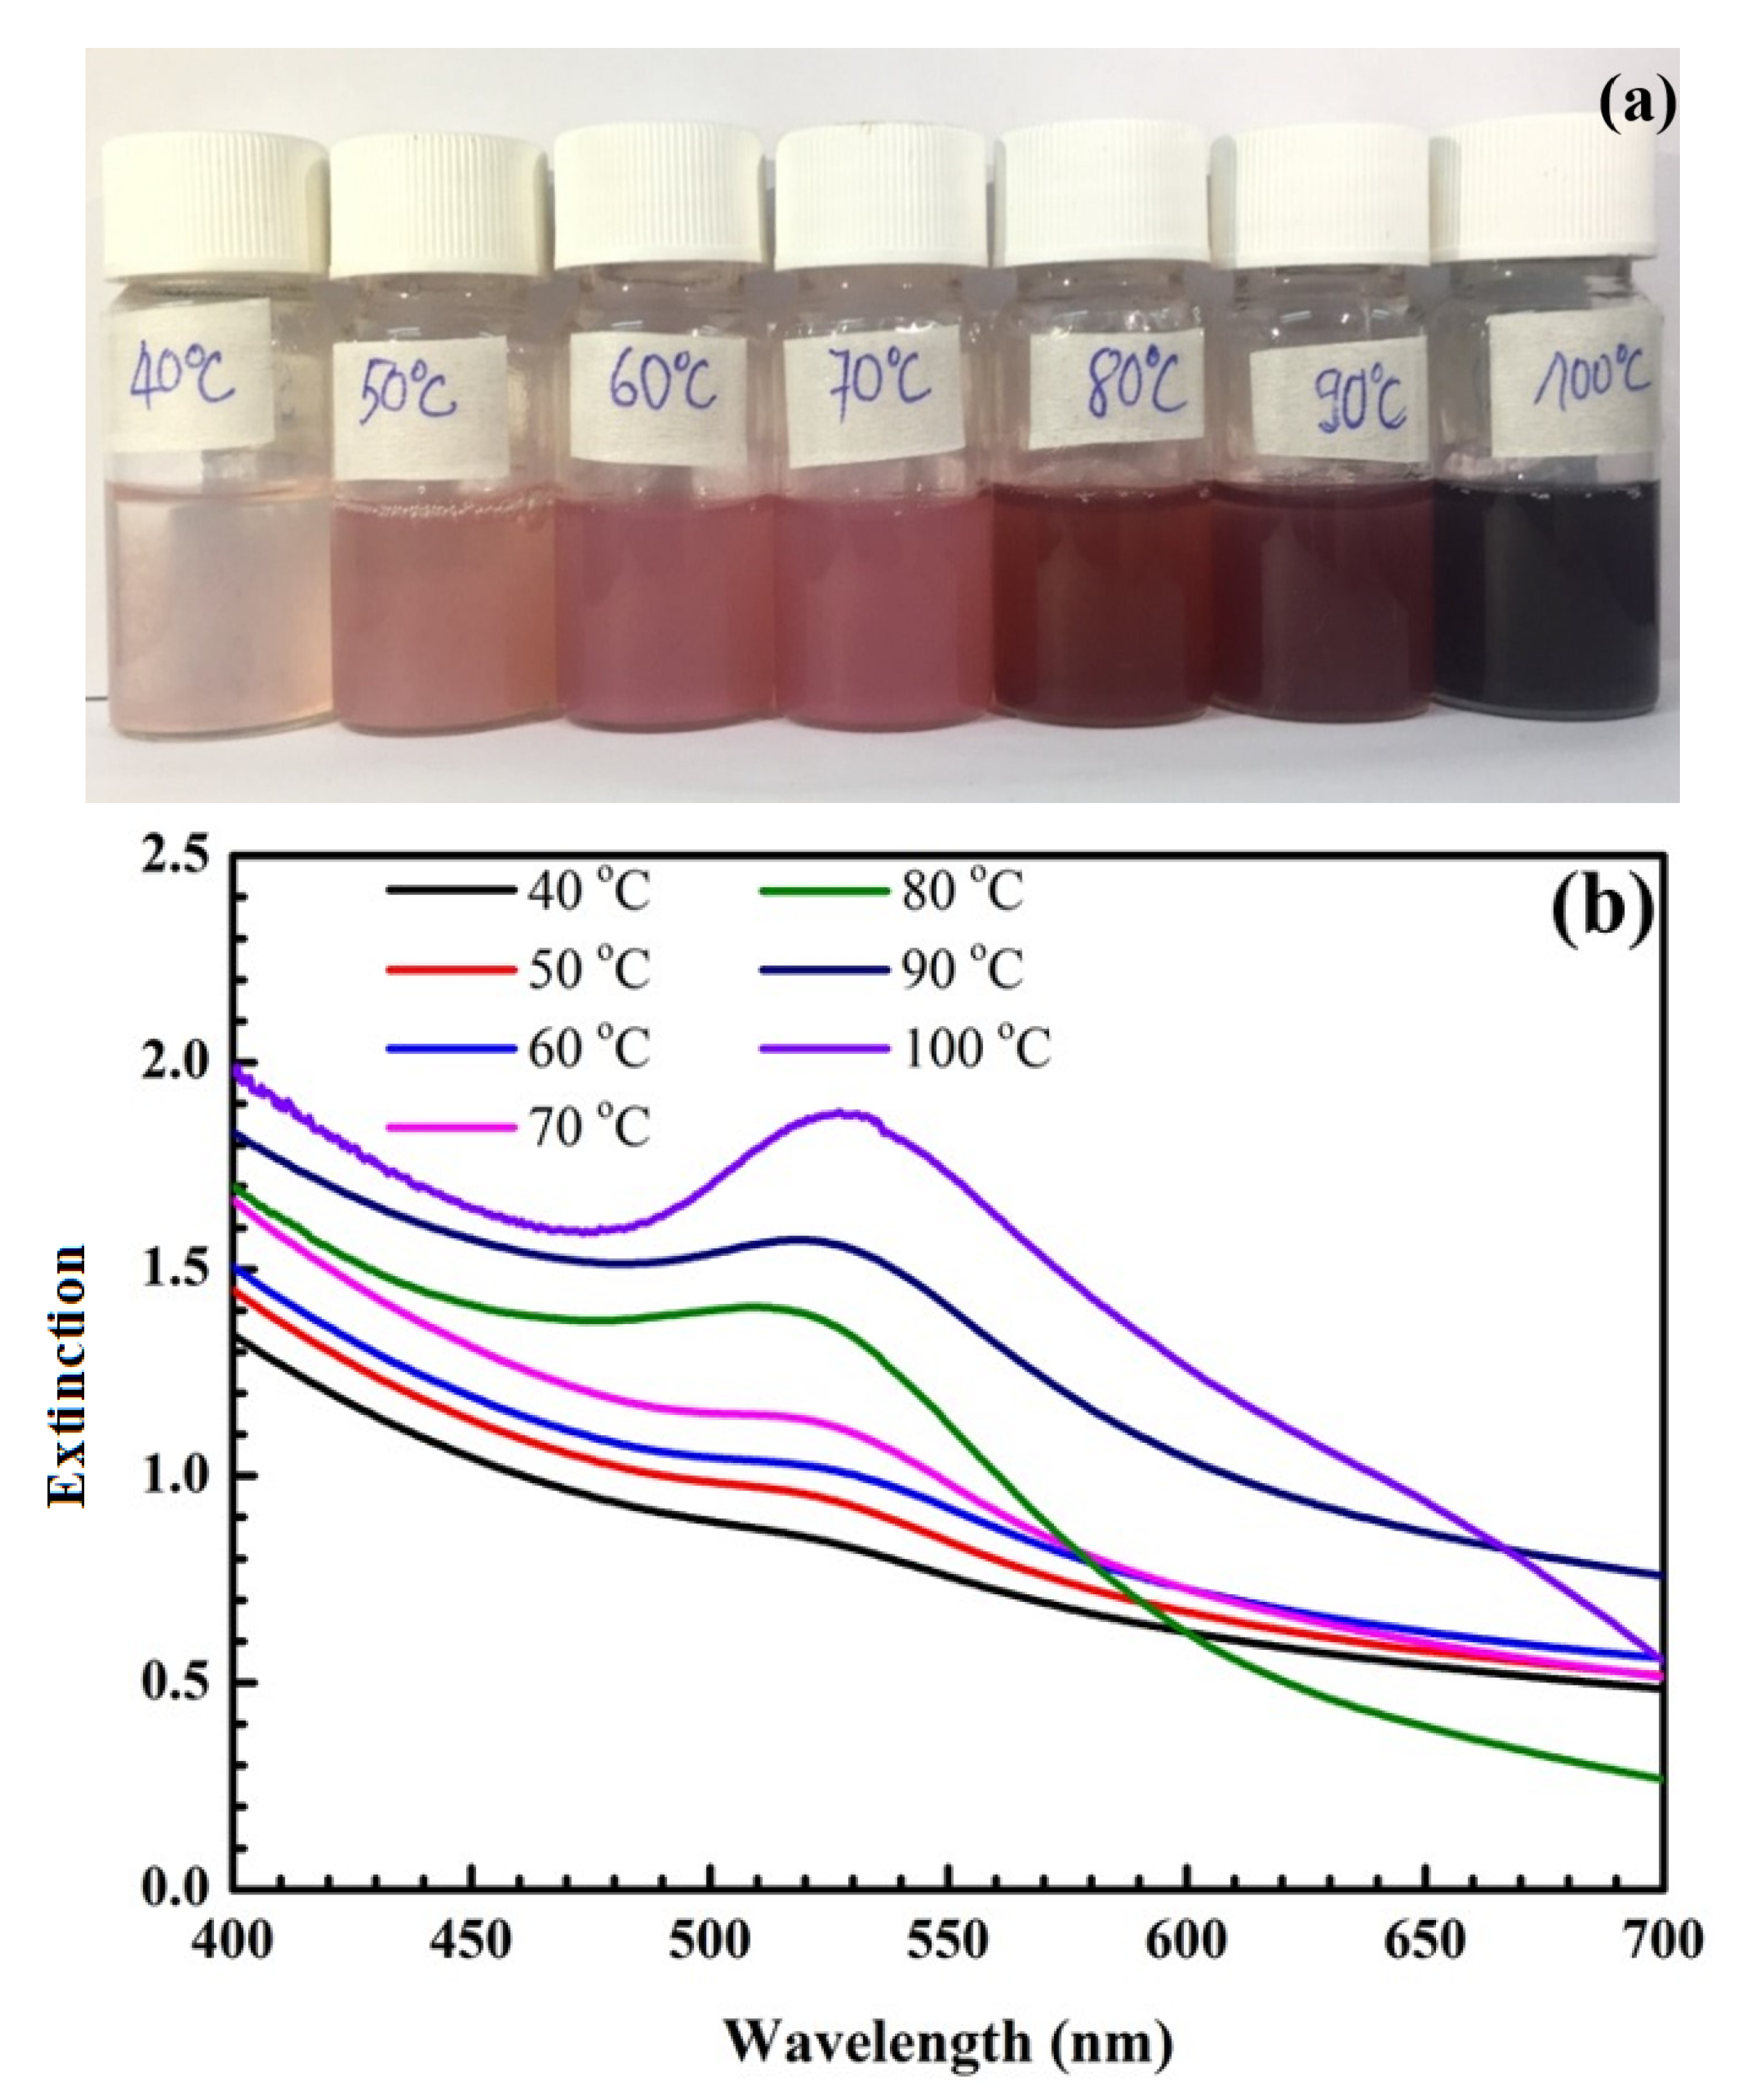
3.1.1. Effect of Temperature

Figure 1 shows pictures of samples at different temperatures and their UV-Vis spectra. As shown in Figure 1a, gold nanoparticles (AuNPs) are formed with a characteristic color range from light pink to dark purple, corresponding to the surface plasmon resonance (SPR) peaks between 520 and 535 nm shown in Figure 1b,c. When the temperature increases from 40 °C to 80 °C, the sample color changes from pale pink to red, and the maximum extinction wavelength (λmax) increases from 520 to 525 nm (Figure 1b). In this study, our goal was to synthesize AuNPs 40 nm in size related to the wavelength of 525 nm, so the chosen optimal temperature was 80 °C.

3.1.2. Effect of Reaction Time

Figure 2 shows the formation of SiO2@Au at different reaction times from 3 to 7 h. Clearly, the color of the synthesized solution changes from light red to dark red, and the maximum extinction wavelength is within the range of 524 nm to 525 nm. Additionally, the intensity of peaks increases from 3 to 6 h and remains stable after 6 h.

3.1.3. Effect of the Ratio of HAuCl4 to Sodium Citrate

The pictures and UV-Vis spectra of SiO2@Au shown in Figure 3 demonstrate that the color of SiO2@Au solution changes from pink to burgundy when the ratio of HAuCl4 to sodium citrate changes 1:104 to 1:15, corresponding to the maximum extinction wavelength within the range of 523–536 nm.

3.1.4. Effect of the Concentration of Sodium Citrate

Sodium citrate was chosen as a reducing agent, so it directly affects the reaction rate and amount of synthesized AuNPs. As shown in Figure 4, when the concentration of sodium citrate is increased, the color of the obtained solution changes from light pink to dark red, and the intensity of the SPR peaks increases.

3.2. Characterizations of Obtained SiO2@Au

Based on the obtained results reported above, the optimal conditions for the synthesis of SiO2@Au are a ratio of HAuCl4 to sodium citrate of 1:21, an initial concentration of sodium citrate of 4.2 mM, and a temperature of 80 °C for 6 h. Characteristics of SiO2@Au are determined using UV-Vis spectra, SEM images, and DLS.
Figure 5 presents pictures of SiO2, SiO2@PEI, AuNPs, and SiO2@Au synthesized under optimal conditions and their UV-Vis spectra. Notably, there is no SPR peak of SiO2 and SiO2@PEI, whereas the maximum extinction wavelengths of AuNPs and SiO2@Au are at 529 nm and 525 nm, respectively.
The morphologies of SiO2, SiO2@PEI, and SiO2@Au are shown in Figure 6. The average size of SiO2, SiO2@PEI, and SiO2@Au particles is 270 nm, 300 nm, and 350 nm, respectively.
According to the DLS results of SiO2 and SiO2@Au shown in Figure 7, the size of SiO2 particles ranges from 260 to 360 nm, and the average size of SiO2 particles is about 316 nm. Similarly, the average size of SiO2@Au particles is approximately 582.4 nm.

3.3. Enhancement of Raman Spectroscopy

Figure 8 shows Raman spectra of methylene blue molecules deposited onto SiO2 and SiO2@Au substrates. The characteristic Raman peaks of MB are recorded at 482 cm1, 550 cm1, 783 cm1, and 1082 cm1 [44]. The intensities of these peaks are significantly enhanced after coating AuNPs onto SiO2 under optimal conditions of synthesis process compared to SiO2 particles.

4. Discussion

Our results demonstrate that optimizing parameters for the fabrication SiO2@Au nanoparticles is critical to enhance the Raman signal. The results obtained under various synthesis conditions are discussed in detail below.
As shown in Figure 1, the SPR peak position of SiO2@Au is red-shifted with a temperature change from 40 to 100 °C. According to Link et al. [45], the SPR peak is red-shifted when the particle diameter is increased. The temperature factor strongly affects the size and shape of synthesized AuNPs and SiO2@Au nanoparticles. Thus, a suitably high temperature should be ensured during the synthesis process to obtain uniform SiO2@Au nanoparticles and enhance the SERS signal.
For temperatures below 80 °C, the maximum extinction wavelength exhibits red shifts from 520 to 525 nm, and the color of SiO2@Au solution changes from pale pink to light red, as shown in Figure 1. These SPR peaks correspond to AuNPs with sized in the range of 10 nm to 40 nm. However, the intensities of the SPR peaks, which depend on the number of AuNPs deposited on the SiO2 surface, are low because the reduction rate of the Au3+ ion in the HAuCl4 solution into the Au atom is slow, and size and number of formed AuNPs are small at these temperatures. The growth of AuNPs and the development of the gold shell on the SiO2 surface take place simultaneously; a the uniform gold shell is not completely formed at these temperatures. This affects the enhancement efficiency of the Raman scattering signal.
Next, we investigated the synthesis process at higher temperatures in the range of 80 °C to 100 °C. At these temperatures, the reaction process is accelerated, and the Au atoms move quickly, increasing the probability of coalescence of AuNPs. As a result, the number and size of AuNPs rapidly increases. This is also proven by the color change of the samples from red to dark purple. The amplitudes of SPR peaks are enhanced significantly at wavelengths of 525 nm (80 °C), 530 nm (90 °C), and 533 nm (100 °C), corresponding to a size range of 40 to 50 nm. The width of the SPR band is narrow at these temperatures, which is the result of the uniform size and density of AuNPs covering the SiO2 surface. Additionally, the reason for the high SPR peaks is that the citrate surface stabilizer around the gold particles is efficient a suitable temperature, avoiding flocculation and forming reasonably sized AuNPs. With suitable temperatures, the surface density of AuNPs deposited on SiO2 spheres is sufficiently dense, which leads to the superposition of electric fields from the close AuNPs and the formation of so-called “hot spots”. This facilitates the enhancement of the Raman signal of synthesized SiO2@Au nanoparticles.
However, the temperature is too high, and the reaction speed is too fast, resulting in flocculation [11]. Therefore the properties of the citrate surface stabilizer are changed, the citrate-anion layer capping the gold particles is not efficient at excessively high temperatures, forming gold clusters, and irregularly large sizes and excessively dense surface densities occur. This causes a reduced efficiency of the enhancement of the Raman signal on the SiO2@Au [45,46]. Based on the above analyses, 80 °C was selected as the optimal temperature, mainly due to the high amplitude of the SPR peak at the wavelength of 525 nm, the narrow width of the SPR band, and the reasonable AuNPs size of 40 nm at this temperature, contributing to the enhancement of the Raman scattering signal. The optimal temperature of 80 °C was used in synthesis preparation of SiO2@Au to investigate the other factors.
The time for SiO2@Au synthesis is one of the significant conditions necessary to enhance the intensity of the SERS signal. Figure 2 presents the extinction spectrum of SiO2@Au versus time. For a synthesis time of 3 h to 4 h, there is a red-shift of SPR peaks in the extinction spectrum. However, the amplitudes of SPR peaks are low, and the characteristic color of the SiO2@Au solution changes to light red, as fewer AuNPs are produced for a short time. For longer reaction times, from 5 h to 6 h, the SPR peaks significantly enhance within the range of 524 to 525 nm, and the color of the samples turns dark red, indicating that with a longer reaction time, more AuNPs are produced, leading to an increase in the SPR peak intensity, as shown in Figure 2c. Moreover, AuNPs have more time to attach to the SiO2 spheres with a longer reaction time, which enables SiO2@Au to be synthesized more efficiently. Nevertheless, when the reaction time is too long, the gold can be oxidized, decreasing the surface free energy of AuNPs. Thus, the Raman signal of the SiO2@Au nanoparticles decreases. In this study, the sizes of AuNPs change in the range of approximately 30–40 nm, and the position of SPR peaks is within the range of 524 to 525 nm for a synthesis time of 3 to 7 h. Because the intensity is unchanged after 6 h, we selected 6 h as the optimal time to reduce the processing time.
Similarly, the ratio of HAuCl4 to sodium citrate plays a critical role in determining the size, number, and size distribution of AuNPs on SiO2 spheres. The SPR peaks of the obtained SiO2@Au nanoparticles occur within the range of 523 nm to 525 nm with a ratio of precursors between 1:104 and 1:21, as shown in Figure 3 and AuNPs in the size range of 20 nm to 40 nm [45,46]. The samples’ color becomes dark purple, and the SPR wavelength is shifted to 536 nm when the ratio of HAuCl4 to sodium citrate is 1:15. This indicates that AuNPs with a molar ratio of precursors of 1:15 is larger than particles with other ratios of precursors [45,46]. Moreover, the width of SPR bands at this ratio is wider than the at other ratios as a result of the non-uniform sizes and surface densities of AuNPs. In this study, the optimal ratio of HAuCl4 to sodium citrate was selected as 1:21, which is consistent with the size of AuNPs of 40 nm and an SPR peak position of 525 nm.
The sodium citrate concentration influences the formation of AuNPs on SiO2 spheres. The reaction of HAuCl4 and sodium citrate is presented in Equation (1). According to this equation, the reaction rate depends on both the concentration of HAuCl4 and Na3C6H5O7. HereinNa3C6H5O7 plays not only the role of a reducing agent but also that of a stabilizer [47]. According to Le Chatelier’s principle, the number of AuNPs will increase when the concentration of HAuCl4 is increased. However, flocculation also occurs if the amount of stabilizer is not sufficient for the synthesis process. Therefore, the concentration of experimental sodium citrate is higher than the concentration of reacted sodium citrate, i.e., about 50% [47].
2HAuCl4 + 3Na3C6H5O7 → 2Au + 3Na2C5H4O5 + 3CO2 + 3NaCl + 5HCl
The SPR peak positions are red-shifted, and their amplitudes are enhanced at high sodium citrate concentrations, accompanied by a noticeable color change in samples, as shown in Figure 4. For the low sodium citrate concentrations of 0.21, 0.42, and 0.84 mM, the intensities of SPR peaks are low, and the color of synthesized solutions changes to pink. This shows that the amounts and size of formed AuNPs are small. The size and number of AuNPs increase with concentrations from 1.5 to 4.2 mM, resulting in AuNPs being deposited on the SiO2 surface faster [48]. SPR peaks occur within the range of 523–525 nm, and the samples’ color becomes dark red, consistent AuNPs sizes in the range of 20 to 40 nm [45,46]. A higher sodium citrate concentration facilitates the reduction and subsequent capping of surface-stabilizing agents on AuNPs. Hence, the shape and size of the synthesized SiO2@Au nanoparticles are more well-defined and uniform. For the SiO2@Au synthesis, a concentration of 4.2 mM is selected because it results in a high SPR peak intensity at the wavelength of 525 nm, a narrow width of the SPR band, and AuNPs with a size of approximately 40nm. Significant enhancement of the Raman scattering signal can take place at this optimal concentration.
According to the DLS results and SEM images, the size of SiO2 particles is smaller than that of SiO2@AuNPs. However, the size determined using the DLS method is larger than that determined with SEM images because the diameter in this method is a hydrated diameter, which differs from SEM images.
A comparison the UV-Vis spectra of SiO2, SiO2@PEI, AuNPs, and SiO2@Au synthesized under optimal conditions shows that a blue shift occurs when AuNPs are coated on the surface of SiO2 spheres, confirming that surface plasmon resonance occurs on SiO2@Au nanomaterial. AuNP coating on SiO2 material can improve and enhance SPR intensity. This finding is consistent with Ref. [49]. In particular, the enhancement of the Raman signal to one typical for SiO2 coating gold nanoparticles, compared to SiO2 particles, demonstrates the potential applications of SiO2@Au, such as environment and food analysis and biomedicine.

5. Conclusions

In summary, SiO2@Au was successfully synthesized by a chemical reduction reaction method under optimal conditions of factors affecting the synthesis process, including a ratio of HAuCl4 to sodium citrate of 1:21 and an initial concentration of sodium citrate of 4.2 mM at 80 °C for 6h. The obtained SiO2@Au particles presented a core shell, in which SiO2 particles were coated by AuNPs (approximately 40 nm in size). The initial result shows that an SiO2@Au substrate can significantly enhance the Raman intensities compared to an SiO2 substrate that is not coated with gold nanoparticles. An analysis of SiO2@Au nanoparticles by Raman spectroscopy demonstrated that the enhancement of the surface Raman signal achieved maximum values at 482 cm−1, 550 cm−1, 783 cm−1, and 1082 cm−1. This method can be considered a prospective solution for the development of Raman spectroscopy for efficient applications in sensors and catalysis.

Author Contributions

Conceptualization, N.T.P.T., L.T.-T. and J.N.; methodology, N.T.P.T.; investigation, N.T.P.T.; writing—original draft preparation, N.T.P.T.; writing—review and editing, N.T.P.T. and J.N.; visualization, C.-T.D.; supervision, J.N.; project administration, J.N.; funding acquisition, J.N. All authors have read and agreed to the published version of the manuscript.

Funding

This research work was partially supported by the Ministry of Education of the Czech Republic (Project No. SP2022/18 and No. SP2022/34).

Data Availability Statement

Not applicable.

Conflicts of Interest

The authors declare no conflict of interest.

References

  1. Guerrini, L.; Lopez-Tobar, E.; Garcia-Ramos, J.V.; Domingo, C.; Sanchez-Cortes, S. New insights on the Aucore/Ptshellnanoparticle structure in the sub-monolayer range: SERS as a surface analyzing tool. Chem. Commun. 2011, 47, 3174–3176. [Google Scholar] [CrossRef] [PubMed]
  2. Das, G.M.; Managò, S.; Mangini, M.; De Luca, A.C. Biosensing Using SERS Active Gold Nanostructures. Nanomaterials 2021, 11, 2679. [Google Scholar] [CrossRef] [PubMed]
  3. Burgmeier, J.; Feizpour, A.; Schade, W.; Reinhard, B.M. Plasmonic nanoshell functionalized etched fiber Bragg gratings for highly sensitive refractive index measurements. Opt. Lett. 2015, 40, 546–549. [Google Scholar] [CrossRef] [PubMed]
  4. Peeters, H.; Keulemans, M.; Nuyts, G.; Vanmeert, F.; Li, C.; Minjauw, M.; Detavernier, C.; Bals, S.; Lenaerts, S.; Verbruggen, S.W. Plasmonic gold-embedded TiO2 thin films as photocatalytic self-cleaning coatings. Appl. Catal. B Environ. 2020, 267, 118654. [Google Scholar] [CrossRef]
  5. Kang, H.; Buchman, J.T.; Rodriguez, R.S.; Ring, H.L.; He, J.; Bantz, K.C.; Haynes, C.L. Stabilization of Silver and Gold Nanoparticles: Preservation and Improvement of Plasmonic Functionalities. Chem. Rev. 2019, 119, 664–699. [Google Scholar] [CrossRef]
  6. El-Brolossy, T.A.; Abdallah, T.; Mohamed, M.B.; Abdallah, S.; Easawi, K.; Negm, S.; Talaat, H. Shape and size dependence of the surface plasmon resonance of gold nanoparticles studied by Photoacoustic technique. Eur. Phys. J. Spec. Top. 2008, 153, 361–364. [Google Scholar] [CrossRef]
  7. Davis, R.M.; Campbell, J.L.; Burkitt, S.; Qiu, Z.; Kang, S.; Mehraein, M.; Miyasato, D.; Salinas, H.; Liu, J.T.C.; Zavaleta, C. A Raman Imaging Approach Using CD47 Antibody-Labeled SERS Nanoparticles for Identifying Breast Cancer and Its Potential to Guide Surgical Resection. Nanomaterials 2018, 8, 953. [Google Scholar] [CrossRef]
  8. Wu, J.; Wang, P.; Wang, F.; Fang, Y. Investigation of the Microstructures of Graphene Quantum Dots (GQDs) by Surface-Enhanced Raman Spectroscopy. Nanomaterials 2018, 8, 864. [Google Scholar] [CrossRef]
  9. Le Ru, E.; Etchegoin, P. Principles of Surface-Enhanced Raman Spectroscopy: And related Plasmonic Effects; Elsevier: Amsterdam, The Netherlands, 2008. [Google Scholar]
  10. Hirsch, L.R.; Jackson, J.B.; Lee, A.; Halas, N.J.; West, J.L. A Whole Blood Immunoassay Using Gold Nanoshells. Anal. Chem. 2003, 75, 2377–2381. [Google Scholar] [CrossRef]
  11. Loo, C.; Lowery, A.; Halas, N.; West, J.; Drezek, R. Immunotargeted Nanoshells for Integrated Cancer Imaging and Therapy. Nano Lett. 2005, 5, 709–711. [Google Scholar] [CrossRef]
  12. Haran, G. Single-Molecule Raman Spectroscopy: A Probe of Surface Dynamics and Plasmonic Fields. Acc. Chem. Res. 2010, 43, 1135–1143. [Google Scholar] [CrossRef] [PubMed]
  13. Li, D.-W.; Zhai, W.-L.; Li, Y.-T.; Long, Y.-T. Recent progress in surface enhanced Raman spectroscopy for the detection of environmental pollutants. Microchim. Acta 2014, 181, 23–43. [Google Scholar] [CrossRef]
  14. Thatai, S.; Khurana, P.; Prasad, S.; Kumar, D. Plasmonic detection of Cd2+ ions using surface-enhanced Raman scattering active core–shell nanocomposite. Talanta 2015, 134, 568–575. [Google Scholar] [CrossRef] [PubMed]
  15. Darfarin, G.; Salehi, R.; Alizadeh, E.; Nasiri Motlagh, B.; Akbarzadeh, A.; Farajollahi, A. The effect of SiO2/Au core–shell nanoparticles on breast cancer cell’s radiotherapy. Artif. Cells Nanomed. Biotechnol. 2018, 46 (Suppl. 2), 836–846. [Google Scholar] [CrossRef] [PubMed]
  16. Cheng, C.; Li, J.; Lei, H.; Li, B. Surface enhanced Raman scattering of gold nanoparticles aggregated by a gold-nanofilm-coated nanofiber. Photon. Res. 2018, 6, 357–362. [Google Scholar] [CrossRef]
  17. Martínez Porcel, J.E.; Rivas Aiello, M.B.; Arce, V.B.; Di Silvio, D.; Moya, S.E.; Mártire, D.O. Effect of hybrid SiO2@Ag nanoparticles with raspberry-like morphology on the excited states of the photosensitizers Rose Bengal and riboflavin. New J. Chem. 2019, 43, 9123–9133. [Google Scholar] [CrossRef]
  18. Assis, M.; Simoes, L.G.P.; Tremiliosi, G.C.; Coelho, D.; Minozzi, D.T.; Santos, R.I.; Vilela, D.C.B.; Santos, J.R.D.; Ribeiro, L.K.; Rosa, I.L.V.; et al. SiO2-Ag Composite as a Highly Virucidal Material: A Roadmap that Rapidly Eliminates SARS-CoV-2. Nanomaterials 2021, 11, 638. [Google Scholar] [CrossRef]
  19. Yao, Q.; Lu, Z.-H.; Zhang, Z.; Chen, X.; Lan, Y. One-pot synthesis of core-shell Cu@SiO2 nanospheres and their catalysis for hydrolytic dehydrogenation of ammonia borane and hydrazine borane. Sci. Rep. 2014, 4, 7597. [Google Scholar] [CrossRef]
  20. Crane, C.C.; Wang, F.; Li, J.; Tao, J.; Zhu, Y.; Chen, J. Synthesis of Copper–Silica Core–Shell Nanostructures with Sharp and Stable Localized Surface Plasmon Resonance. J. Phys. Chem. C 2017, 121, 5684–5692. [Google Scholar] [CrossRef]
  21. Kado, S.; Yokomine, S.; Kimura, K. Widely Tunable Plasmon Resonances from Visible to Near-Infrared of Hollow Silver Nanoshells. Bull. Chem. Soc. Jpn. 2017, 90, 537–545. [Google Scholar] [CrossRef]
  22. Shabaninezhad, M.; Ramakrishna, G. Theoretical investigation of size, shape, and aspect ratio effect on the LSPR sensitivity of hollow-gold nanoshells. J. Chem. Phys. 2019, 150, 144116. [Google Scholar] [CrossRef]
  23. Jackson, J.B.; Westcott, S.L.; Hirsch, L.R.; West, J.L.; Halas, N.J. Controlling the surface enhanced Raman effect via the nanoshell geometry. Appl. Phys. Lett. 2003, 82, 257–259. [Google Scholar] [CrossRef]
  24. Madamsetty, V.S.; Mukherjee, A.; Mukherjee, S. Recent Trends of the Bio-Inspired Nanoparticles in Cancer Theranostics. Front. Pharmacol. 2019, 10, 1264. [Google Scholar] [CrossRef]
  25. Cholkar, K.; Hirani, N.D.; Natarajan, C. Nanotechnology-based medical and biomedical imaging for diagnostics. In Emerging Nanotechnologies for Diagnostics, Drug Delivery and medical Devices; Elsevier: Amsterdam, The Netherlands, 2017; pp. 355–374. [Google Scholar]
  26. Lu, L.; Randjelovic, I.; Capek, R.; Gaponik, N.; Yang, J.; Zhang, H.; Eychmüller, A. Controlled Fabrication of Gold-Coated 3D Ordered Colloidal Crystal Films and Their Application in Surface-Enhanced Raman Spectroscopy. Chem. Mater. 2005, 17, 5731–5736. [Google Scholar] [CrossRef]
  27. Pham, T.; Jackson, J.B.; Halas, N.J.; Lee, T.R. Preparation and Characterization of Gold Nanoshells Coated with Self-Assembled Monolayers. Langmuir 2002, 18, 4915–4920. [Google Scholar] [CrossRef]
  28. Li, C.-L.; Chen, J.-K.; Fan, S.-K.; Ko, F.-H.; Chang, F.-C. Electrorheological Operation of Low-/High-Permittivity Core/Shell SiO2/Au Nanoparticle Microspheres for Display Media. ACS Appl. Mater. Interfaces 2012, 4, 5650–5661. [Google Scholar] [CrossRef]
  29. Lu, Y.; Yao, G.; Sun, K.; Huang, Q. β-Cyclodextrin coated SiO2@Au@Ag core–shell nanoparticles for SERS detection of PCBs. Phys. Chem. Chem. Phys. 2015, 17, 21149–21157. [Google Scholar] [CrossRef] [PubMed]
  30. Montaño-Priede, J.L.; Coelho, J.P.; Guerrero-Martínez, A.; Peña-Rodríguez, O.; Pal, U. Fabrication of Monodispersed Au@SiO2 Nanoparticles with Highly Stable Silica Layers by Ultrasound-Assisted Stöber Method. J. Phys. Chem. C 2017, 121, 9543–9551. [Google Scholar] [CrossRef]
  31. Saravanan, S.; Dubey, R. Synthesis of SiO2 nanoparticles by sol-gel method and their optical and structural properties. Rom. J. Inf. Sci. Technol. 2020, 23, 105–112. [Google Scholar]
  32. English, M.D.; Waclawik, E.R. A novel method for the synthesis of monodisperse gold-coated silica nanoparticles. J. Nanopart. Res. 2012, 14, 650. [Google Scholar] [CrossRef]
  33. Zhang, S.; Xu, X.; Zhang, G.; Liu, B.; Yang, J. One-pot one-step synthesis of Au@SiO2 core–shell nanoparticles and their shell-thickness-dependent fluorescent properties. RSC Adv. 2019, 9, 17674–17678. [Google Scholar] [CrossRef] [PubMed] [Green Version]
  34. Dobrowolska, P.; Krajewska, A.; Gajda-Rączka, M.; Bartosewicz, B.; Nyga, P.; Jankiewicz, B.J. Application of Turkevich Method for Gold Nanoparticles Synthesis to Fabrication of SiO2@Au and TiO2@Au Core-Shell Nanostructures. Materials 2015, 8, 2849–2862. [Google Scholar] [CrossRef]
  35. Costa Puerari, R.; Gonçalves, R.A.; Mottim Justino, N.; Schulz Vicentini, D.; Gerson Matias, W. The influence of amine-functionalized SiO2 nanostructures upon nanofiltration membranes. Environ. Nanotechnol. Monit. Manag. 2020, 13, 100287. [Google Scholar] [CrossRef]
  36. Xue, J.; Wang, C.; Ma, Z. A facile method to prepare a series of SiO2@Au core/shell structured nanoparticles. Mater. Chem. Phys. 2007, 105, 419–425. [Google Scholar] [CrossRef]
  37. Wang, R.; Ji, X.; Huang, Z.; Xue, Y.; Wang, D.; Yang, W. Citrate-Regulated Surface Morphology of SiO2@Au Particles To Control the Surface Plasmonic Properties. J. Phys. Chem. C 2016, 120, 377–385. [Google Scholar]
  38. Averitt, R.D.; Sarkar, D.; Halas, N.J. Plasmon Resonance Shifts of Au-Coated Au2S Nanoshells: Insight into Multicomponent Nanoparticle Growth. Phys. Rev. Lett. 1997, 78, 4217–4220. [Google Scholar] [CrossRef]
  39. Yukhymchuk, V.; Hreshchuk, O.; Valakh, M.Y.; Skoryk, M.; Efanov, V.; Matveevskaya, N. Efficient core-SiO2/shell-Au nanostructures for surface enhanced Raman scattering. Semicond. Phys. Quantum Electron. 2014, 13, 217–221. [Google Scholar] [CrossRef]
  40. Kandpal, D.; Kalele, S.; Kulkarni, S.K. Synthesis and characterization of silica-gold core-shell (SiO2@Au) nanoparticles. Pramana 2007, 69, 277–283. [Google Scholar] [CrossRef]
  41. Saini, A.; Maurer, T.; Lorenzo, I.I.; Santos, A.R.; Béal, J.; Goffard, J.; Gérard, D.; Vial, A.; Plain, J. Synthesis and SERS Application of SiO2@Au Nanoparticles. Plasmonics 2015, 10, 791–796. [Google Scholar] [CrossRef]
  42. Wang, K.; Wang, Y.; Wang, C.; Jia, X.; Li, J.; Xiao, R.; Wang, S. Facile synthesis of high-performance SiO2@Au core–shell nanoparticles with high SERS activity. RSC Adv. 2018, 8, 30825–30831. [Google Scholar] [CrossRef]
  43. Khurana, P.; Thatai, S.; Boken, J.; Prasad, S.; Kumar, D. Development of promising surface enhanced Raman scattering substrate: Freckled SiO2@Au nanocomposites. Microchem. J. 2015, 122, 45–49. [Google Scholar] [CrossRef]
  44. Tu, K.T.; Chung, C.K. Enhancement of Surface Raman Spectroscopy Performance by Silver Nanoparticles on Resin Nanorods Arrays from Anodic Aluminum Oxide Template. Electrochem. Soc. 2017, 164, B3081–B3086. [Google Scholar] [CrossRef]
  45. Link, S.; El-Sayed, M.A. Size and Temperature Dependence of the Plasmon Absorption of Colloidal Gold Nanoparticles. J. Phys. Chem. B 1999, 103, 4212–4217. [Google Scholar] [CrossRef]
  46. Cytodiagnostic, Introduction to Gold Nanoparticle Characterization. Cytodiagnostic.com 2011, Ultraviolet-Visible (UV-Vis) Spectroscopy. Available online: https://www.cytodiagnostics.com/pages/introduction-to-gold-nanoparticle-characterization (accessed on 20 April 2022).
  47. Szunerits, S.; Spadavecchia, J.; Boukherroub, R. Surface plasmon resonance: Signal amplification using colloidal gold nanoparticles for enhanced sensitivity. Rev. Anal. Chem. 2014, 33, 153–164. [Google Scholar] [CrossRef]
  48. Li, C.; Li, D.; Wan, G.; Xu, J.; Hou, W. Facile synthesis of concentrated gold nanoparticles with low size-distribution in water: Temperature and pH controls. Nanoscale Res. Lett. 2011, 6, 440. [Google Scholar] [CrossRef]
  49. Song, Z.; Shi, J.; Zhang, Z.; Qi, Z.; Han, S.; Cao, S. Mesoporous silica-coated gold nanorods with a thermally responsive polymeric cap for near-infrared-activated drug delivery. J. Mater. Sci. 2018, 53, 7165–7179. [Google Scholar] [CrossRef]
Scheme 1. Process of preparing SiO2@Au material.
Nanomaterials 12 03080 sch001
Figure 1. Pictures of samples at different temperatures (a). UV-Vis spectra of samples at different temperatures (b) and their UV-Vis baseline spectra (c).
Nanomaterials 12 03080 g001aNanomaterials 12 03080 g001b
Figure 2. Pictures of samples at different reaction times (a). UV-Vis spectra of samples at different reaction times (b) and their UV-Vis baseline spectra (c).
Nanomaterials 12 03080 g002aNanomaterials 12 03080 g002b
Figure 3. Pictures of samples at different ratios of HAuCl4 to sodium citrate (a). UV-Vis spectra of samples at different ratios of HAuCl4 to sodium citrate (b) and their UV-Vis baseline spectra (c).
Nanomaterials 12 03080 g003aNanomaterials 12 03080 g003b
Figure 4. Pictures of samples at different concentrations of sodium citrate (a). UV-Vis spectra of samples at different concentrations of sodium citrate (b) and their UV-Vis baseline spectra (c). N1: 0.21 mM; N2: 0.42 mM; N3: 0.84 mM; N4: 1.5 mM; N5: 4.2 mM.
Nanomaterials 12 03080 g004
Figure 5. Pictures of SiO2, SiO2@PEI, AuNPs, and SiO2@Au synthesized under optimal conditions (a). UV-Vis spectra of SiO2, SiO2@PEI, AuNPs, and SiO2@Au synthesized under optimal conditions (b) and their UV-Vis baseline spectra (c).
Nanomaterials 12 03080 g005
Figure 6. SEM images of SiO2 (a), SiO2@PEI (b), and SiO2@Au (c).
Nanomaterials 12 03080 g006aNanomaterials 12 03080 g006b
Figure 7. Dynamic Light Scattering results of SiO2 (a) and SiO2@Au (b).
Nanomaterials 12 03080 g007
Figure 8. Raman spectra of methylene blue solution deposited on SiO2 and SiO2@Au.
Nanomaterials 12 03080 g008
Table 1. A review of the methods and related conditions for the fabrication of SiO2@Au.
MethodReducing AgentsFunctionalization AgentsReducing Reaction
Temperature
Reducing
Reaction
Time
Ratio of
Precures
Concentration
of Reducing Agent
Ref
Electroless platingNH2O. HClAPTMS-14 min-0.4 mM[26]
Self-assemblyCH2OAPTMS---0.36 mM[27]
Layer by layerNaBH4MPTMS-6 h--[28]
Seed-mediated growth CH2OAPTES-10 min--[29]
Ultrasound-assisted Stober methodNaBH4-20 °C2 h-10 mM[30]
Direct growth
of gold shell
Ascorbic acid----3 mM[32]
Direct growth
of gold shell
2-methylaminoethanol-80 °C.30 min--[33]
Seed-mediated growthNH2OH·HClAPTES--8:1
(Na3Cit/HAuCl4)
40 mM[37]
Seed-mediated growthNH2OH·HCl + NaBH4APES----[39]
Seed-mediated growthNa3(C6H5O7) + NaBH4APS-60 min0.002 M:0.01 M
(HAuCl4/
NaBH4)
0.01 M[40]
Seed-mediated growth with
grafting, priming
technique
NaBH4APTMS-12 h-5.3 mM[41]
Ultrasound-assisted seed growth NH2O. HClPEI-5 min--[42]
Seed-mediated growth for synthesis of freckled SiO2@Au NCsNaBH4MPTMS-10 min8:1
(K-gold/SiO2)
5.3 mM[43]
Publisher’s Note: MDPI stays neutral with regard to jurisdictional claims in published maps and institutional affiliations.

