
Structural Optimization of Vertically-Stacked White LEDs with a Yellow Phosphor Plate and a Red Quantum-Dot Film


Abstract
:1. Introduction
2. Materials and Methods
3. Results and Discussion
4. Conclusions
Supplementary Materials
Author Contributions
Funding
Institutional Review Board Statement
Informed Consent Statement
Data Availability Statement
Conflicts of Interest
References
- Schubert, E.F.; Kim, J.K.; Luo, H.; Xi, J.-Q. Solid-state lighting—A benevolent technology. Rep. Prog. Phys. 2006, 69, 3069. [Google Scholar] [CrossRef]
- McKittrick, J.; Shea-Rohwer, L.E. Down conversion materials for solid-state lighting. J. Am. Ceram. Soc. 2014, 97, 1327. [Google Scholar] [CrossRef]
- Choi, H.-W.; Choi, M.H.; Ko, J.-H. Effect of temperature on the luminous properties of white-light-emitting diodes with red and green phosphors. New Phys. Sae Mulli 2013, 63, 1149. [Google Scholar] [CrossRef]
- Erdem, T.; Demir, H.V. Color science of nanocrystal quantum dots for lighting and displays. Nanophotonics 2013, 2, 57. [Google Scholar] [CrossRef]
- Denault, K.A.; Mikhailovsky, A.A.; Brinkley, S.; DenBaars, S.P.; Seshadri, R. Improving color rendition in solid state white lighting through the use of quantum dots. J. Mater. Chem. C 2013, 1, 1461. [Google Scholar] [CrossRef]
- Chung, S.-R.; Chen, S.-S.; Wang, K.-W.; Siao, C.-B. Promotion of solid-state lighting for ZnCdSe quantum dot modified-YAG-based white light-emitting diodes. RSC Adv. 2016, 6, 51989. [Google Scholar] [CrossRef]
- Bae, W.K.; Lim, J.; Lee, D.; Park, M.; Lee, H.; Kwak, J.; Char, K.; Lee, C.; Lee, S. R/G/B/natural white light thin colloidal quantum dot-based light-emitting devices. Adv. Mater. 2014, 26, 6387. [Google Scholar] [CrossRef]
- Lim, S.J.; Zahid, M.U.; Le, P.; Ma, L.; Entenberg, D.; Harney, A.S.; Condeelis, J.; Smith, A.M. Brightness-equalized quantum dots. Nat. Commun. 2015, 6, 8210. [Google Scholar] [CrossRef]
- Lim, J.; Park, Y.S.; Wu, K.; Yun, H.J.; Klimov, V.I. Droop-free colloidal quantum dot light-emitting diodes. Nano Lett. 2018, 18, 6645. [Google Scholar] [CrossRef]
- Bera, D.; Qian, L.; Tseng, T.-K.; Holloway, P.H. Quantum dots and their multimodal applications: A review. Materials 2010, 3, 2260. [Google Scholar] [CrossRef]
- Demir, H.V.; Nizamoglu, S.; Erdem, T.; Mutlugunand, E.; Gaponik, N.; Eychmüller, A. Quantum dot integrated LEDs using photonic and excitonic color conversion. Nano Today 2011, 6, 632. [Google Scholar] [CrossRef]
- Anc, M.J.; Pickett, N.L.; Gresty, N.C.; Harris, J.A.; Mishra, K.C. Progress in non-Cd quantum dot development for lighting applications. ECS J. Solid State Sci. Technol. 2012, 2, R3071. [Google Scholar] [CrossRef]
- Luo, Z.; Chen, Y.; Wu, S.-T. Wide color gamut LCD with a quantum dot backlight. Opt. Express 2013, 21, 26269. [Google Scholar] [CrossRef] [PubMed]
- Jang, E.; Jun, S.; Jang, H.; Lim, J.; Kim, B.; Kim, Y. White-light-emitting diodes with quantum dot color converters for display backlights. Adv. Mater. 2010, 22, 3076. [Google Scholar] [CrossRef]
- Abe, S.; Joos, J.J.; Martin, L.I.D.J.; Hens, Z.; Smet, P.F. Hybrid remote quantum dot/powder phosphor designs for display backlights. Light Sci. Appl. 2017, 6, e16271. [Google Scholar] [CrossRef]
- Kim, S.J.; Jang, H.W.; Lee, J.-G.; Ko, J.-H.; Ko, Y.W.; Kim, Y. Study on improvements in the emission properties of quantum-dot film-based backlights. New Phys. Sae Mulli. 2019, 69, 861. [Google Scholar] [CrossRef]
- Zachau, M.; Becker, D.; Berben, D.; Fiedler, T.; Jermann, F.; Zwaschka, F. Phosphors for solid state lighting. Proc. SPIE 2008, 6910, 691010. [Google Scholar]
- Lin, C.C.; Liu, R.-S. Advances in Phosphors for Light-emitting Diodes. J. Phys. Chem. Lett. 2011, 2, 1268. [Google Scholar] [CrossRef]
- Luo, H.; Kim, J.K.; Schubert, E.F.; Cho, J.; Sone, C.; Park, Y. Analysis of high-power packages for phosphor-based white-light-emitting diodes. Appl. Phys. Lett. 2005, 86, 243505. [Google Scholar] [CrossRef]
- Allen, S.C.; Steckl, J. ELiXIR—Solid-State Luminaire With Enhanced Light Extraction by Internal Reflection. J. Disp. Tech. 2007, 3, 155. [Google Scholar] [CrossRef]
- Park, S.-C.; Rhee, I.; Kim, J.-Y.; Bark, H.J.; Jeong, J. Luminous efficiency of open remote phosphor-converted white-light-emitting diodes. J. Korean Phys. Soc. 2012, 60, 1191. [Google Scholar] [CrossRef]
- Lin, M.T.; Ying, S.P.; Lin, M.Y.; Tai, K.Y.; Tai, S.C.; Liu, C.H.; Chen, J.C.; Sun, C.C. Design of the Ring Remote Phosphor Structure for Phosphor-Converted White-Light-Emitting Diodes. Jpn. J. Appl. Phys. 2010, 49, 072101. [Google Scholar] [CrossRef]
- Hoelen, C.; Borel, H.; de Graaf, J.; Keuper, M.; Lankhorst, M.; Mutter, C.; Waumans, L.; Wegh, R. Remote phosphor LED modules for general illumination: Toward 200 lm/W general lighting LED light sources. Proc. SPIE 2008, 7058, 70580M. [Google Scholar]
- Kuo, H.-C.; Hung, C.-W.; Chen, H.-C.; Chen, J.-J.; Wang, C.-H.; Sher, C.-W.; Yeh, C.-C.; Lin, C.-C.; Chen, C.-H.; Cheng, Y.-J. Patterned structure of REMOTE PHOSPHOR for phosphor-converted white LEDs. Opt. Express 2011, 19, A930. [Google Scholar] [CrossRef] [PubMed]
- Choi, M.-H.; Lee, H.J.; Ko, J.-H.; Kim, D.H.; Kim, H.S.; Kim, Y.D. Improvement of Electro-Optic Characteristics of White Light-Emitting Diodes by Using Transparent Ceramic-Based Remote Phosphors. Sci. Adv. Mater. 2016, 8, 342. [Google Scholar] [CrossRef]
- Lien, J.-Y.; Chen, C.-J.; Chiang, R.-K.; Wang, S.-L. High color-rendering warm-white lamps using quantum-dot color conversion films. Opt. Express 2016, 24, A1021. [Google Scholar] [CrossRef]
- Kim, J.-H.; Jo, D.-Y.; Lee, K.-H.; Jang, E.-P.; Han, C.-Y.; Jo, J.-H.; Yang, H. White electroluminescent lighting device based on a single quantum dot emitter. Adv. Mater. 2016, 28, 5093. [Google Scholar] [CrossRef]
- Yoon, H.C.; Oh, J.H.; Lee, S.; Park, J.B.; Do, Y.R. Circadian-tunable perovskite quantum dot-based down-converted multi-package white LED with a color fidelity index over 90. Sci. Rep. 2017, 7, 2808. [Google Scholar] [CrossRef]
- Kim, J.-H.; Kim, B.-Y.; Jang, E.-P.; Han, C.-Y.; Jo, J.-H.; Do, Y.R.; Yang, H. A near-ideal color rendering white solid-state lighting device copackaged with two color-separated Cu-X-S (X = Ga, In) quantum dot emitters. J. Mater. Chem. C 2017, 5, 6755. [Google Scholar] [CrossRef]
- Zhang, H.; Su, Q.; Chen, S. Quantum-dot and organic hybrid tandem light-emitting diodes with multi-functionality of full-color-tunability and white-light-emission. Nat. Commun. 2020, 11, 2826. [Google Scholar] [CrossRef] [PubMed]
- Rhee, S.; Kim, K.; Roh, J.; Kwak, J. Recent progress in high-luminance quantum dot light-emitting diodes. Curr. Opt. Photon. 2020, 4, 161. [Google Scholar]
- Li, B.; Lu, M.; Feng, J.; Zhang, J.; Smowton, P.M.; Sohn, J.I.; Park, I.-K.; Zhong, H.; Hou, B. Colloidal quantum dot hybrids: An emerging class of materials for ambient lighting. J. Mater. Chem. C 2020, 8, 10676. [Google Scholar] [CrossRef]
- Hong, A.; Kim, J.; Kwak, J. Sunlike white quantum dot light-emitting diodes with high color rendition quality. Adv. Opt. Mater. 2020, 8, 2001051. [Google Scholar] [CrossRef]
- Lee, J.; Sundar, V.C.; Heine, J.R.; Bawendi, M.G.; Jensen, K.F. Full color emission from II–VI semiconductor quantum dot–polymer composites. Adv. Mater. 2000, 12, 1102. [Google Scholar] [CrossRef]
- Zhang, H.; Cui, Z.; Wang, Y.; Zhang, K.; Ji, X.; Lü, C.; Yang, B.; Gao, M. From water-soluble CdTe nanocrystals to fluorescent nanocrystal–polymer transparent composites using polymerizable surfactants. Adv. Mater. 2003, 15, 777. [Google Scholar] [CrossRef]
- Li, C.; Murase, N. Synthesis of highly luminescent glasses incorporating CdTe nanocrystals through sol-gel processing. Langmuir 2004, 20, 1–4. [Google Scholar] [CrossRef]
- Bullen, C.; Mulvaney, P.; Sada, C.; Ferrari, M.; Chiasera, A.; Martucci, A. Incorporation of a highly luminescent semiconductor quantum dot in ZrO2–SiO2 hybrid sol-gel glass film. J. Mater. Chem. 2004, 14, 1112. [Google Scholar] [CrossRef]
- Wang, Q.; Iancu, N.; Seo, D.-K. Preparation of large transparent silica monoliths with embedded photoluminescent CdSe@ZnS core/shell quantum dots. Chem. Mater. 2005, 17, 4762. [Google Scholar] [CrossRef]
- Neves, M.C.; Martins, M.A.; Soares-Santos, P.C.R.; Rauwel, P.; Ferreira, R.A.S.; Monteiro, T.; Carlos, L.D.; Trindade, T. Photoluminescent, transparent and flexible di-ureasil hybrids containing CdSe/ZnS quantum dots. Nanotechnology 2008, 19, 155601. [Google Scholar] [CrossRef]
- Tetsuya, H.; Ebina, T.; Mizukami, F. Highly luminescent flexible quantum dot-clay films. Adv. Mater. 2008, 20, 3039. [Google Scholar] [CrossRef]
- Mutlugun, E.; Hernandez-Martinez, P.L.; Eroglu, C.; Coskun, Y.; Erdem, T.; Sharma, V.K.; Unal, E.; Panda, S.K.; Hickey, S.G.; Gaponik, N.; et al. Large-area (over 50 cm × 50 cm) freestanding films of colloidal InP/ZnS quantum dots. Nano Lett. 2012, 12, 3986. [Google Scholar] [CrossRef] [PubMed]
- Jun, S.; Lee, J.; Jang, E. Highly luminescent and photostable quantum dot-silica monolith and its application to light-emitting diodes. ACS Nano 2013, 7, 1472. [Google Scholar] [CrossRef] [PubMed]
- Kim, J.-H.; Yang, H. White lighting device from composite films embedded with hydrophilic Cu(In, Ga)S2/ZnS and hydrophobic InP/ZnS quantum dots. Nanotechnology 2014, 25, 225601. [Google Scholar] [CrossRef] [PubMed]
- Lee, S.-H.; Lee, K.-H.; Jo, J.-H.; Park, B.; Kwon, Y.; Jang, H.S.; Yang, H. Remote-type, high-color gamut white light-emitting diode based on InP quantum dot color converters. Opt. Mater. Exp. 2014, 4, 1297. [Google Scholar] [CrossRef]
- Altintas, Y.; Genc, S.; Talpur, M.Y.; Mutlugun, E. CdSe/ZnS quantum dot films for high performance flexible lighting and display applications. Nanotechnology 2016, 27, 295604. [Google Scholar] [CrossRef]
- Yu, S.; Fritz, B.; Johnsen, S.; Busko, D.; Richards, B.S.; Hippler, M.; Wiegand, G.; Tang, Y.; Li, Z.; Lemmer, U.; et al. Enhanced photoluminescence in quantum dots-porous polymer hybrid films fabricated by microcellular foaming. Adv. Opt. Mater. 2019, 7, 1900223. [Google Scholar] [CrossRef]
- Kim, G.Y.; Kim, S.; Choi, J.; Kim, M.; Lim, H.; Nam, T.W.; Choi, W.; Cho, E.N.; Han, H.J.; Lee, C.; et al. Order-of-magnitude, broadband-enhanced light emission from quantum dots assembled in multiscale phase-separated block copolymers. Nano Lett. 2019, 19, 6827. [Google Scholar] [CrossRef]
- Hong, S.C.; Gwak, S.T.; Park, S.; Lee, G.J.; Lee, J.-G.; Ko, J.-H.; Joe, S.Y.; Kim, Y.; Park, T.; Ko, Y.W. Improvement of color-rendering characteristics of white light emitting diodes by using red quantum dot films. Curr. Appl. Phys. 2021, 31, 199. [Google Scholar] [CrossRef]
- Lee, J.-G.; Lee, G.J.; Hong, S.C.; Ko, J.-H.; Park, T.; Ko, Y.W. Shape optimization of quantum-dot caps for high color-rendering white light-emitting diodes studied by optical simulation. J. Korean Phys. Soc. 2021, 78, 822. [Google Scholar] [CrossRef]
- Lee, G.J.; Hong, S.C.; Lee, J.-G.; Ko, J.-H.; Park, T.; Ko, Y.W.; Lushnikov, S. Substantial Improvement of Color-Rendering Properties of Conventional White LEDs Using Remote-Type Red Quantum-Dot Caps. Nanomaterials 2022, 12, 1097. [Google Scholar] [CrossRef]


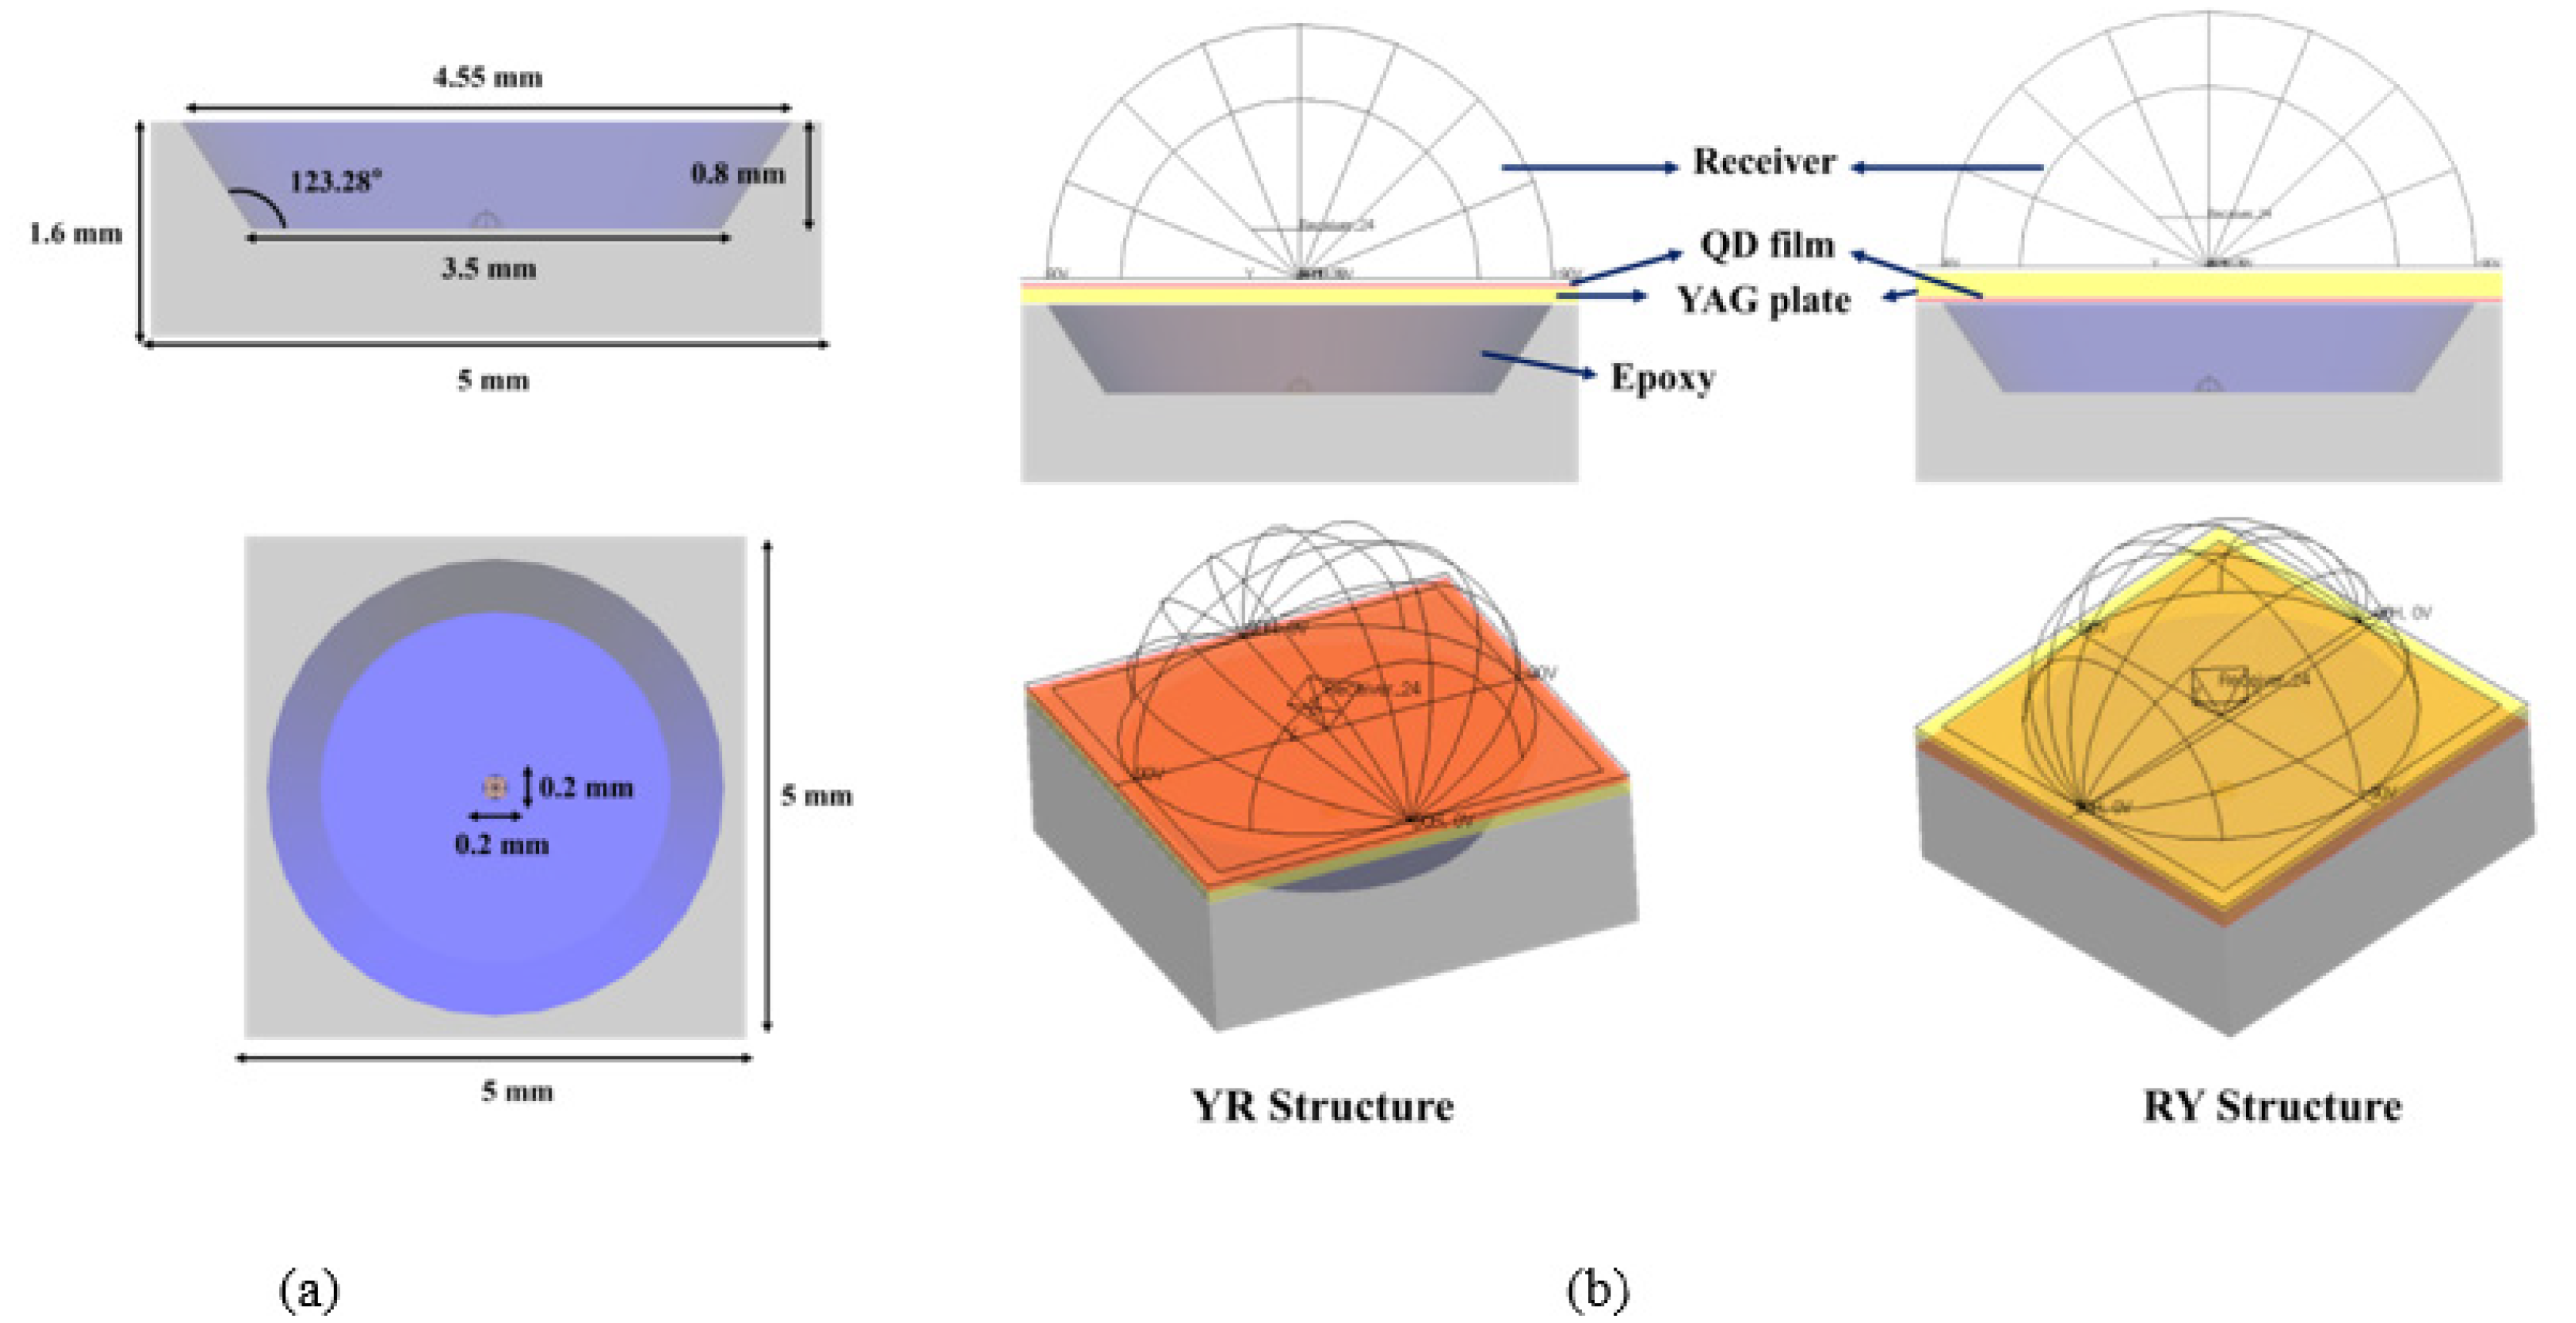
| Dimension (mm3) (Length, Width, Height) | Material | Optical Property | |
|---|---|---|---|
| Frame | 1.6 | PMMA (n = 1.4936) | Inside: Gaussian scattering (Sigma 15°, Reflection 85%, Absorption 15%) Outside: Optical absorber |
| Chip | 0.01 | GaN (n = 2.4) | Fresnel loss |
| Epoxy | 0.8 (Base, Top, Height) | NOA63 (n = 1.5637) | |
| YAG plate | 0.12~0.21 | MgAl2O4 (n = 1.7188) | |
| QD film | 0.03 | PET (n = 1.5733) |
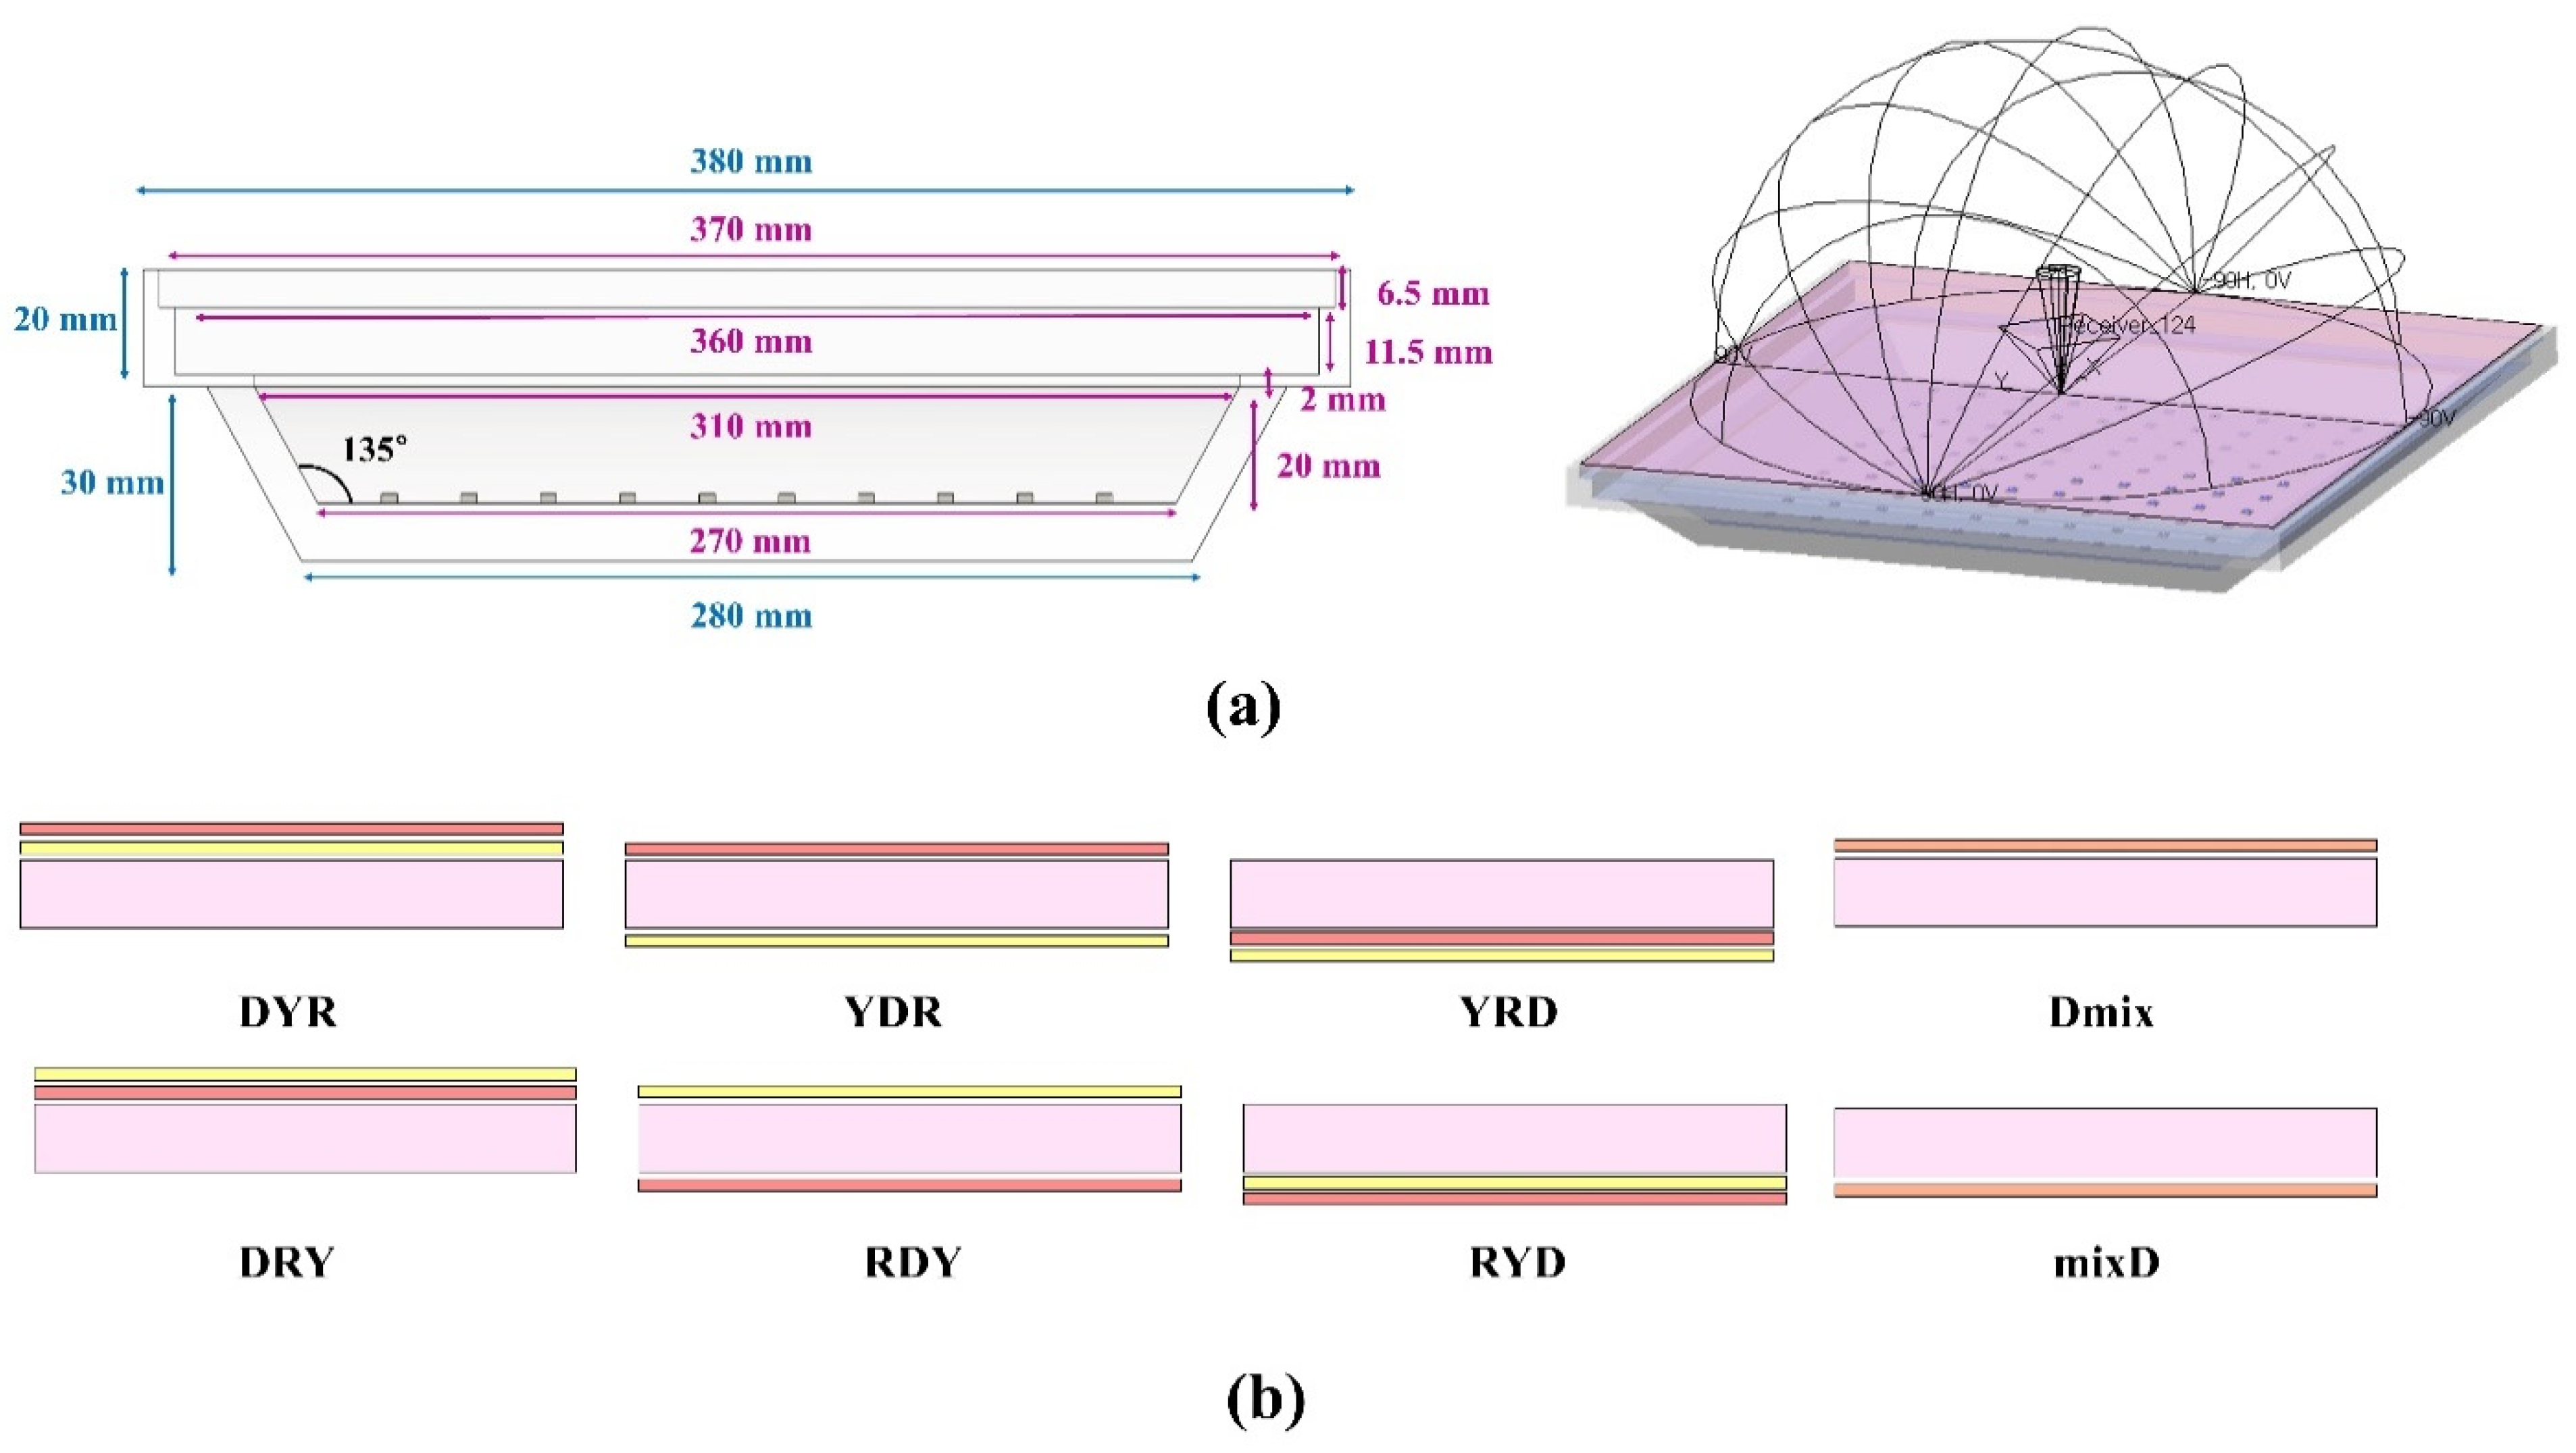
| Dimension (mm3) (Length, Width, Height) | Material | Optical Property | |
|---|---|---|---|
| Frame | 20 (Top of the Lighting) | Aluminum (n = 1.0122) | Inside: Gaussian scattering (Sigma 15°, Reflection 85%, Absorption 15%) Outside: Optical absorber |
| Diffuser plate | 2 | PolycarbonateLED2045 (n = 1.5896), TiO2 (n = 2.4358) | Fresnel loss |
| YAG, QD film | 0.1 | PET (n = 1.5733) |
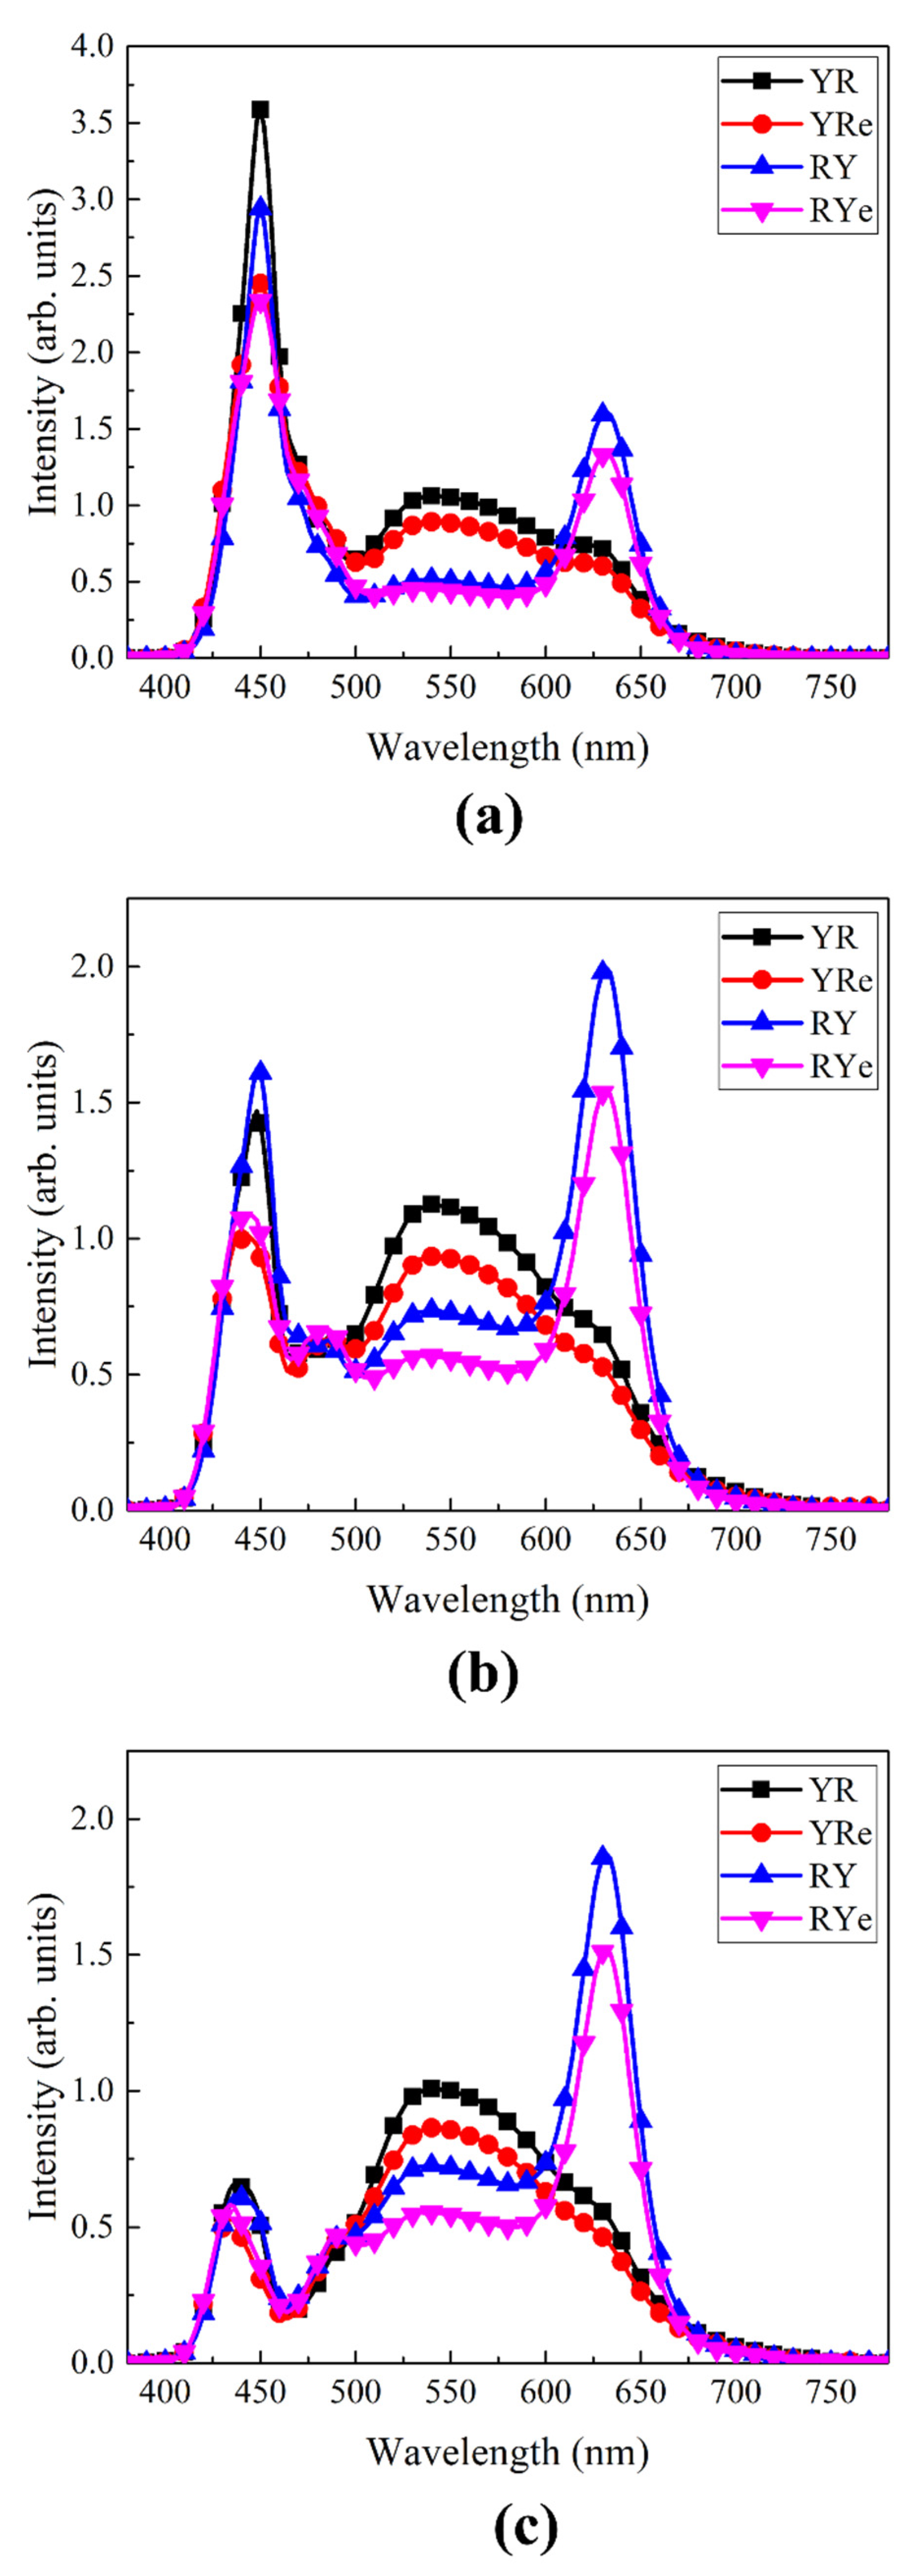
| Emission Peak (nm) | FWHM (nm) | Weight Percent (wt%) | Mean Free Path (mm) | |
|---|---|---|---|---|
| LED | 450 | 25 | - | - |
| YAG | 540 | 100 (below 540 nm) 170 (above 540 nm) | 16 (W-LED) 50 (Lighting) | - |
| QD | 632 | 30 | - | 0.01 (W-LED) 0.12 (Lighting) |
Publisher’s Note: MDPI stays neutral with regard to jurisdictional claims in published maps and institutional affiliations. |
© 2022 by the authors. Licensee MDPI, Basel, Switzerland. This article is an open access article distributed under the terms and conditions of the Creative Commons Attribution (CC BY) license (https://creativecommons.org/licenses/by/4.0/).
Share and Cite
Hong, S.C.; Ko, J.-H. Structural Optimization of Vertically-Stacked White LEDs with a Yellow Phosphor Plate and a Red Quantum-Dot Film. Nanomaterials 2022, 12, 2846. https://doi.org/10.3390/nano12162846
Hong SC, Ko J-H. Structural Optimization of Vertically-Stacked White LEDs with a Yellow Phosphor Plate and a Red Quantum-Dot Film. Nanomaterials. 2022; 12(16):2846. https://doi.org/10.3390/nano12162846
Chicago/Turabian StyleHong, Seung Chan, and Jae-Hyeon Ko. 2022. "Structural Optimization of Vertically-Stacked White LEDs with a Yellow Phosphor Plate and a Red Quantum-Dot Film" Nanomaterials 12, no. 16: 2846. https://doi.org/10.3390/nano12162846
APA StyleHong, S. C., & Ko, J.-H. (2022). Structural Optimization of Vertically-Stacked White LEDs with a Yellow Phosphor Plate and a Red Quantum-Dot Film. Nanomaterials, 12(16), 2846. https://doi.org/10.3390/nano12162846