
Biogenic Synthesis, Characterization, and Photocatalytic Evaluation of Pristine and Graphene-Loaded Zn50Mg50O Nanocomposites for Organic Dyes Removal


 ,
,  ,
,  ,
,
Abstract
:1. Introduction
2. Materials and Methods
2.1. Chemicals
2.2. Collection and Preparation of Algae Extract
2.3. Synthesis of Zn50Mg50O and Silica-Supported Graphene with Zn50Mg50O Nanocomposites
2.4. Characterisation of Nanocomposites
2.5. Batch Photocatalytic Studies
2.6. Response Surface Methodology
3. Results and Discussion
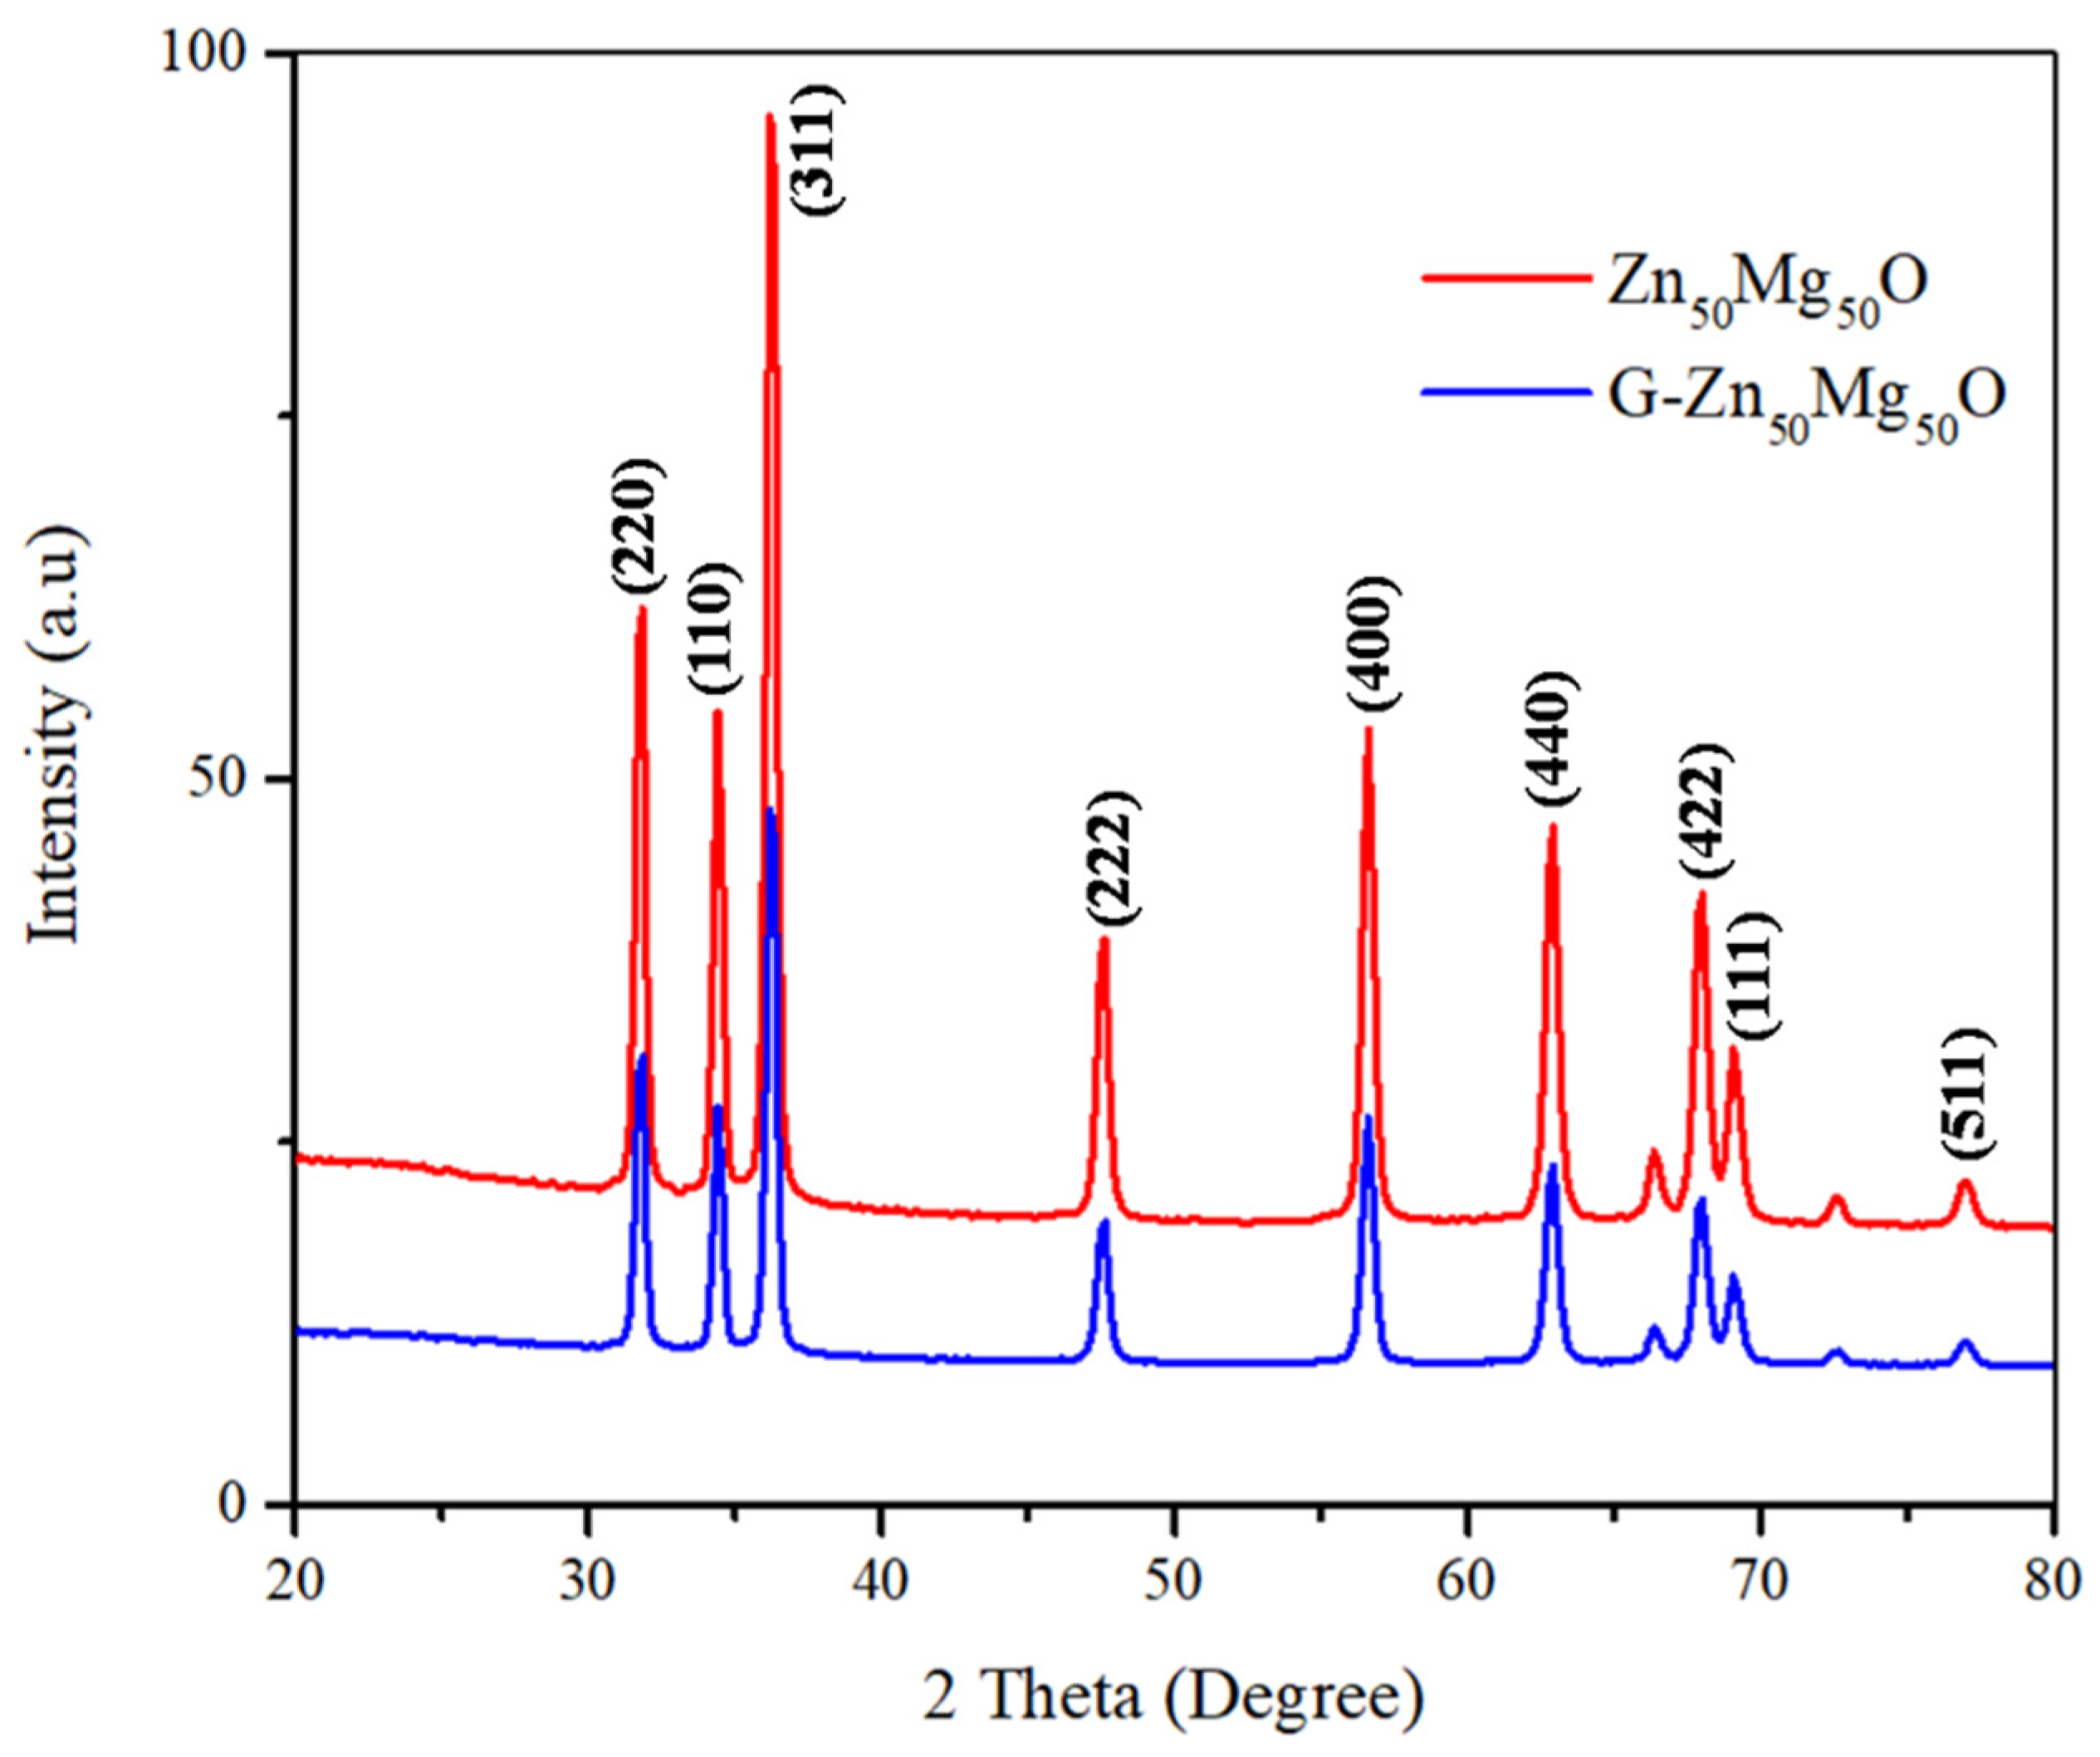
3.1. Powder XRD Analysis
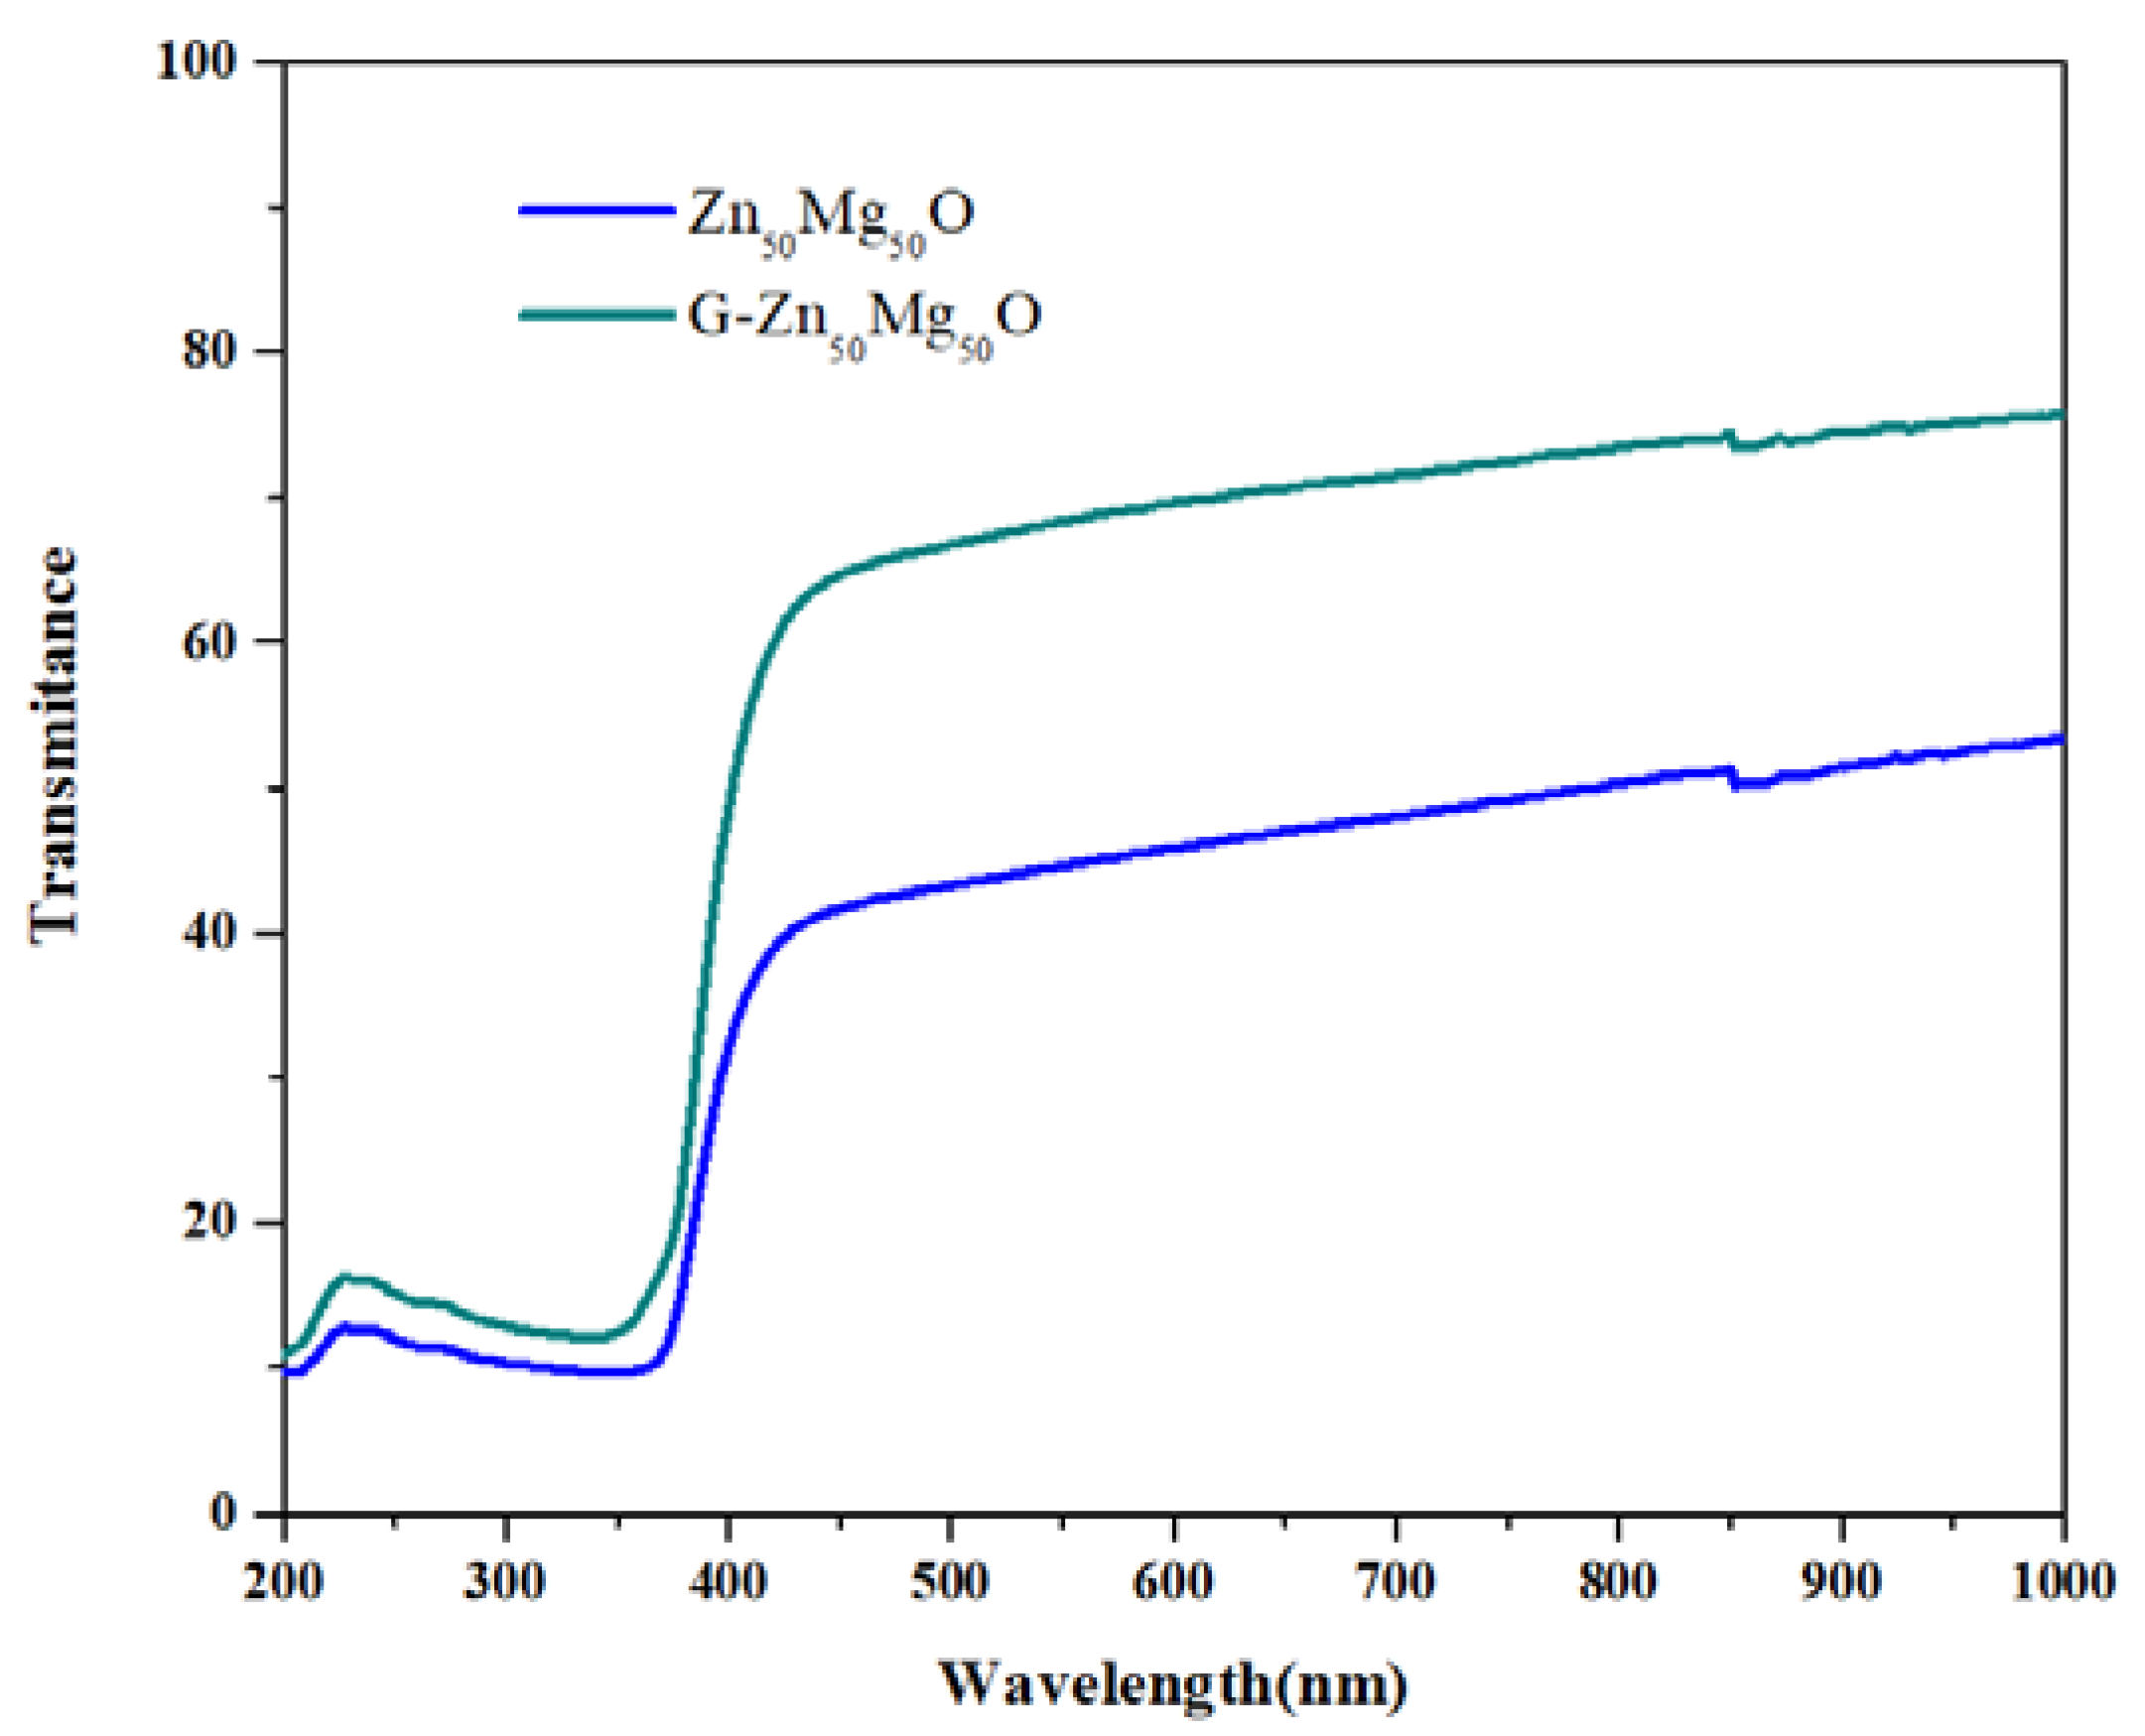
3.2. UV-DRS
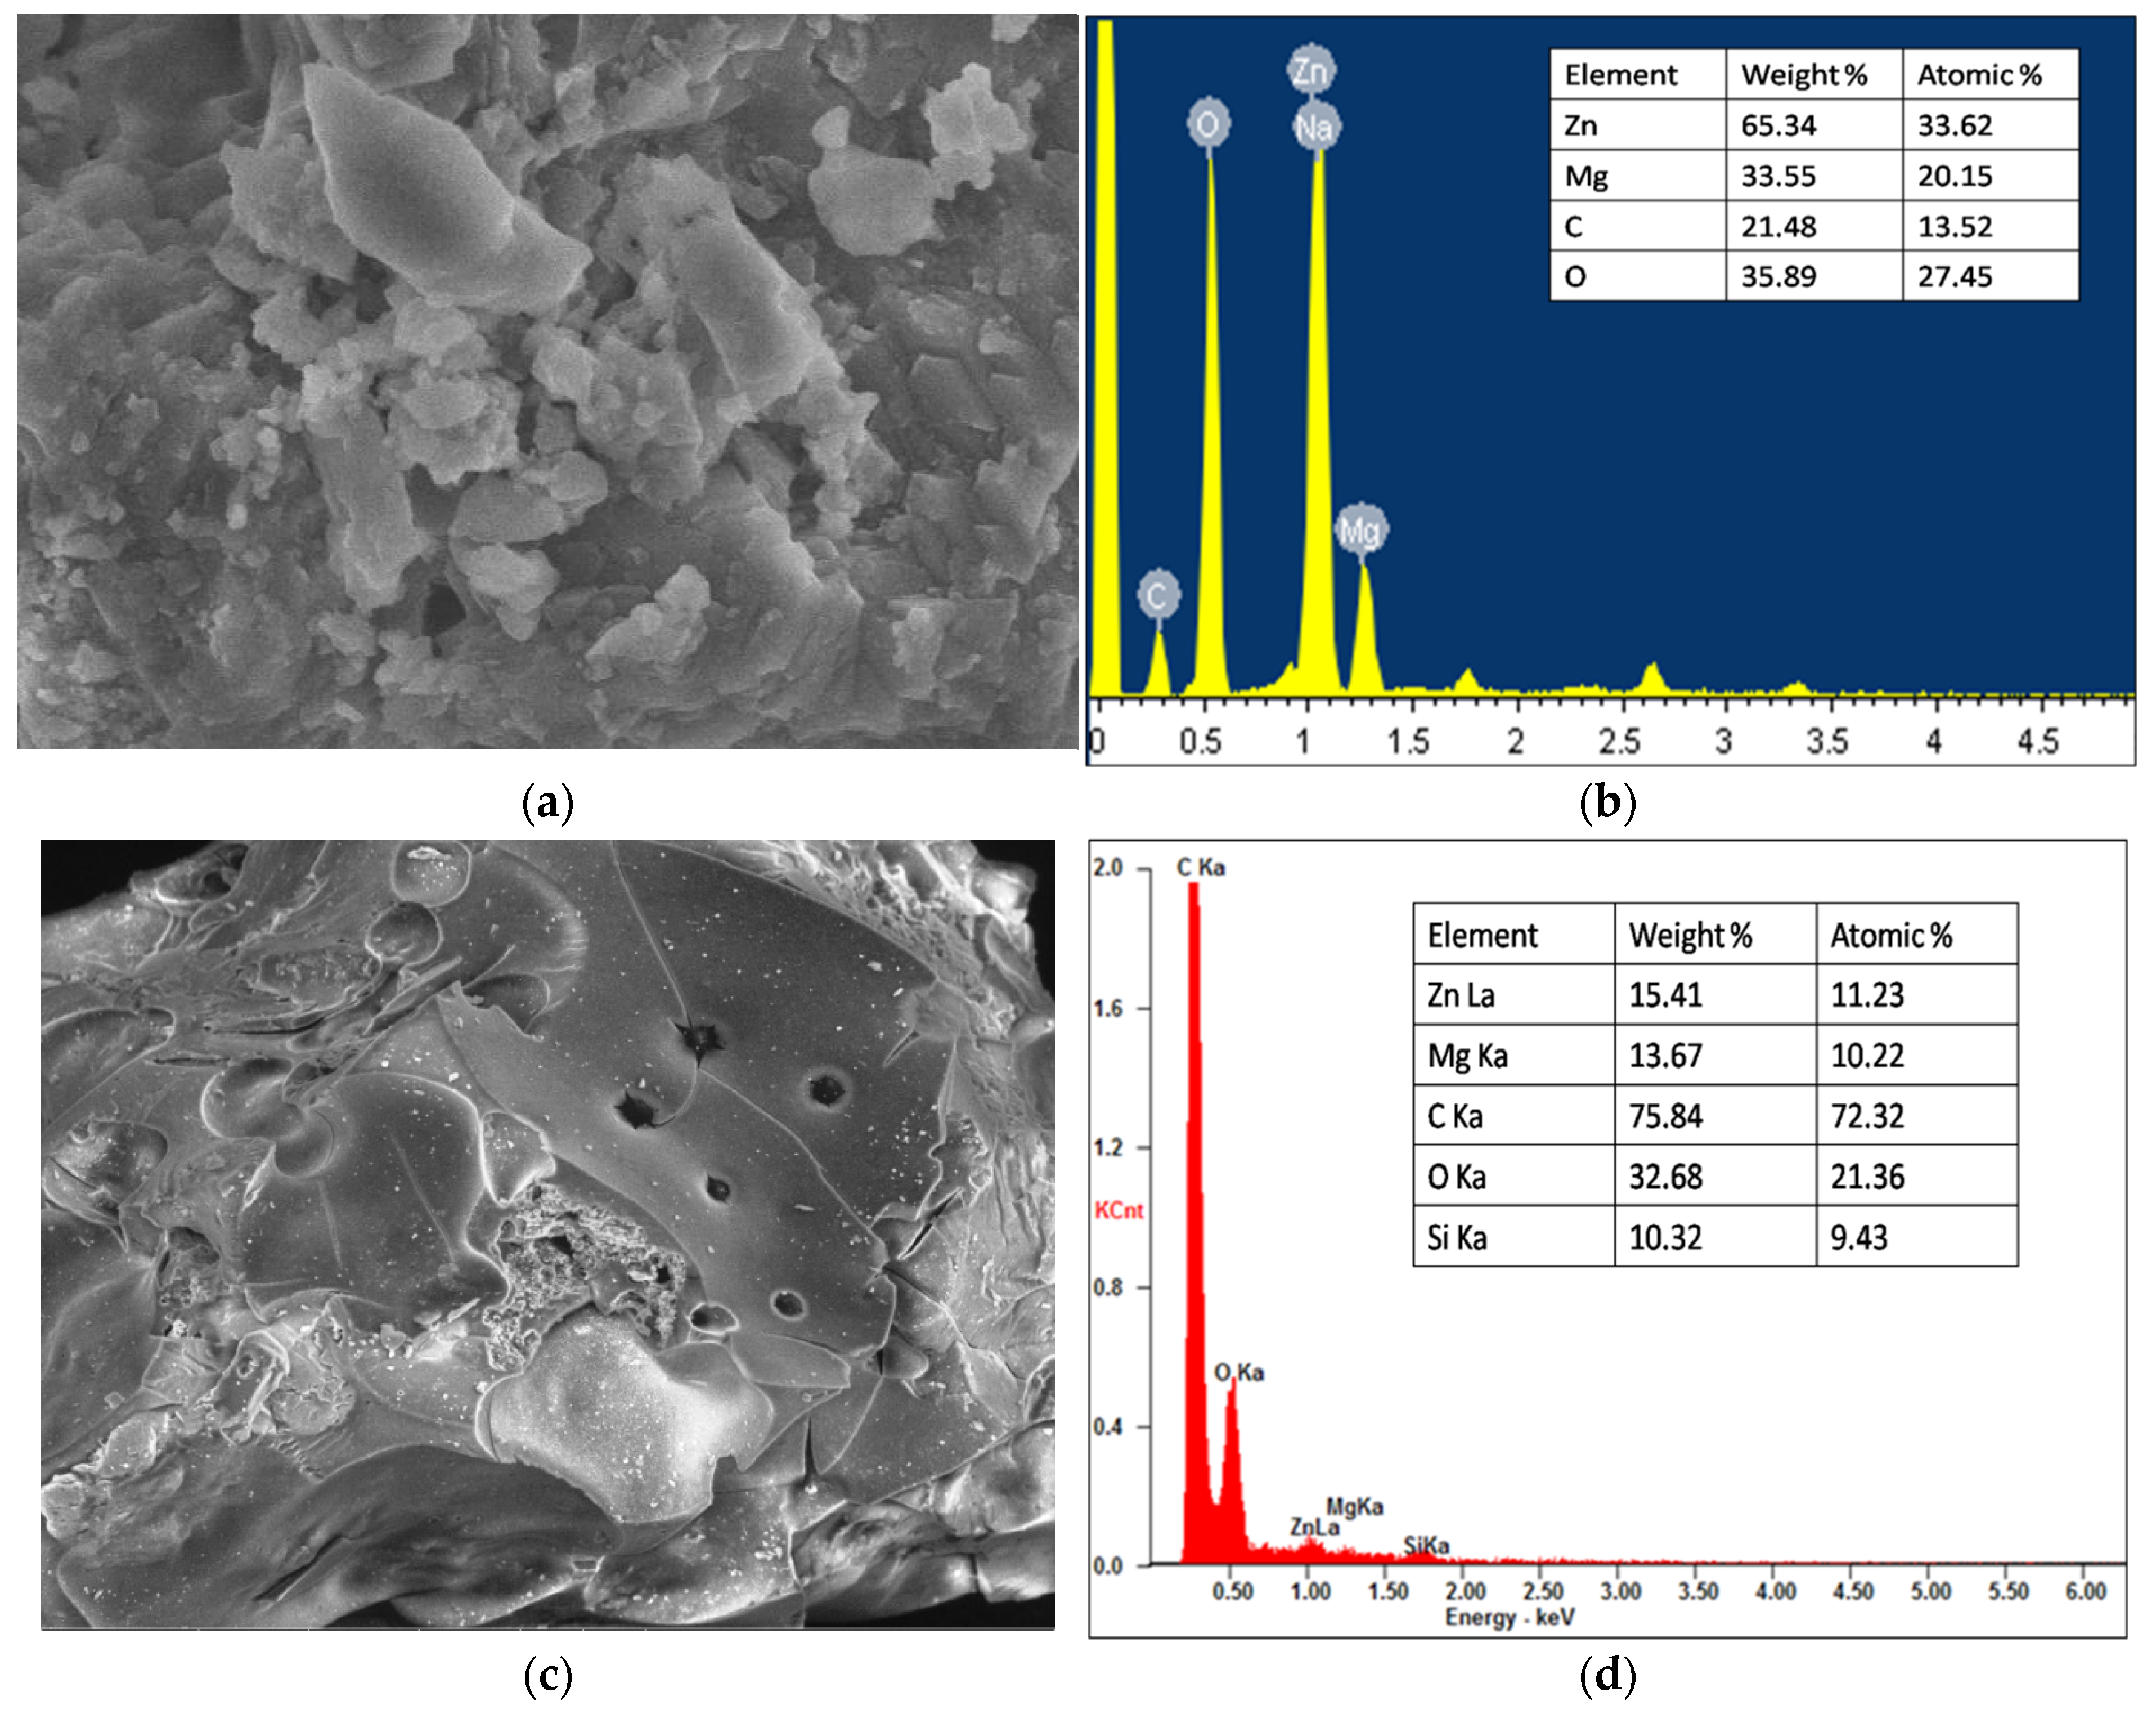
3.3. SEM-EDAX
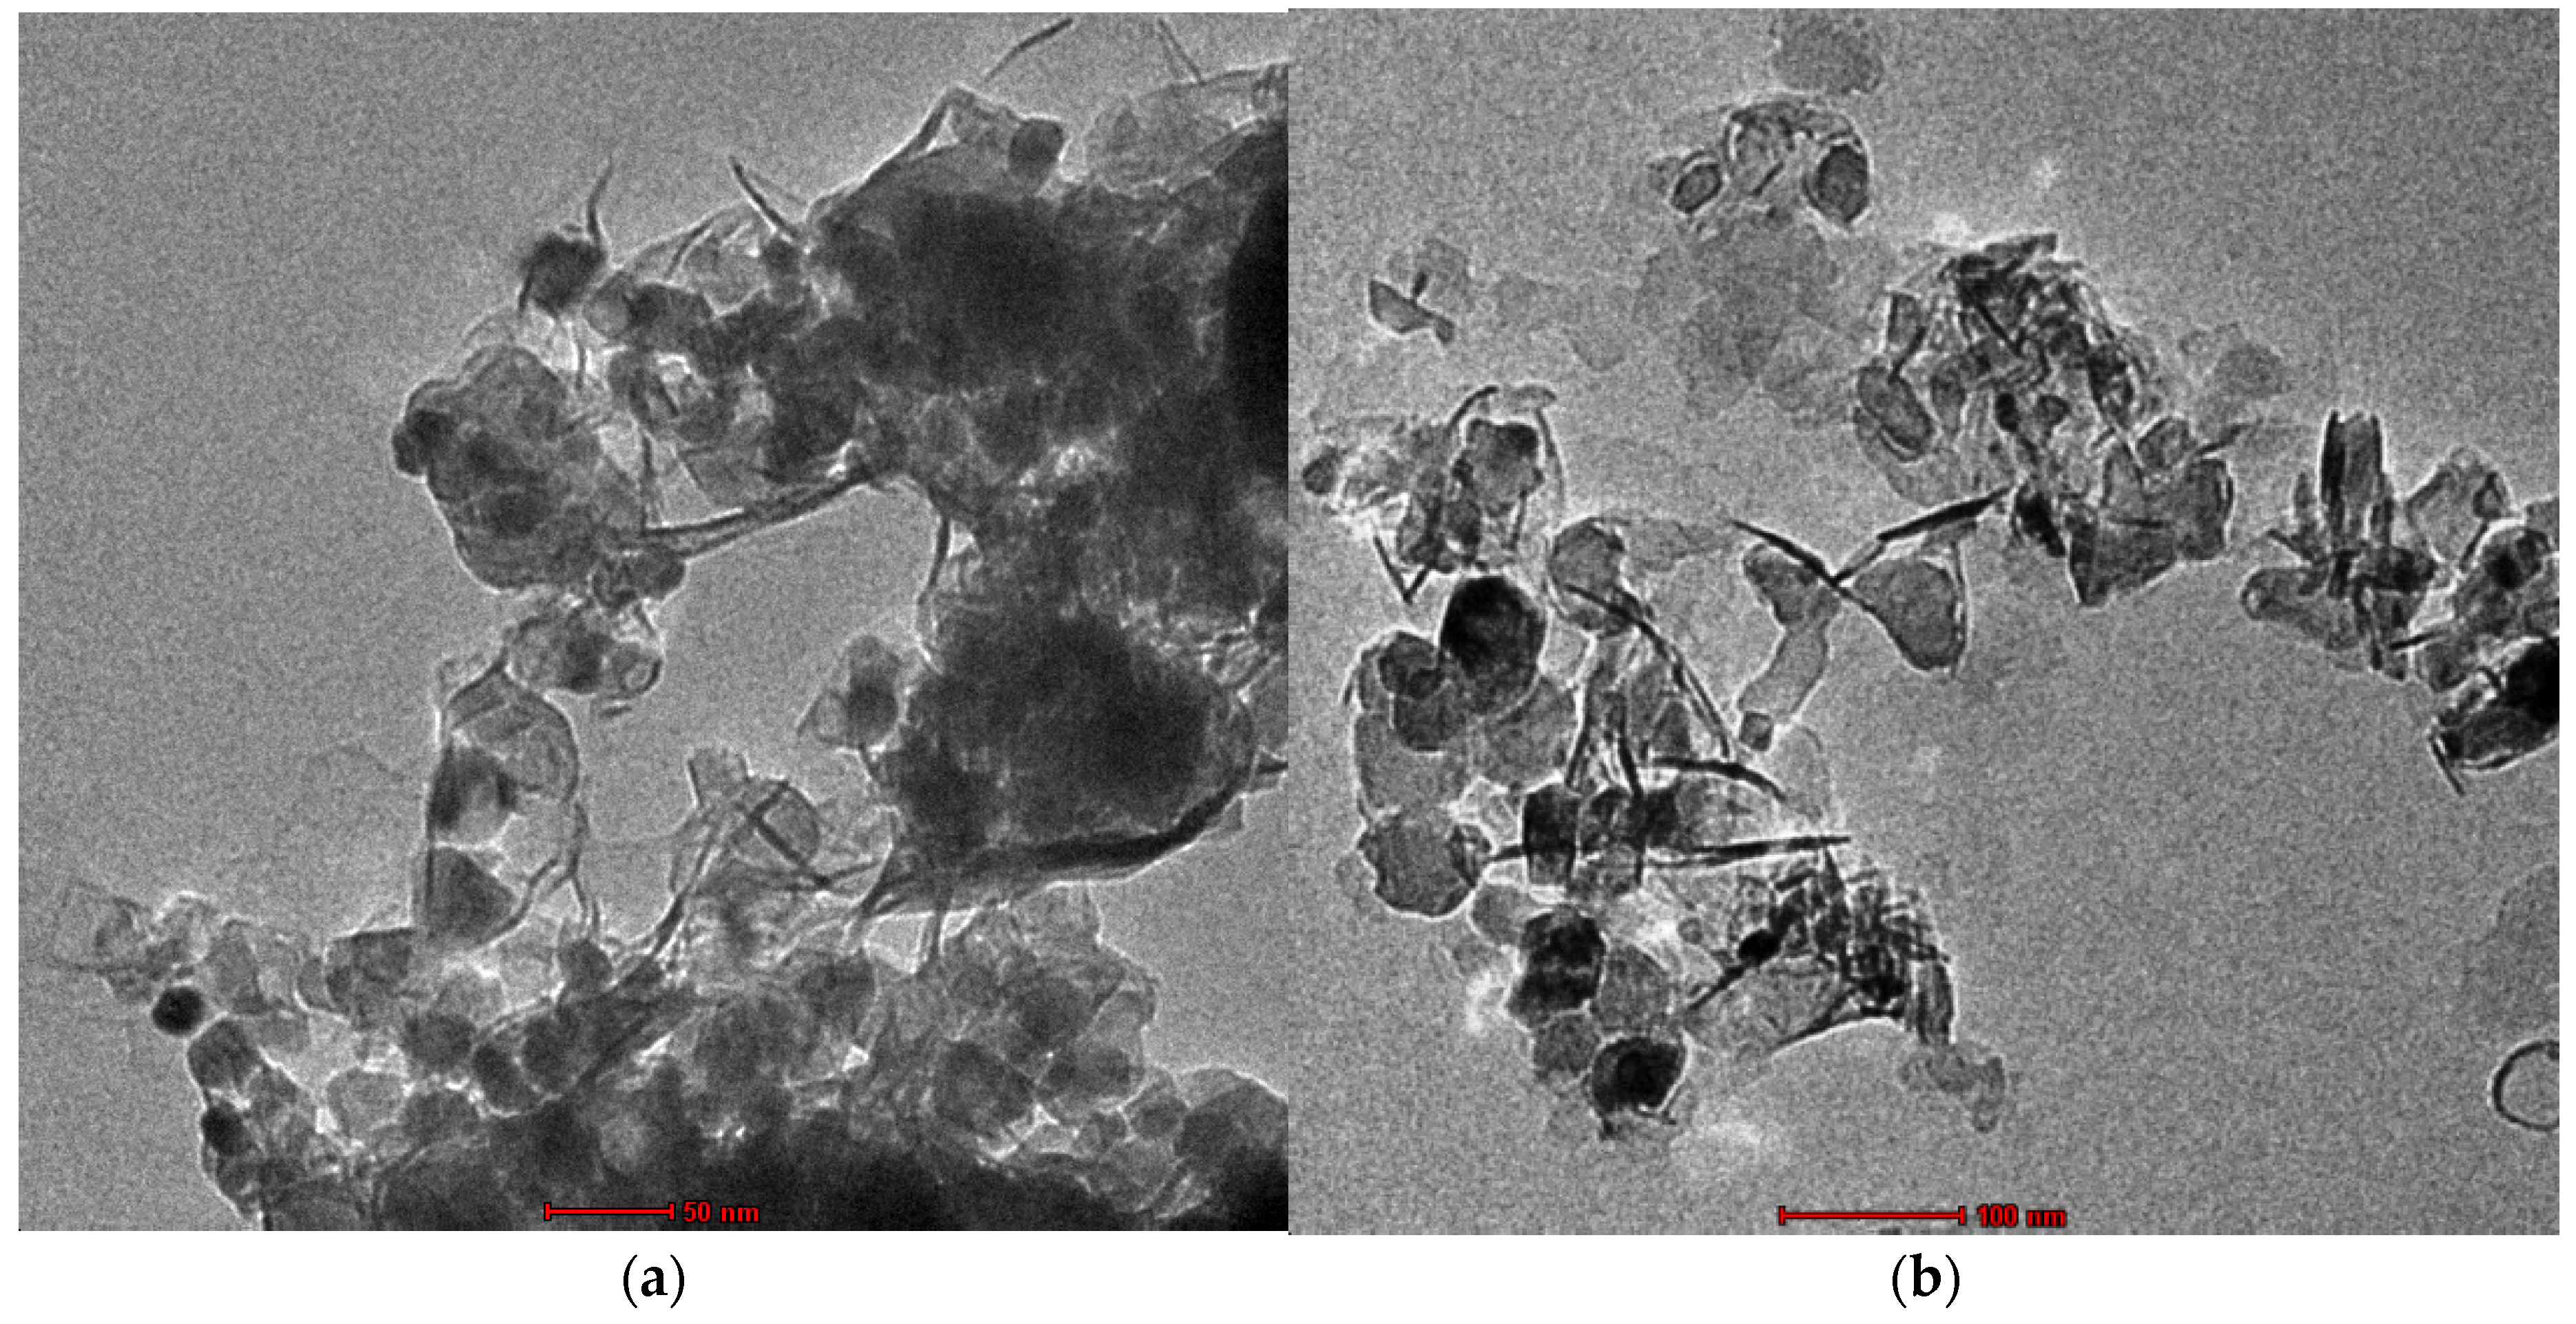
3.4. TEM
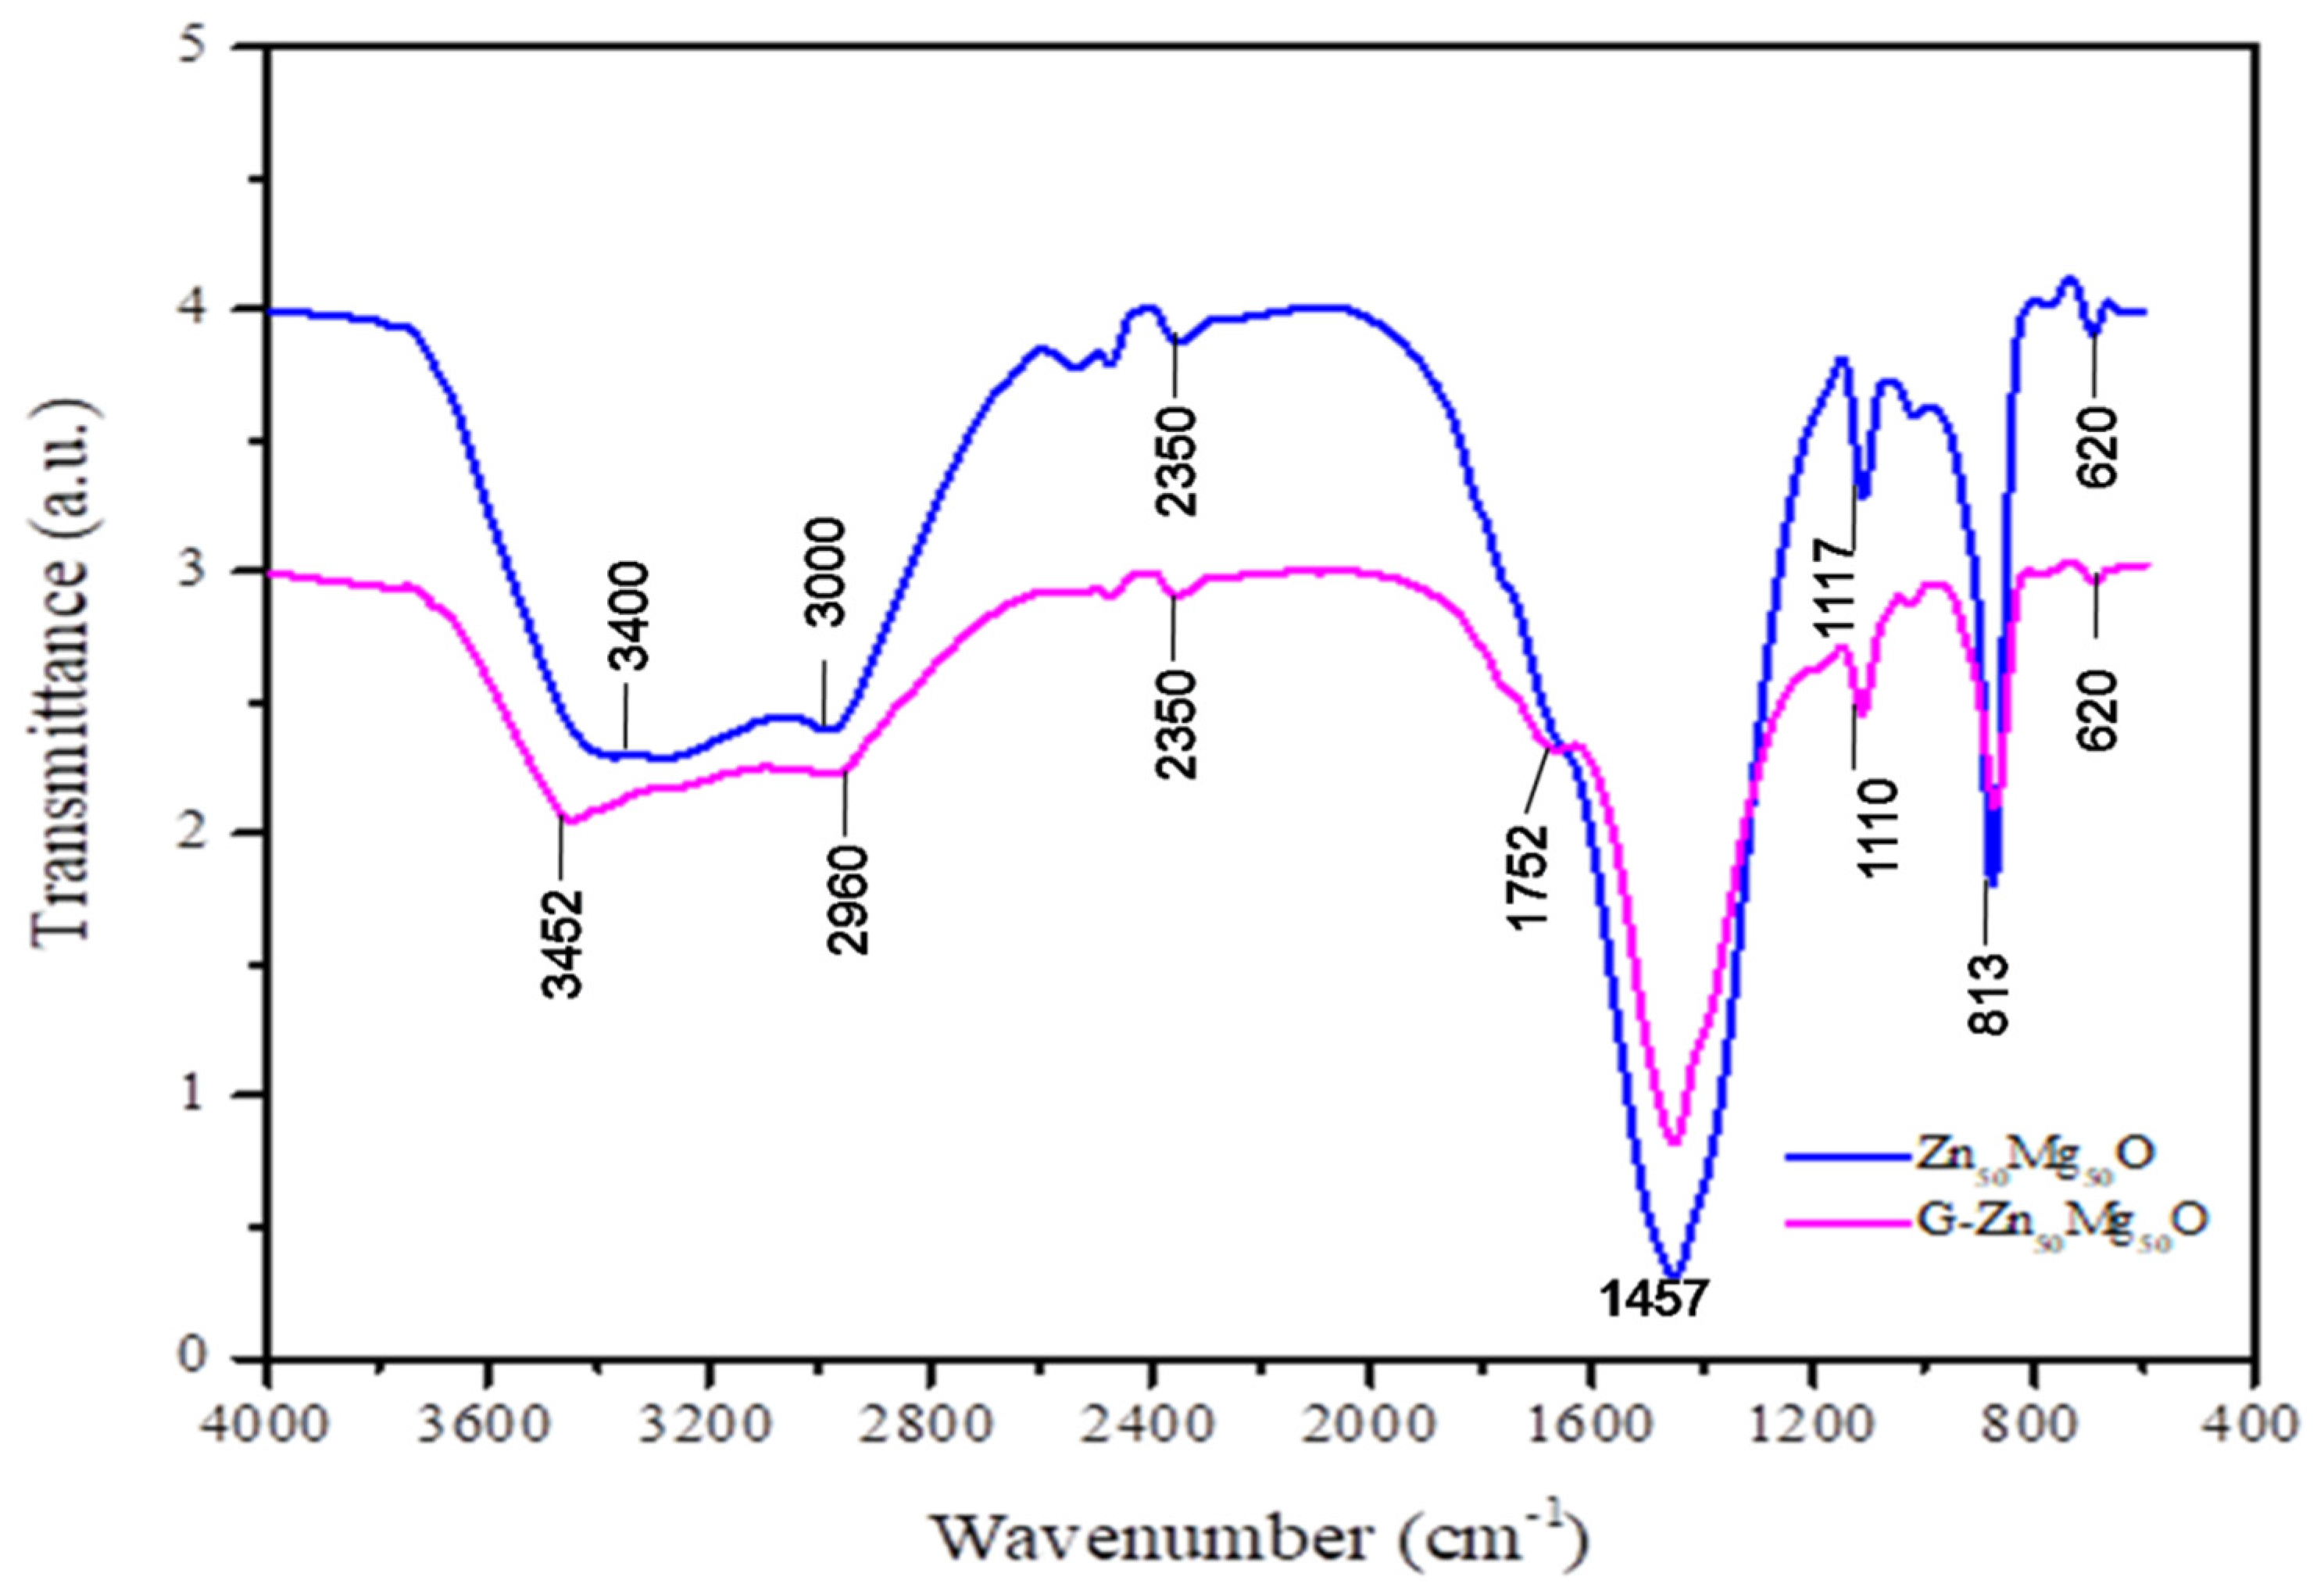
3.5. FTIR
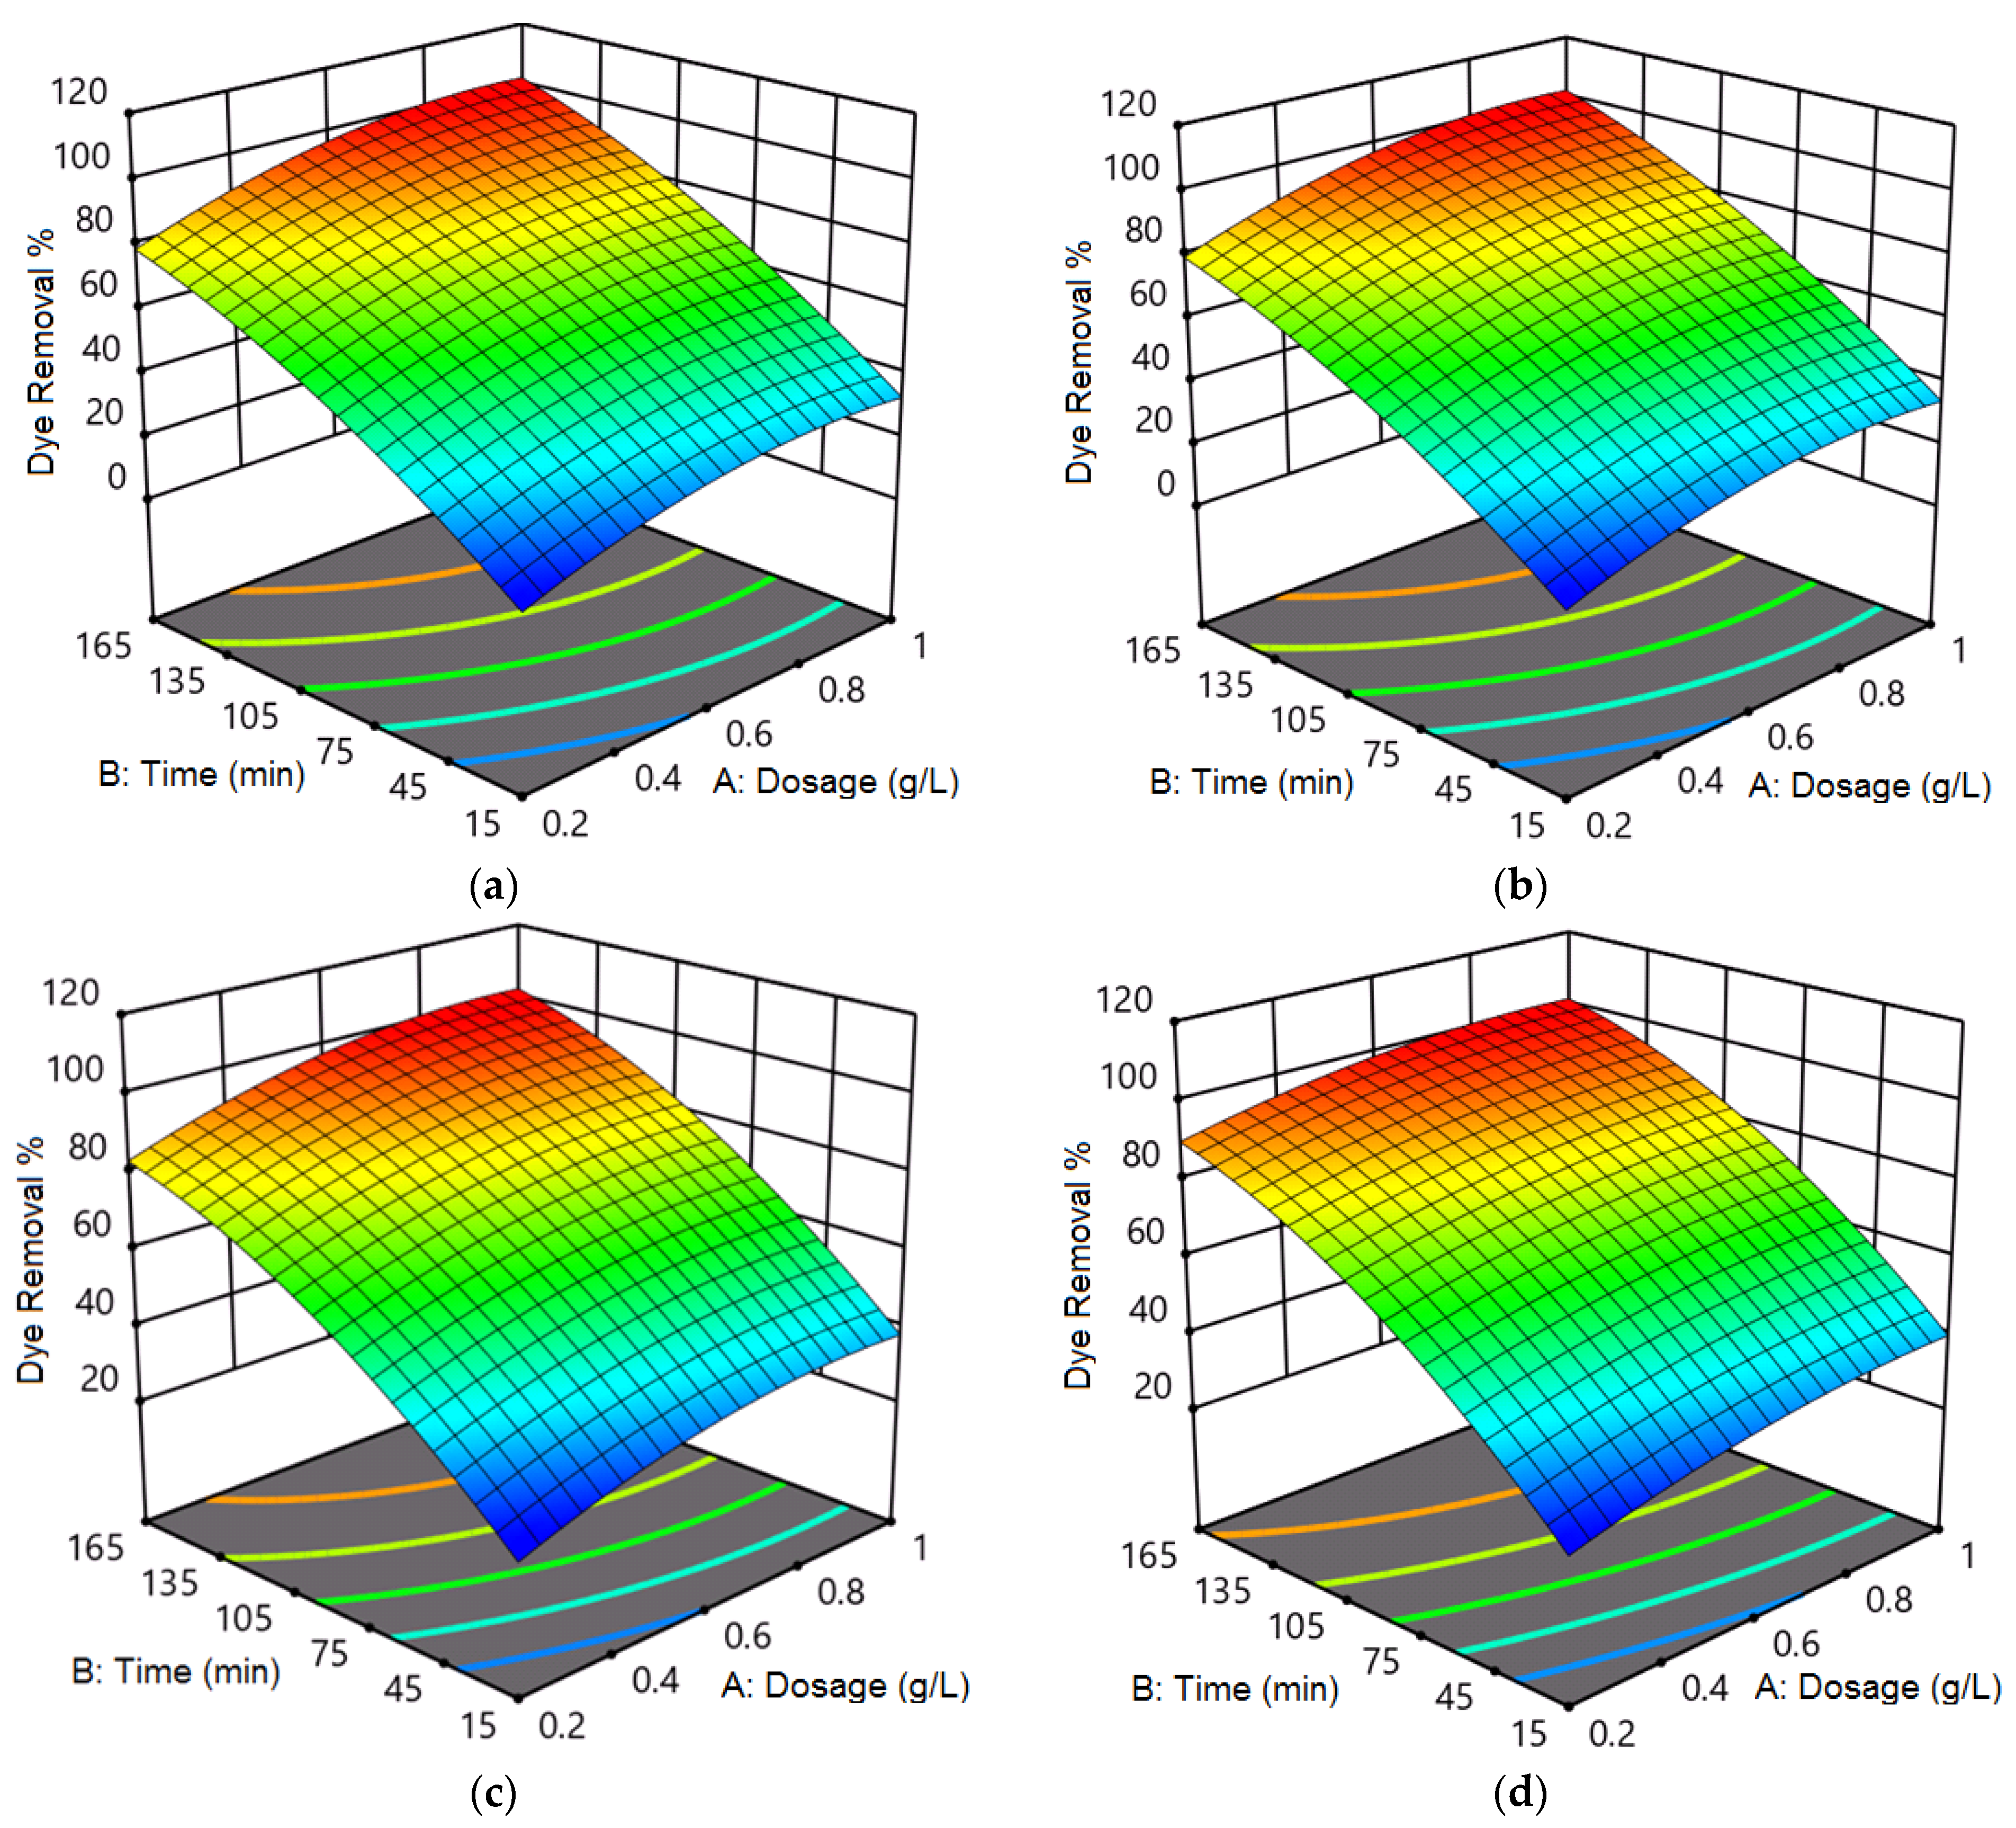
3.6. RSM Analysis for Photocatalytic Studies
4. Conclusions
Author Contributions
Funding
Institutional Review Board Statement
Informed Consent Statement
Data Availability Statement
Conflicts of Interest
References
- Carmen, Z.; Daniela, S. Textile Organic Dyes-Characteristics, Polluting Effects and Separation/Elimination Procedures from Industrial Effluents-A Critical Overview; IntechOpen: London, UK, 2012; pp. 55–86. [Google Scholar]
- Belver, C.; Bedia, J.; Gómez-Avilés, A.; Peñas-Garzón, M.; Rodriguez, J.J. Semiconductor photocatalysis for water purification. In Nanoscale Materials in Water Purification; Elsevier: Amsterdam, The Netherlands, 2019; pp. 581–651. [Google Scholar]
- Asahi, R.; Morikawa, T.; Irie, H.; Ohwaki, T. Nitrogen-doped titanium dioxide as visible-light-sensitive photocatalyst: Designs, developments, and prospects. Chem. Rev. 2014, 114, 9824–9852. [Google Scholar] [CrossRef] [PubMed]
- Nethavhanani, T. Synthesis of zinc oxide nanoparticles by a green process and the investigation of their physical properties. AIP Conf. Proc. 2018, 1962, 040007. [Google Scholar] [CrossRef]
- Ferreira, S.C.; Bruns, R.E.; Ferreira, H.S.; Matos, G.D.; David, J.M.; Brandão, G.C.; Dos Santos, W.N.L. Box-Behnken design: An alternative for the optimization of analytical methods. Anal. Chim. Acta 2007, 597, 179–186. [Google Scholar] [CrossRef] [PubMed]
- Montgomery, D.C. Design and Analysis of Experiments, 8th ed.; John Wiley & Sons Inc.: Hoboken, NJ, USA, 2013. [Google Scholar]
- Theerthagiri, J.; Senthil, R.A.; Malathi, A.; Selvi, A.; Madhavan, J.; Ashokkumar, M. Synthesis and characterization of a CuS–WO3 composite photocatalyst for enhanced visible light photocatalytic activity. RSC Adv. 2015, 5, 52718–52725. [Google Scholar] [CrossRef]
- Chawla, S.; Jayanthi, K.; Chander, H.; Haranath, D.; Halder, S.K.; Kar, M. Synthesis and optical properties of ZnO/MgO nanocomposite. J. Alloys Compd. 2008, 459, 457–460. [Google Scholar] [CrossRef]
- Zhang, Y.; Qi, H.; Zhang, L.; Wang, Y.; Zhong, L.; Zheng, Y.; Xue, J. A RGO aerogel/TiO2/MoS2 composite photocatalyst for the removal of organic dyes by the cooperative action of adsorption and photocatalysis. Environ. Sci. Pollut. Res. 2022, 29, 8980–8995. [Google Scholar] [CrossRef] [PubMed]
- Anand, K.V.; Chinnu, M.K.; Kumar, R.M.; Mohan, R.; Jayavel, R. Formation of zinc sulfide nanoparticles in HMTA matrix. Appl. Surf. Sci. 2009, 255, 8879–8882. [Google Scholar] [CrossRef]
- Rufus, A.; Sreeju, N.; Philip, D. Synthesis of biogenic hematite (α-Fe2O3) nanoparticles for antibacterial and nanofluid applications. RSC Adv. 2016, 6, 94206–94217. [Google Scholar] [CrossRef]
- Gajendiran, J.; Rajendran, V. Synthesis and characterization of coupled semiconductor metal oxide (ZnO/CuO) nanocomposite. Mater. Lett. 2014, 116, 311–313. [Google Scholar] [CrossRef]
- Jangid, N.K.; Jadoun, S.; Yadav, A.; Srivastava, M.; Kaur, N. Polyaniline-TiO2-based photocatalysts for dyes degradation. Polym. Bull. 2021, 78, 4743–4777. [Google Scholar] [CrossRef]
- Panchal, P.; Paul, D.R.; Sharma, A.; Hooda, D.; Yadav, R.; Meena, P.; Nehra, S.P. Phytoextract mediated ZnO/MgO nanocomposites for photocatalytic and antibacterial activities. J. Photochem. Photobiol. A Chem. 2019, 385, 112049. [Google Scholar] [CrossRef]
- Fagier, M.A. Plant-mediated biosynthesis and photocatalysis activities of zinc oxide nanoparticles: A prospect towards dyes mineralization. J. Nanotechnol. 2021, 2021, 6629180. [Google Scholar] [CrossRef]
- Govindaraju, K.; Anand, K.V.; Anbarasu, S.; Theerthagiri, J.; Revathy, S.; Krupakar, P.; Subramanian, K.S. Seaweed (Turbinariaornata)-assisted green synthesis of magnesium hydroxide [Mg(OH)2] nanomaterials and their anti-mycobacterial activity. Mater. Chem. Phys. 2020, 239, 122007. [Google Scholar] [CrossRef]
- Tahir, M.B.; Tufail, S.; Ahmad, A.; Rafique, M.; Iqbal, T.; Abrar, M.; Ijaz, M. Semiconductor nanomaterials for the detoxification of dyes in real wastewater under visible-light photocatalysis. Int. J. Environ. Anal. Chem. 2021, 101, 1735–1749. [Google Scholar] [CrossRef]
- Thakkar, K.N.; Mhatre, S.S.; Parikh, R.Y. Biological synthesis of metallic nanoparticles. Nanomed. Nanotechnol. Biol. Med. 2010, 6, 257–262. [Google Scholar] [CrossRef] [PubMed]
- Malik, R.; Tomer, V.K.; Chaudhary, V.; Dahiya, M.S.; Rana, P.S.; Nehra, S.P.; Duhan, S. Facile synthesis of hybridized mesoporousAu@TiO2/SnO2 as efficient photocatalyst and selective VOC sensor. ChemistrySelect 2016, 1, 3247–3258. [Google Scholar] [CrossRef]
- Ahmaruzzaman, M.; Gupta, V.K. Rice husk and its ash as low-cost adsorbents in water and wastewater treatment. Ind. Eng. Chem. Res. 2011, 50, 13589–13613. [Google Scholar] [CrossRef]
- La, D.D.; Tran, C.V.; Hoang, N.T.; Ngoc, M.D.D.; Nguyen, T.P.; Vo, H.T.; Nguyen, D.D. Efficient photocatalysis of organic dyes under simulated sunlight irradiation by a novel magnetic CuFe2O4@ porphyrin nanofiber hybrid material fabricated via self-assembly. Fuel 2020, 281, 118655. [Google Scholar] [CrossRef]
- Tripathi, P.; Srivastava, V.C.; Kumar, A. Optimization of an azo dye batch adsorption parameters using Box–Behnken design. Desalination 2009, 249, 1273–1279. [Google Scholar] [CrossRef]


| Independent Factor | Symbol | Unit | Levels | ||
|---|---|---|---|---|---|
| Low (−1) | Centre (0) | High (+1) | |||
| Photocatalyst dosage | A | g/L | 0.2 | 0.6 | 1 |
| Contact time | B | min | 15 | 90 | 165 |
| Std | Run | A: Photocatalyst Dosage (g/L) | B: Contact Time (min) | Dye Removal (%) | |||
|---|---|---|---|---|---|---|---|
| RhB—Zn50Mg50O | MB—Zn50Mg50O | RhB—G-Zn50Mg50O | MB—G-Zn50Mg50O | ||||
| 2 | 1 | 0.2 | 165 | 78.5 | 83.6 | 79.5 | 90.5 |
| 8 | 2 | 0.2 | 15 | 17.7 | 24.7 | 19.7 | 26.7 |
| 5 | 3 | 1 | 15 | 34.2 | 39.2 | 35.2 | 40.2 |
| 4 | 4 | 0.6 | 165 | 100 | 100 | 100 | 100 |
| 11 | 5 | 0.6 | 15 | 26.2 | 29.2 | 28.2 | 32.2 |
| 9 | 6 | 0.6 | 90 | 71.8 | 76.9 | 72.8 | 77.7 |
| 7 | 7 | 0.6 | 90 | 72 | 76.7 | 72.9 | 77.8 |
| 6 | 8 | 1 | 90 | 74.8 | 79.8 | 75.8 | 80.8 |
| 3 | 9 | 0.6 | 90 | 71.9 | 76.8 | 73 | 77.6 |
| 1 | 10 | 0.2 | 90 | 51 | 56.1 | 52 | 63 |
| 10 | 11 | 1 | 165 | 100 | 100 | 100 | 100 |
| (a) RhB dye using Zn50Mg50O composite | |||||
| Source | Sum of Squares | Df | Mean Square | F-Value | p-Value |
| Model | 7680.36 | 5 | 1536.07 | 147.17 | <0.0001 |
| A-Photocatalyst dosage | 636.54 | 1 | 636.54 | 60.99 | 0.0006 |
| B-Time | 6693.36 | 1 | 6693.36 | 641.29 | <0.0001 |
| AB | 6.25 | 1 | 6.25 | 0.5988 | 0.4740 |
| A² | 129.80 | 1 | 129.80 | 12.44 | 0.0168 |
| B² | 122.64 | 1 | 122.64 | 11.75 | 0.0187 |
| Residual | 52.19 | 5 | 10.44 | ||
| Lack of Fit | 52.17 | 3 | 17.39 | 1738.89 | |
| Pure Error | 0.0200 | 2 | 0.0100 | ||
| Cor Total | 7732.55 | 10 | |||
| (b) MB dye using Zn50Mg50O composite | |||||
| Source | Sum of Squares | df | Mean Square | F-Value | p-Value |
| Model | 7375.29 | 5 | 1475.06 | 150.35 | <0.0001 |
| A-Photocatalyst dosage | 596.01 | 1 | 596.01 | 60.75 | 0.0006 |
| B-Time | 6428.83 | 1 | 6428.83 | 655.29 | <0.0001 |
| AB | 6.25 | 1 | 6.25 | 0.6371 | 0.4610 |
| A² | 129.80 | 1 | 129.80 | 13.23 | 0.0149 |
| B² | 122.64 | 1 | 122.64 | 12.50 | 0.0166 |
| Residual | 49.05 | 5 | 9.81 | ||
| Lack of Fit | 49.03 | 3 | 16.34 | 1634.45 | |
| Pure Error | 0.0200 | 2 | 0.0100 | ||
| Cor Total | 7424.35 | 10 | |||
| (c) RhB dye using G-Zn50Mg50O composite | |||||
| Source | Sum of Squares | df | Mean Square | F-Value | p-Value |
| Model | 6925.68 | 5 | 1385.14 | 80.19 | <0.0001 |
| A-Photocatalyst dosage | 496.86 | 1 | 496.86 | 28.76 | 0.0030 |
| B-Time | 6048.37 | 1 | 6048.37 | 350.15 | <0.0001 |
| AB | 0.9025 | 1 | 0.9025 | 0.0522 | 0.8283 |
| A² | 80.19 | 1 | 80.19 | 4.64 | 0.0838 |
| B² | 204.12 | 1 | 204.12 | 11.82 | 0.0185 |
| Residual | 86.37 | 5 | 17.27 | ||
| Lack of Fit | 86.35 | 3 | 28.78 | 2878.30 | |
| Pure Error | 0.0200 | 2 | 0.0100 | ||
| Cor Total | 7012.05 | 10 | |||
| (d) MB dye using G-Zn50Mg50O composite | |||||
| Source | Sum of Squares | df | Mean Square | F-Value | p-Value |
| Model | 6718.83 | 5 | 1343.77 | 188.68 | <0.0001 |
| A-Photocatalyst dosage | 277.44 | 1 | 277.44 | 38.96 | 0.0015 |
| B-Time | 6105.66 | 1 | 6105.66 | 857.31 | <0.0001 |
| AB | 4.00 | 1 | 4.00 | 0.5616 | 0.4873 |
| A² | 34.09 | 1 | 34.09 | 4.79 | 0.0803 |
| B² | 227.12 | 1 | 227.12 | 31.89 | 0.0024 |
| Residual | 35.61 | 5 | 7.12 | ||
| Lack of Fit | 35.59 | 3 | 11.86 | 1186.32 | |
| Pure Error | 0.0200 | 2 | 0.0100 | ||
| Cor Total | 6754.44 | 10 | |||
Publisher’s Note: MDPI stays neutral with regard to jurisdictional claims in published maps and institutional affiliations. |
© 2022 by the authors. Licensee MDPI, Basel, Switzerland. This article is an open access article distributed under the terms and conditions of the Creative Commons Attribution (CC BY) license (https://creativecommons.org/licenses/by/4.0/).
Share and Cite
Pachiyappan, J.; Nirmala, G.; Sivamani, S.; Govindasamy, R.; Thiruvengadam, M.; Derkho, M.; Burkov, P.; Popovich, A.; Gribkova, V. Biogenic Synthesis, Characterization, and Photocatalytic Evaluation of Pristine and Graphene-Loaded Zn50Mg50O Nanocomposites for Organic Dyes Removal. Nanomaterials 2022, 12, 2809. https://doi.org/10.3390/nano12162809
Pachiyappan J, Nirmala G, Sivamani S, Govindasamy R, Thiruvengadam M, Derkho M, Burkov P, Popovich A, Gribkova V. Biogenic Synthesis, Characterization, and Photocatalytic Evaluation of Pristine and Graphene-Loaded Zn50Mg50O Nanocomposites for Organic Dyes Removal. Nanomaterials. 2022; 12(16):2809. https://doi.org/10.3390/nano12162809
Chicago/Turabian StylePachiyappan, Jayakaran, Gnanasundaram Nirmala, Selvaraju Sivamani, Rajakumar Govindasamy, Muthu Thiruvengadam, Marina Derkho, Pavel Burkov, Aleksey Popovich, and Vera Gribkova. 2022. "Biogenic Synthesis, Characterization, and Photocatalytic Evaluation of Pristine and Graphene-Loaded Zn50Mg50O Nanocomposites for Organic Dyes Removal" Nanomaterials 12, no. 16: 2809. https://doi.org/10.3390/nano12162809
APA StylePachiyappan, J., Nirmala, G., Sivamani, S., Govindasamy, R., Thiruvengadam, M., Derkho, M., Burkov, P., Popovich, A., & Gribkova, V. (2022). Biogenic Synthesis, Characterization, and Photocatalytic Evaluation of Pristine and Graphene-Loaded Zn50Mg50O Nanocomposites for Organic Dyes Removal. Nanomaterials, 12(16), 2809. https://doi.org/10.3390/nano12162809