
Rheology of Emulsions Thickened by Starch Nanoparticles


Abstract
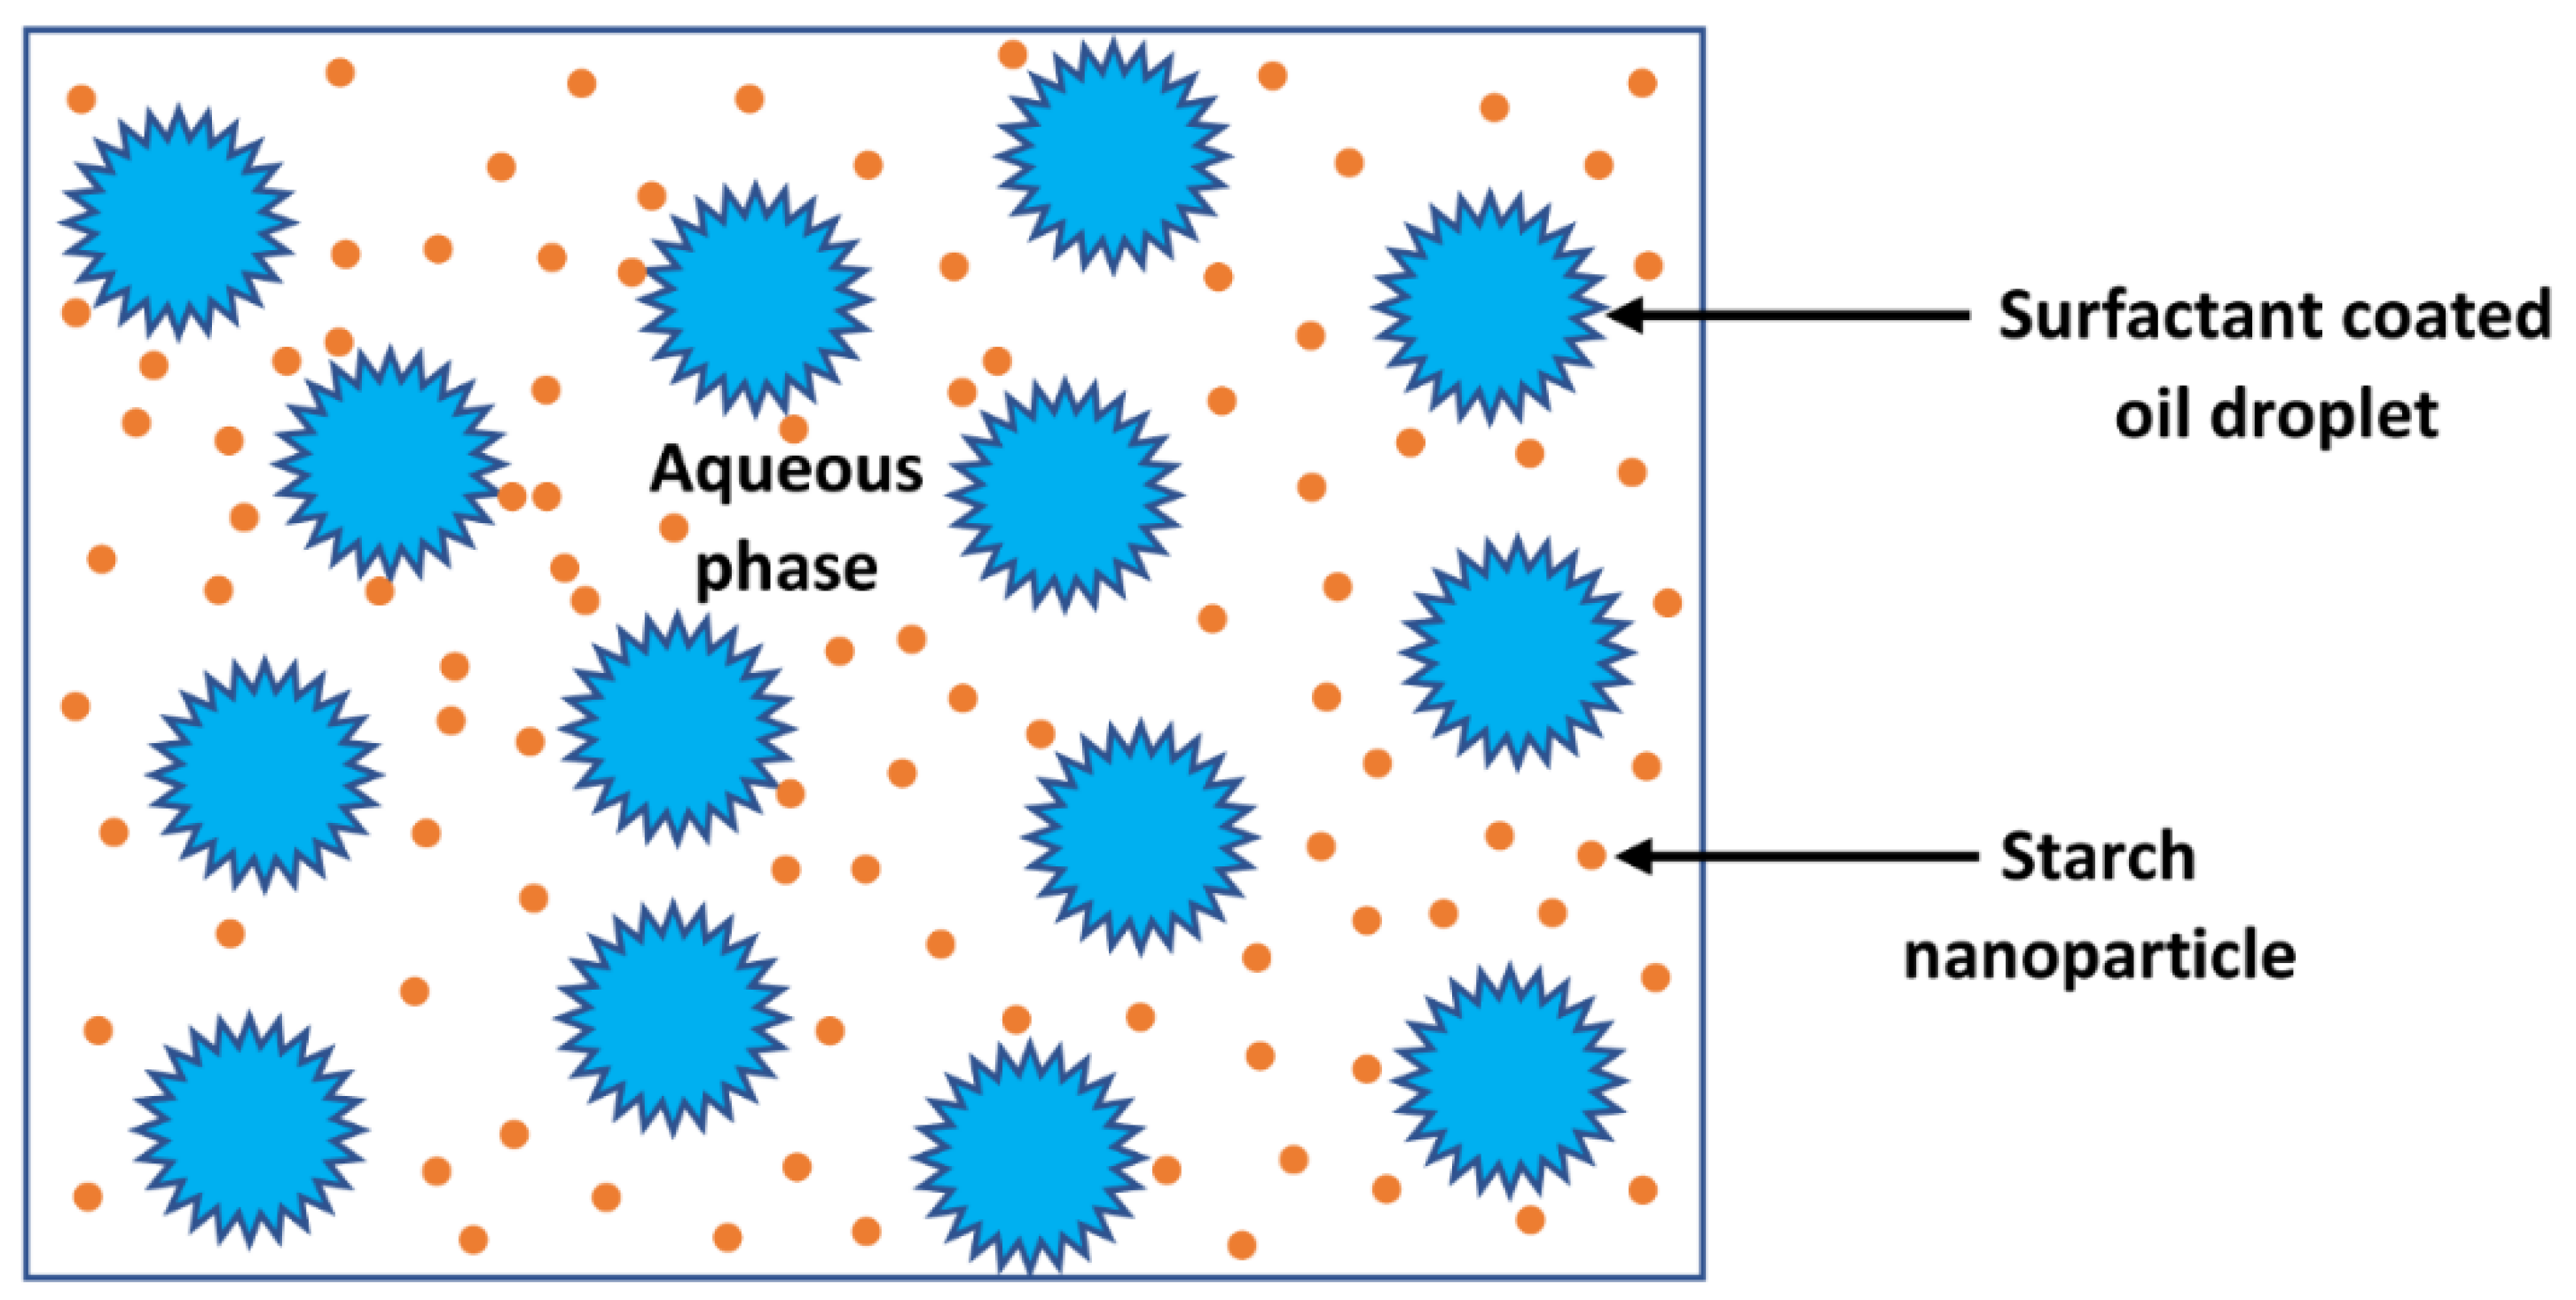
:1. Introduction
2. Experimental Work
2.1. Materials
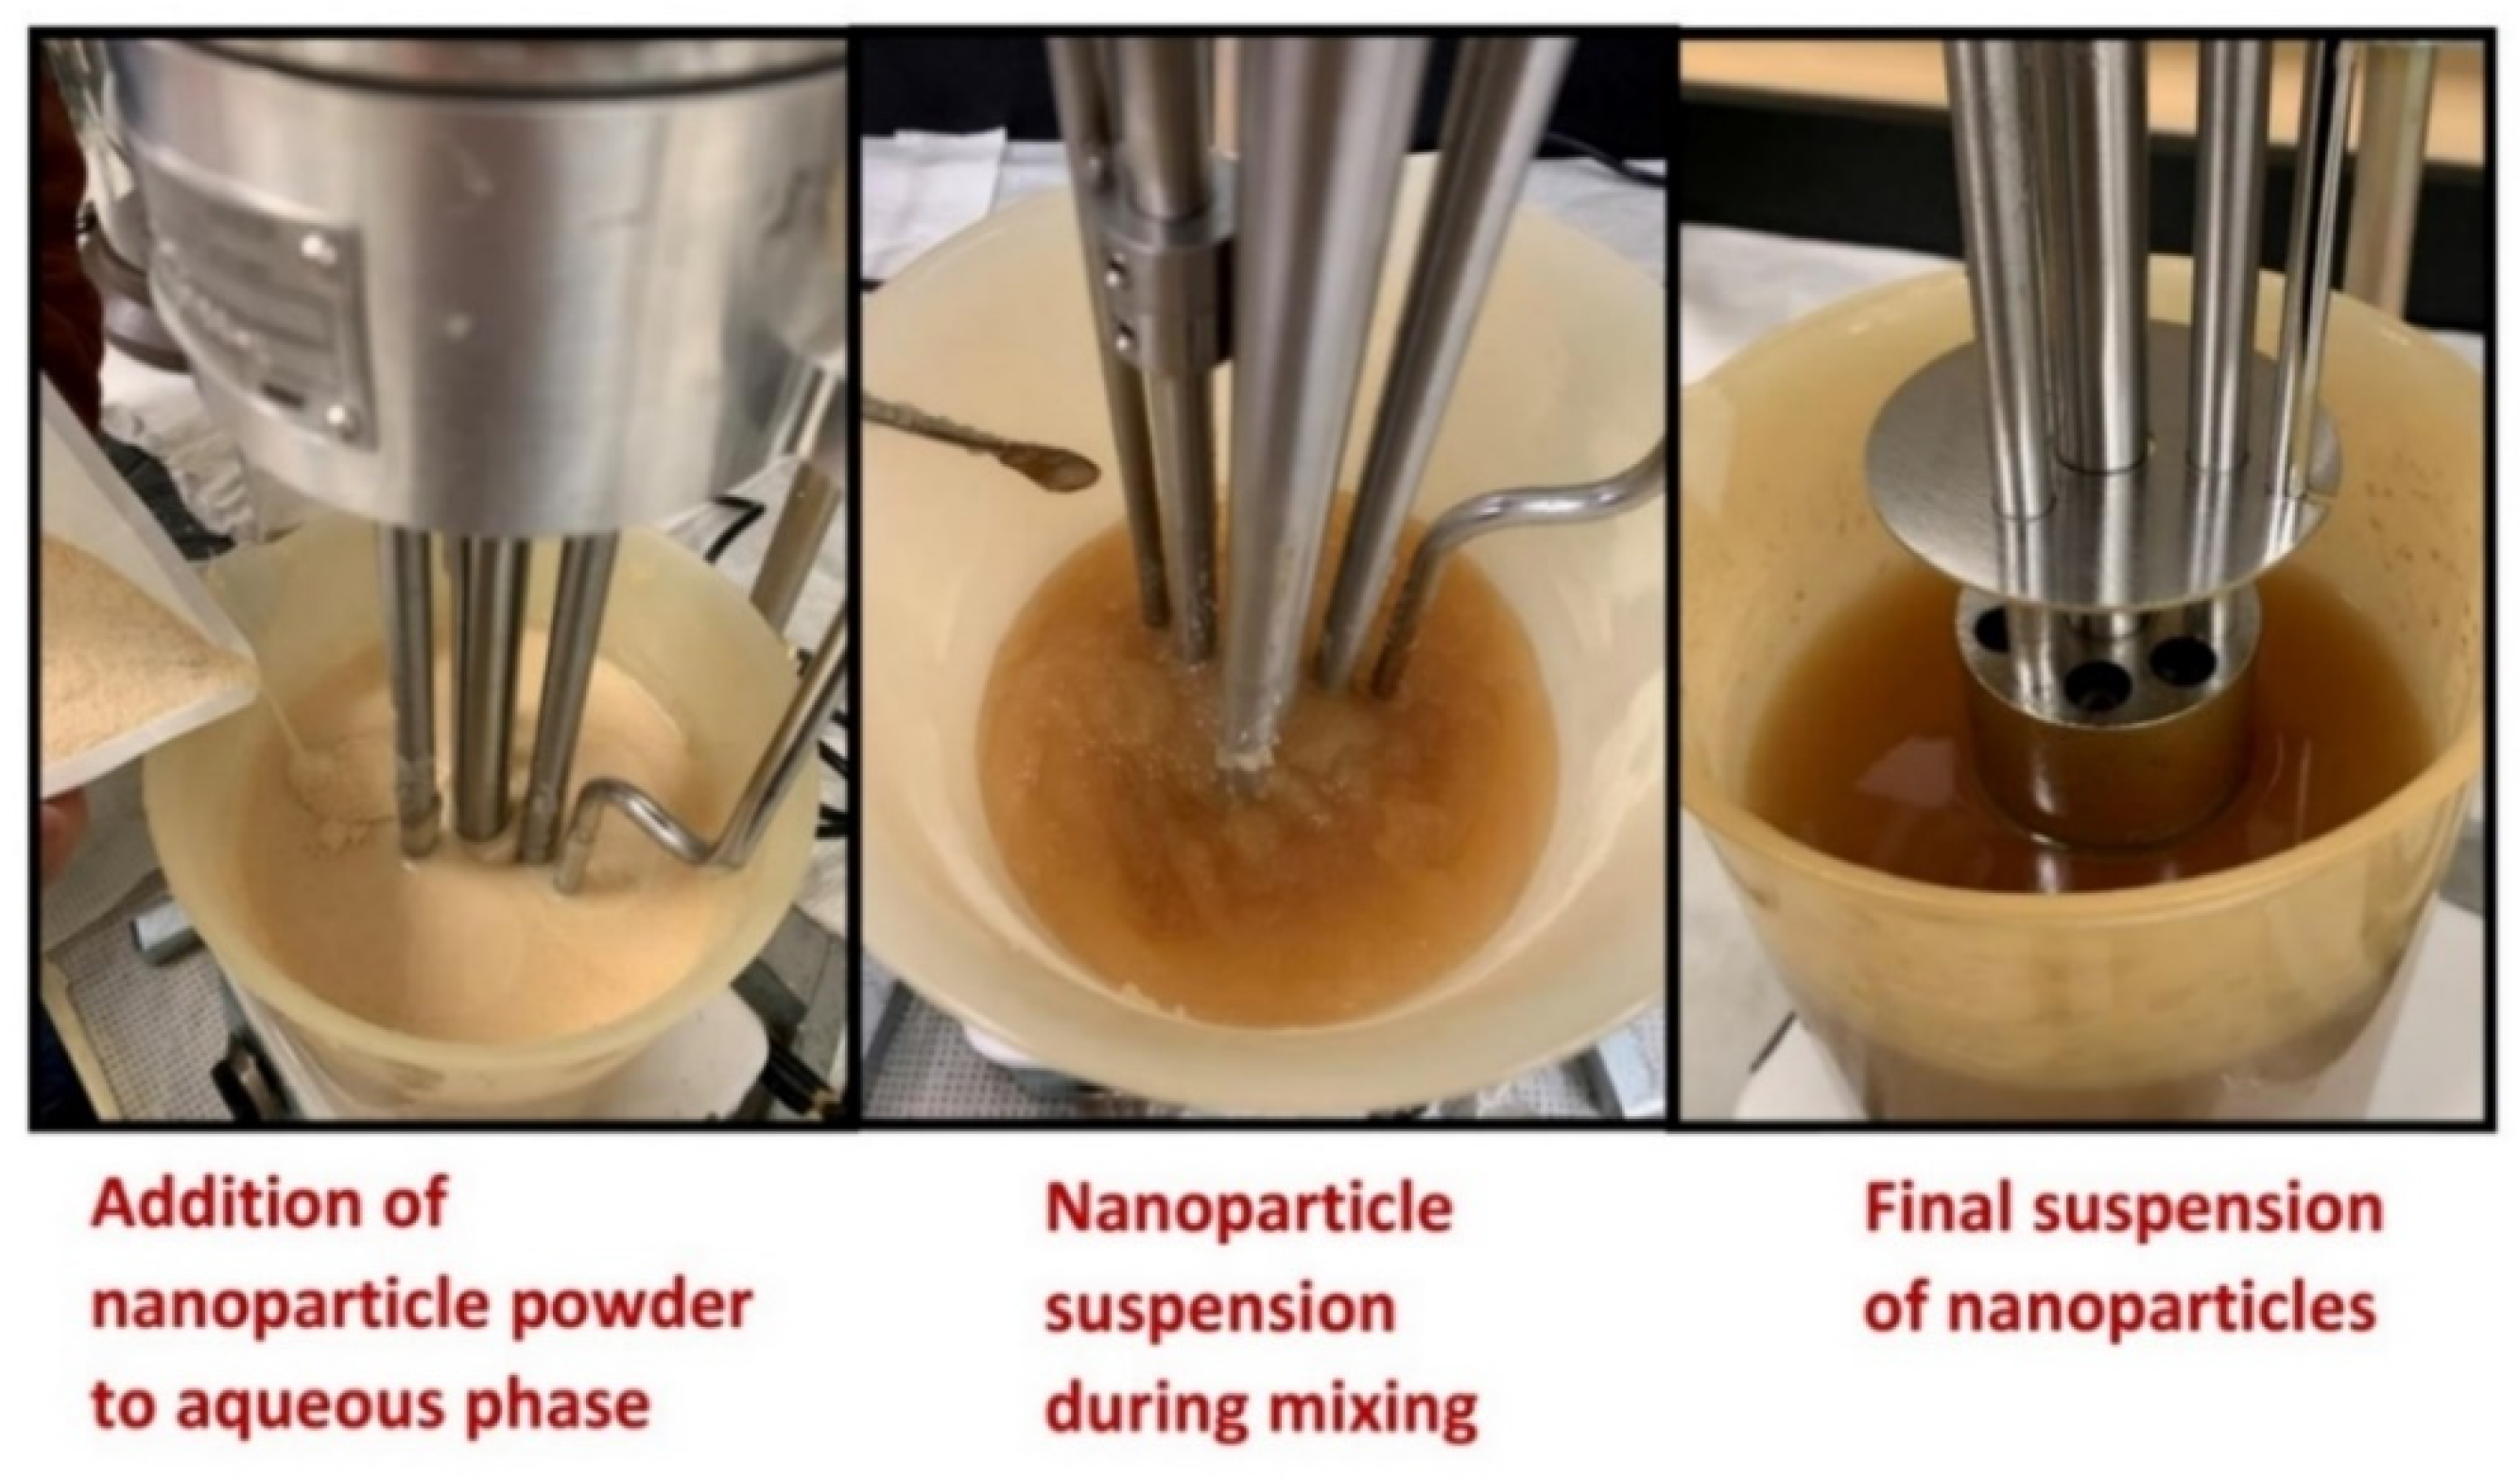
2.2. Preparation of Nanoparticle Suspensions
2.3. Preparation of O/W Emulsions
2.4. Measurements
3. Results and Discussion
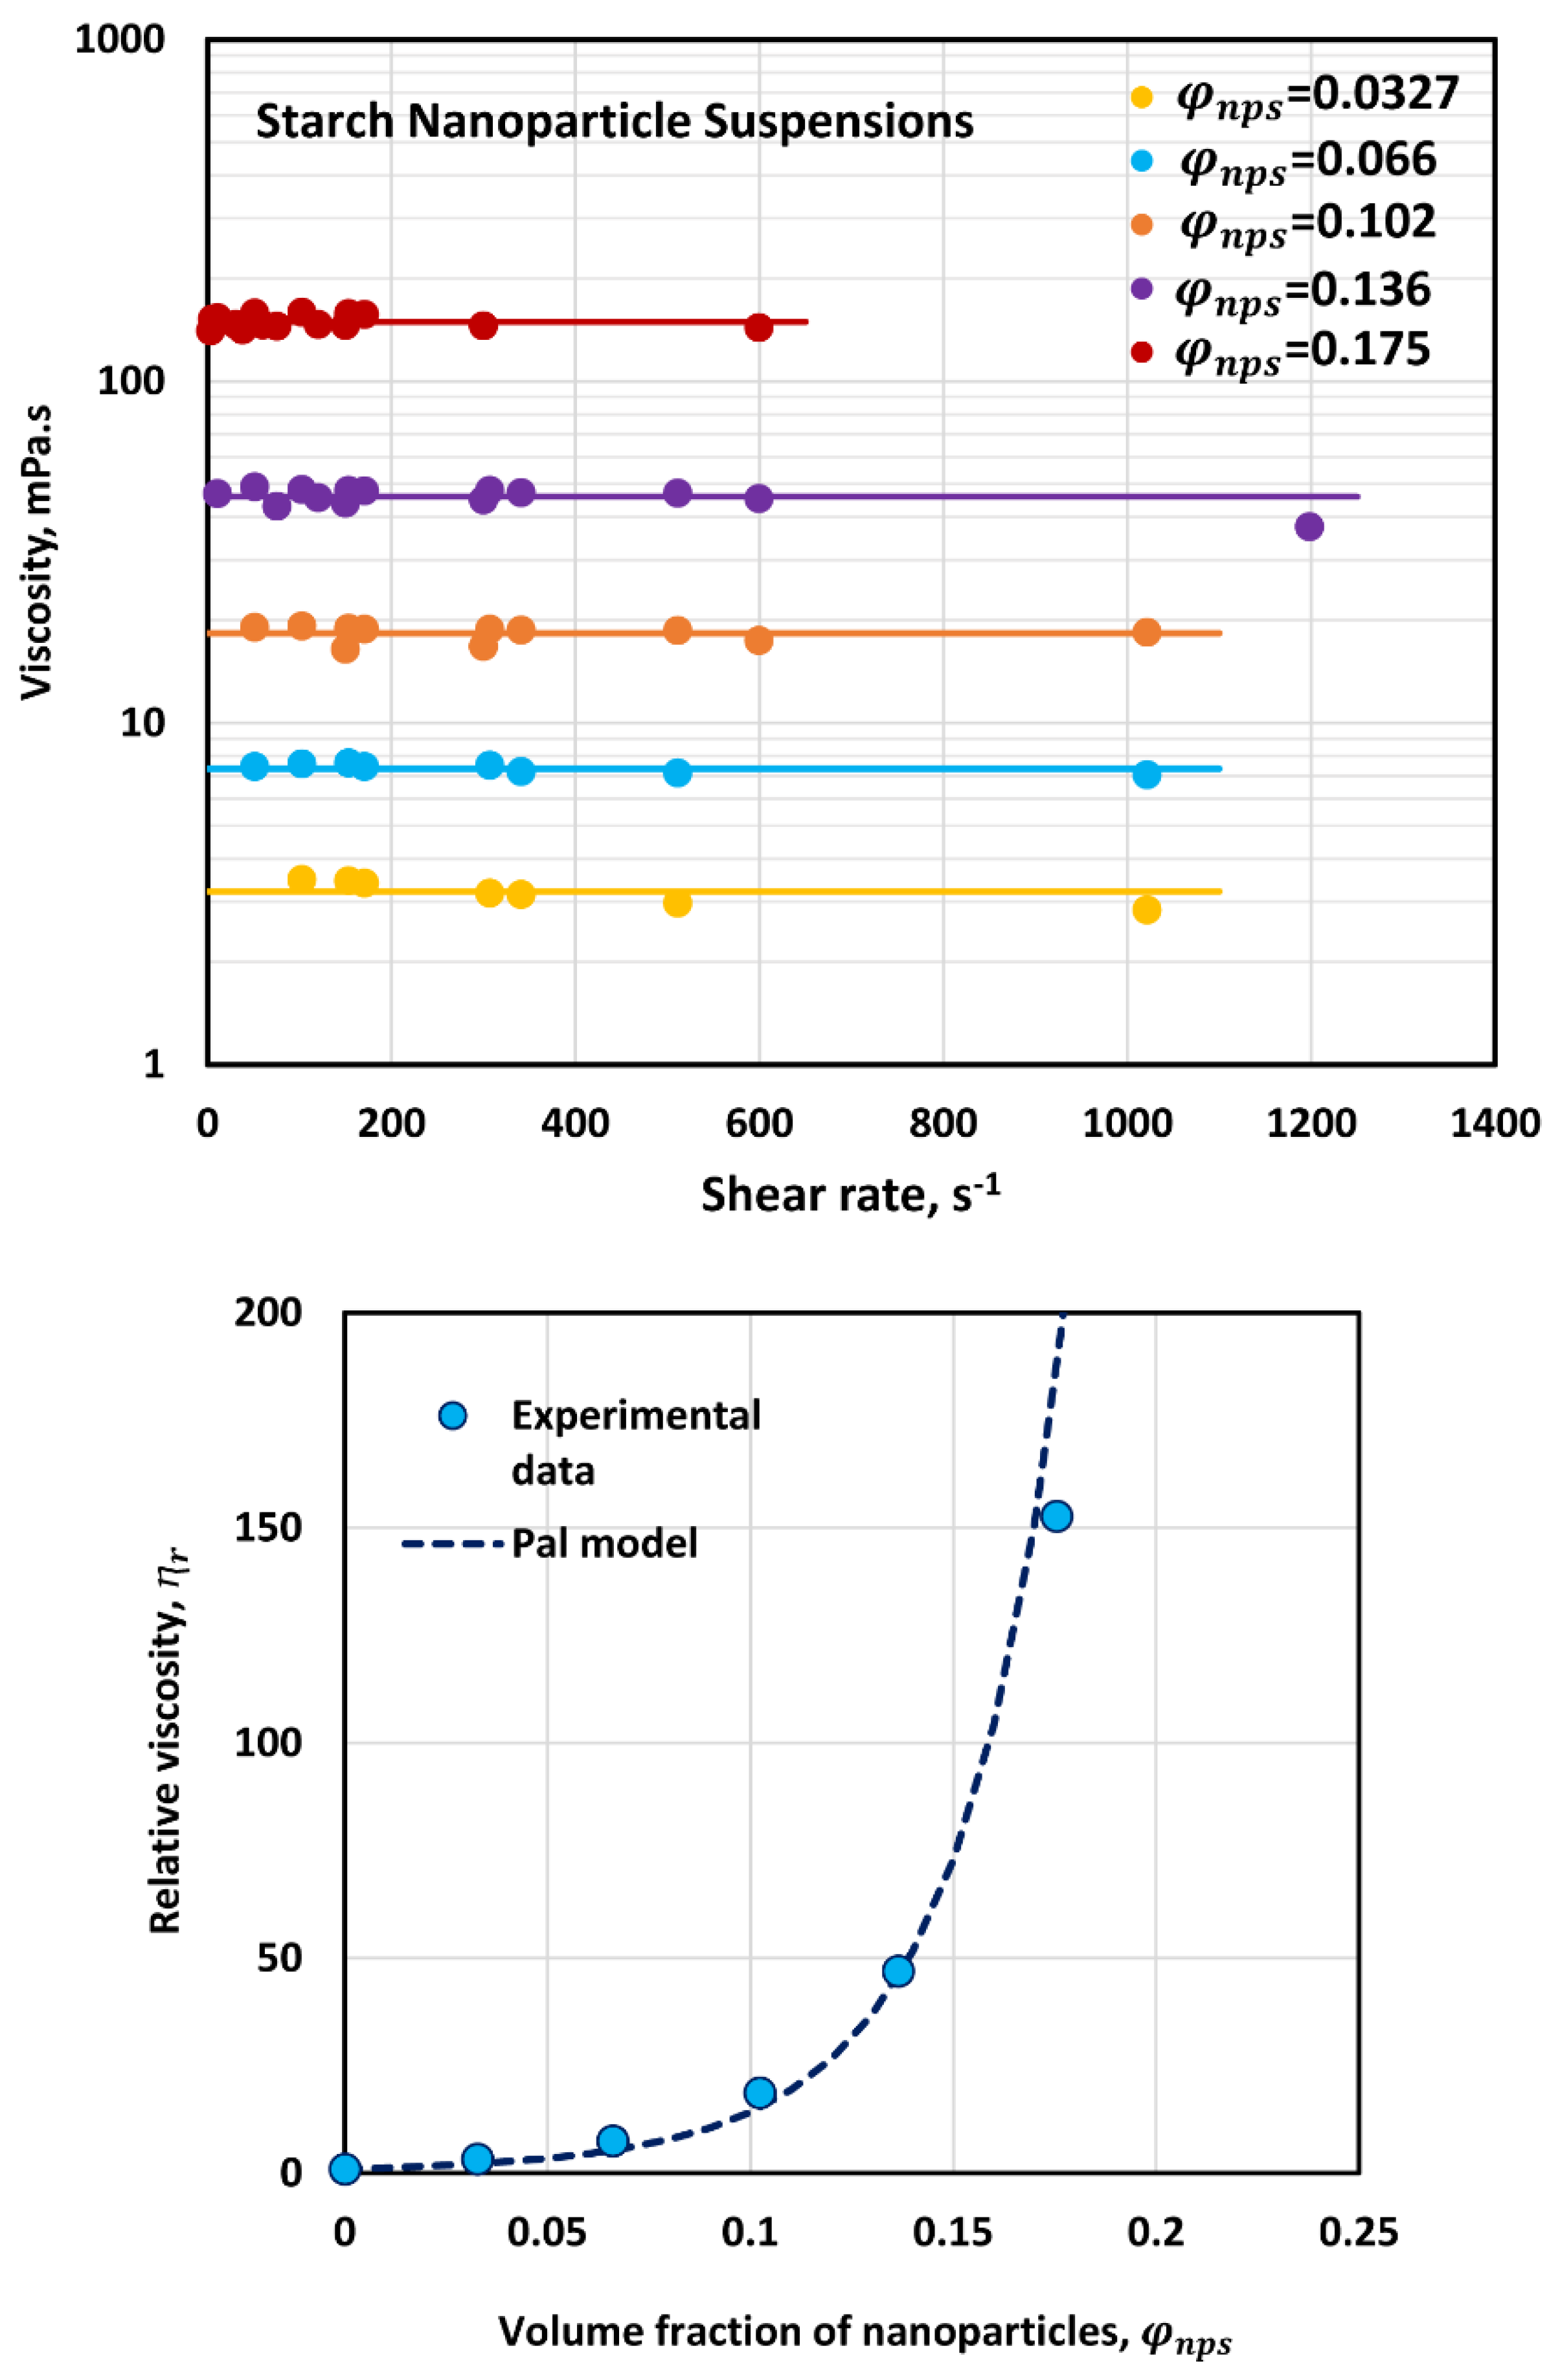
3.1. Rheology of Nanoparticle Suspensions
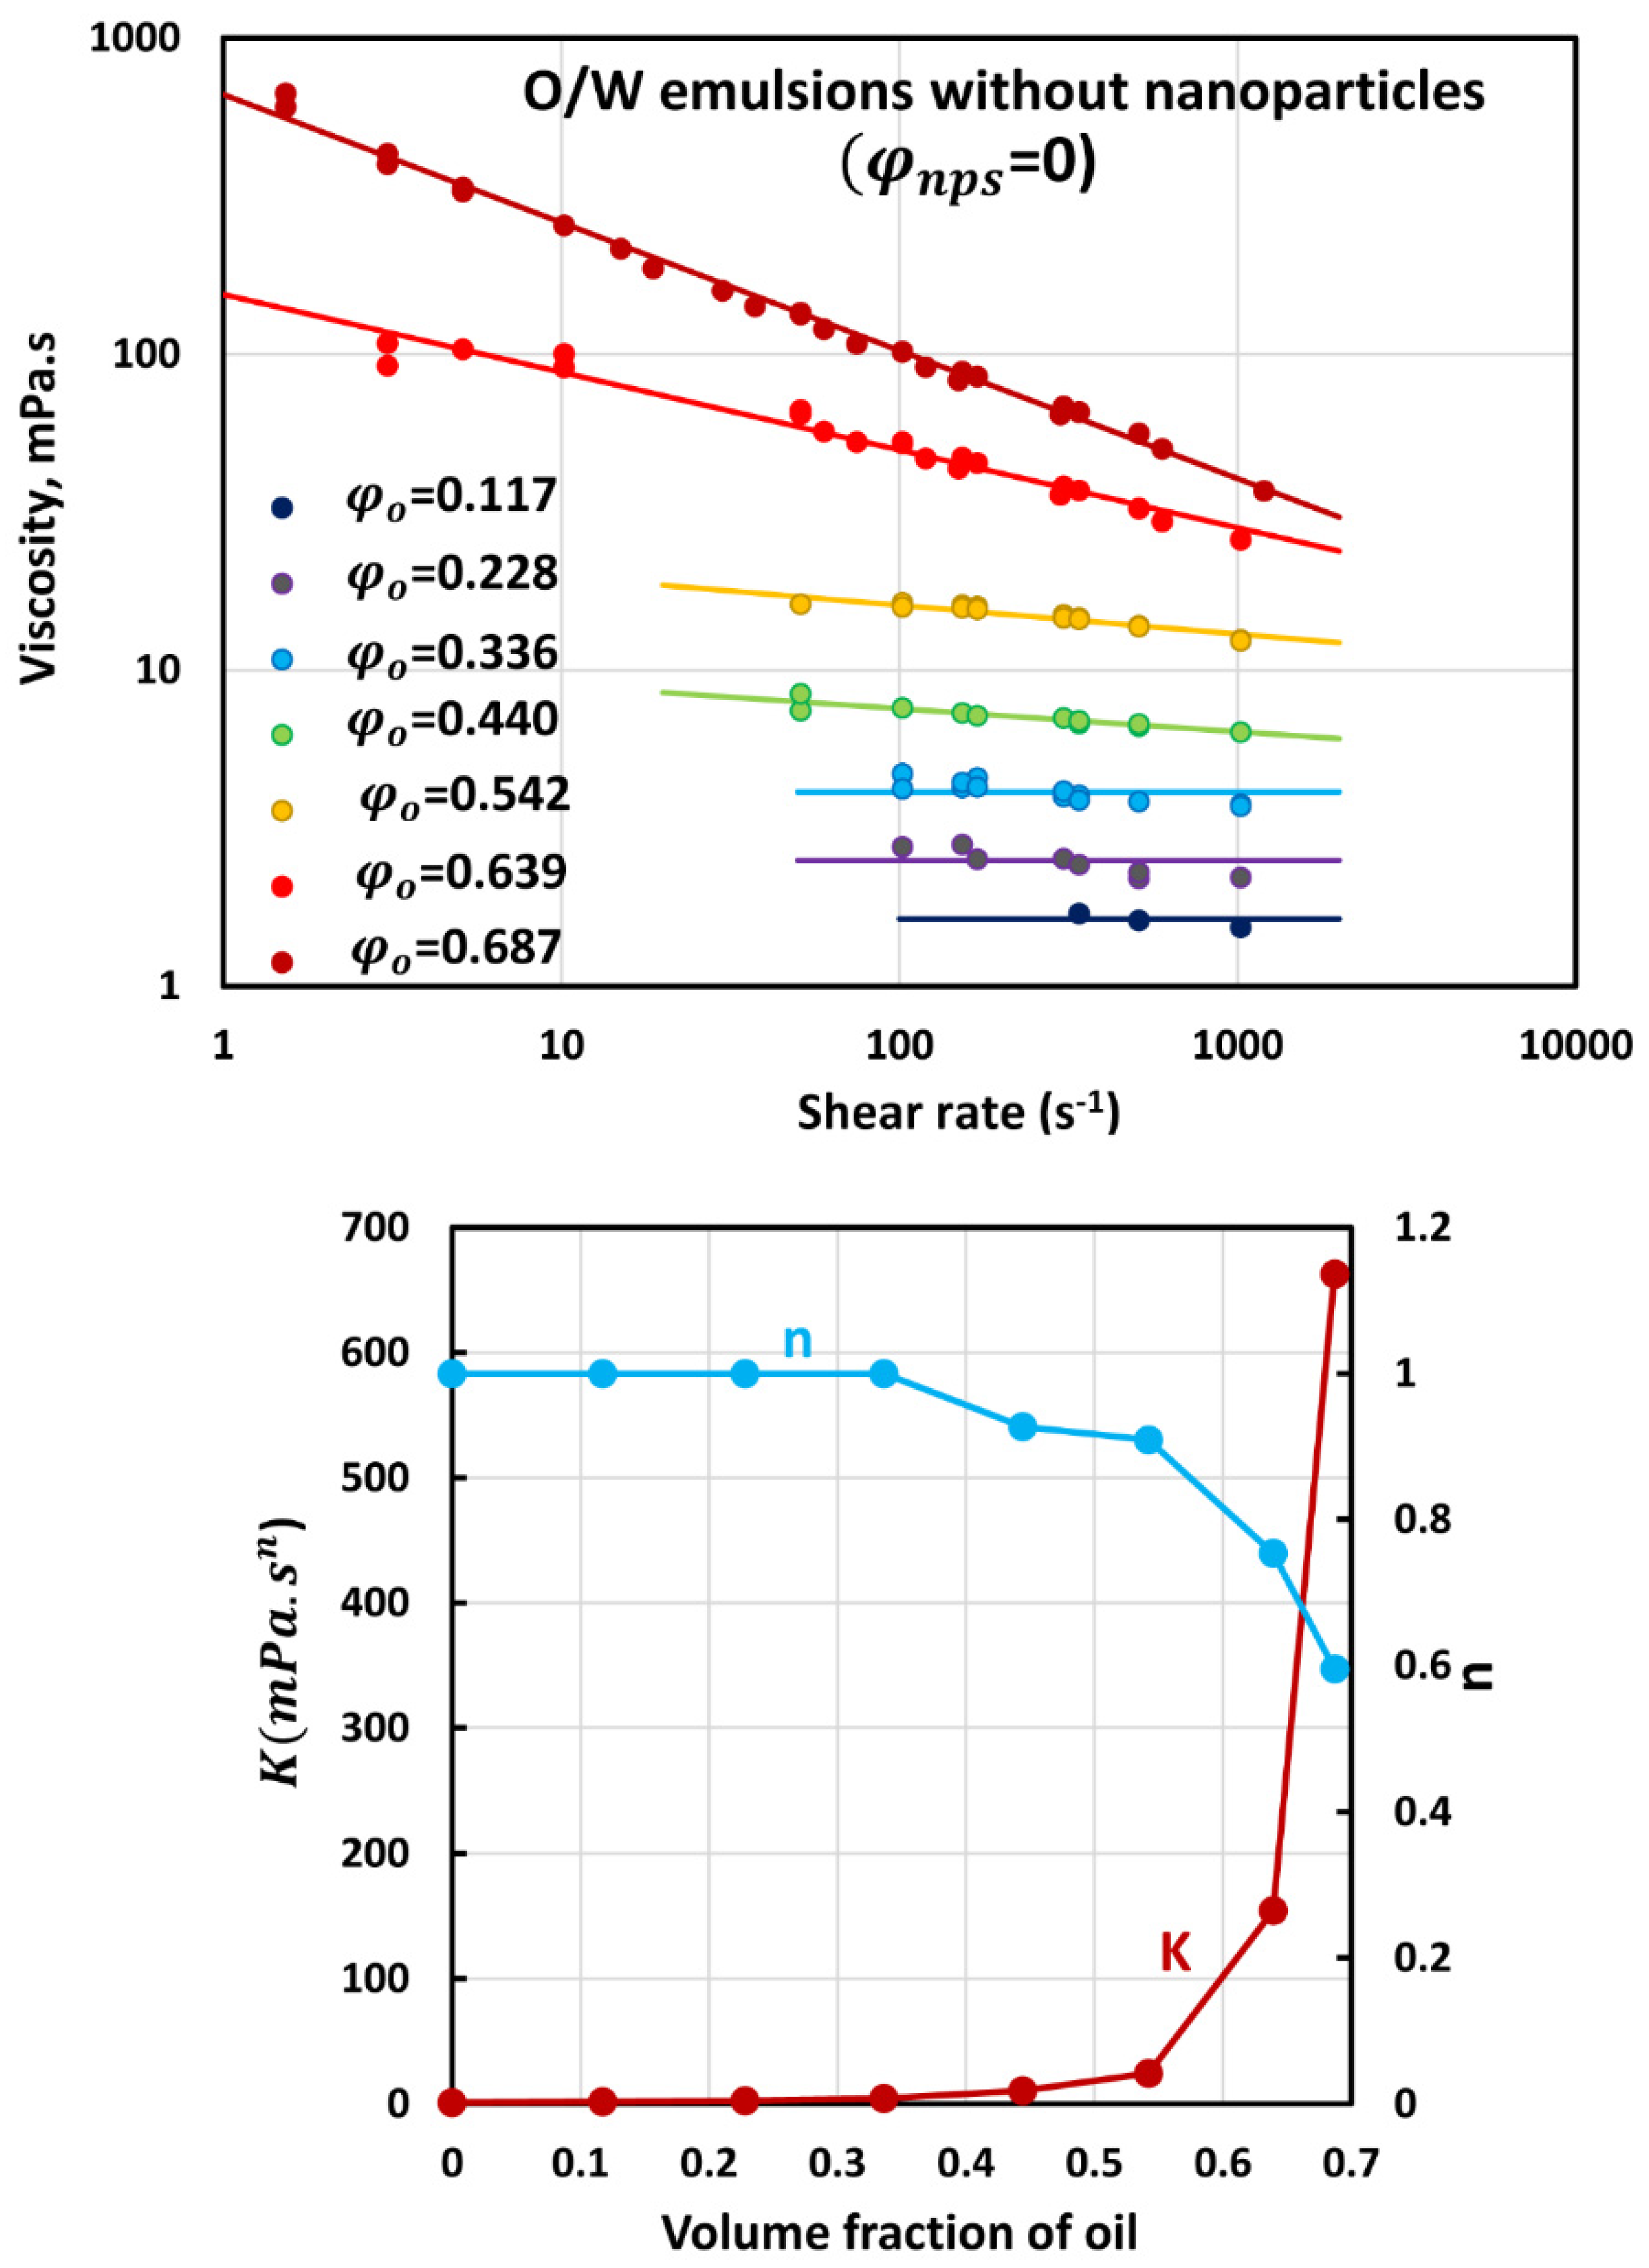
3.2. Rheology of O/W Emulsions without Nanoparticles
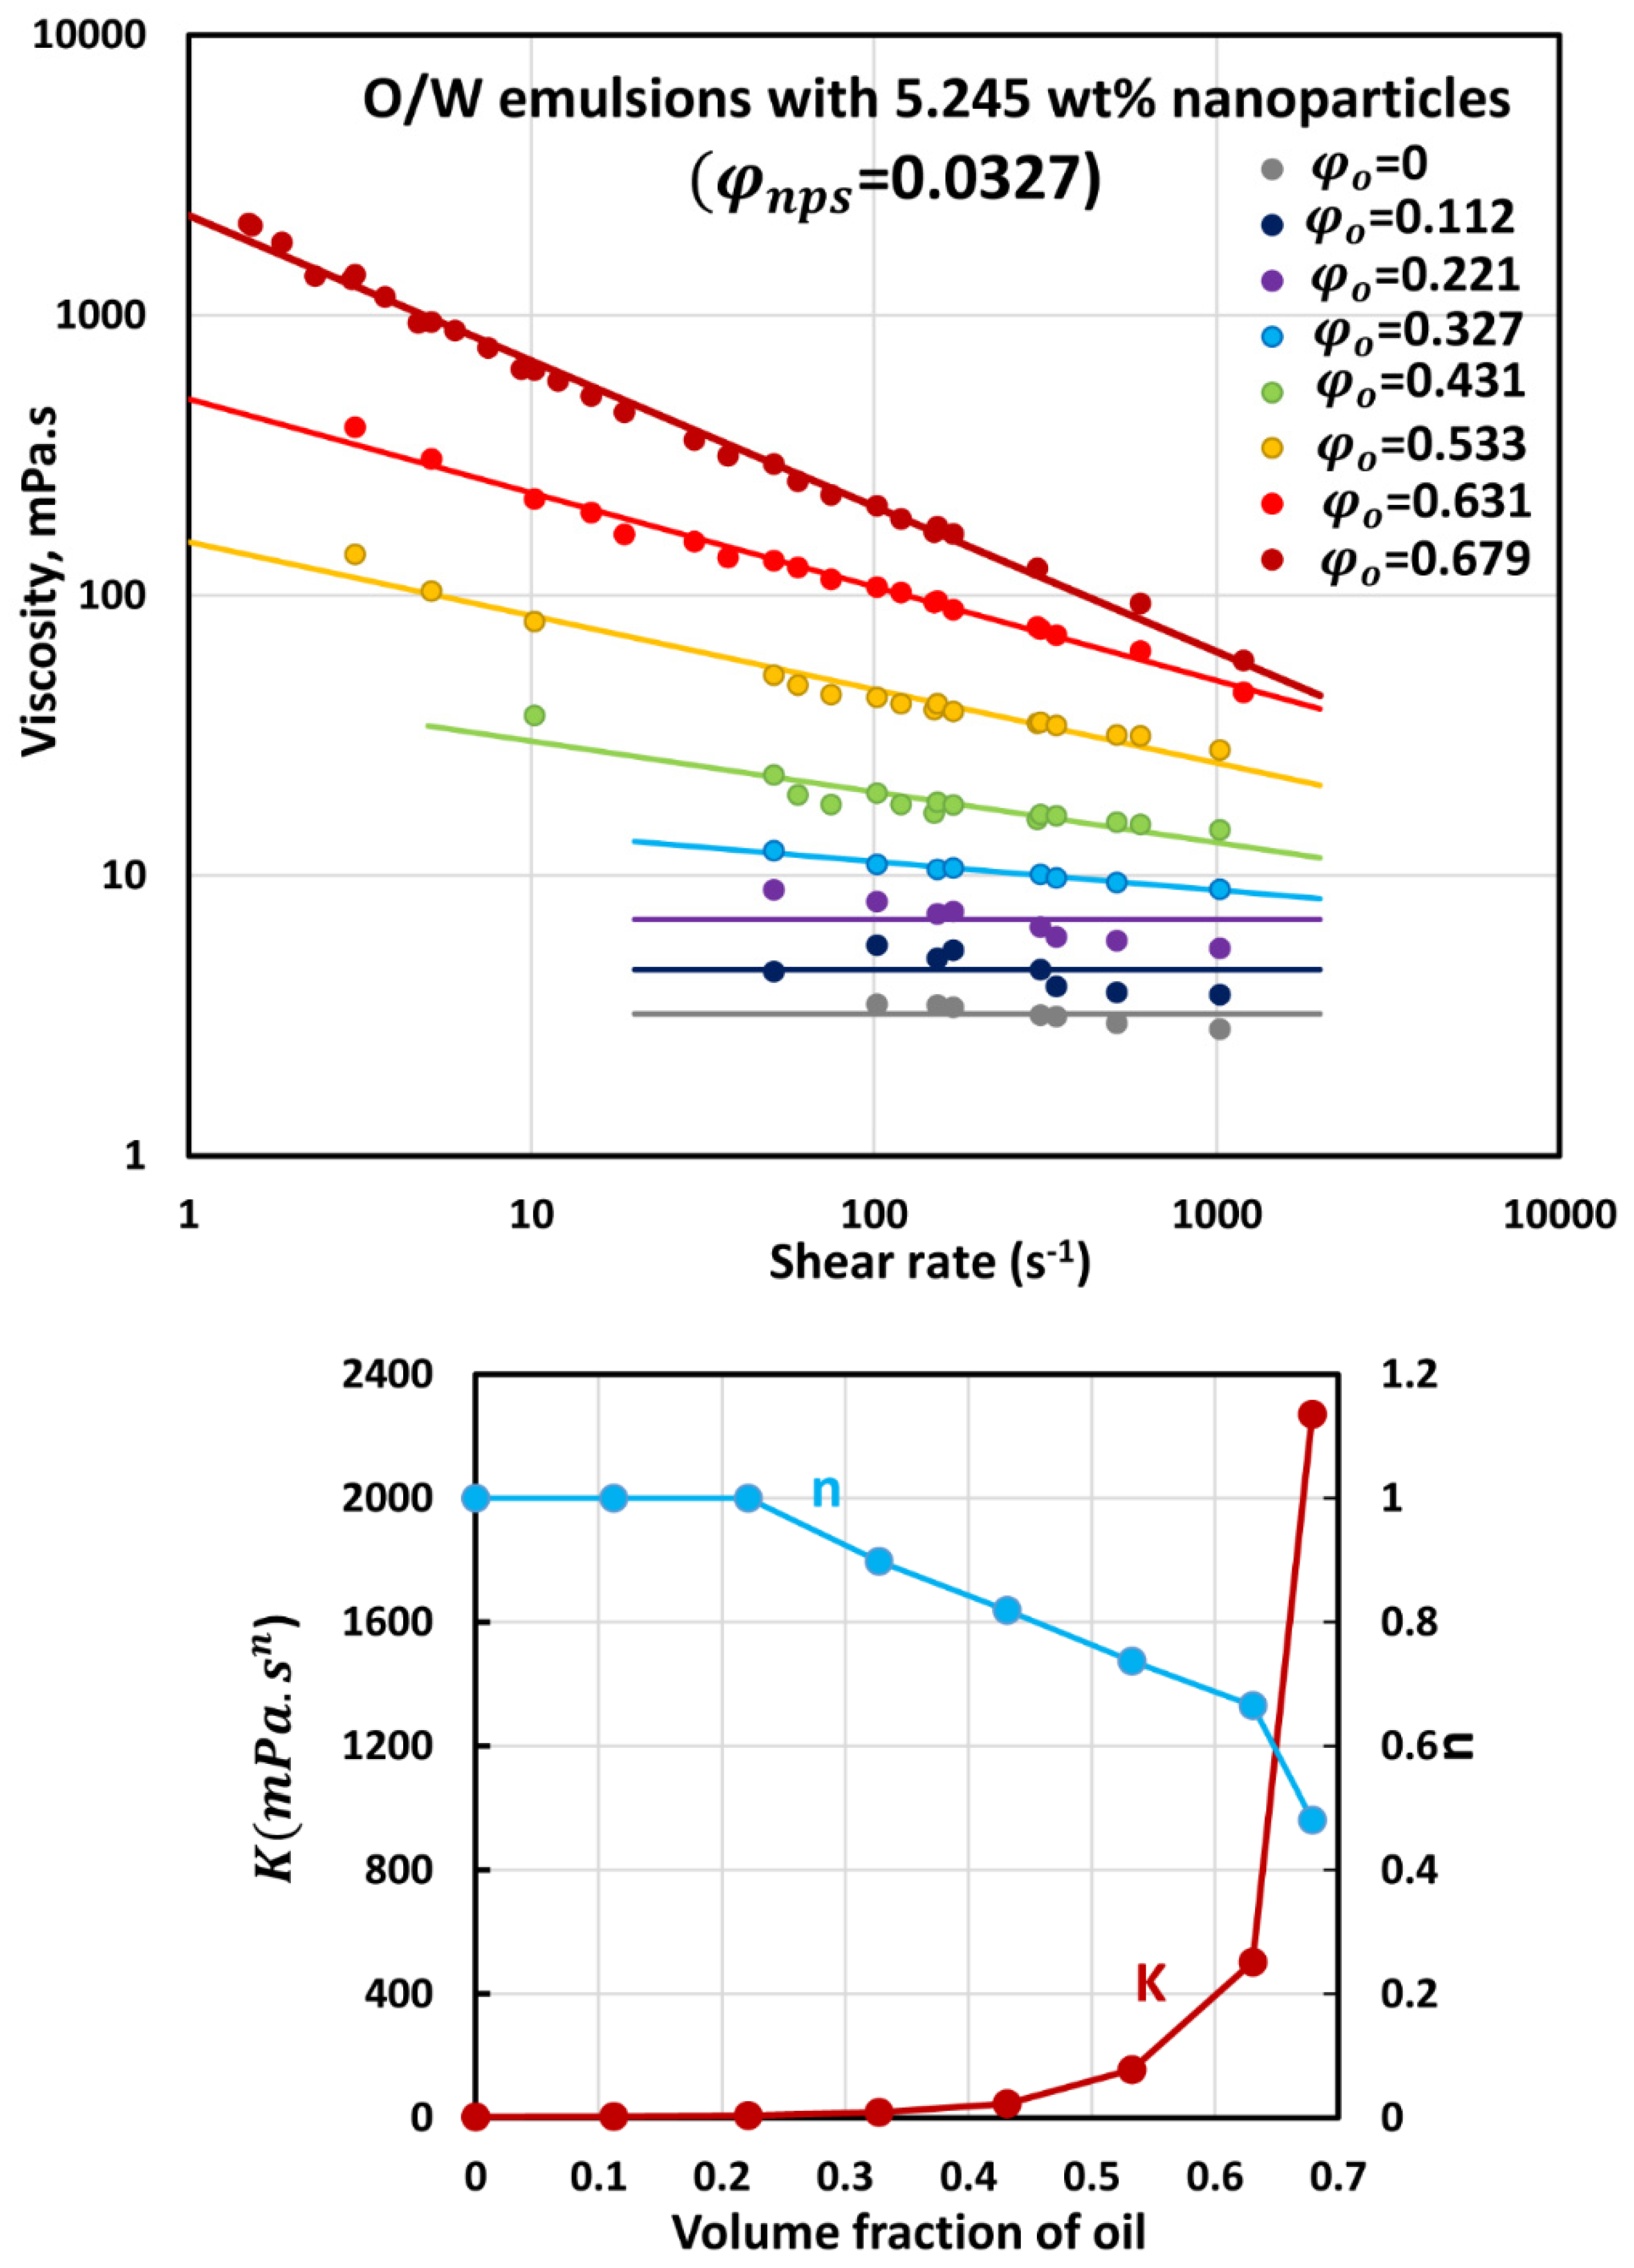
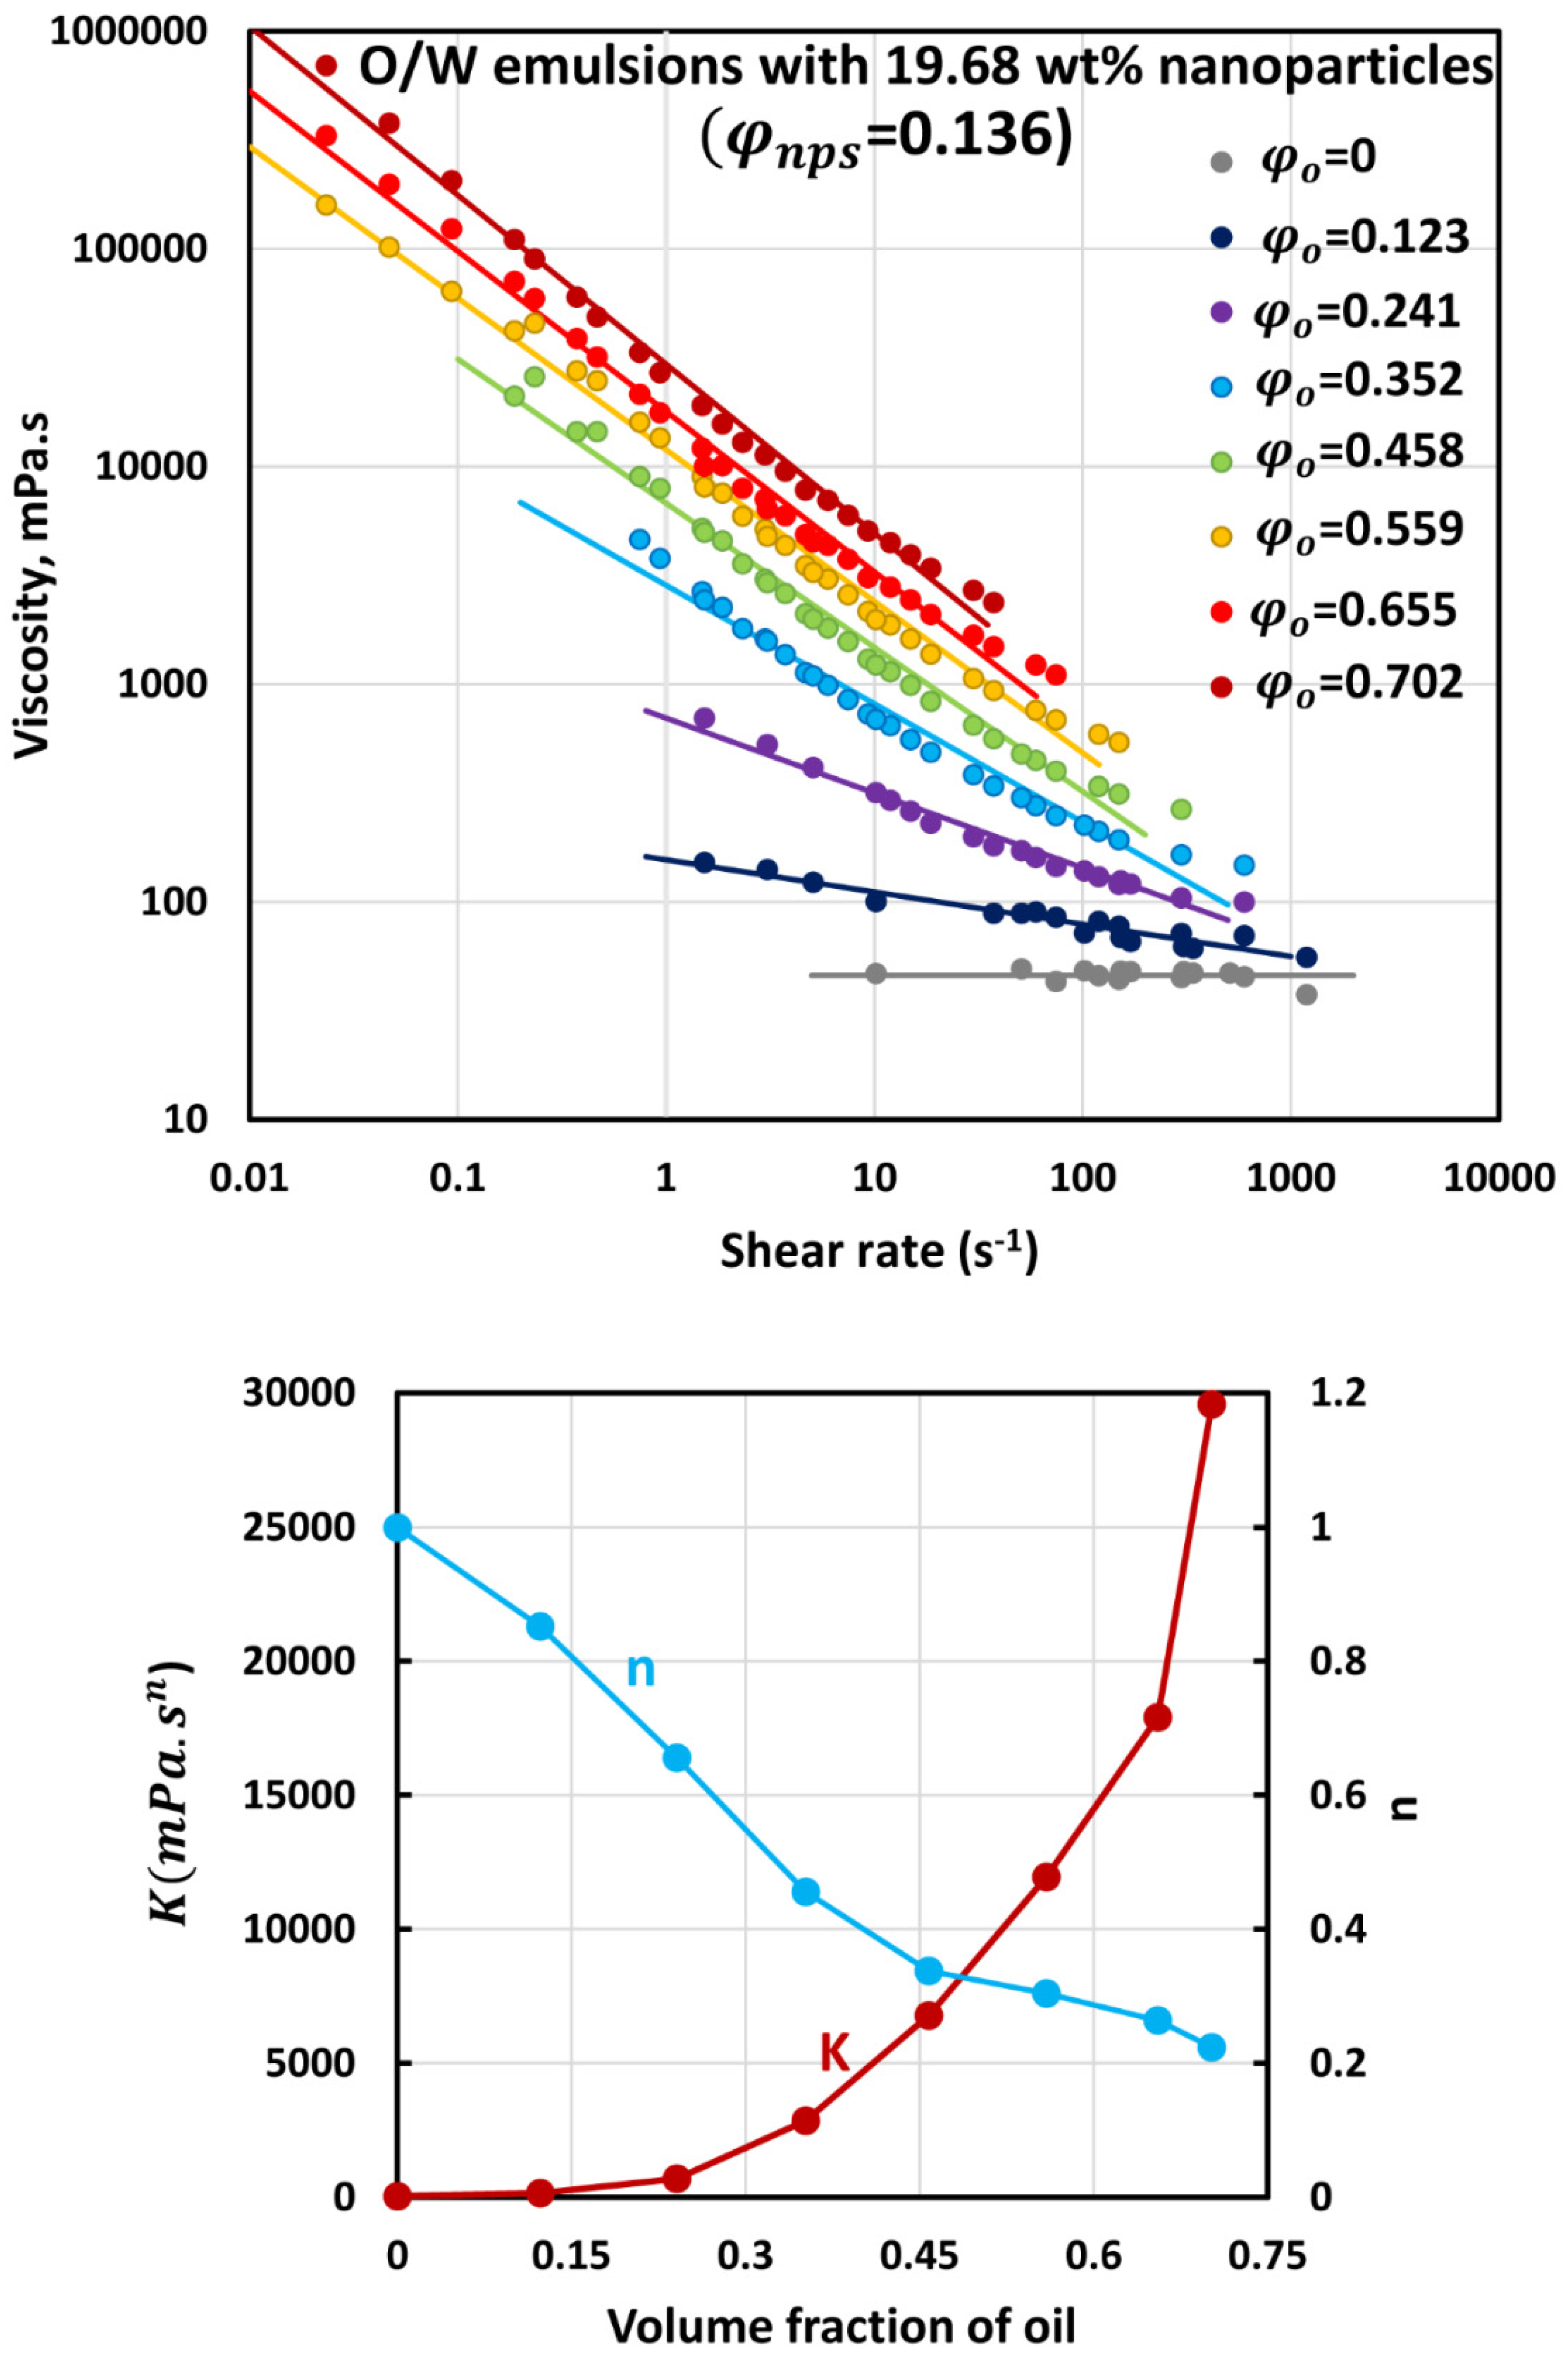
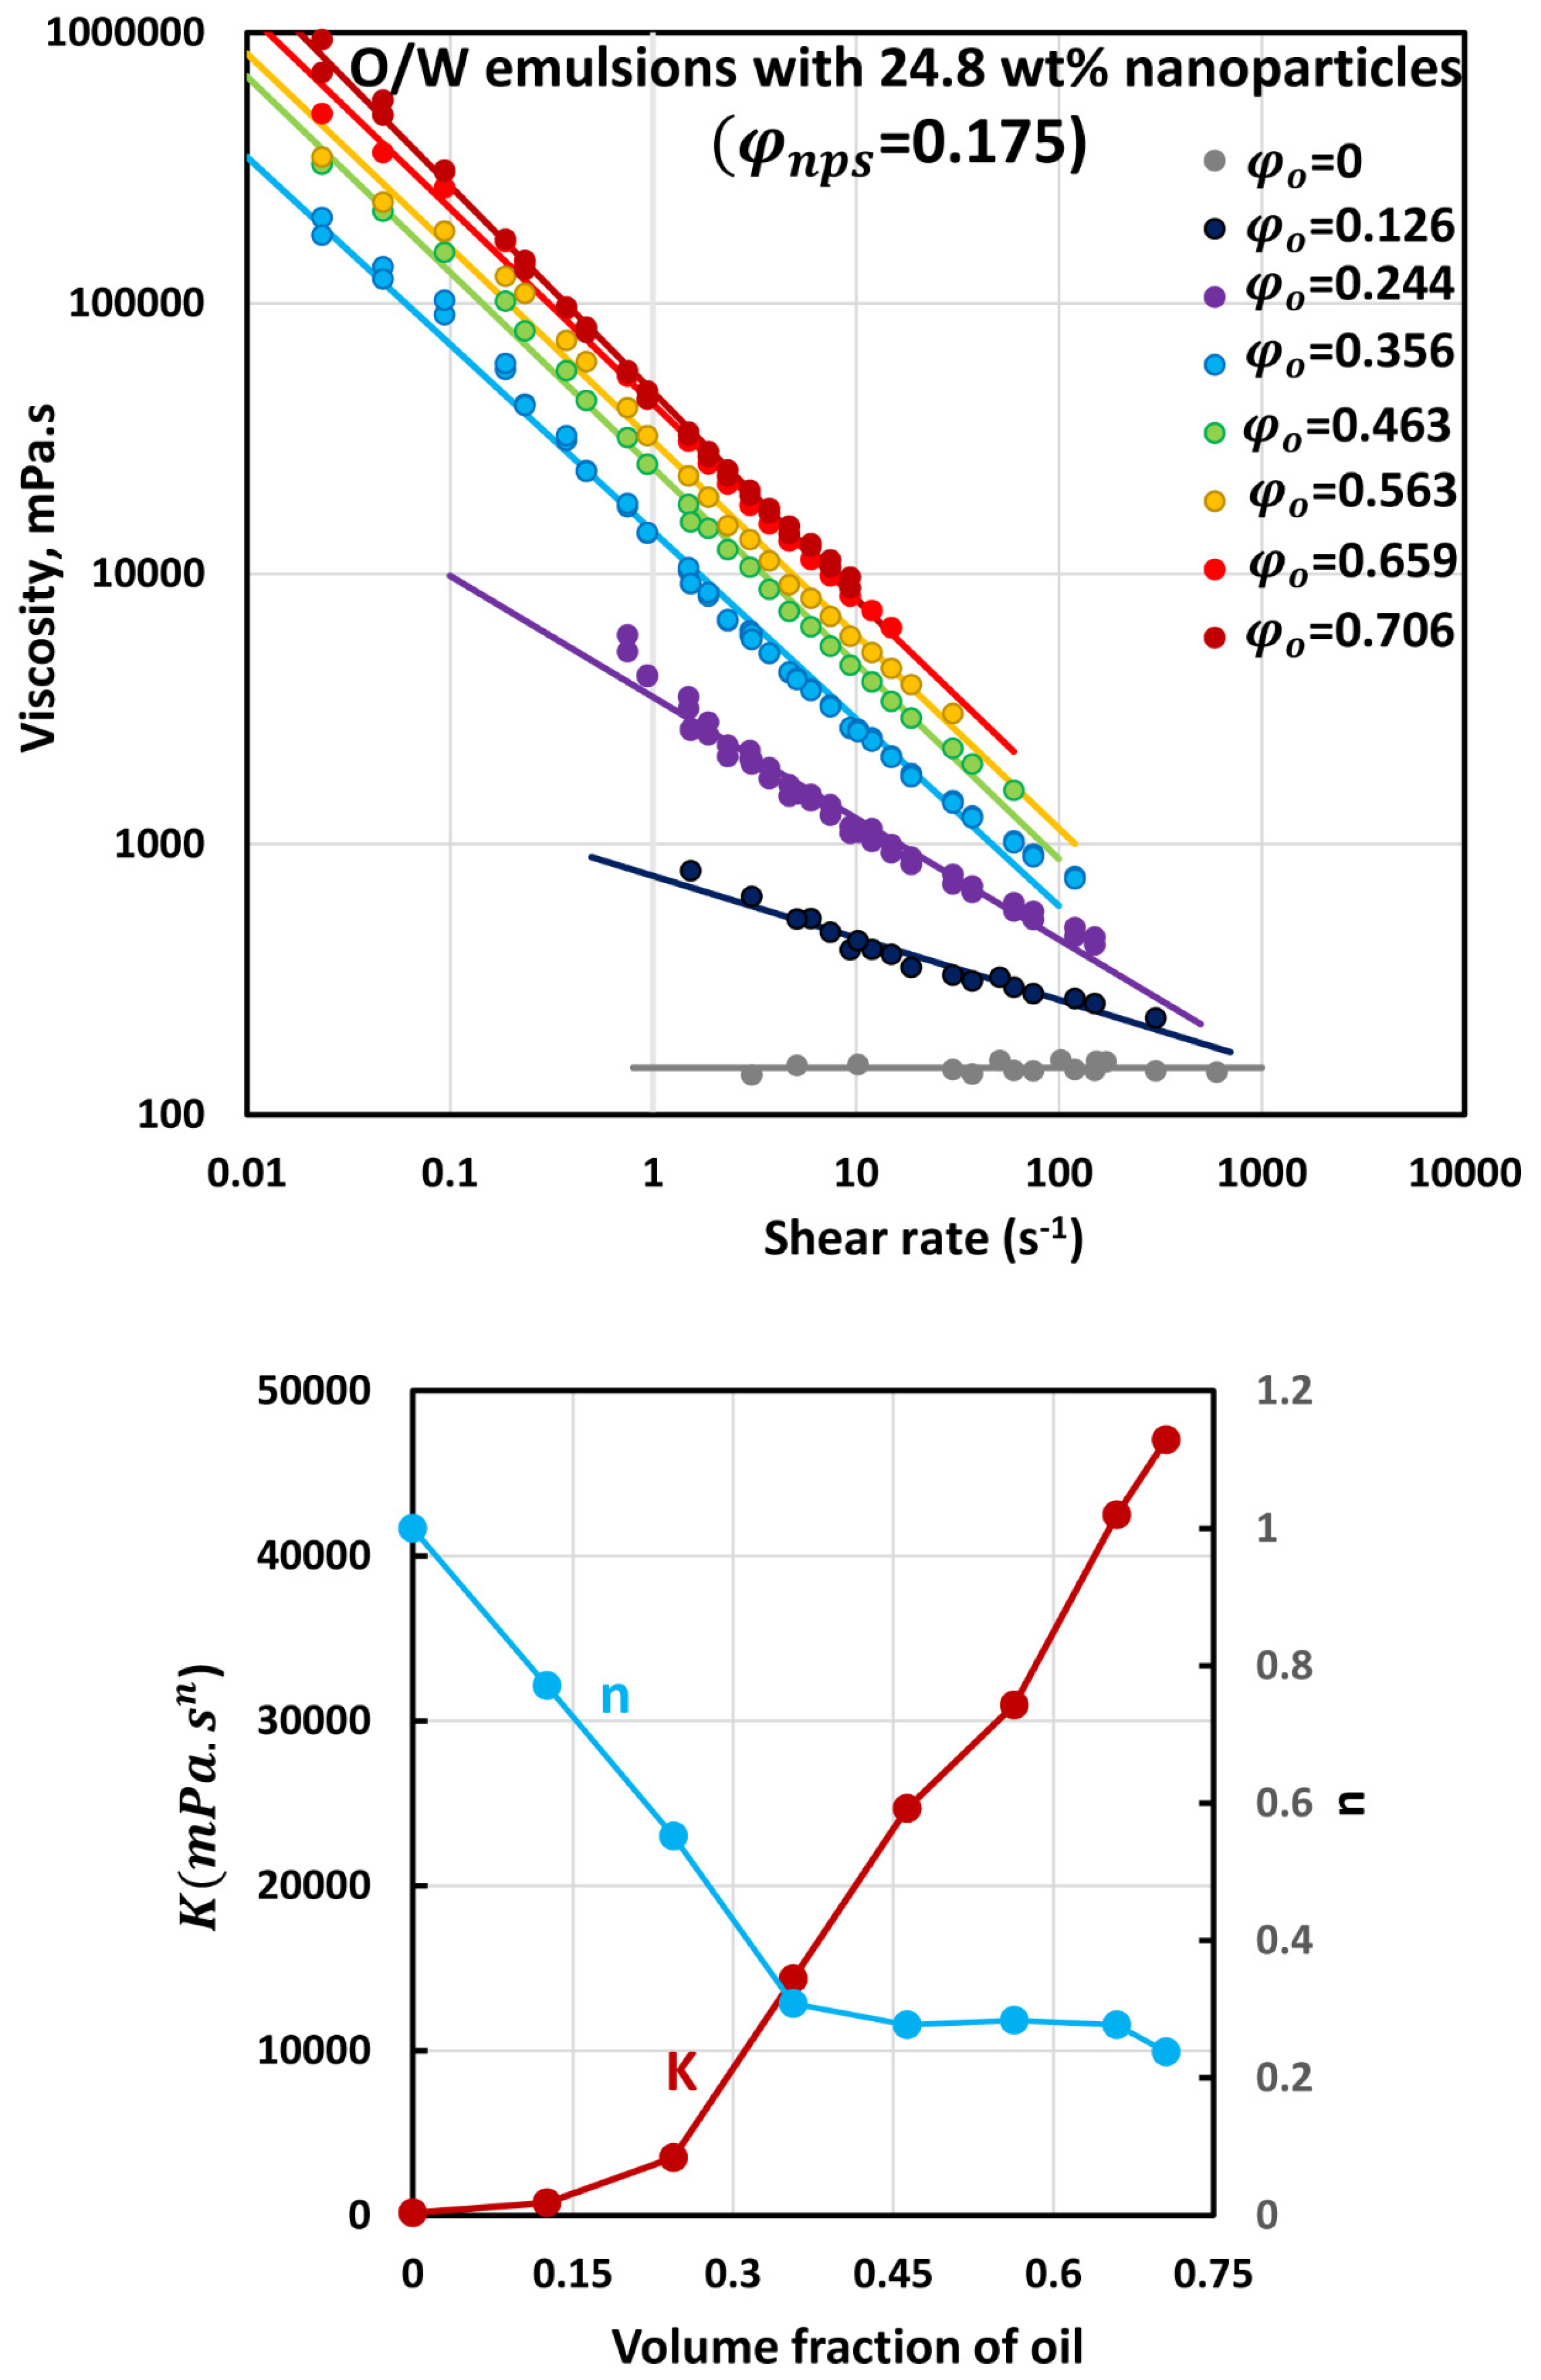
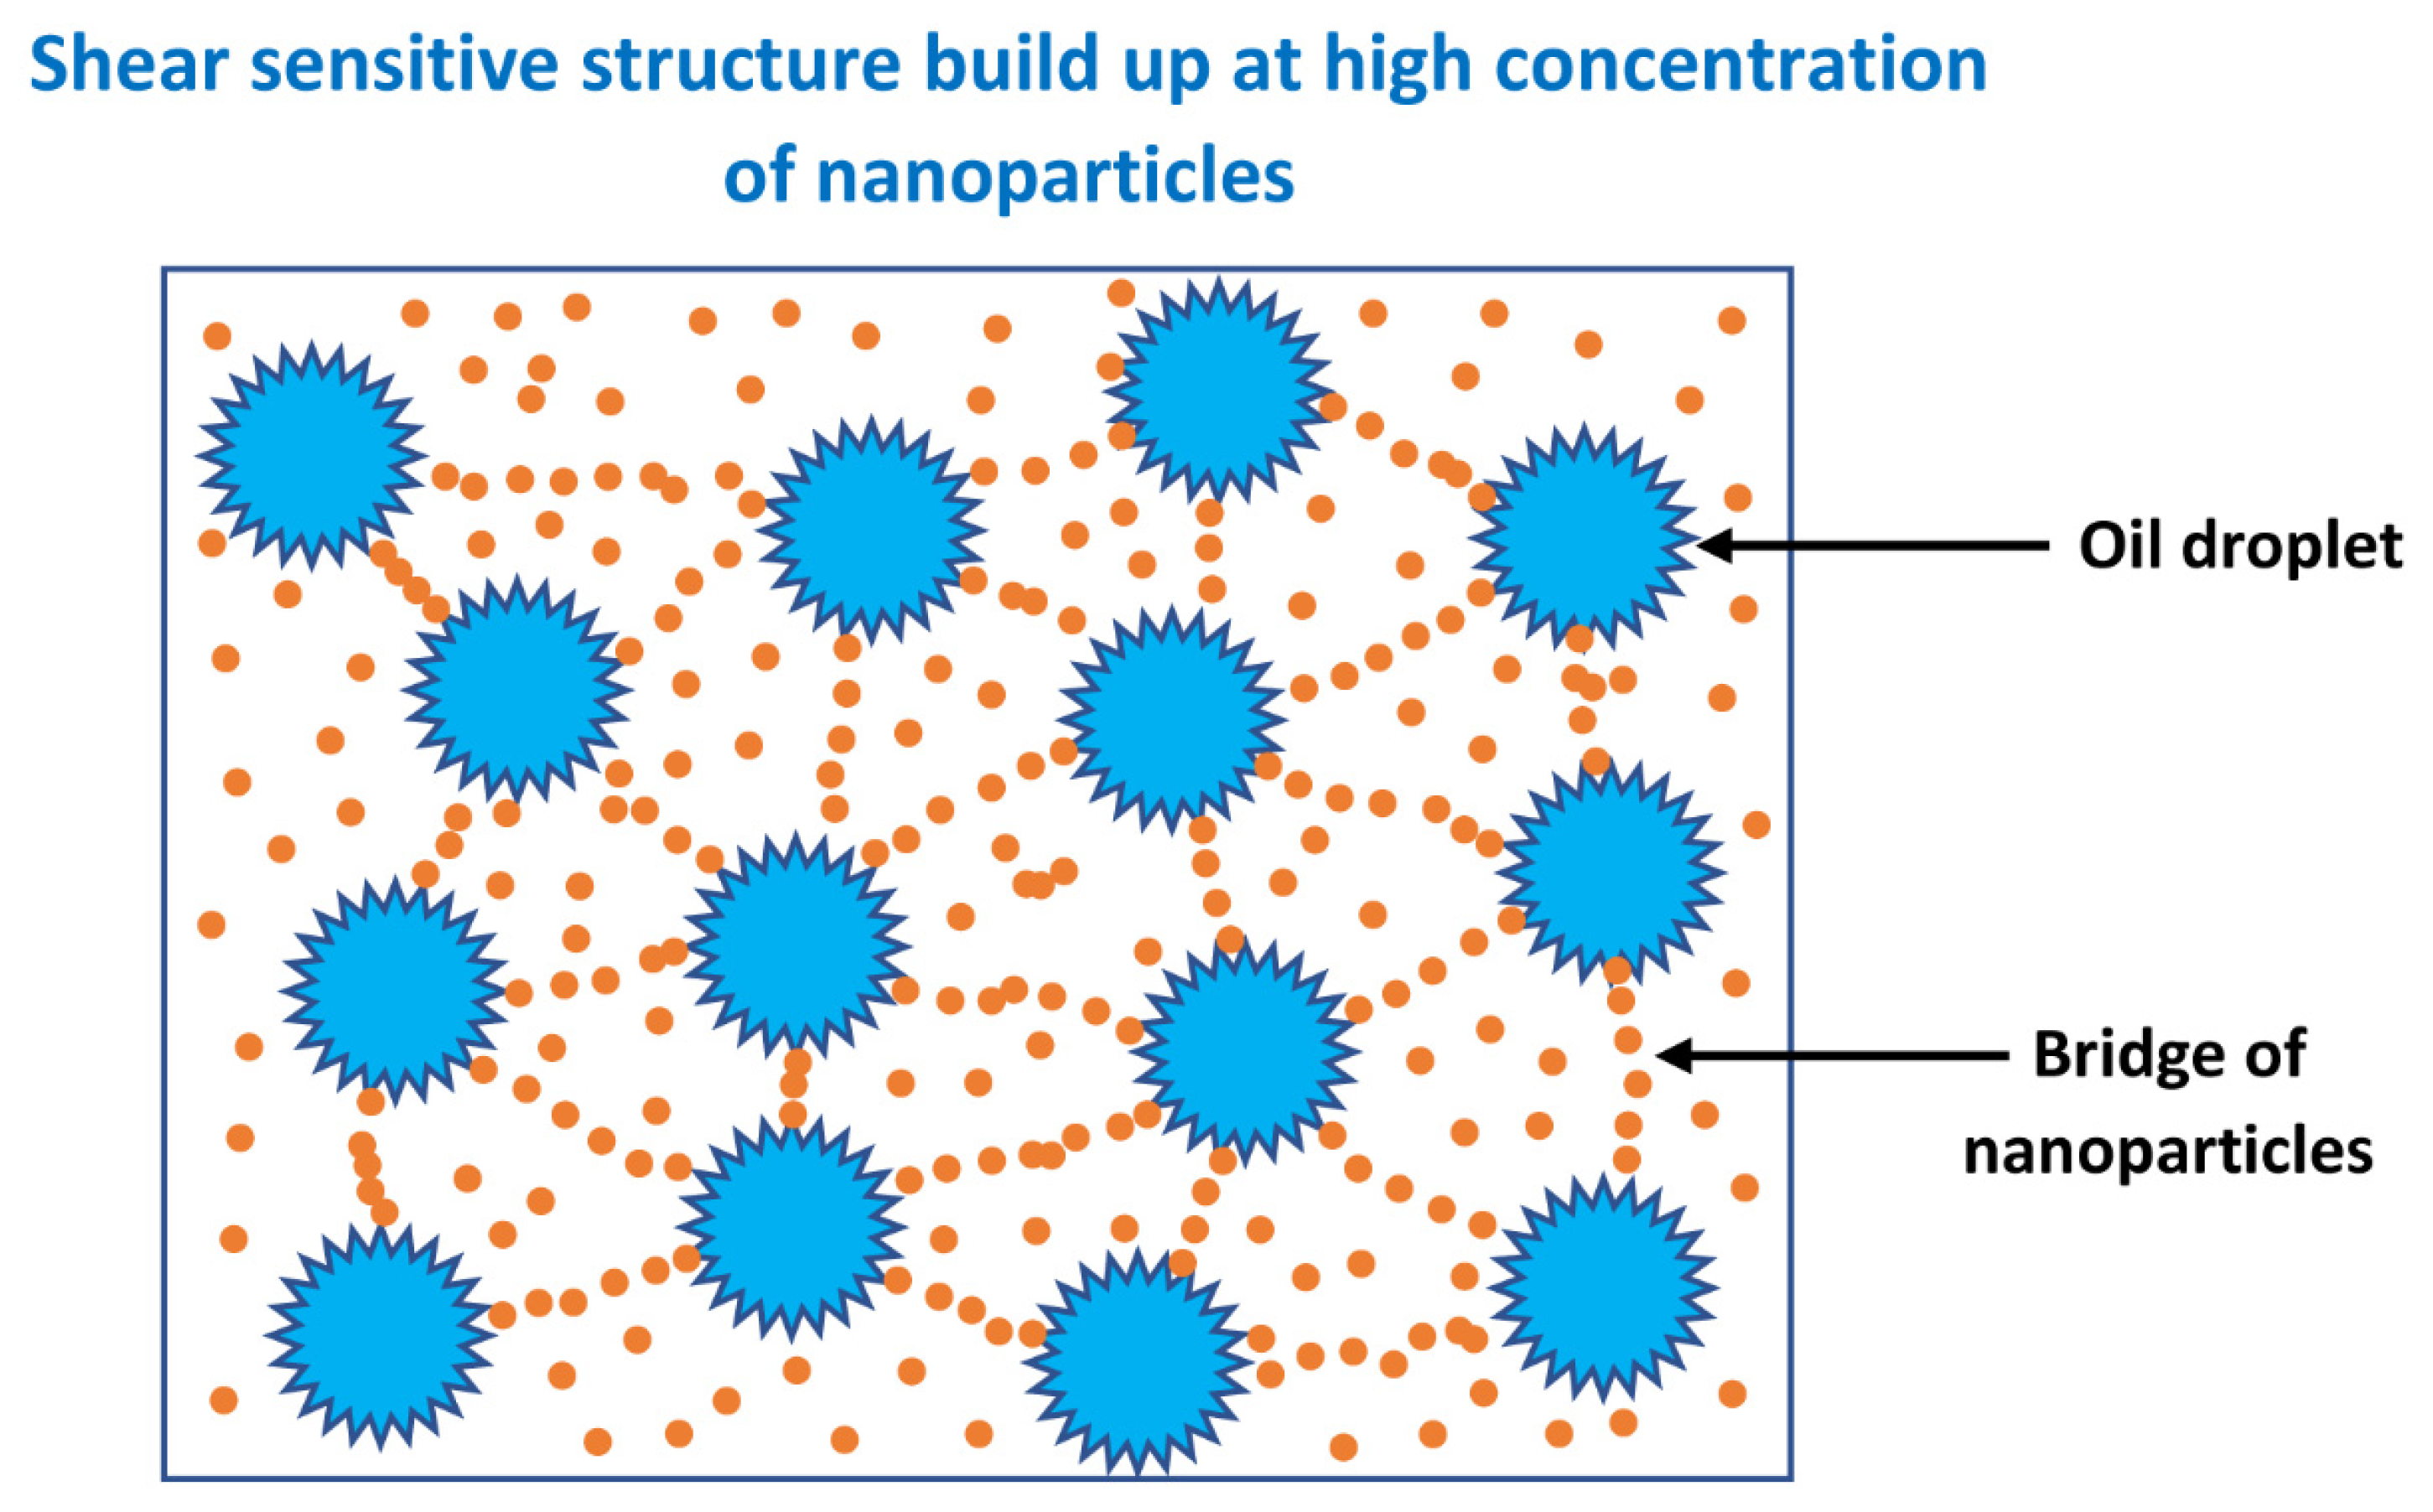
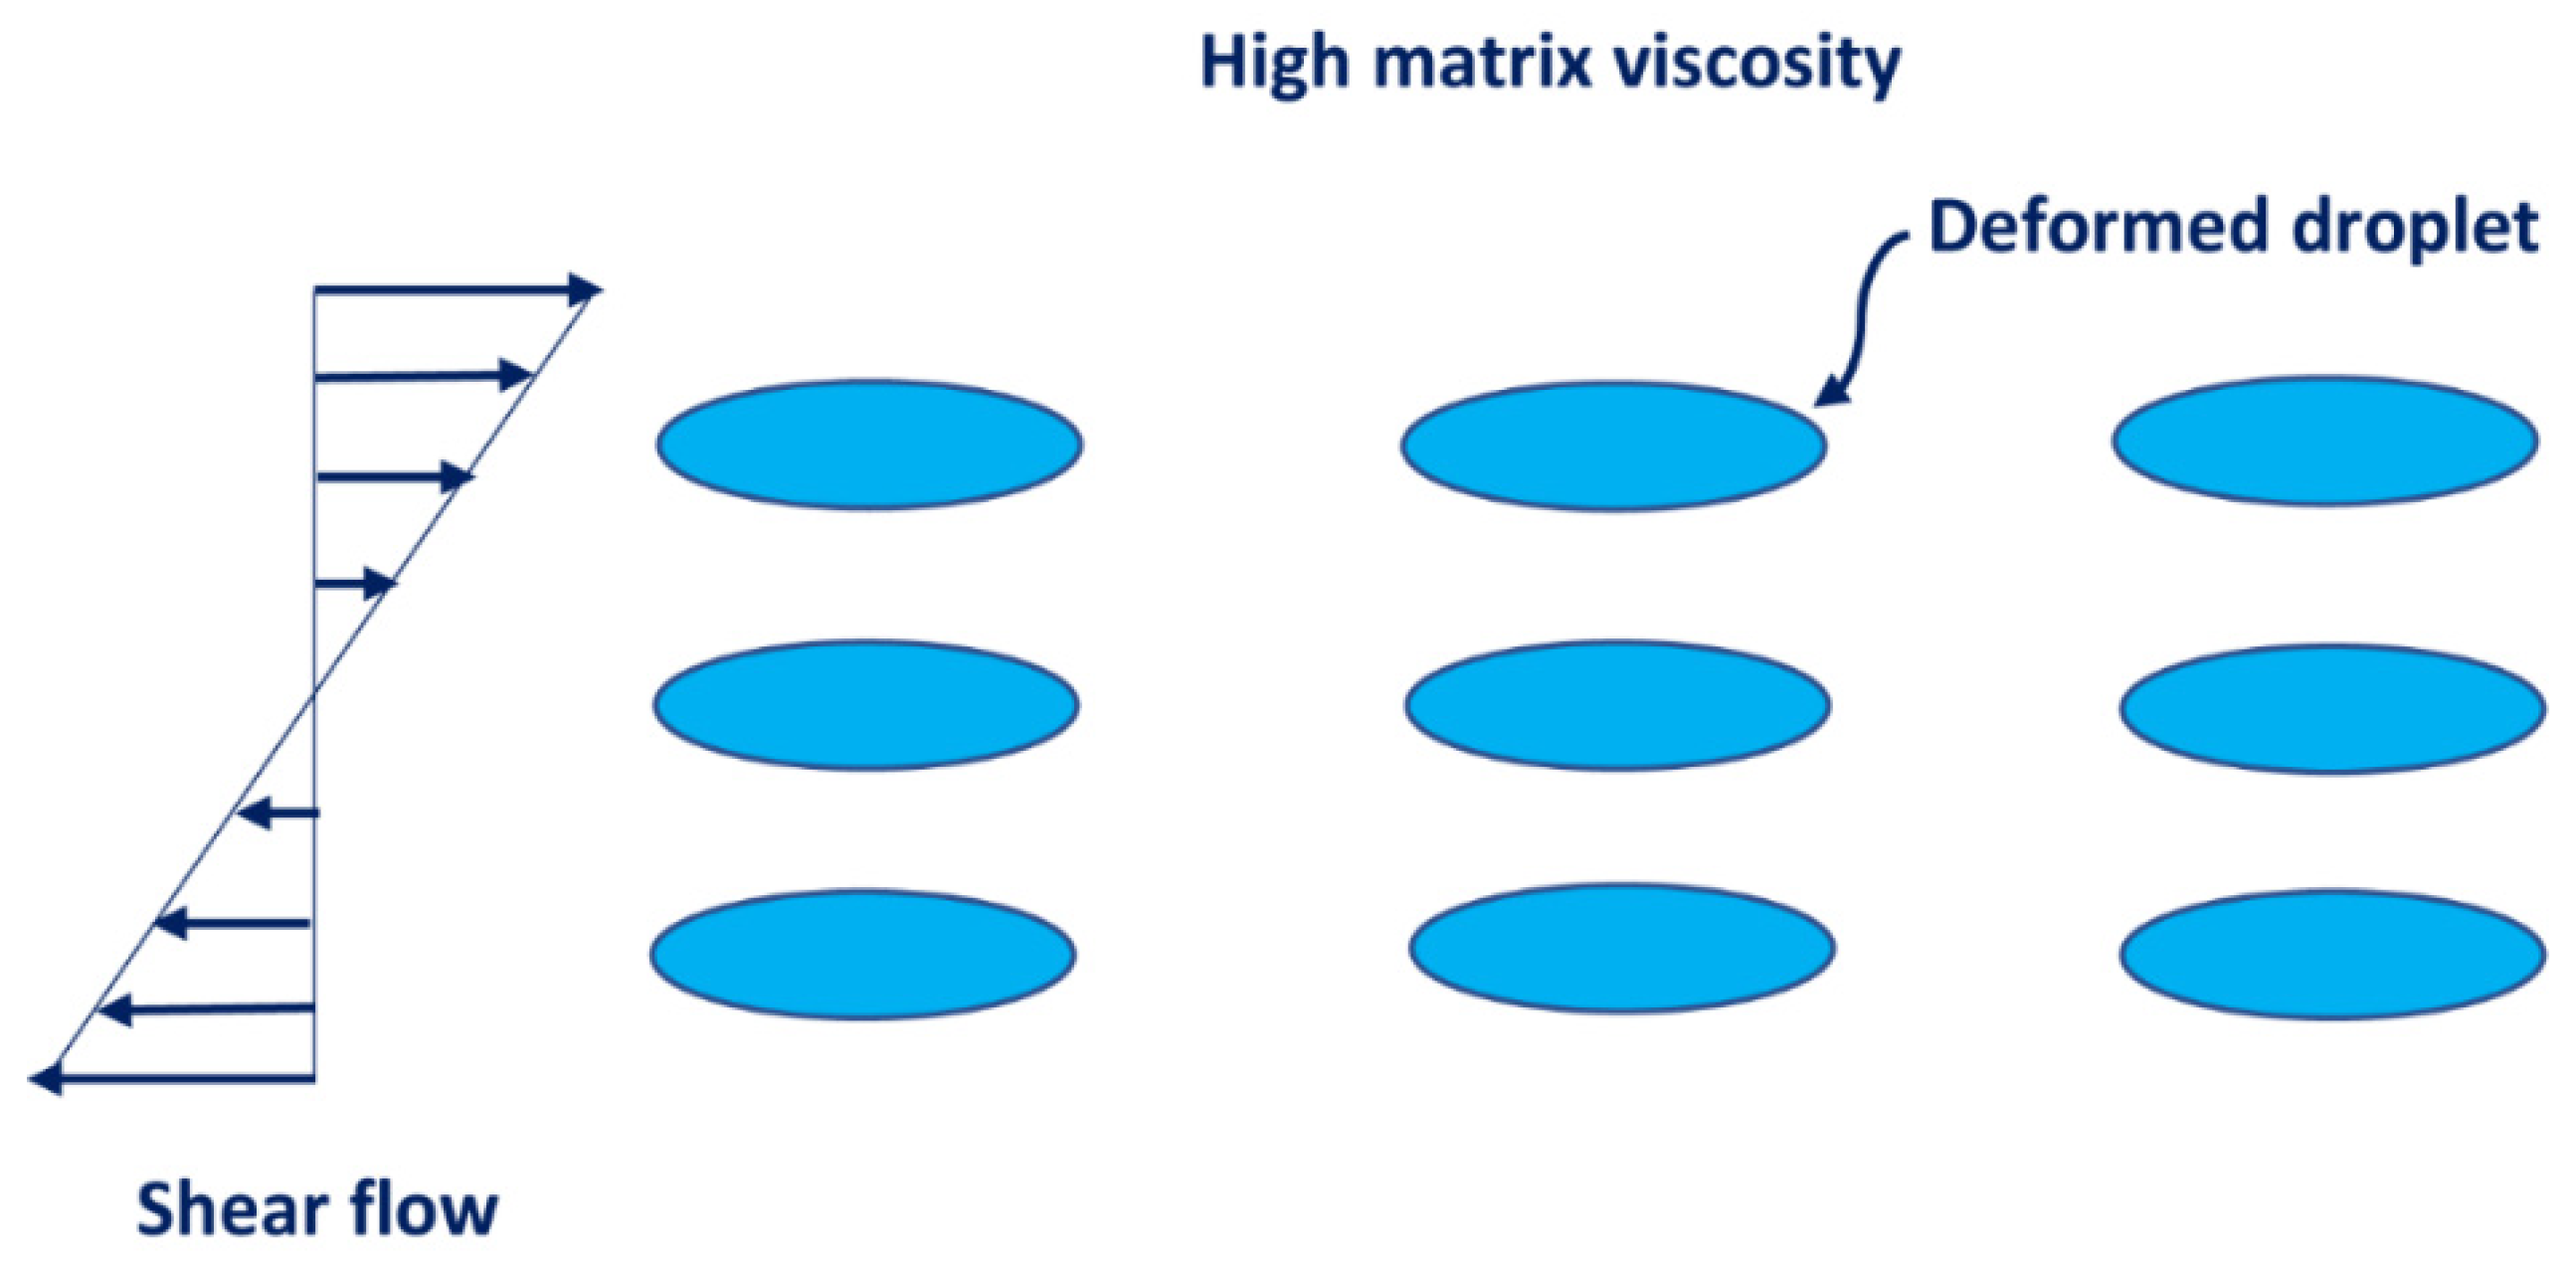
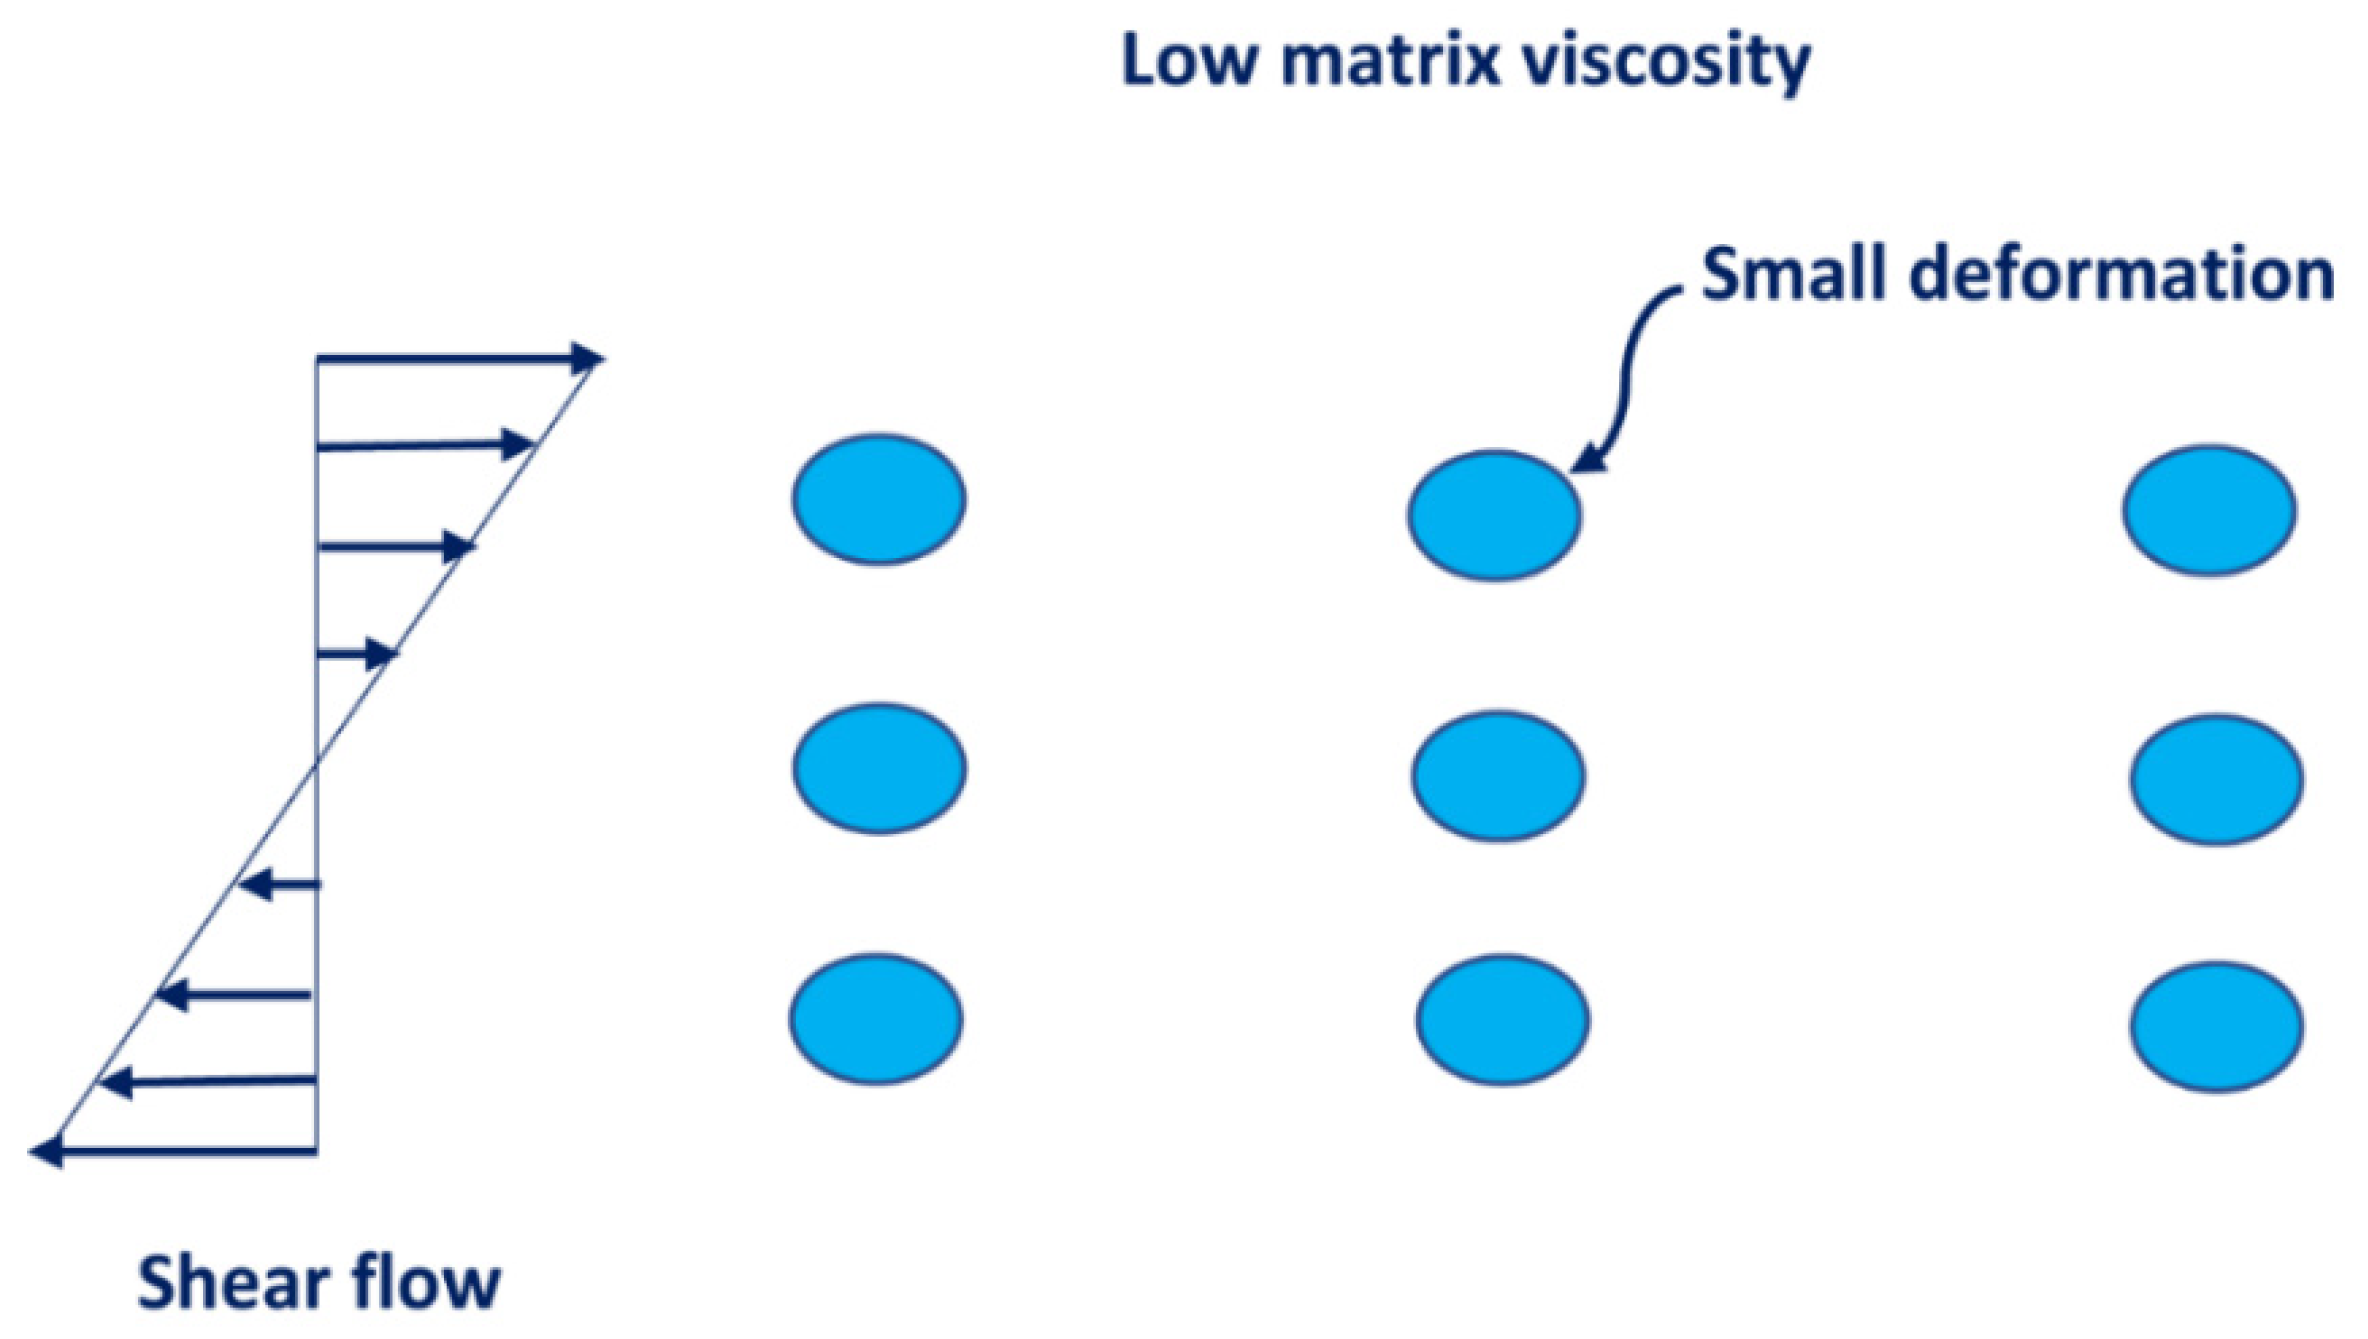
3.3. Rheology of O/W Emulsions Thickened by Starch Nanoparticles
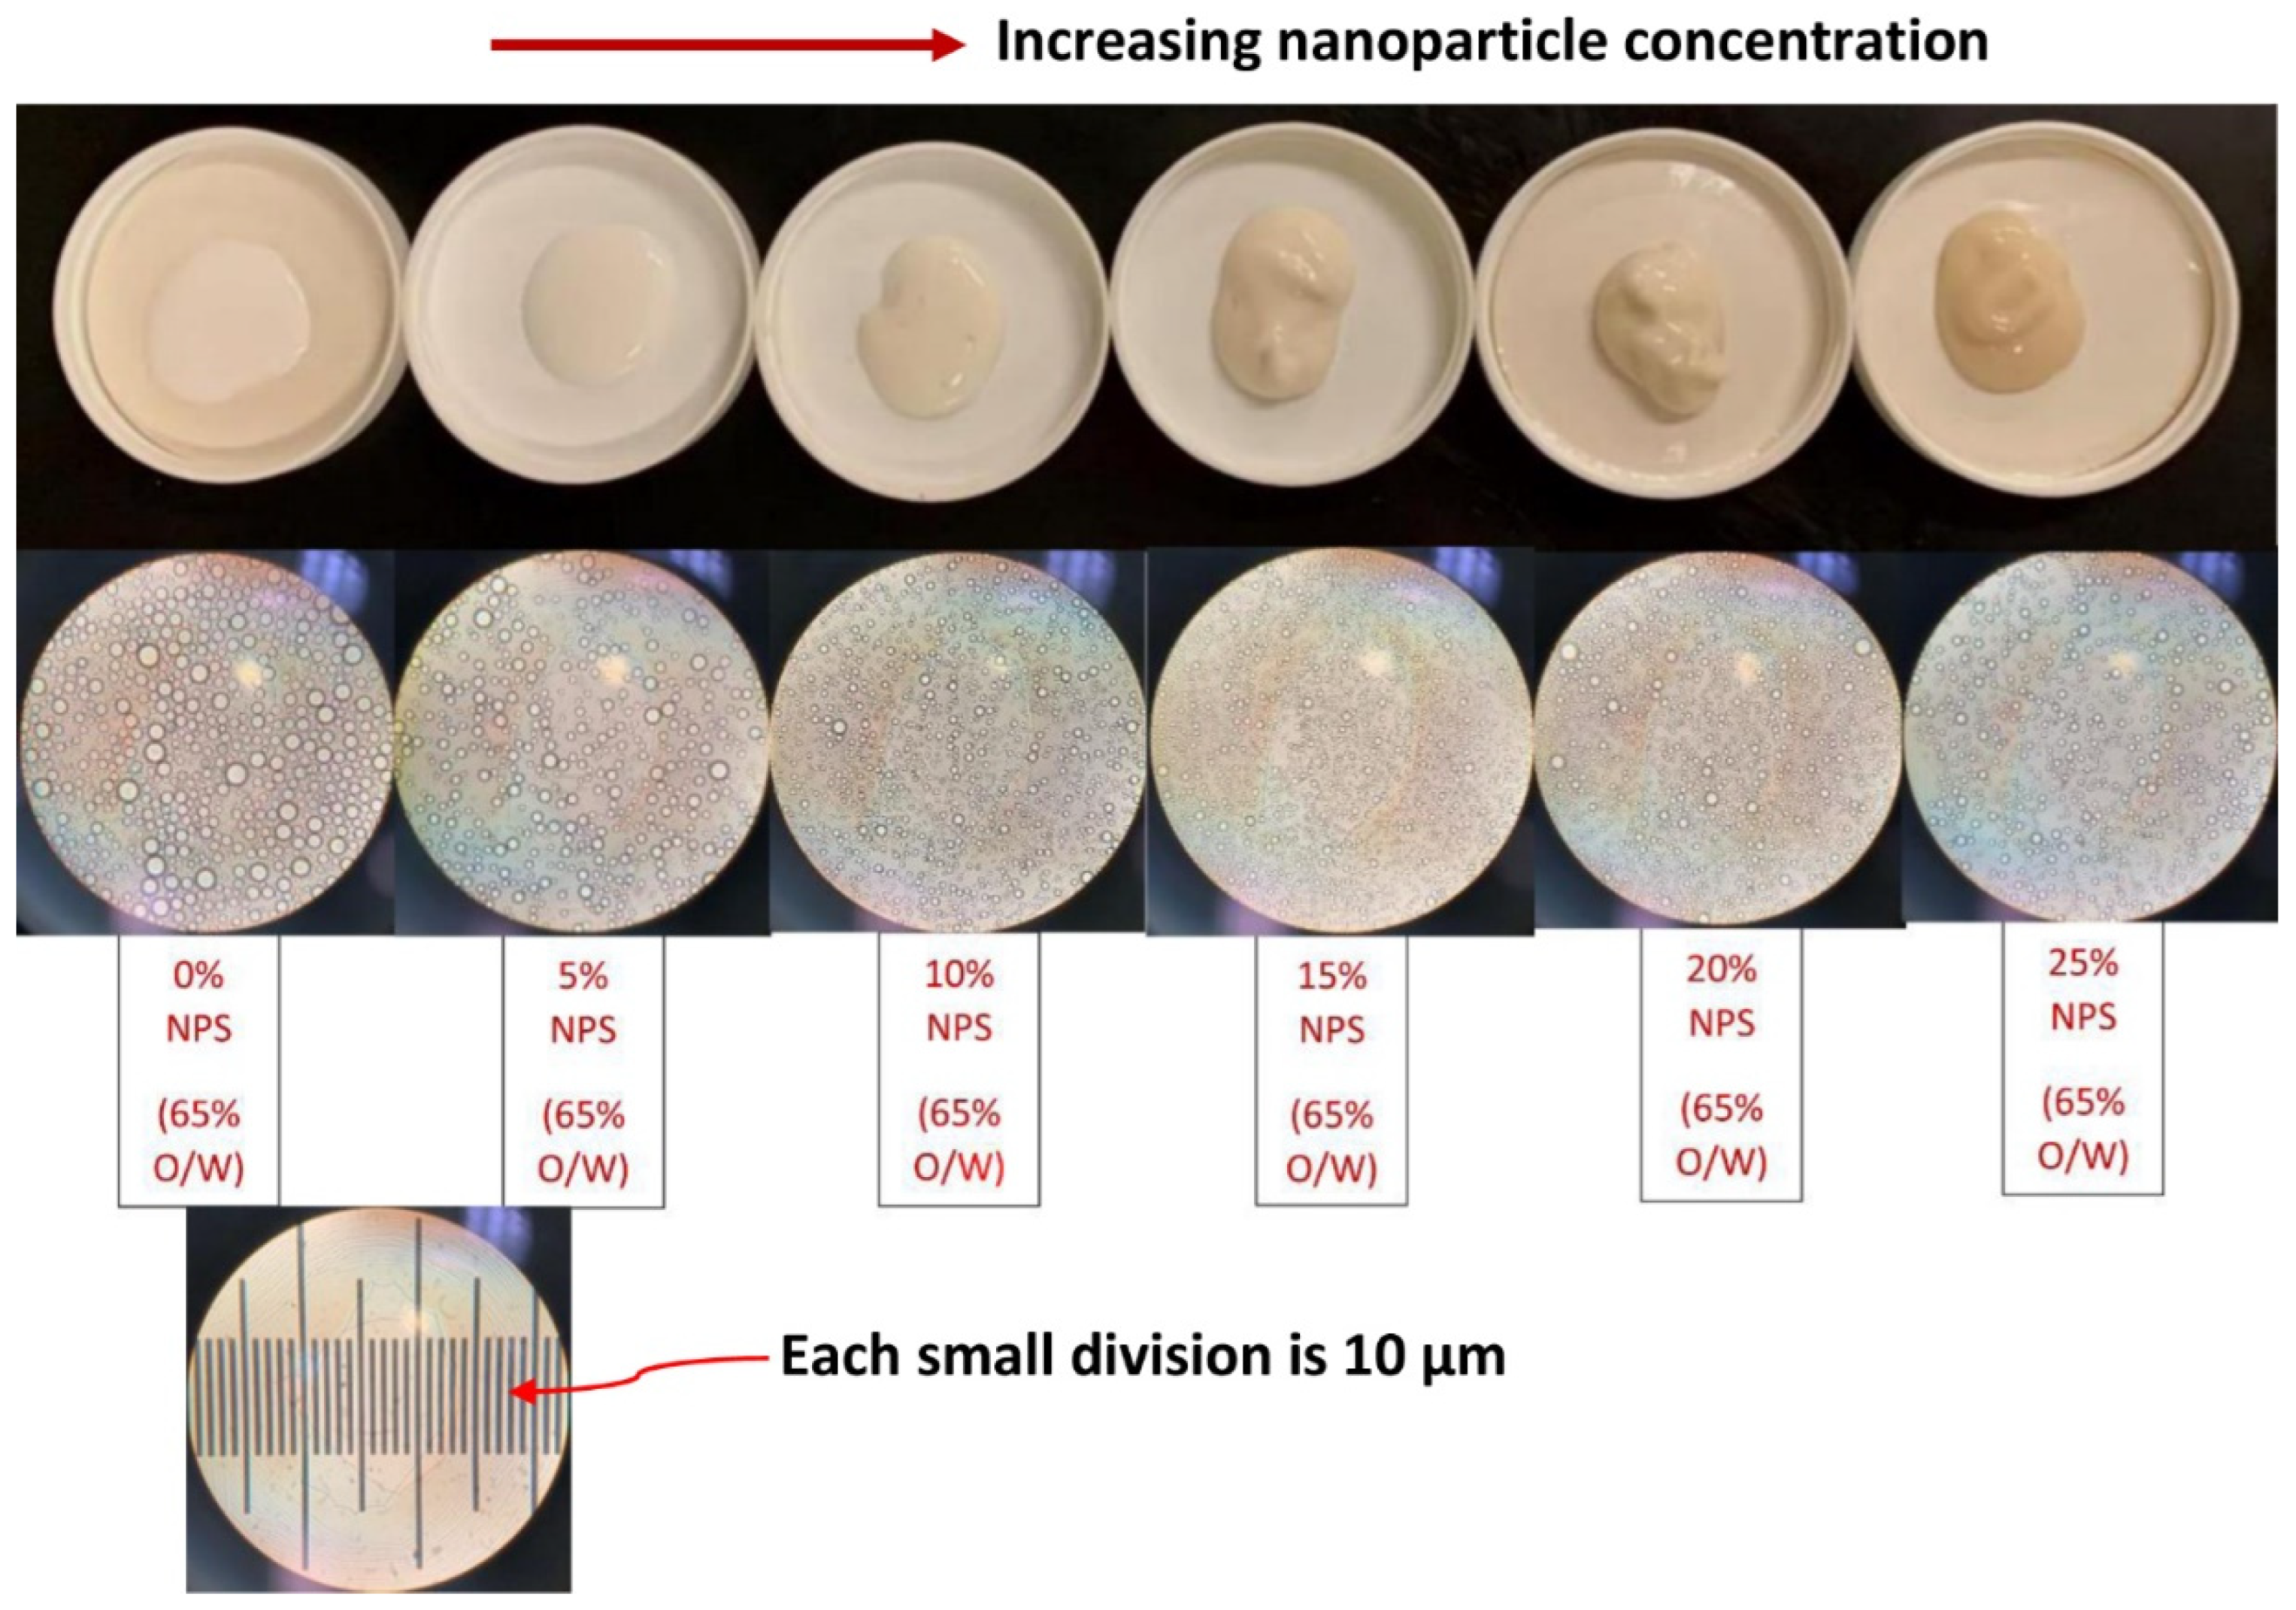
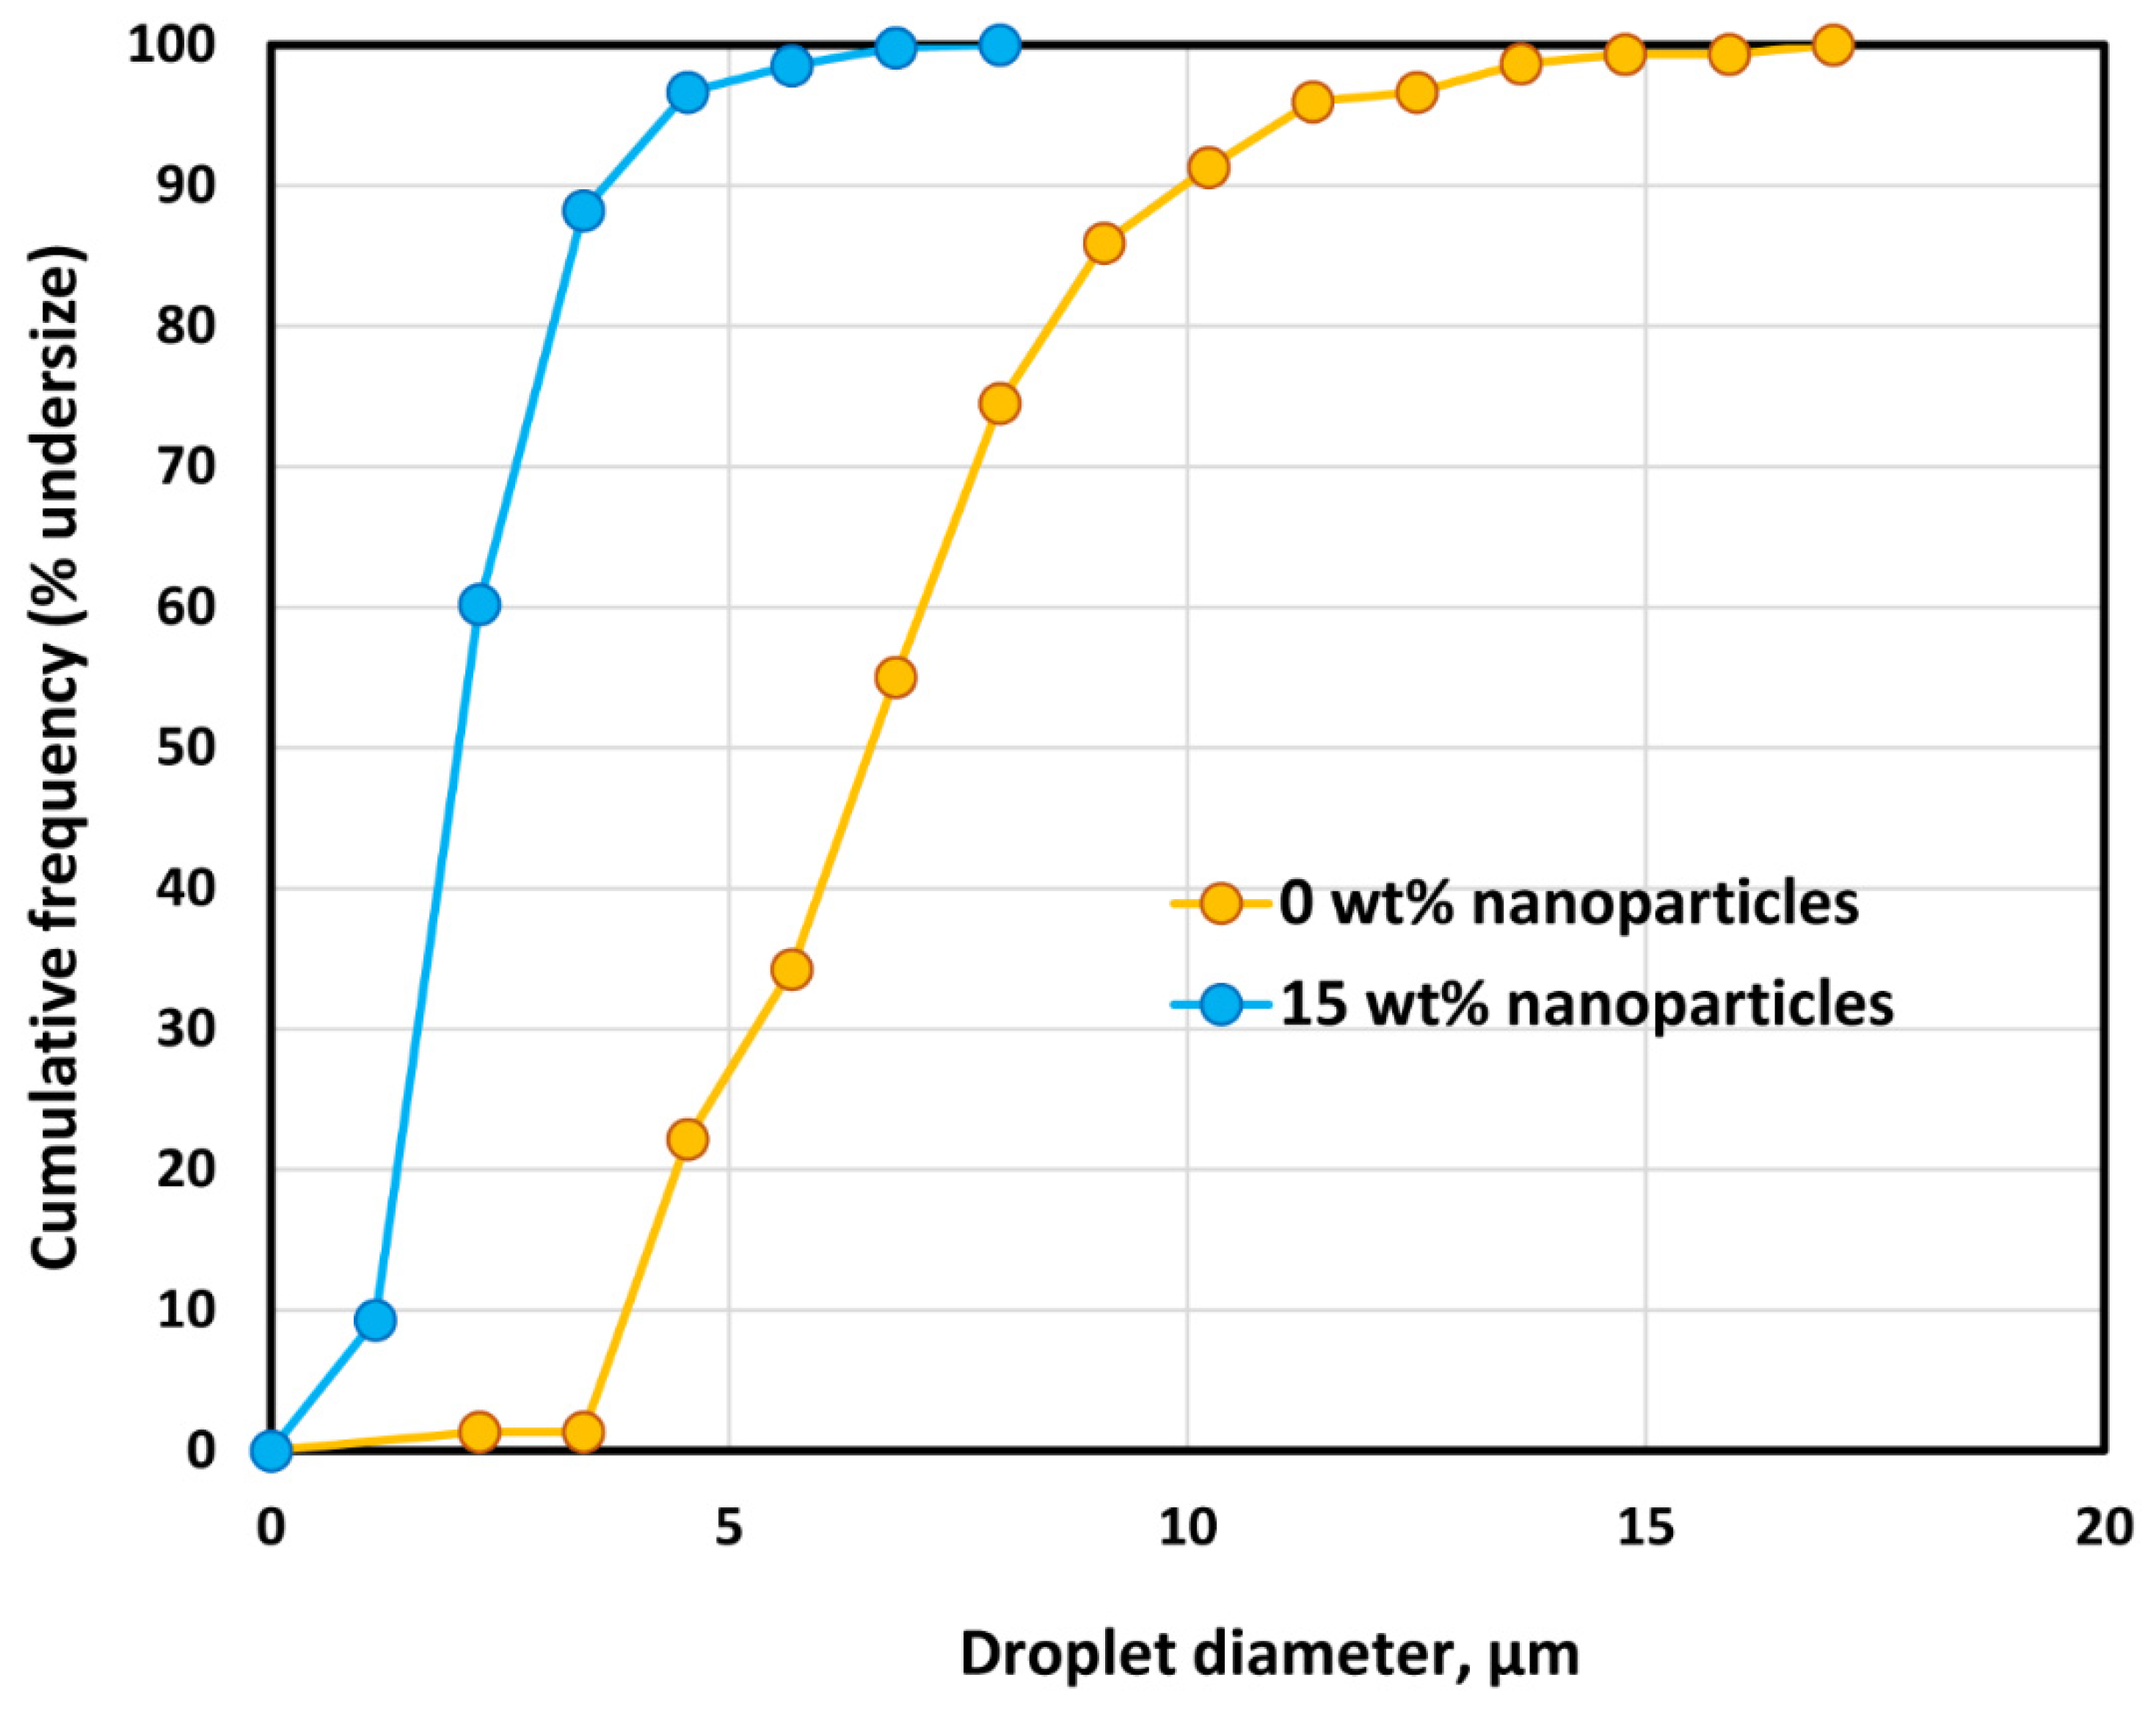
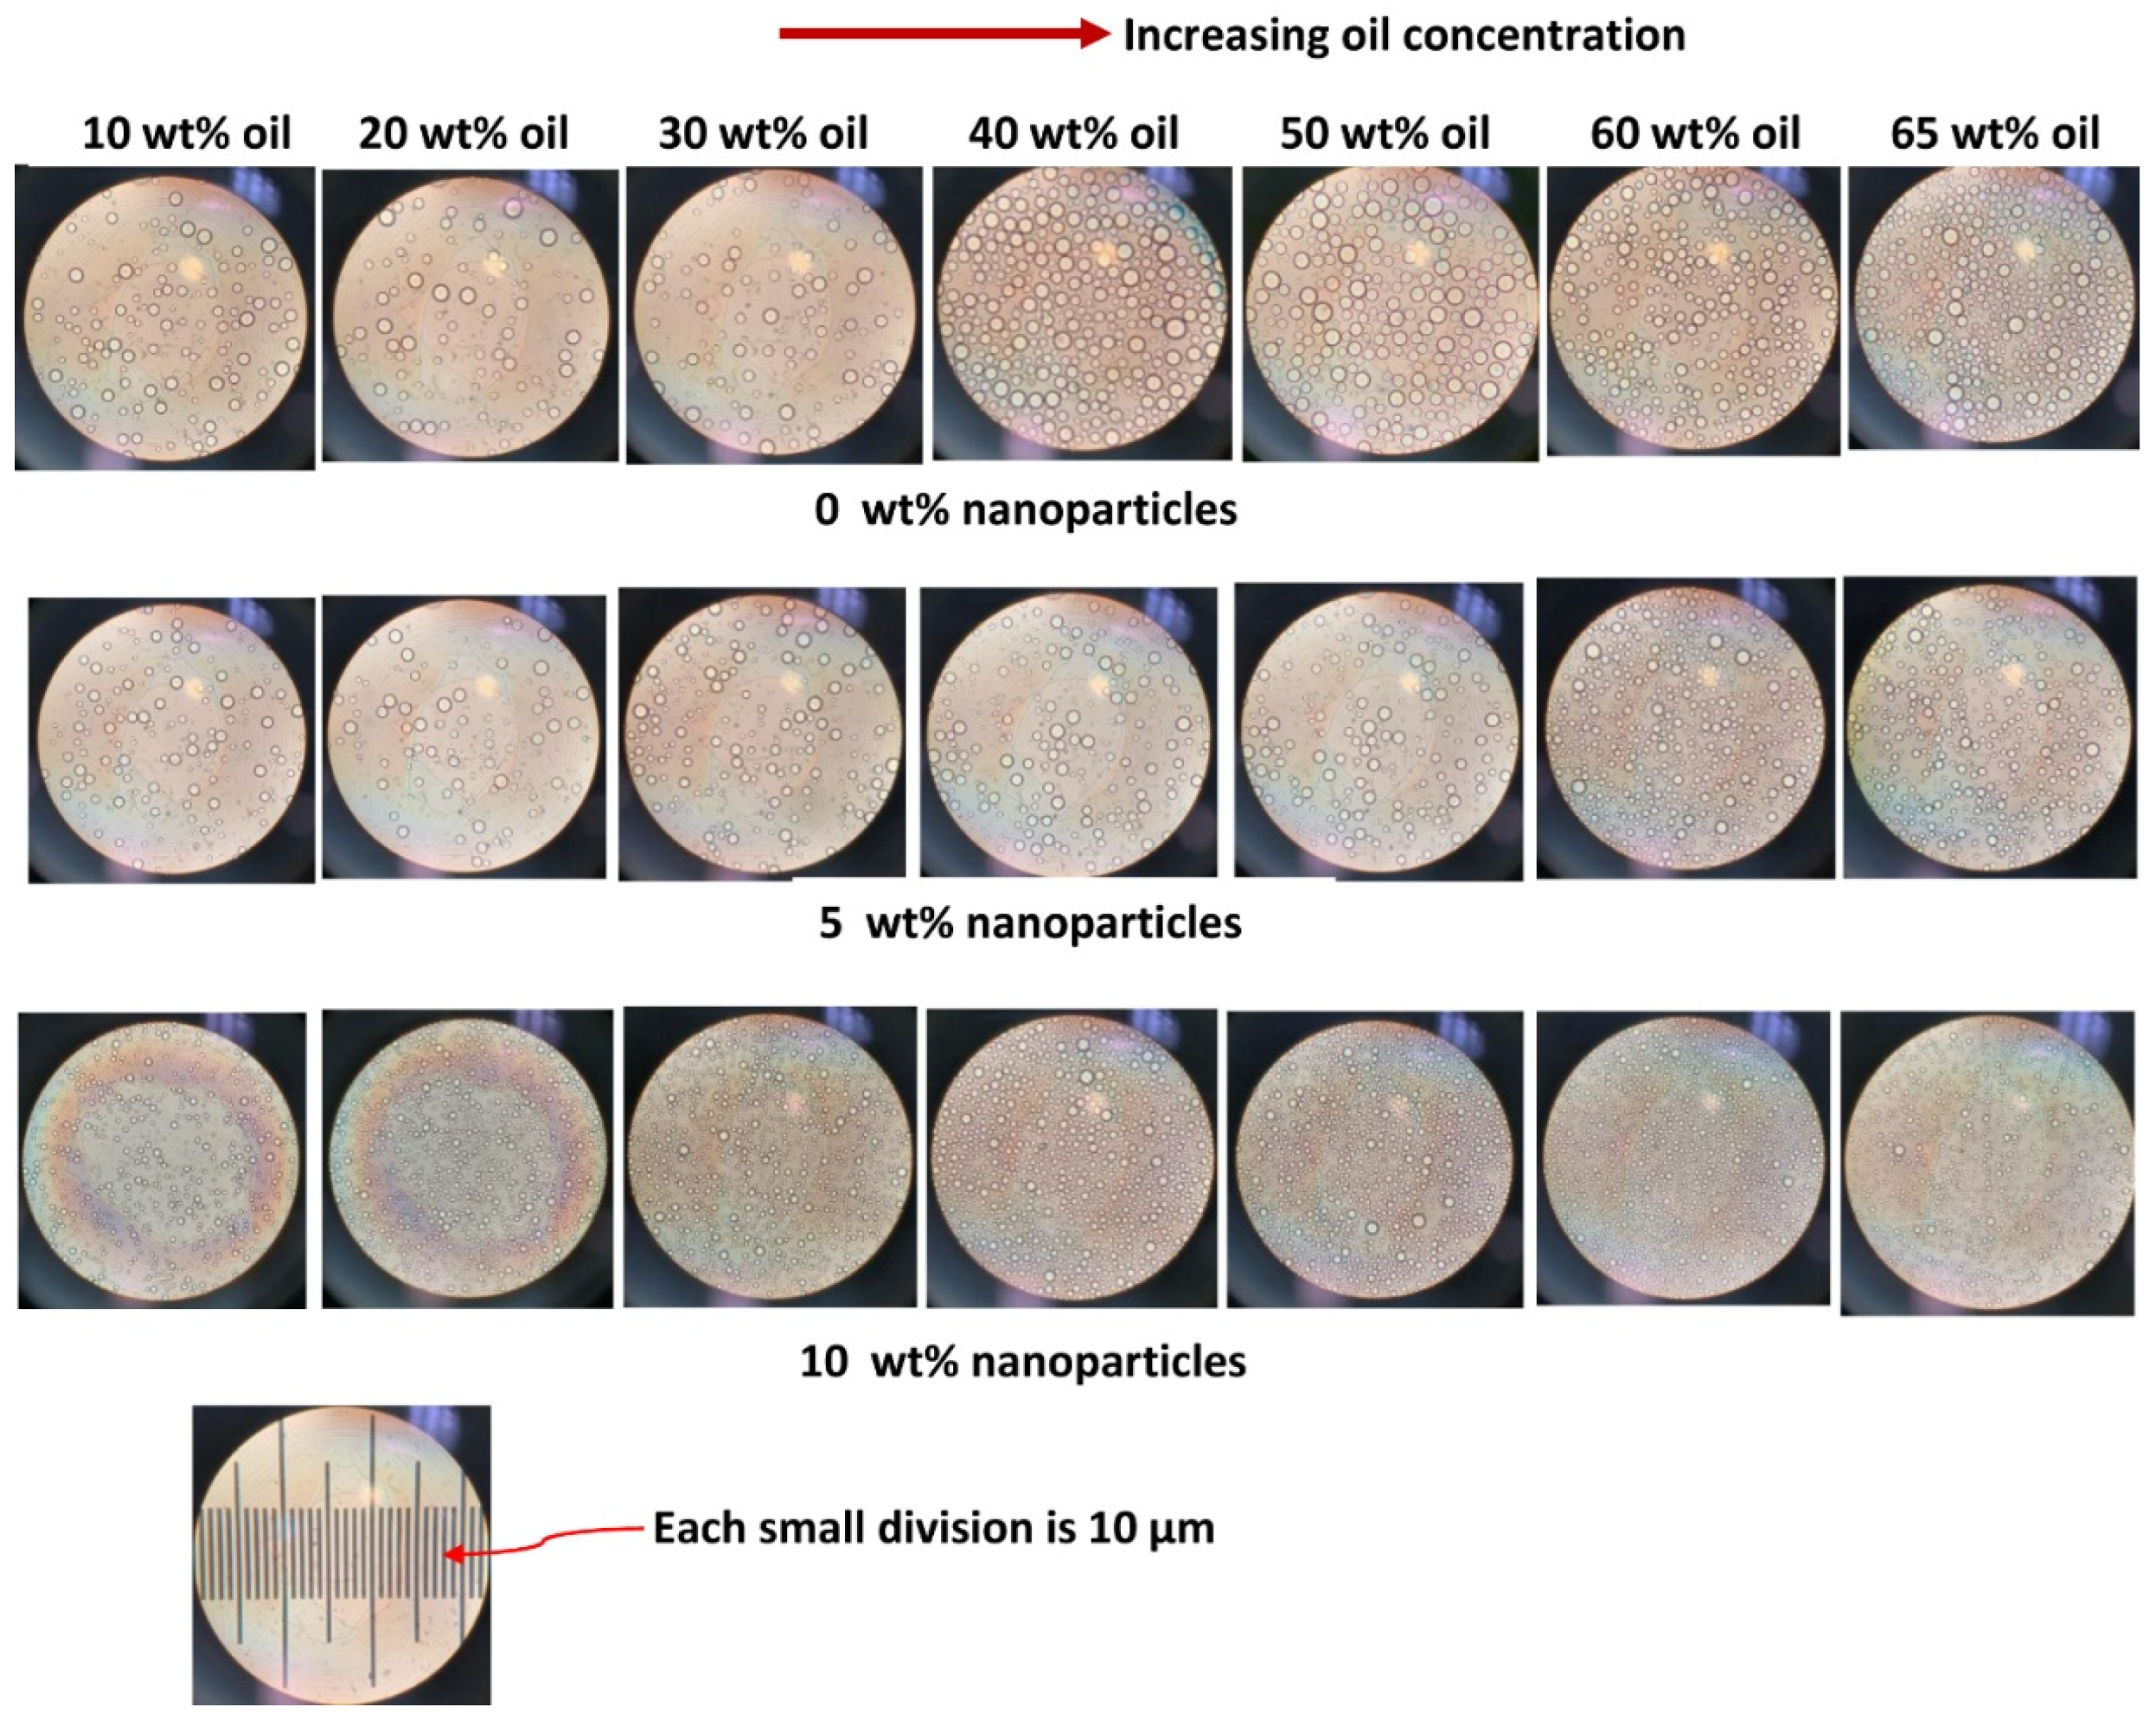
3.4. Droplet Size of Emulsions
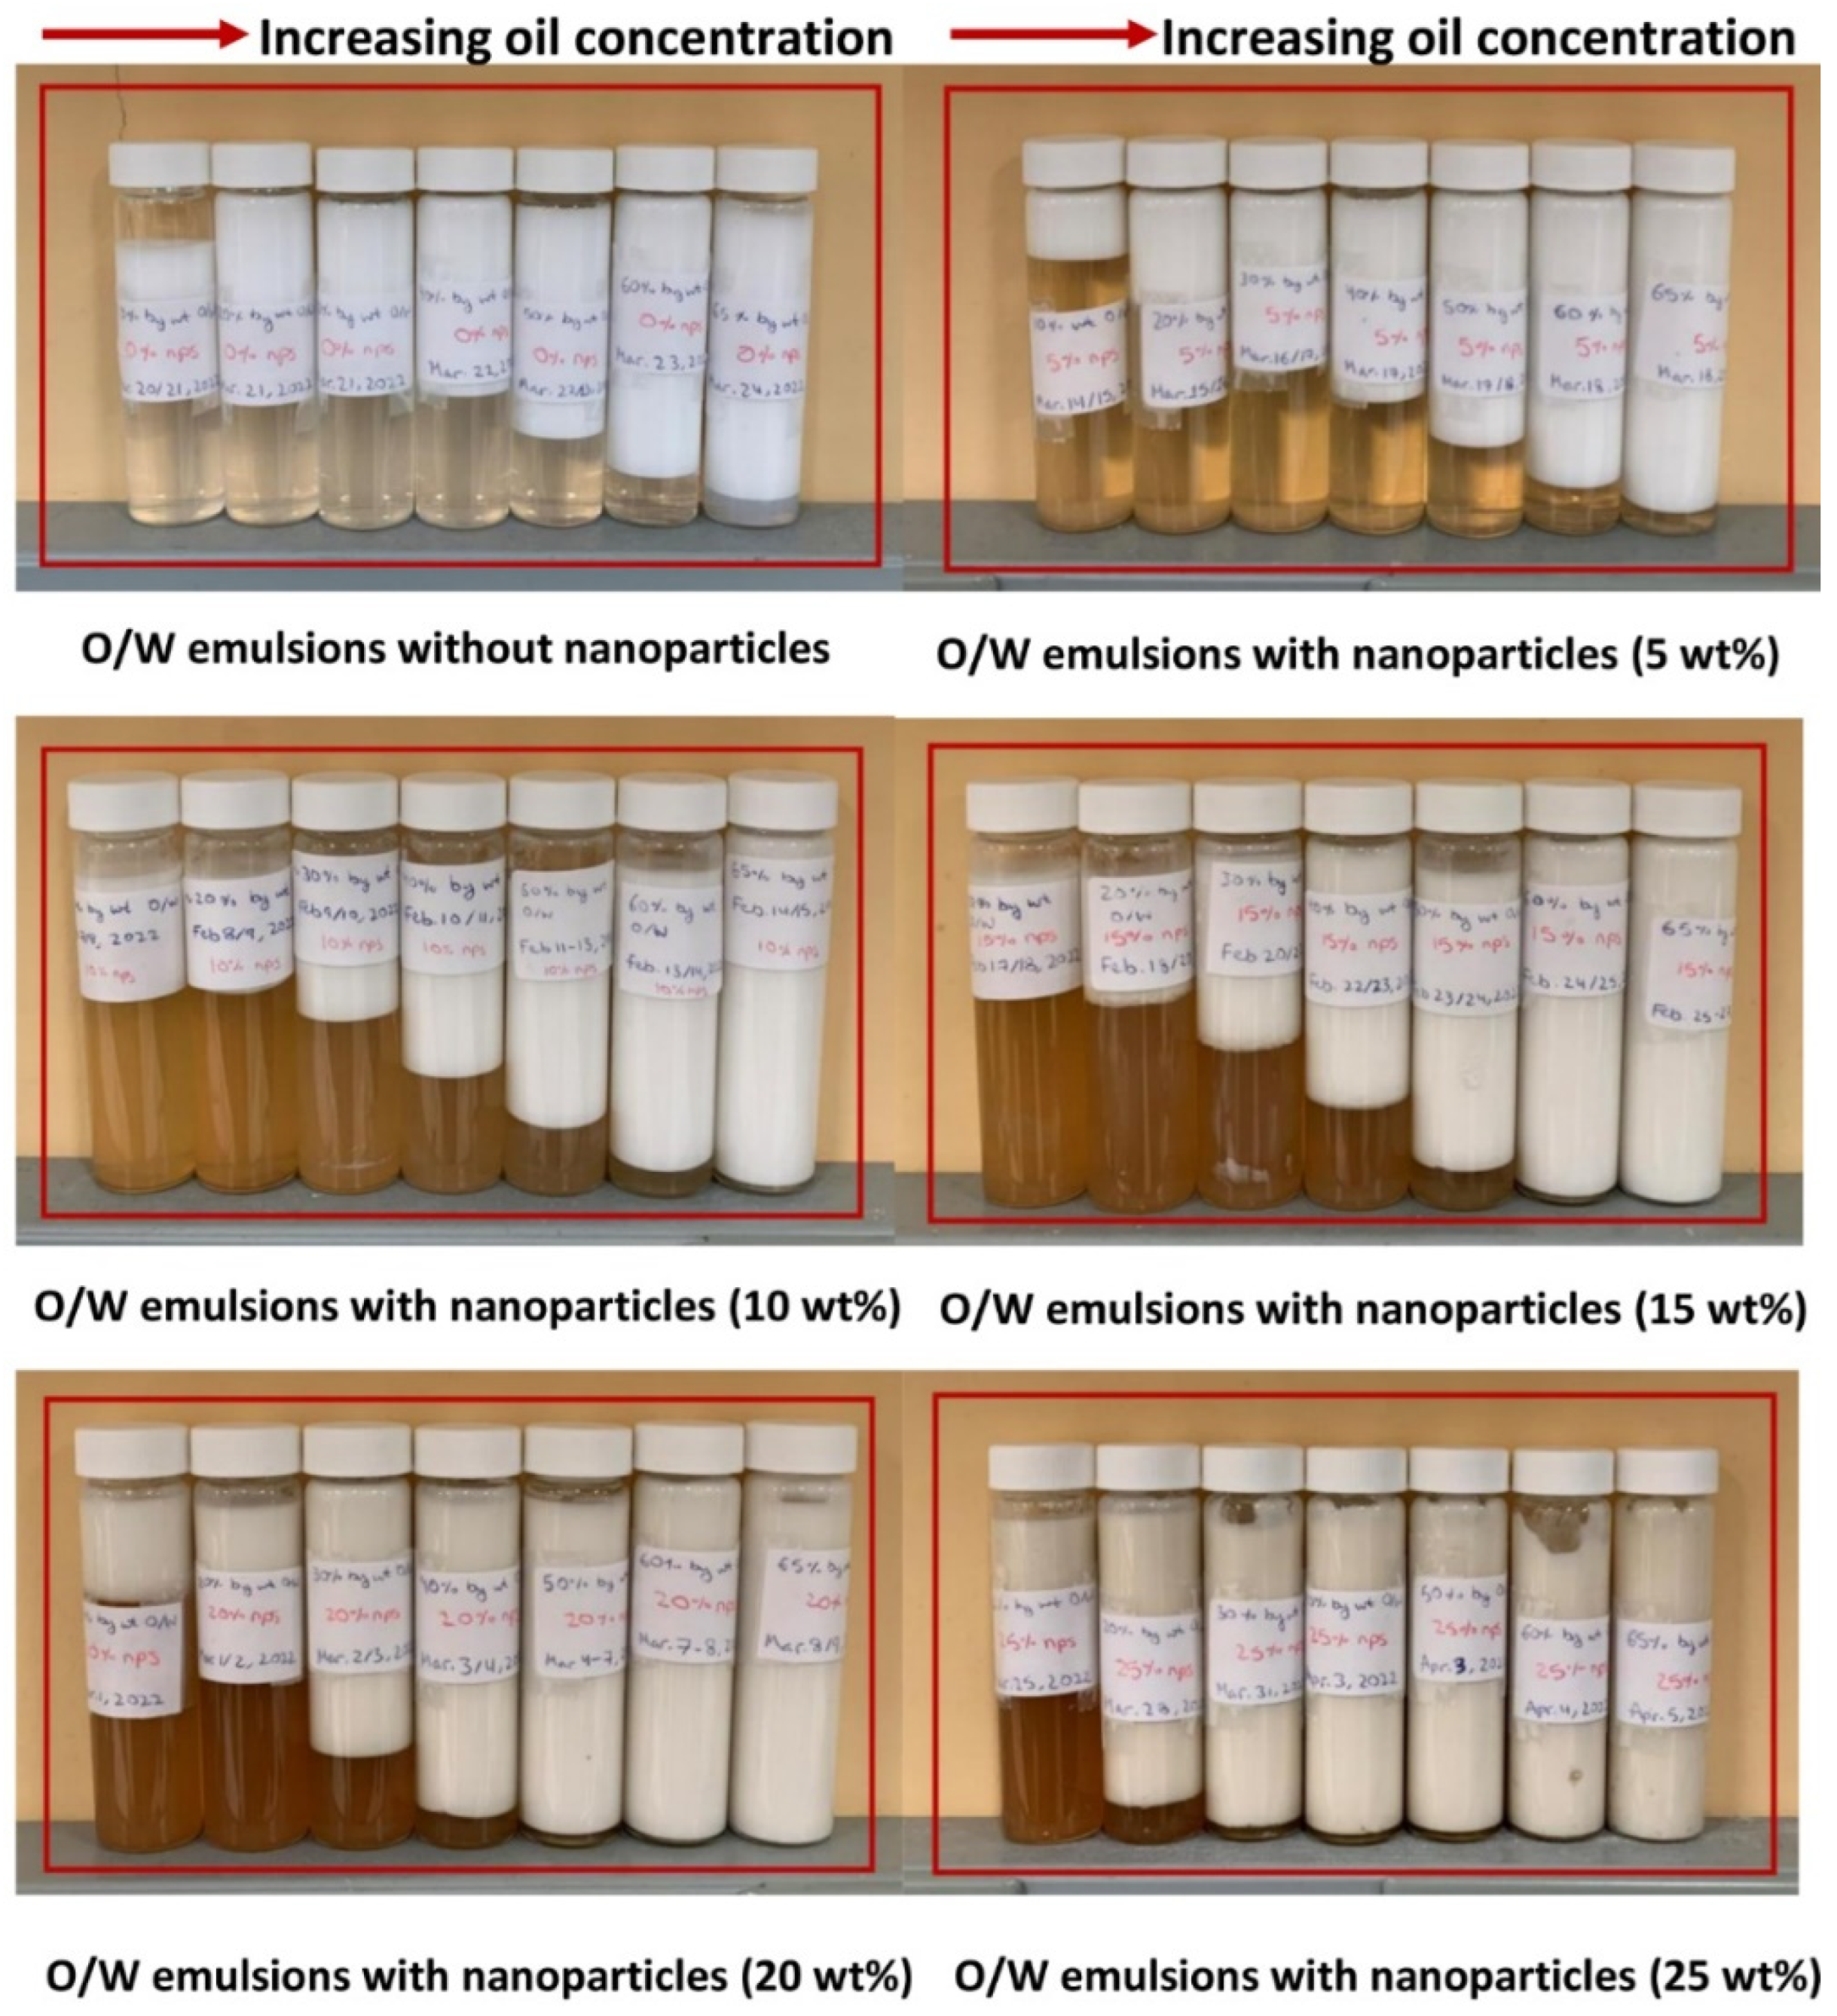
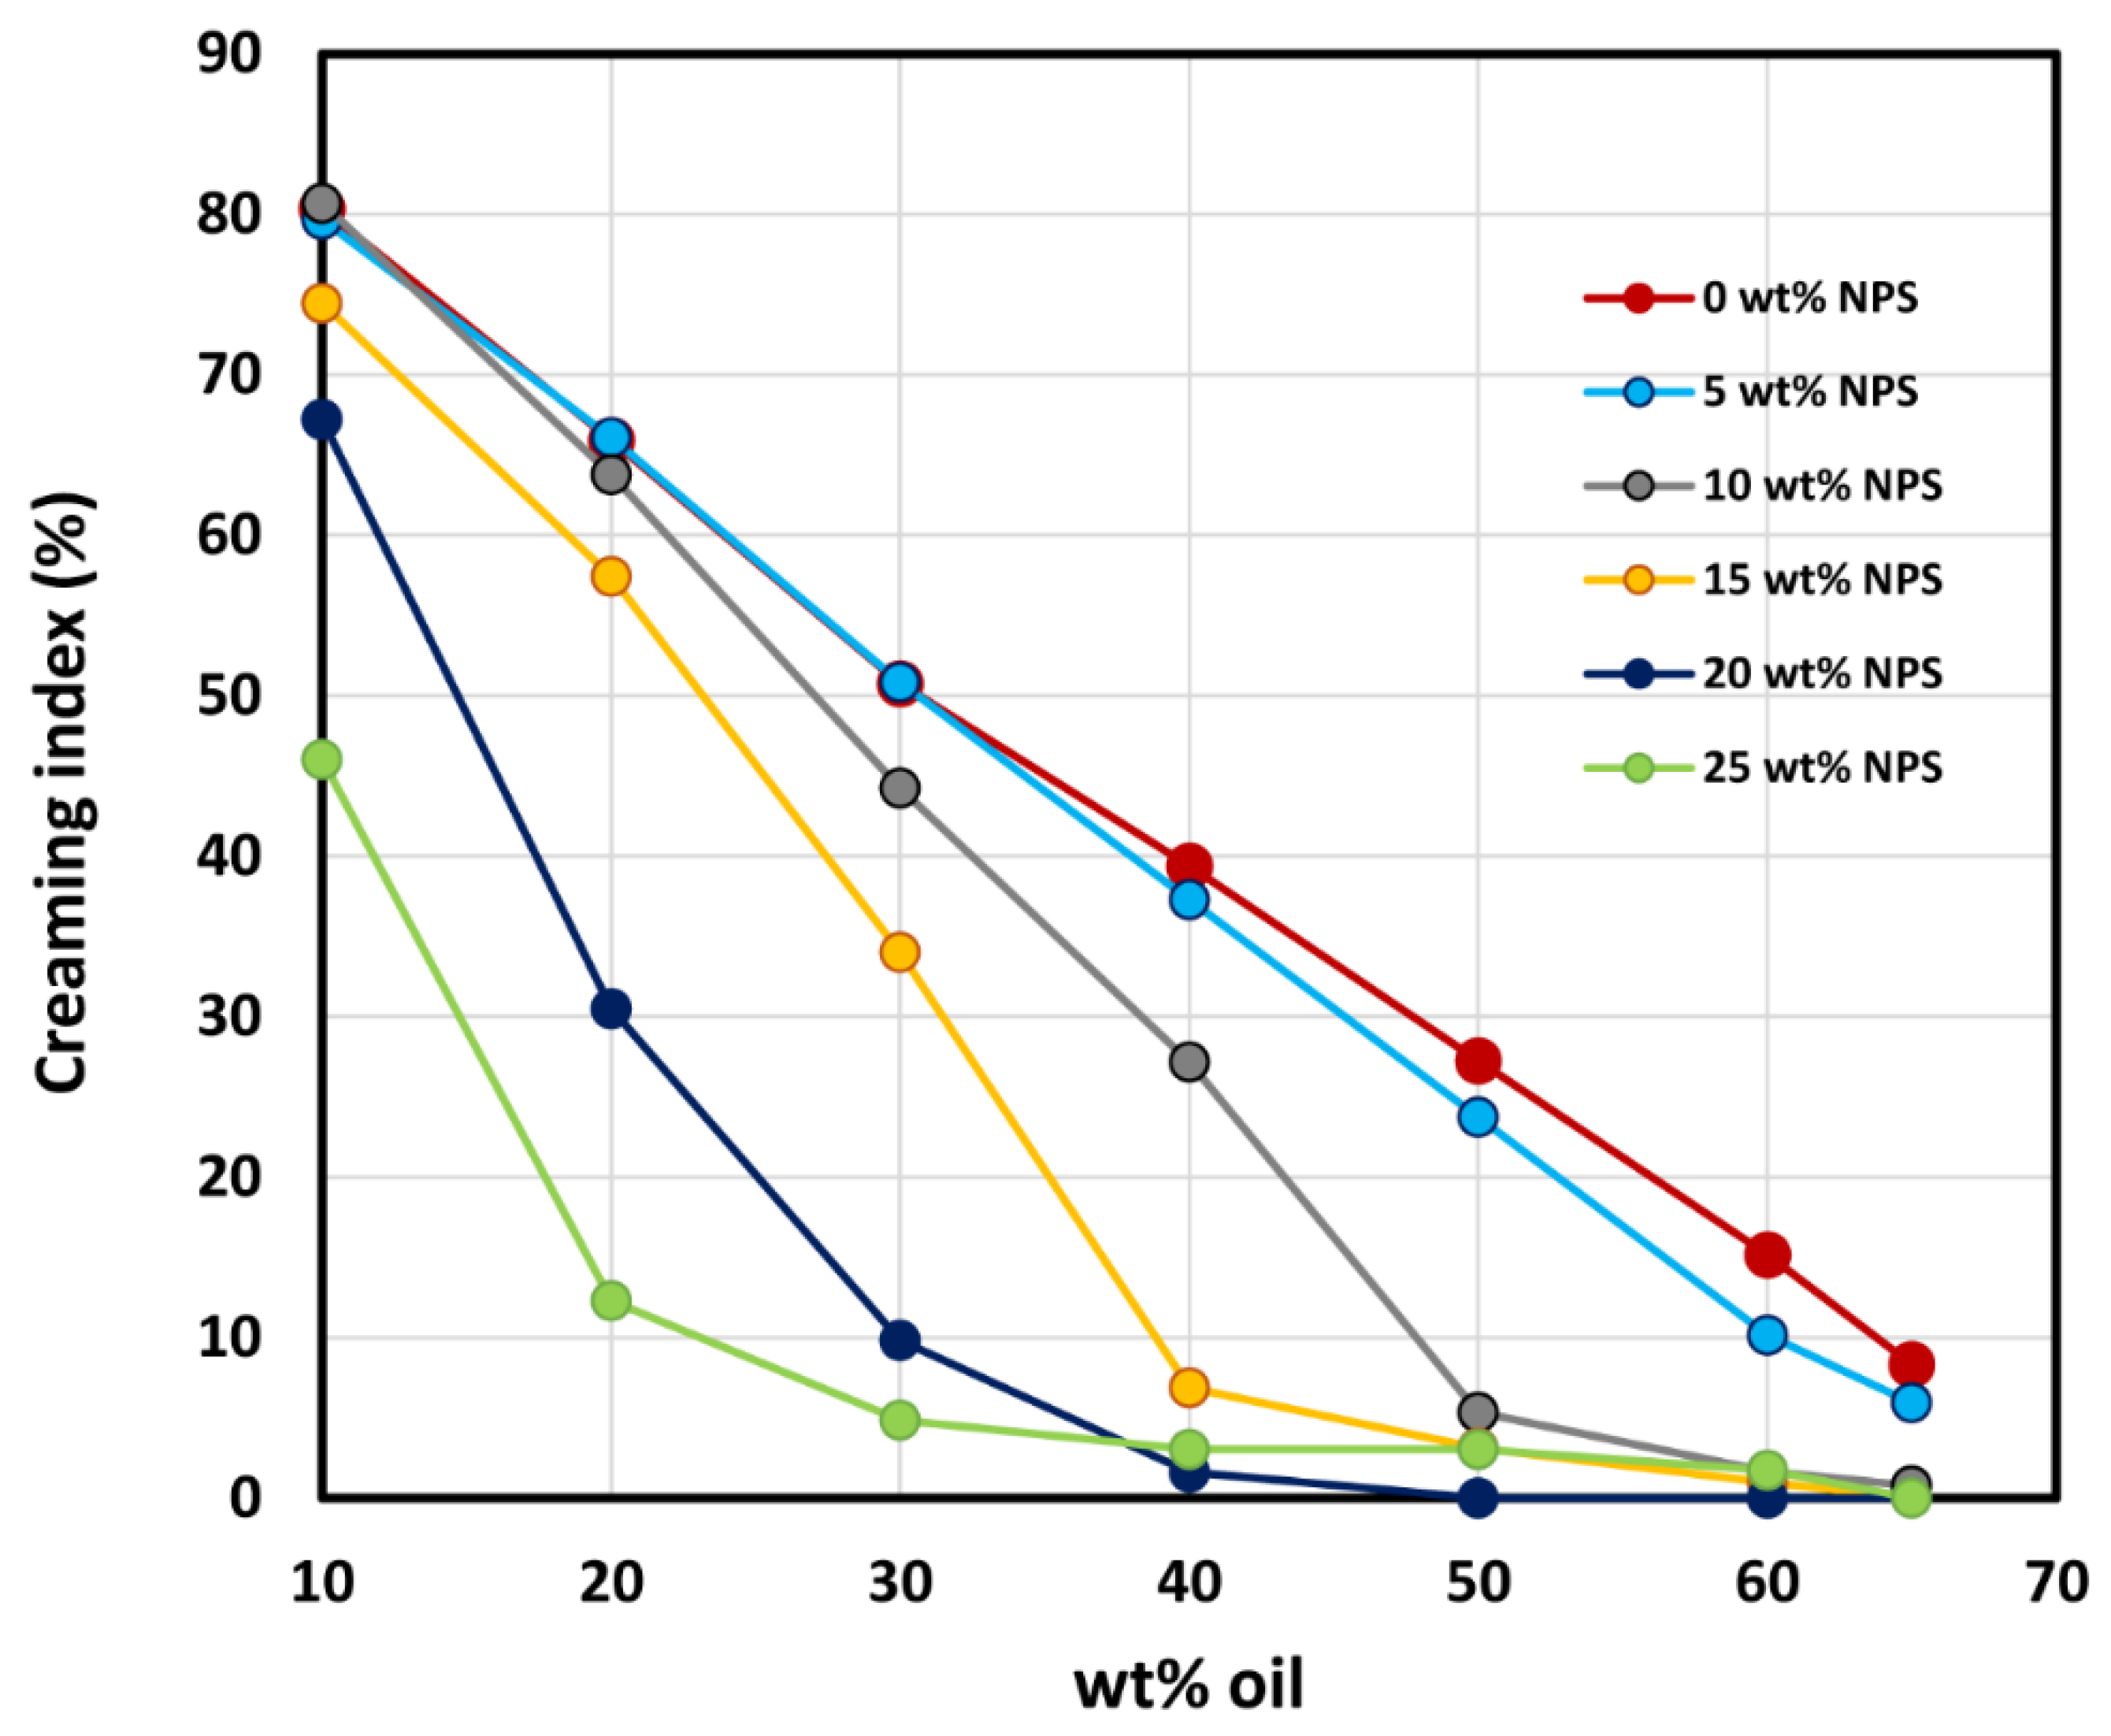
3.5. Stability of Emulsions
4. Conclusions
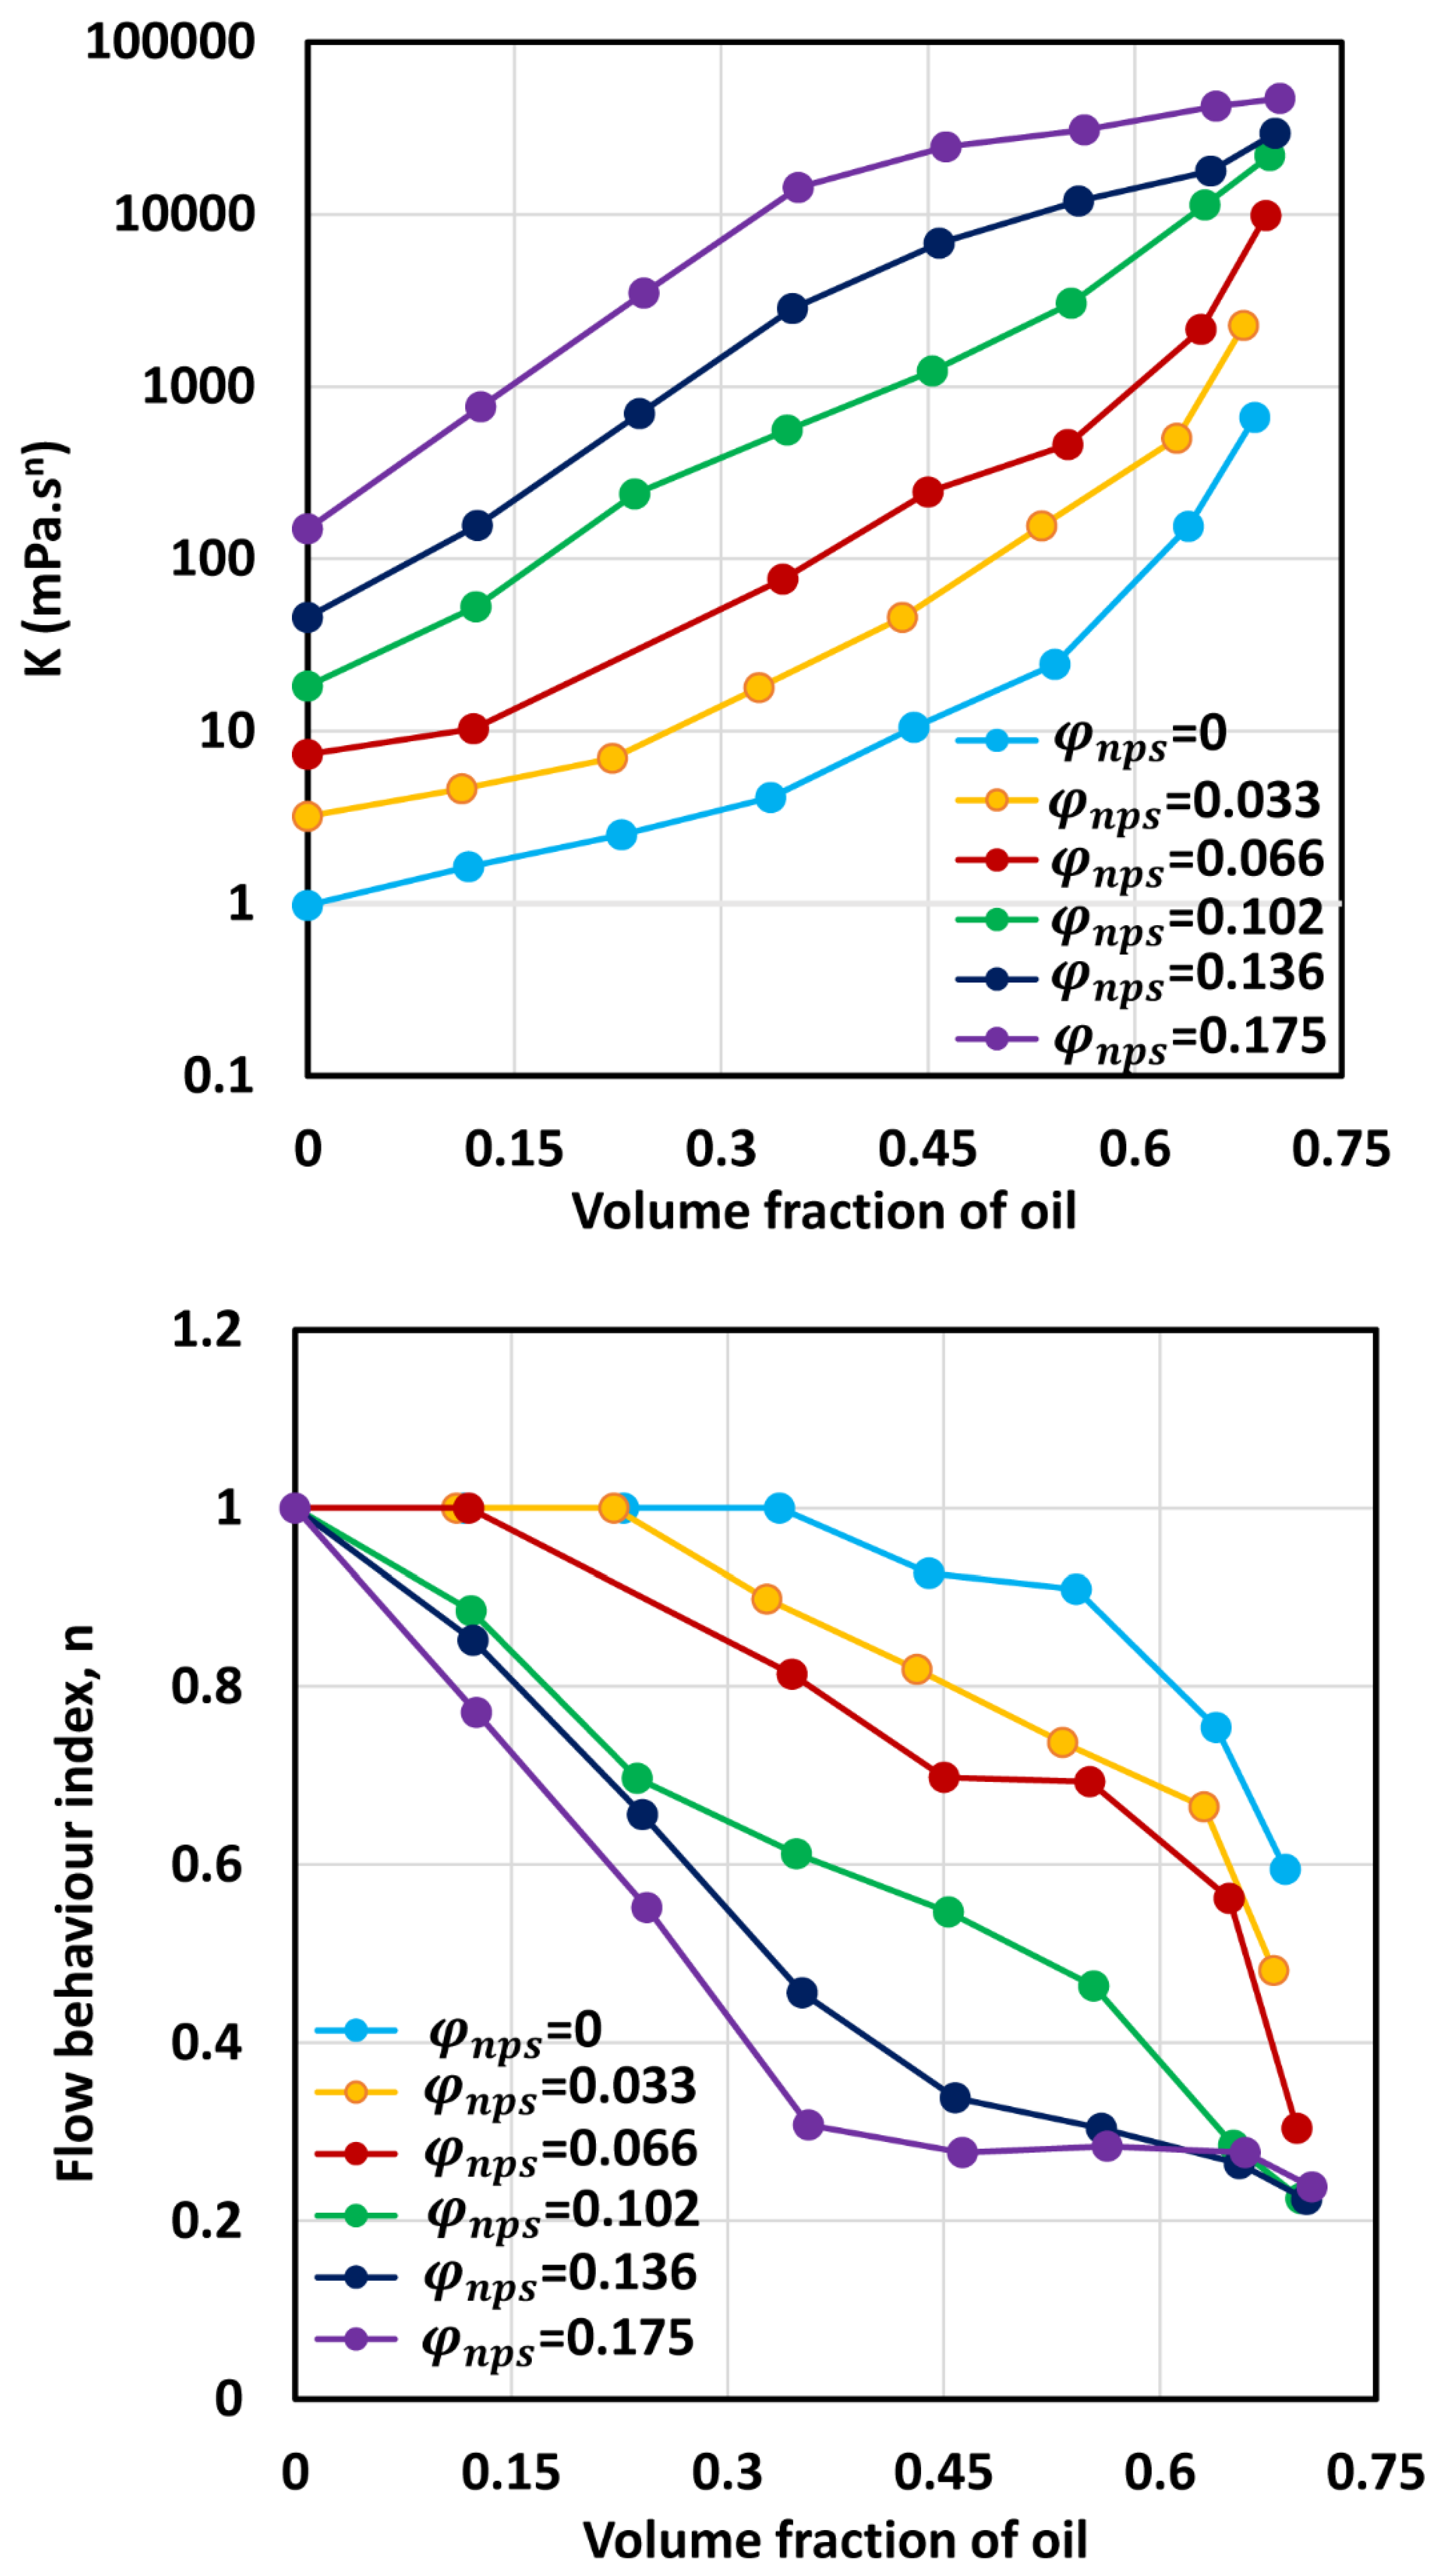
- The O/W emulsions thickened with starch nanoparticles are generally Newtonian at low concentrations of oil. At high concentrations of oil, the emulsions become non-Newtonian shear-thinning.
- The flow behavior of O/W emulsions thickened by starch nanoparticles can be described adequately using the power-law model.
- The power-law consistency index increases with increases in oil and nanoparticle concentrations.
- The power-law flow behavior index decreases with increases in oil and nanoparticle concentrations, indicating that emulsions become more shear-thinning with increases in oil and nanoparticle concentrations.
- The average droplet size of emulsions generally decreases with an increase in the nanoparticle concentration of the matrix phase. The droplet size distribution also becomes narrower with an increase in nanoparticle concentration.
- The creaming index of emulsions decreases the increases in oil and nanoparticle concentrations.
Author Contributions
Funding
Data Availability Statement
Conflicts of Interest
References
- Pal, R. Rheology of simple and multiple emulsions. Curr. Opin. Coll. Interface Sci. 2011, 16, 41–60. [Google Scholar] [CrossRef]
- Becher, P. Emulsions: Theory and Practice; R.E. Krieger Pub. Co.: Huntington, NY, USA, 1977. [Google Scholar]
- Friberg, S. Food Emulsions; Dekker: New York, NY, USA, 1976. [Google Scholar]
- Lissant, K.J. Emulsions and Emulsion Technology; Dekker: New York, NY, USA, 1974. [Google Scholar]
- El-Nokaly, M.; Cornell, D. Microemulsions and Emulsions in Foods; ACS Symposium Series 448; American Chemical Society: Washington, DC, USA, 1990. [Google Scholar]
- Becher, P. Encyclopedia of Emulsion Technology; Dekker: New York, NY, USA, 1985. [Google Scholar]
- Pal, R. Rheology of Particulate Dispersions and Composites; CRC Press: Boca Raton, FL, USA, 2007. [Google Scholar]
- Torrey, S. Emulsions and Emulsifier Applications-Recent Developments; Noyes Data Corporation: Park Ridge, NJ, USA, 1984. [Google Scholar]
- Bennet, H.; Bishop, J.L.; Wulfinghoff, M.F. Practical Emulsions—Applications; Chemical Publishing Co.: New York, NY, USA, 1968. [Google Scholar]
- Smith, A.L. Theory and Practice of Emulsion Technology; Academic Press: London, UK, 1976. [Google Scholar]
- Pal, R. Modeling of sedimentation and creaming in suspensions and Pickering emulsions. Fluids 2019, 4, 186. [Google Scholar]
- Robins, M.M. Emulsions-creaming phenomena. Curr. Opin. Coll. Interface Sci. 2000, 5, 265–272. [Google Scholar] [CrossRef]
- Pal, R. Rheology of polymer-thickened emulsions. J. Rheol. 1992, 36, 1245–1259. [Google Scholar] [CrossRef]
- Pal, R. Rheology of emulsions containing polymeric liquids. In Encyclopedia of Emulsion Technology; Becher, P., Ed.; Dekker: New York, NY, USA, 1996; pp. 93–263. [Google Scholar]
- Pal, R. Rheological properties of emulsions of oil in aqueous non-Newtonian media. Chem. Eng. Commun. 1992, 111, 45–60. [Google Scholar]
- Pal, R. Viscous properties of polymer-thickened water-in-oil emulsions. J. Appl. Polym. Sci. 1993, 49, 65–80. [Google Scholar] [CrossRef]
- Pal, R. Oscillatory, creep and steady flow behavior of xanthan-thickened oil-in-water emulsions. AIChE J. 1995, 41, 783–794. [Google Scholar] [CrossRef]
- Pal, R. Viscoelastic properties of polymer-thickened oil-in-water emulsions. Chem. Eng. Sci. 1996, 51, 3299–3305. [Google Scholar] [CrossRef]
- Pal, R. Rheological properties of mixed polysaccharides and polysaccharide-thickened emulsions. AIChE J. 1996, 42, 1824–1832. [Google Scholar] [CrossRef]
- Yang, Y.; Fang, Z.; Chen, X.; Zhang, W.; Xie, Y.; Chen, Y.; Liu, Z.; Yuan, W. An overview of Pickering emulsions: Solid-particle materials, classification, morphology, and applications. Front. Pharmacol. 2017, 8, 287. [Google Scholar] [CrossRef] [Green Version]
- Berton-Carabin, C.C.; Schroen, K. Pickering emulsions for food applications: Background, trends, and challenges. Annu. Rev. Food Sci. Technol. 2015, 6, 263–297. [Google Scholar] [CrossRef] [PubMed]
- Chevalier, Y.; Bolzinger, M.A. Emulsions stabilized with solid nanoparticles: Pickering emulsions. Colloids Surf. A 2013, 439, 23–34. [Google Scholar] [CrossRef]
- Timgren, A.; Rayner, M.; Dejmek, P.; Marku, D.; Sjoo, M. Emulsion stabilizing capacity of intact starch granules modified by heat treatment or octenyl succinic anhydride. Food Sci. Nutr. 2013, 1, 157–171. [Google Scholar] [CrossRef] [PubMed]
- Zoppe, J.O.; Venditti, R.A.; Rojas, O.J. Pickering emulsions stabilized by cellulose nanocrystals grafted with thermos-responsive polymer brushes. J. Colloid Interface Sci. 2012, 369, 202–209. [Google Scholar] [CrossRef] [PubMed]
- Chen, X.; Song, X.; Huang, J.; Wu, C.; Ma, D.; Tian, M.; Jiang, H.; Huang, P. Phase behavior of Pickering emulsions stabilized by graphene oxide sheets and resins. Energy Fuels 2017, 31, 13439–13447. [Google Scholar] [CrossRef]
- Binks, B.P.; Fletcher, P.D.I.; Holt, B.L.; Beaussoubre, P. Phase inversion of particle-stabilized perfume oil-water emulsions: Experiment and theory. Phys. Chem. Chem. Phys. 2010, 12, 11954–11966. [Google Scholar] [CrossRef]
- Bains, U.; Pal, R. Rheology and catastrophic phase inversion of emulsions in the presence of starch nanoparticles. ChemEngineering 2020, 4, 57. [Google Scholar] [CrossRef]
- Pal, R. A simple model for the viscosity of Pickering emulsions. Fluids 2017, 3, 2. [Google Scholar] [CrossRef] [Green Version]
- Guida, C.; Aguiar, A.N.; Cunha, R.L. Green techniques for starch modification to stabilize Pickering emulsions: A current review and future perspectives. Curr. Opin. Food Sci. 2021, 38, 52–61. [Google Scholar] [CrossRef]
- Ge, S.; Xiong, L.; Li, M.; Liu, J.; Yang, J.; Chang, R.; Liang, C.; Sun, Q. Characterization of Pickering emulsions stabilized by starch nanoparticles: Influence of starch variety and particle size. Food Chem. 2017, 234, 339–347. [Google Scholar] [CrossRef]
- Xu, T.; Yang, J.; Hua, S.; Hong, Y.; Gu, Z.; Cheng, L.; Li, Z.; Li, C. Characteristics of starch-based Pickering emulsions from the interface perspective. Trends Food Sci. Technol. 2020, 105, 334–346. [Google Scholar] [CrossRef]
- Tan, Y.; Xu, K.; Liu, C.; Li, Y.; Lu, C.; Wang, P. Fabrication of starch-based nanospheres to stabilize Pickering emulsion. Carbohydr. Polym. 2012, 88, 1358–1363. [Google Scholar] [CrossRef]
- Zhu, F. Starch based Pickering emulsions: Fabrication, properties, and applications. Trends Food Sci. Technol. 2019, 85, 129–137. [Google Scholar] [CrossRef]
- Ogunlaja, S.B.; Pal, R.; Sarikhani, K. Effects of starch nanoparticles on phase inversion of Pickering emulsions. Can. J. Chem. Eng. 2018, 96, 1089–1097. [Google Scholar] [CrossRef]
- Pal, R. Effect of droplet size on the rheology of emulsions. AIChE J. 1996, 42, 3181–3190. [Google Scholar] [CrossRef]
- Pal, R. Viscosity and storage/loss moduli for mixtures of fine and coarse emulsions. Chem. Eng. J. 1997, 67, 37–44. [Google Scholar] [CrossRef]
- Pal, R. Scaling of relative viscosity of emulsions. J. Rheol. 1997, 41, 141–150. [Google Scholar] [CrossRef]
- Pal, R. New generalized viscosity model for non-colloidal suspensions and emulsions. Fluids 2020, 5, 150. [Google Scholar] [CrossRef]
- Wu, Y.; Pal, R. Rheology and pipeline flow behavior of starch nanoparticle dispersions. J. Nanofluids 2018, 7, 1–10. [Google Scholar] [CrossRef]
- Pal, R. Yield stress and viscoelastic properties of high internal phase ratio emulsions. Colloid Polym. Sci. 1999, 277, 583–588. [Google Scholar] [CrossRef]
- Pal, R. Rheology of high internal phase ratio emulsions. Food Hydrocoll. 2006, 20, 997–1005. [Google Scholar] [CrossRef]
- Li, M.; Wu, Q.; Moon, R.J.; Hubbe, M.A.; Bortner, M.J. Rheological aspects of cellulose nanomaterials: Governing factors and emerging applications. Adv. Mater. 2021, 33, 2006052. [Google Scholar] [CrossRef] [PubMed]


| Food Product | Dispersed Phase | Continuous Phase | Volume Fraction of Dispersed Phase |
|---|---|---|---|
| Milk | Oil droplets | Water | 0.03 to 0.04 |
| Mayonnaise | Oil droplets | Water | ≥0.65 |
| Butter | Water droplets | Oil and fat crystals | About 0.16 |
| Margarine | Water droplets | Oil and fat crystals | 0.16 to 0.50 |
| Salad dressings | Oil droplets | Water | ≥0.30 |
| Nanoparticle Concentration of Matrix Phase (wt%) | Nanoparticle Concentration of Matrix Phase (vol%) | Oil Concentration of Emulsion (wt%) | Oil Concentration of Emulsion (vol%) |
|---|---|---|---|
| 0 | 0 | Seven concentrations: 10.09, 20.05, 30.088, 40.03, 50.11, 60.06, 65.06 | Seven concentrations: 11.674, 22.8, 33.636, 44.011, 54.19, 63.91, 68.68 |
| 5.245 | 3.27 | Seven concentrations: 9.977, 19.962, 29.94, 39.974, 50, 59.973, 65 | Seven concentrations: 11.21, 22.127, 32.745, 43.14, 53.256, 63.058, 67.906 |
| 9.883 | 6.6 | Seven concentrations: 10.083, 20.153, 30.136, 40.142, 50.18, 60.13, 65.13 | Seven concentrations: 12.041, 23.554, 34.493, 45.014, 55.147, 64.80, 69.51 |
| 15.032 | 10.233 | Seven concentrations: 10.045, 20.01, 29.996, 39.99, 49.96, 59.99, 64.996 | Seven concentrations: 12.20, 23.73, 34.78, 45.33, 55.408, 65.108, 69.794 |
| 19.68 | 13.64 | Seven concentrations: 9.999, 20.04, 30, 40.023, 50.058, 60.015, 65.022 | Seven concentrations: 12.334, 24.094, 35.184, 45.802, 55.934, 65.526, 70.186 |
| 24.82 | 17.541 | Seven concentrations: 10, 19.982, 29.977, 40.04, 49.98, 59.95, 64.97 | Seven concentrations: 12.563, 24.39, 35.61, 46.313, 56.34, 65.915, 70.55 |
| Device | Inner Cylinder Radius, Ri | Outer Cylinder Radius, Ro | Length of Inner Cylinder | Gap-Width |
|---|---|---|---|---|
| Fann 35A/SR-12 | 1.7245 cm | 1.8415 cm | 3.8 cm | 0.117 cm |
| Haake Roto-visco RV 12 with MV I | 2.004 cm | 2.1 cm | 6.0 cm | 0.096 cm |
| Approximate Nanoparticle Concentration (wt% NPS) | Sauter Mean Diameter (µm) |
|---|---|
| 0 | 9.01 |
| 5 | 7.31 |
| 10 | 4.68 |
| 15 | 3.71 |
| 20 | 4.46 |
| 25 | 5.64 |
Publisher’s Note: MDPI stays neutral with regard to jurisdictional claims in published maps and institutional affiliations. |
© 2022 by the authors. Licensee MDPI, Basel, Switzerland. This article is an open access article distributed under the terms and conditions of the Creative Commons Attribution (CC BY) license (https://creativecommons.org/licenses/by/4.0/).
Share and Cite
Pal, A.; Pal, R. Rheology of Emulsions Thickened by Starch Nanoparticles. Nanomaterials 2022, 12, 2391. https://doi.org/10.3390/nano12142391
Pal A, Pal R. Rheology of Emulsions Thickened by Starch Nanoparticles. Nanomaterials. 2022; 12(14):2391. https://doi.org/10.3390/nano12142391
Chicago/Turabian StylePal, Anuva, and Rajinder Pal. 2022. "Rheology of Emulsions Thickened by Starch Nanoparticles" Nanomaterials 12, no. 14: 2391. https://doi.org/10.3390/nano12142391
APA StylePal, A., & Pal, R. (2022). Rheology of Emulsions Thickened by Starch Nanoparticles. Nanomaterials, 12(14), 2391. https://doi.org/10.3390/nano12142391