Article

Ti3C2Tx as a Sensor for SF6/N2 Nitrogen-Containing Fault Decomposition Characteristic Products: A Theoretical Study

1
School of Electrical Engineering and Automation, Wuhan University, Wuhan 430072, China
2
Hubei Key Laboratory of Power Equipment & System Security for Integrated Energy Resources, Wuhan 430072, China
3
Electric Power Research Institute, State Grid Chongqing Electric Power Company, Chongqing 401123, China
4
State Key Laboratory of Power Transmission Equipment & System Security and New Technology, Chongqing University, Chongqing 400044, China
*
Author to whom correspondence should be addressed.
Nanomaterials 2022, 12(13), 2311; https://doi.org/10.3390/nano12132311
Submission received: 1 June 2022 / Revised: 29 June 2022 / Accepted: 29 June 2022 / Published: 5 July 2022

Abstract

:
The SF6/N2 gas mixture is an alternative gas to SF6. SF6/N2 will decompose and generate nitrogenous characteristic gases, such as NO, NO2, N2O, and NF3, when exposed to long-term partial discharge. The adsorption models of Ti3C2Tx (T=O, F, OH) and NO, NO2, N2O, NF3 were constructed, and the most stable adsorption structure was selected in this paper. The electron density and density of states of the adsorption system were further analyzed to study the adsorption behavior, and the sensing performance was evaluated in the end. The results are as follows: four gases could be spontaneously adsorbed on Ti3C2Tx, and strong adsorption occurred when surface terminal groups were OH, forming hydrogen or chemical bonds with significant charge transfer. Results show that Ti3C2(OH)2 had a stronger sensing ability than Ti3C2F2 and Ti3C2O2. The conductivity of the Ti3C2Tx with different terminal groups was improved after the adsorption of NO and NO2, showing Ti3C2Tx had a good sensing ability for NO and NO2. It was difficult for the four gases to desorb from the Ti3C2(OH)2 surface, but the adsorption on the Ti3C2F2, Ti3C2O2 surface had a short recovery time at room temperature.

Graphical Abstract

1. Introduction

SF6 has been widely used in high-voltage electrical equipment because of its excellent insulation and arc extinguishing properties. However, SF6 is a greenhouse gas, and its global warming potential is 23,900 times that of CO2, and it can exist in the atmosphere for more than 3200 years. It is one of the six greenhouse gases prohibited by the Kyoto Protocol [1,2,3]. In order to relieve the environmental pressure brought about by SF6, the power industry has used the SF6/N2 gas mixture as an insulation medium. SF6/N2 not only has good insulation performance but also solves the problem of high SF6 liquefaction temperature. It can effectively reduce the use and emission of SF6 and relieve the greenhouse effect of SF6 [4,5,6].
In the long-term running of power equipment, various insulation defects will unavoidably occur, and insulation faults, such as partial discharge or overheating, will be generated under the combined action of voltage and current. SF6/N2 will gradually decompose under the continuous action of these faults, generating not only sulfur-containing characteristic gases, such as SO2, SOF2, SO2F2, and H2S [7], but also nitrogen-containing characteristic gases, such as NO, NO2, N2O, and NF3 [8,9,10]. Since the SF6/N2 fault decomposition process is directly related to the fault properties, the internal insulation fault of the equipment can be detected in time by monitoring fault decomposition characteristic products, which is essential for the safe operation of gas-insulated equipment [11,12].
Two-dimensional layered nanomaterials have excellent electrical, mechanical, and optical properties due to their unique structure, and their high specific surface area is conducive to gas adsorption and sensing [13,14,15,16,17]. Two-dimensional transition metal carbides, carbon and nitrogen compounds (collectively called MXene) have received a lot of attention and research from researchers since their discovery in 2011. MXene has the chemical formula Mn+1XnTx (n = 1–3), where M represents the transition metal (such as Sc, Ti, Zr, Hf, V, Nb, Ta, Cr, Mo, etc.), X is carbon or nitrogen, and Tx stands for terminal group, such as fluorine, oxygen, or hydroxyl. Ti3C2Tx was the first MXene synthesized and has been used in many sensing-related studies.
Eunji Lee et al. [18] prepared a sensor of Ti3C2Tx and successfully detected all the tested volatile organic compound gases at room temperature. Then, they proposed a possible sensing mechanism for the sensor by analyzing the interaction between the gas and the majority carrier of the material. Chen et al. [19] chose Ti3C2Tx and WSe2 as materials for hybridization and prepared the Ti3C2Tx/WSe2 hybrid sensor with low noise level and ultra-fast response and recovery time. It has high sensitivity and selectivity for detecting oxygenated volatile organic compounds. Wu et al. [20] realized the detection of NH3 by Ti3C2Tx at room temperature and investigated its highly selective adsorption behavior using the density functional theory (DFT) calculations. Kong et al. [21] adsorbed SF6 decomposition gas on Ti3C2Tx using Quantum Espresso software and modified the surface of Ti3C2Tx by adding atomic vacancies. The results showed that Ti3C2Tx with dot vacancies can detect SF6 decomposition products with high sensitivity and low electronic noise, and the sensitive detection ability for SO2 is especially obvious.
Based on the previous research on gas-sensitive sensing of Ti3C2Tx for sulfur-containing gases [22], this paper performed first-principle calculations on the adsorption behavior of SF6/N2 nitrogen-containing fault decomposition characteristic components on the surface of Ti3C2Tx with different terminal groups, and adsorption morphology, adsorption distance, adsorption energy, charge transfer, electron density, and density of states were analyzed to explore the gas sensing ability of Ti3C2Tx with different terminal groups for NO, NO2, N2O, and NF3.

2. Computational Methods

This paper is mainly based on the DFT. The simulation calculations regarding the adsorption system of gas molecules with Ti3C2Tx are carried out in the DMol3 module of Material Studio [23]. In this paper, a 3 × 3 × 1 periodic supercell of Ti3C2Tx is established. Firstly, NO, NO2, N2O, and NF3 gases are placed on the surface of Ti3C2Tx, and multiple directions and different possible sites of gas molecules adsorption are considered. Then, the most stable adsorption site of gas molecules is finally selected for further analysis according to the energy of the system. The K-point settings of the Brillouin zone for structure optimization and electronic property calculation are 4 × 4 × 1 and 8 × 8 × 1, respectively, and the optimization of the structure, energy, and related properties of the gas–solid interface system are calculated by the GGA-PBE method [24,25]. The DNP basis group is chosen for the expansion of the electronic wave function [26], and the Grimme method in the DFT-D dispersion correction is used to describe the van der Waals interaction forces [27,28]. For the paramagnetic molecules NO, NO2, and N2O, the computational setup takes into account the spin polarization [29]. The all-electron model is used for the core treatment of the gas molecules, and the DFT Semi-core pseudopotential (DSPP for short) is used for the solid surface. The energy convergence threshold, the maximum force threshold, and the maximum displacement threshold for geometric optimization are set to 2.0 × 10⁻⁵ Ha, 0.004 Ha/Å, and 0.005 Å, respectively, and the convergence accuracy of SCF is 1.0 × 10⁻⁵. The direct inversion DIIS value in the SCF iterative subspace is set to 6, and the smearing value of the thermal tailing effect is set to 0.005 Ha. In addition, to eliminate the interaction of adjacent layers, a 25 Å vacuum layer is set in the z-direction. The strength of the interaction between the gas molecules and the sensing material is expressed by the adsorption energy (Eads) as follows:
Eads = EtotalEgasEsubstrate
where E t o t a l , E g a s , and E s u b s t r a t e represent the total energy of the gas/Ti3C2Tx adsorption system, isolated gas molecule, and pristine Ti3C2Tx, respectively.
Qt represents the charge transfer between the gas molecule and Ti3C2Tx during the adsorption as follows:
Qt = Q1Q2
where Q1 and Q2 represent the total charges of the adsorbed and the isolated gas molecules. A negative value of Qt means the electrons’ transfer from the substrate to gas molecules.

3. Results and Discussion

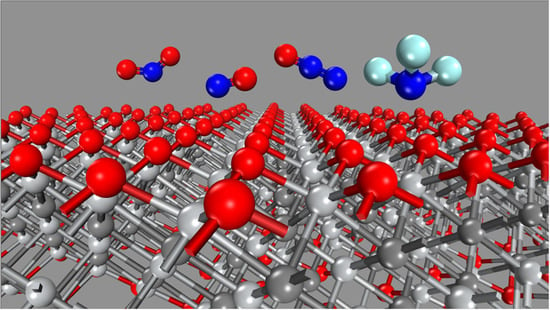
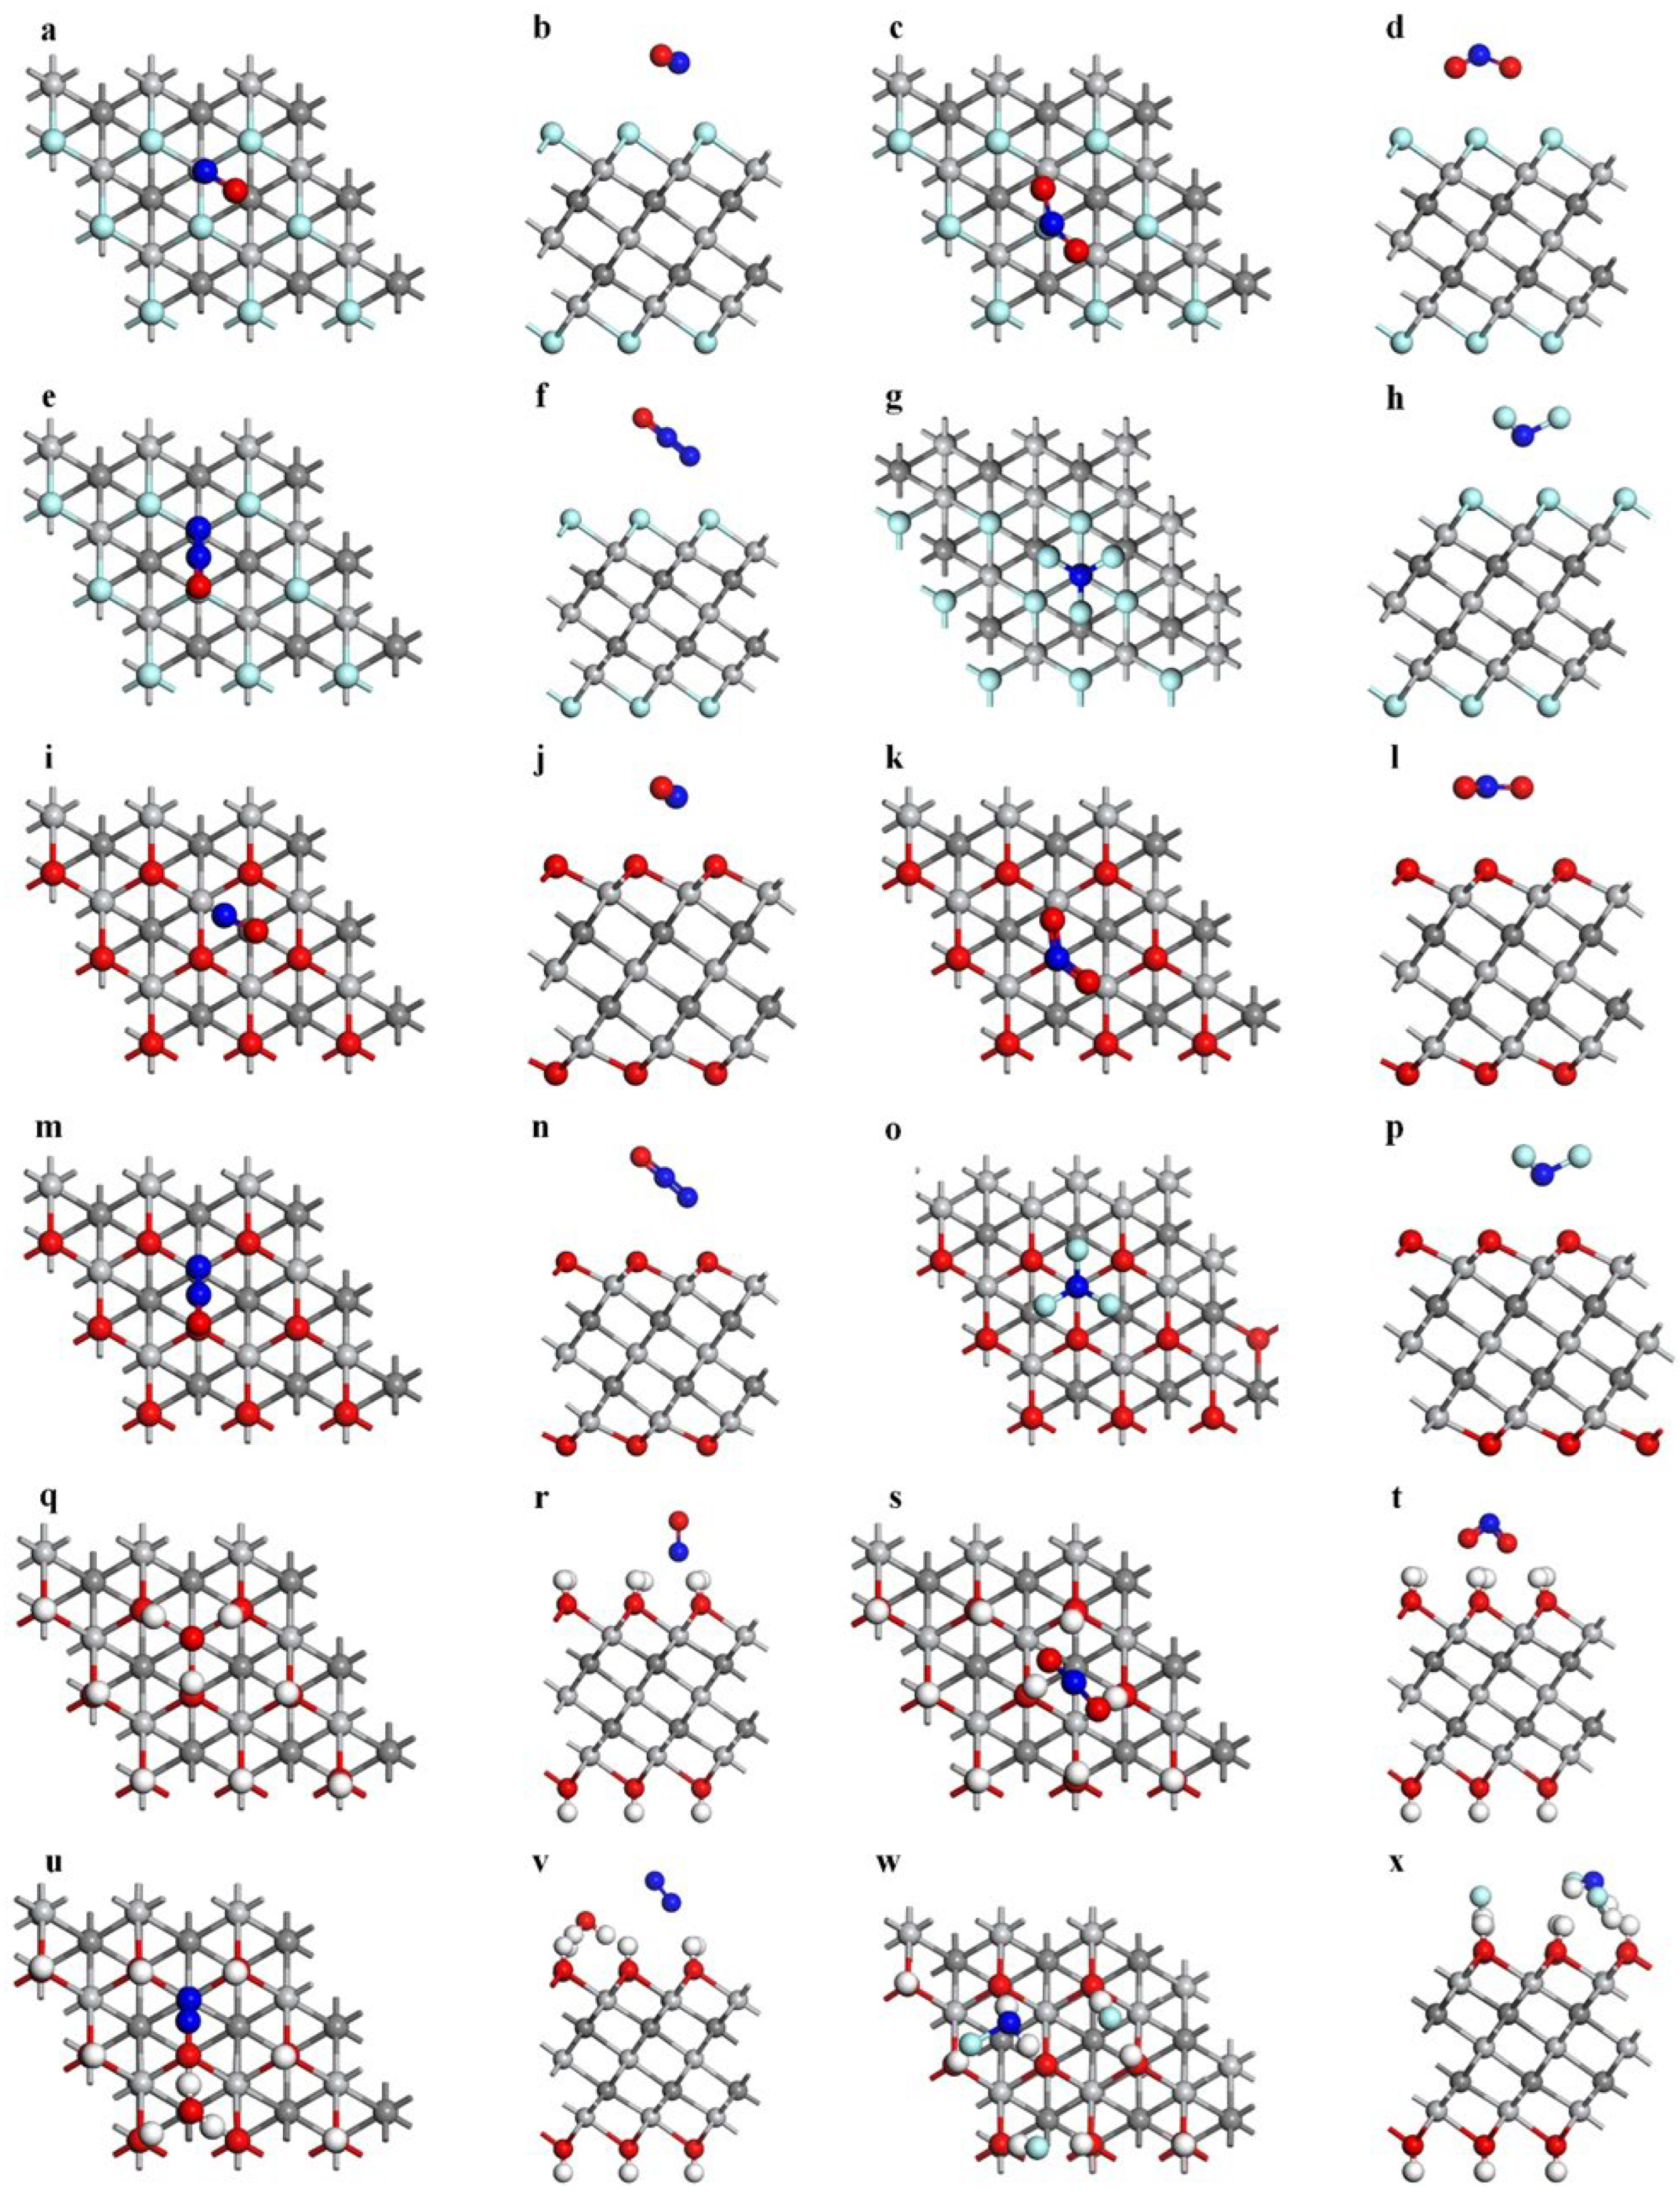
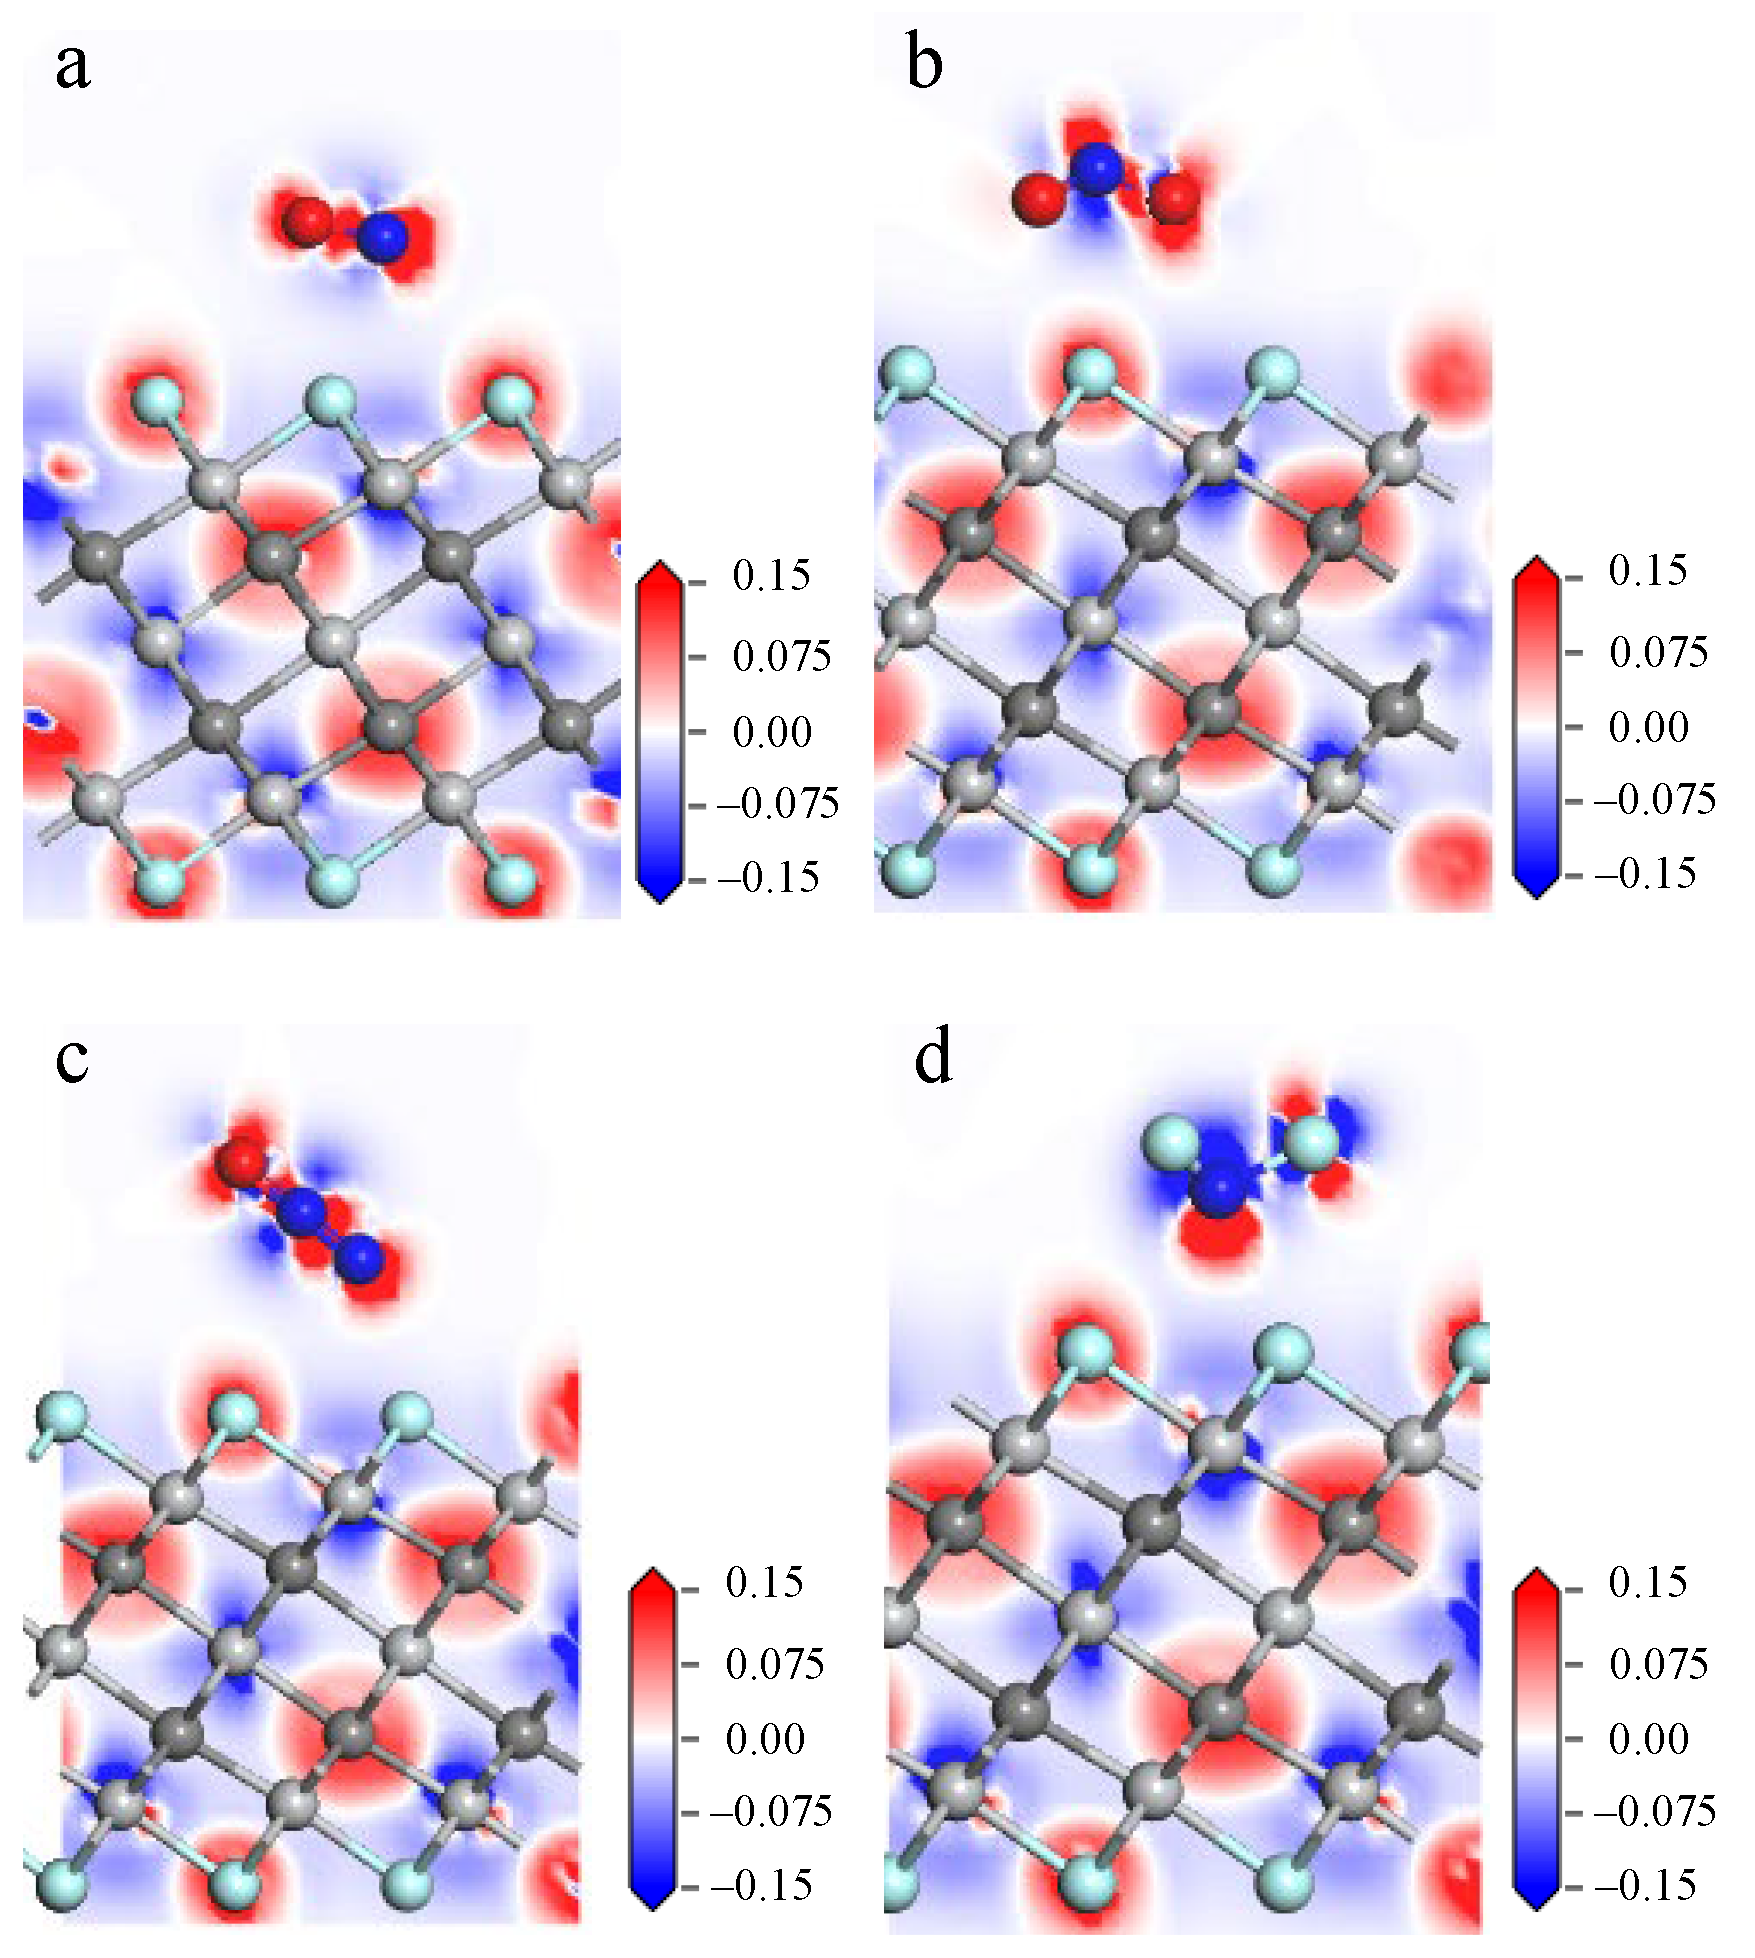
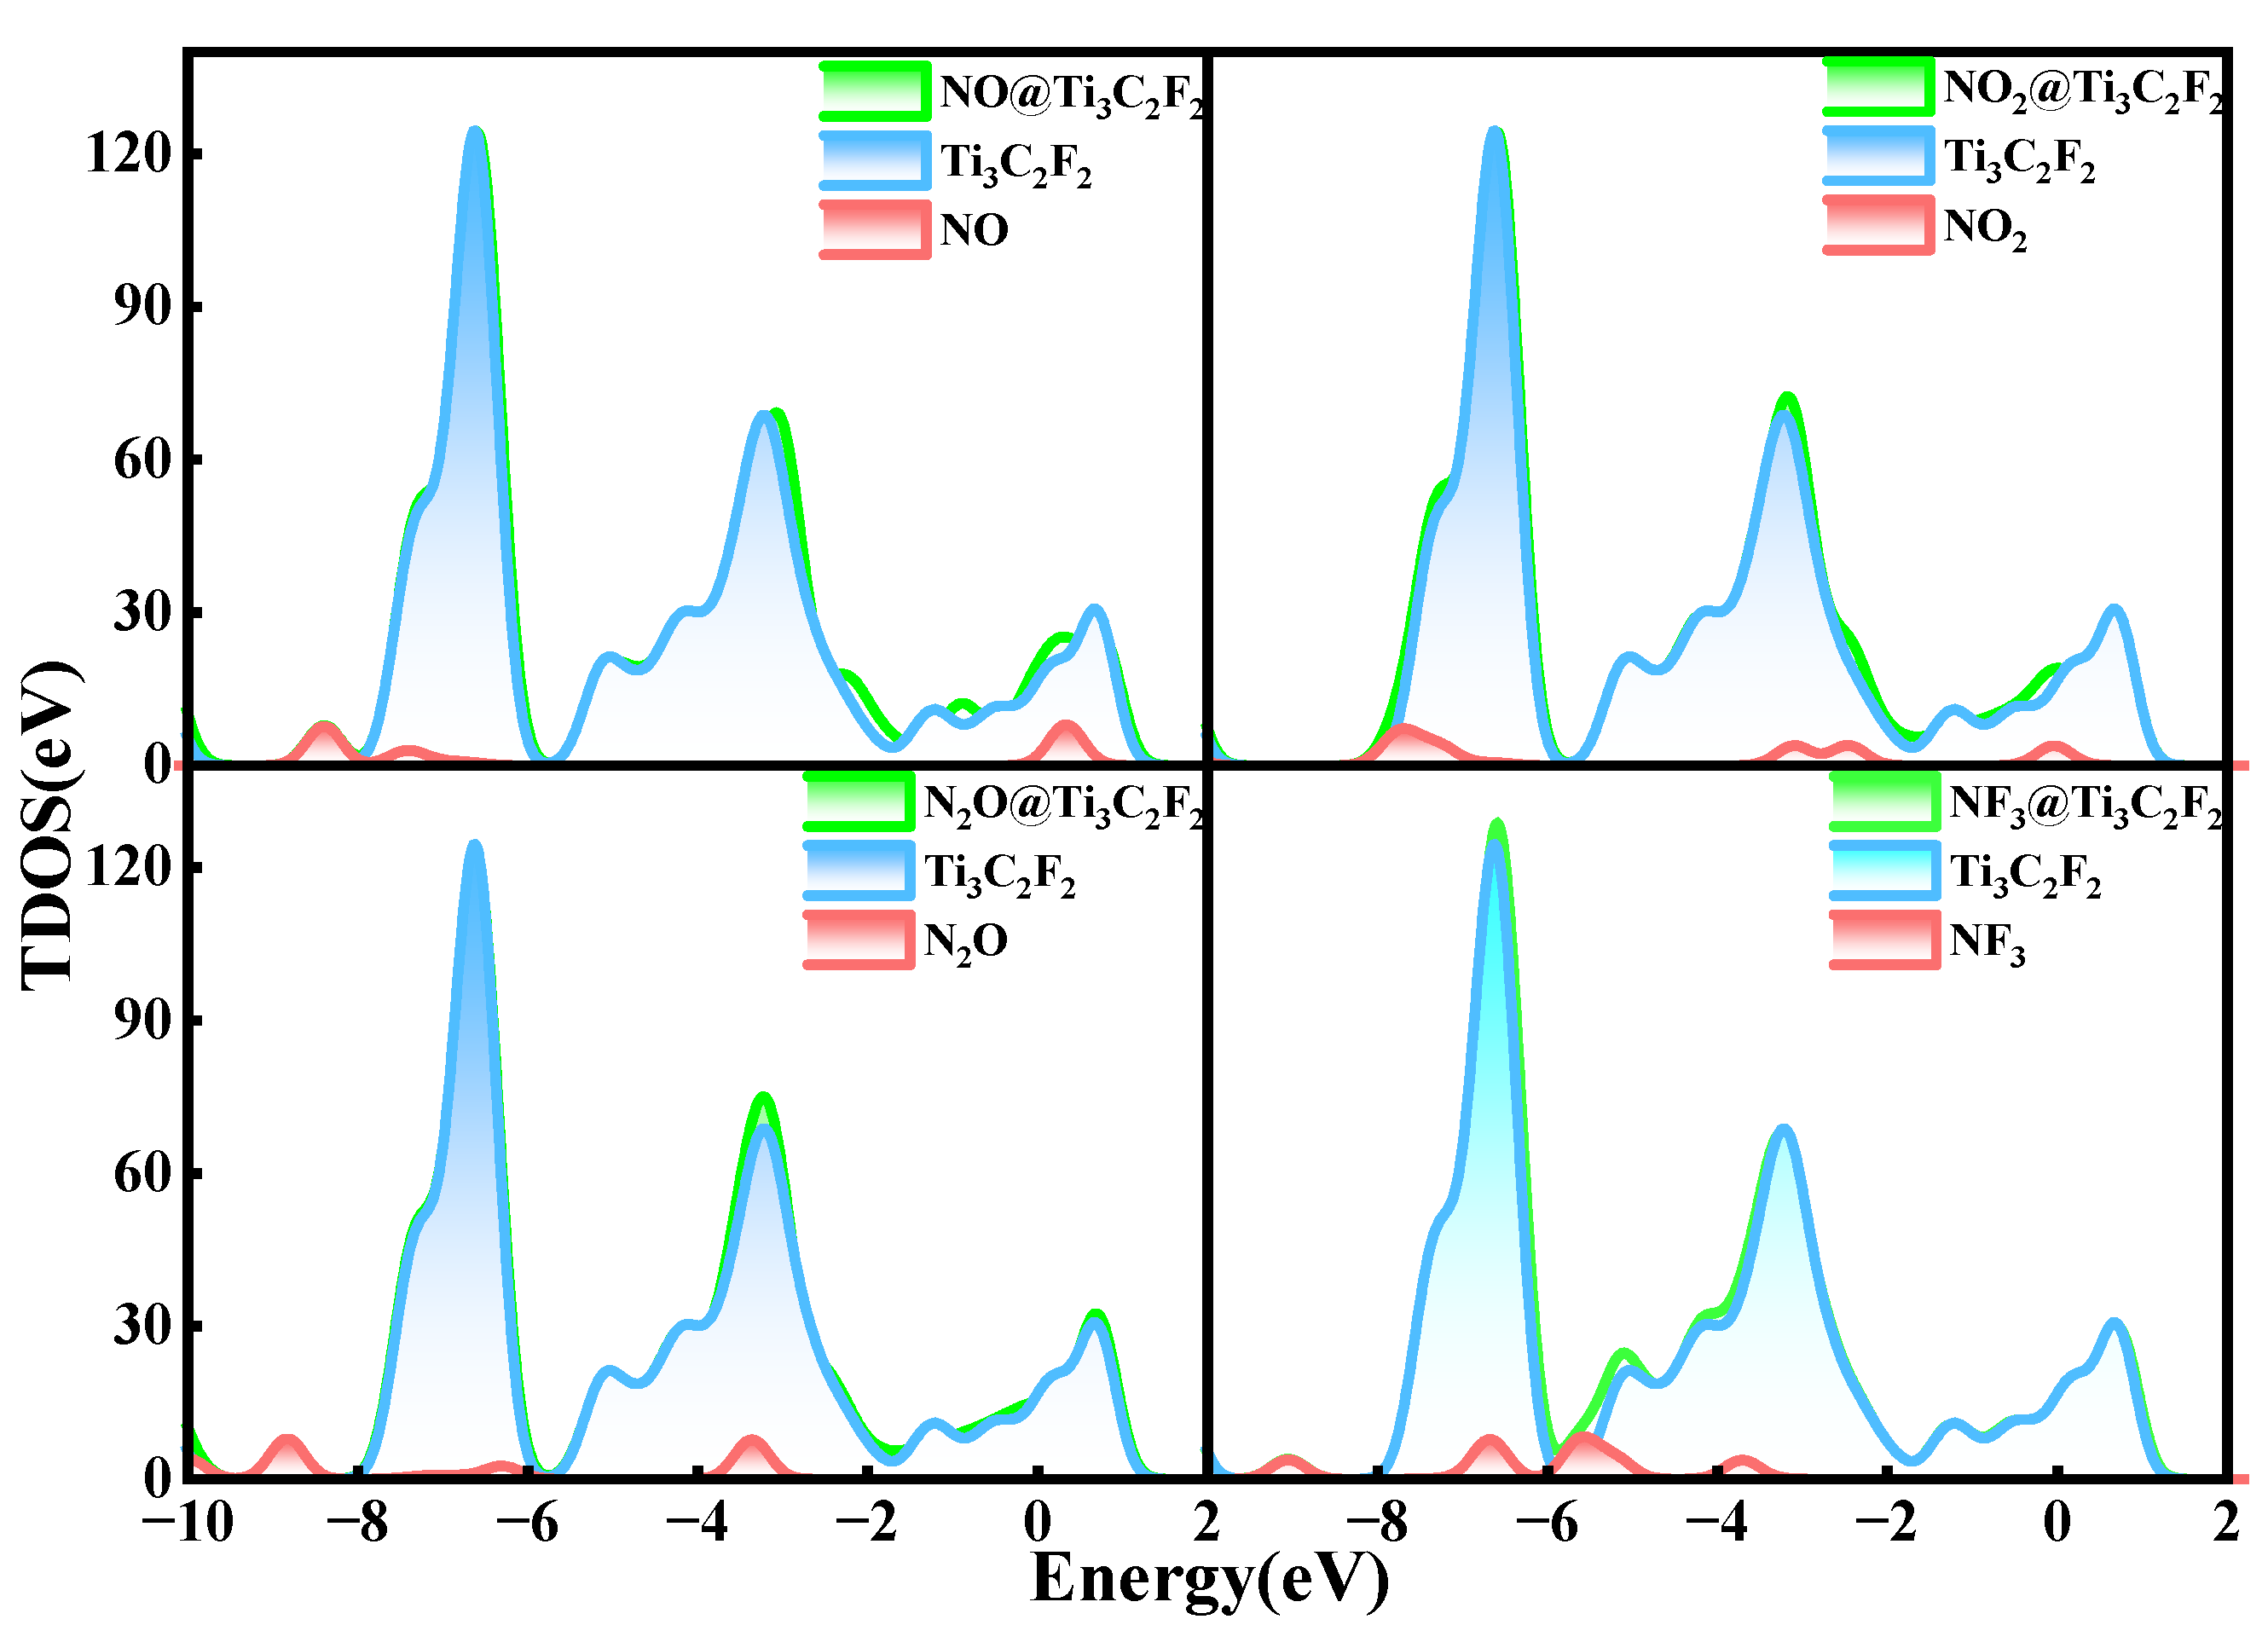
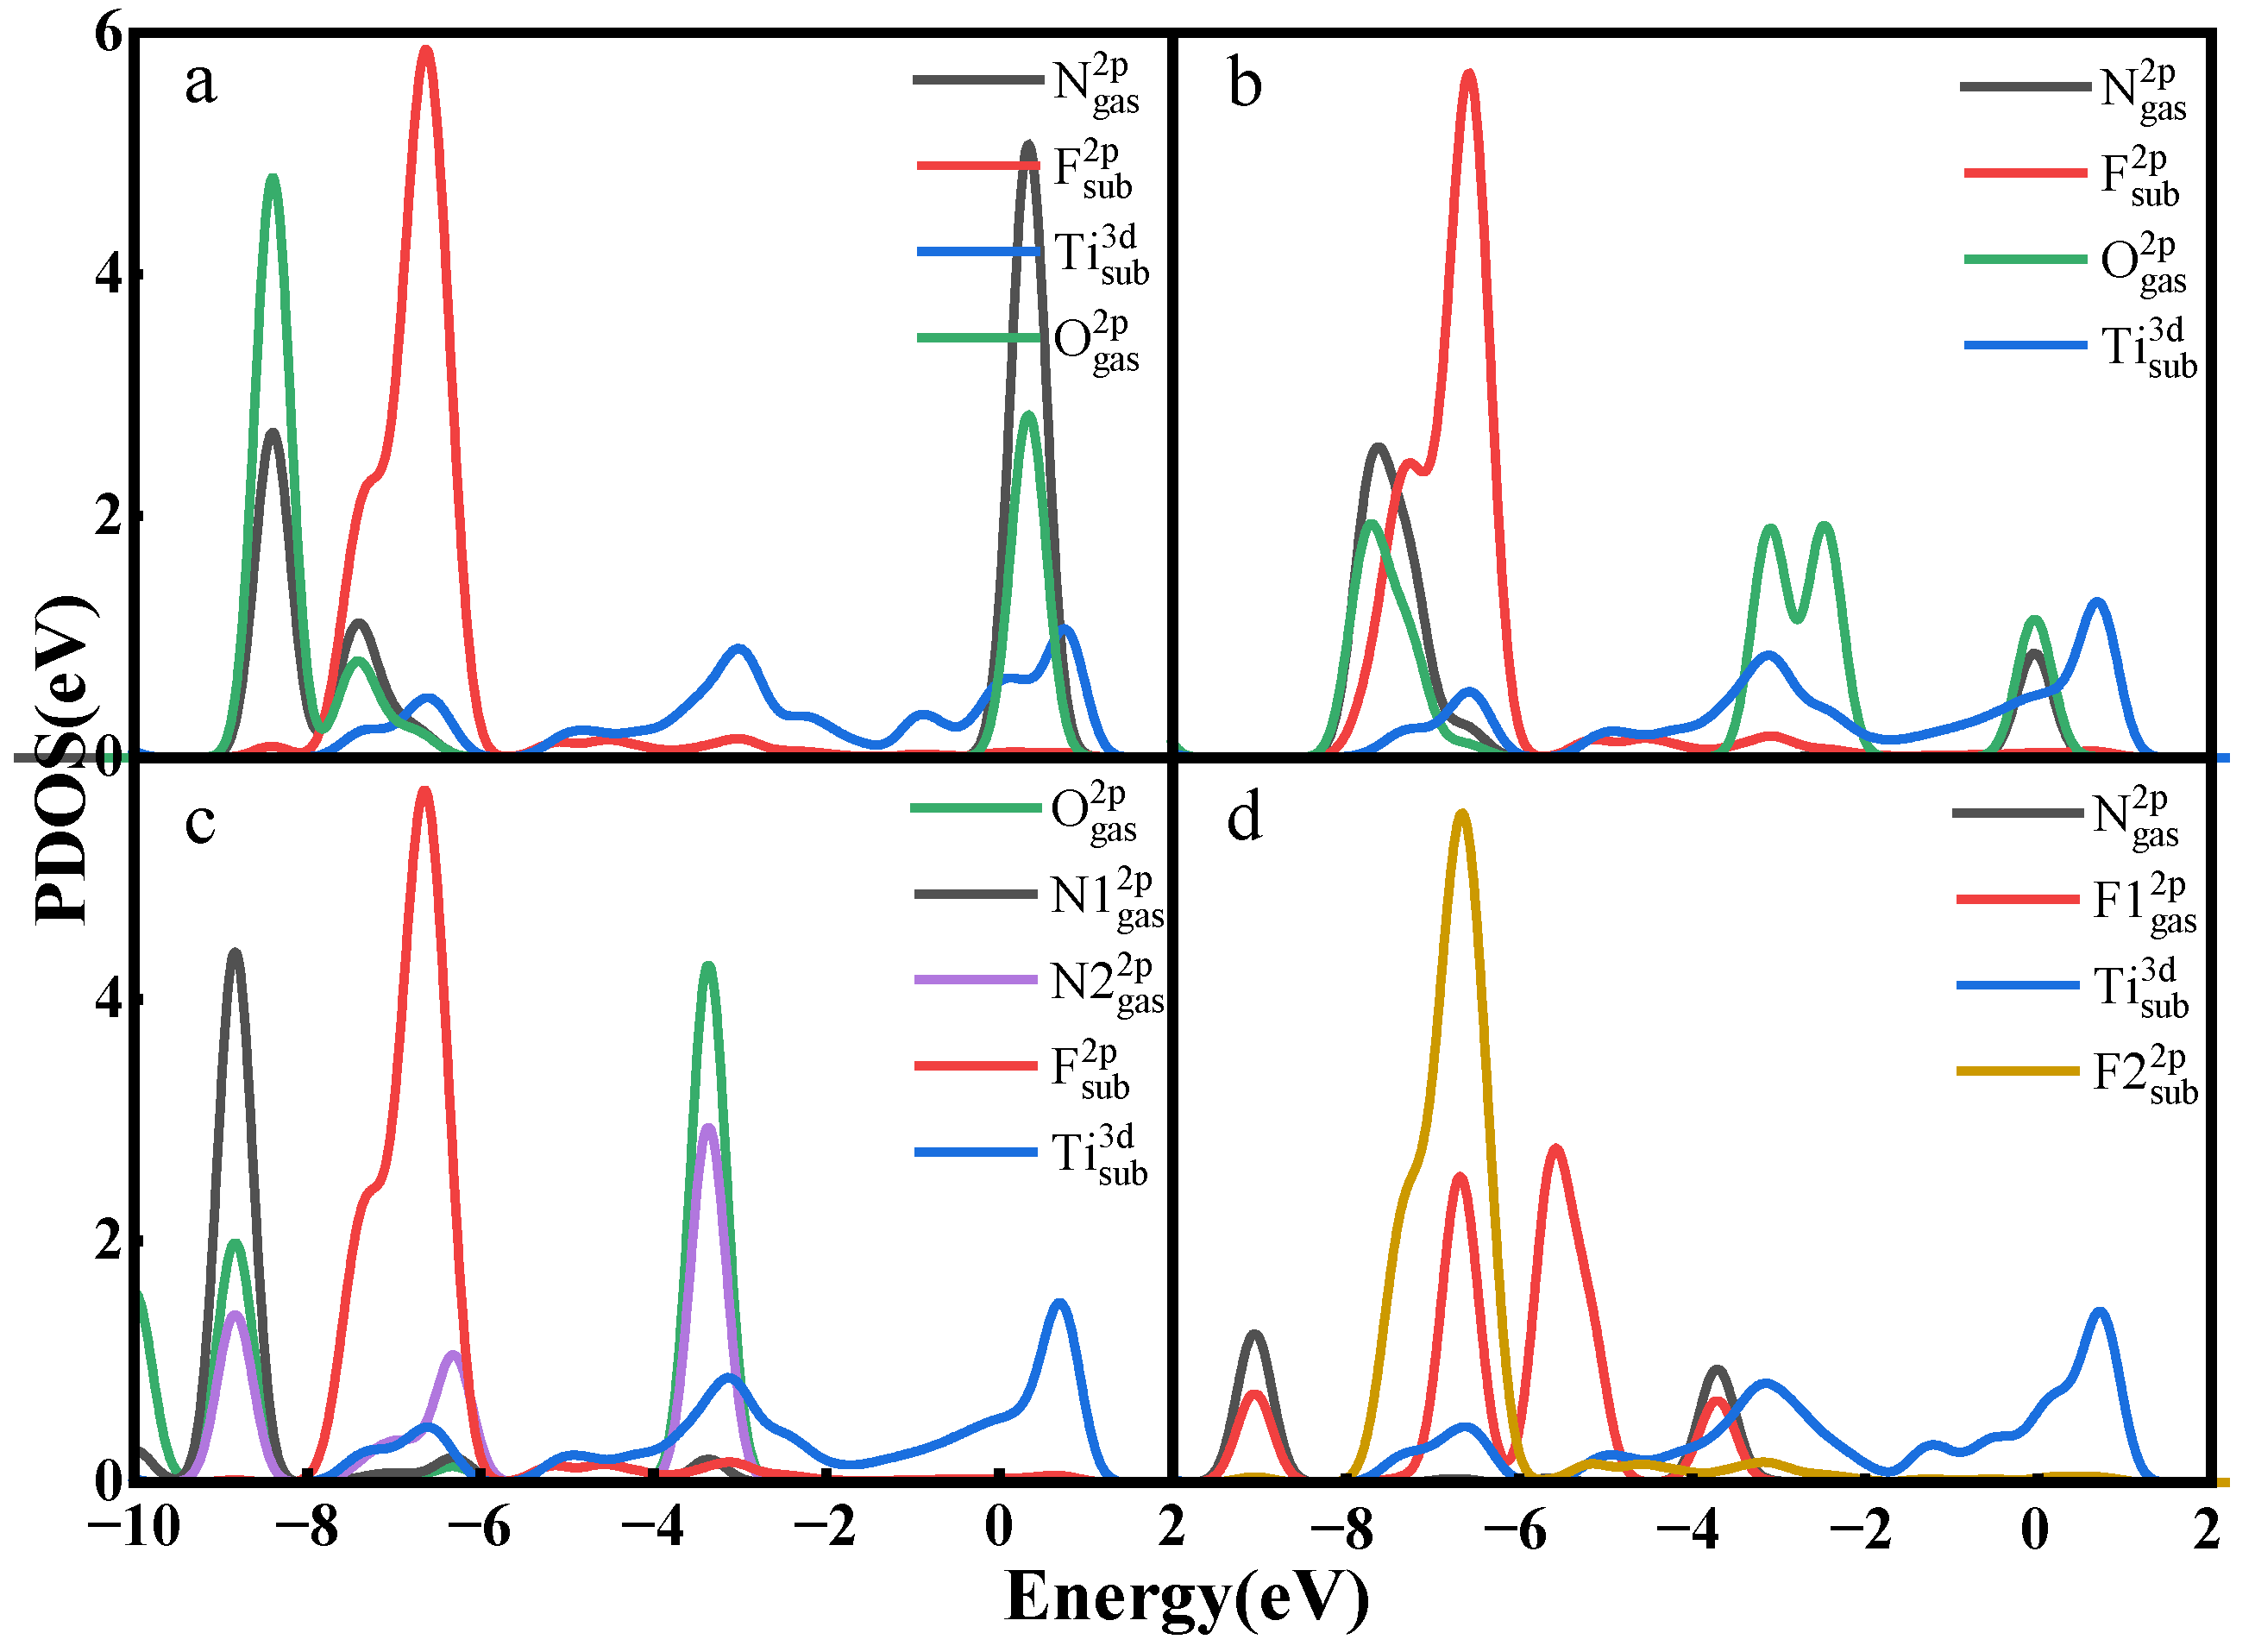
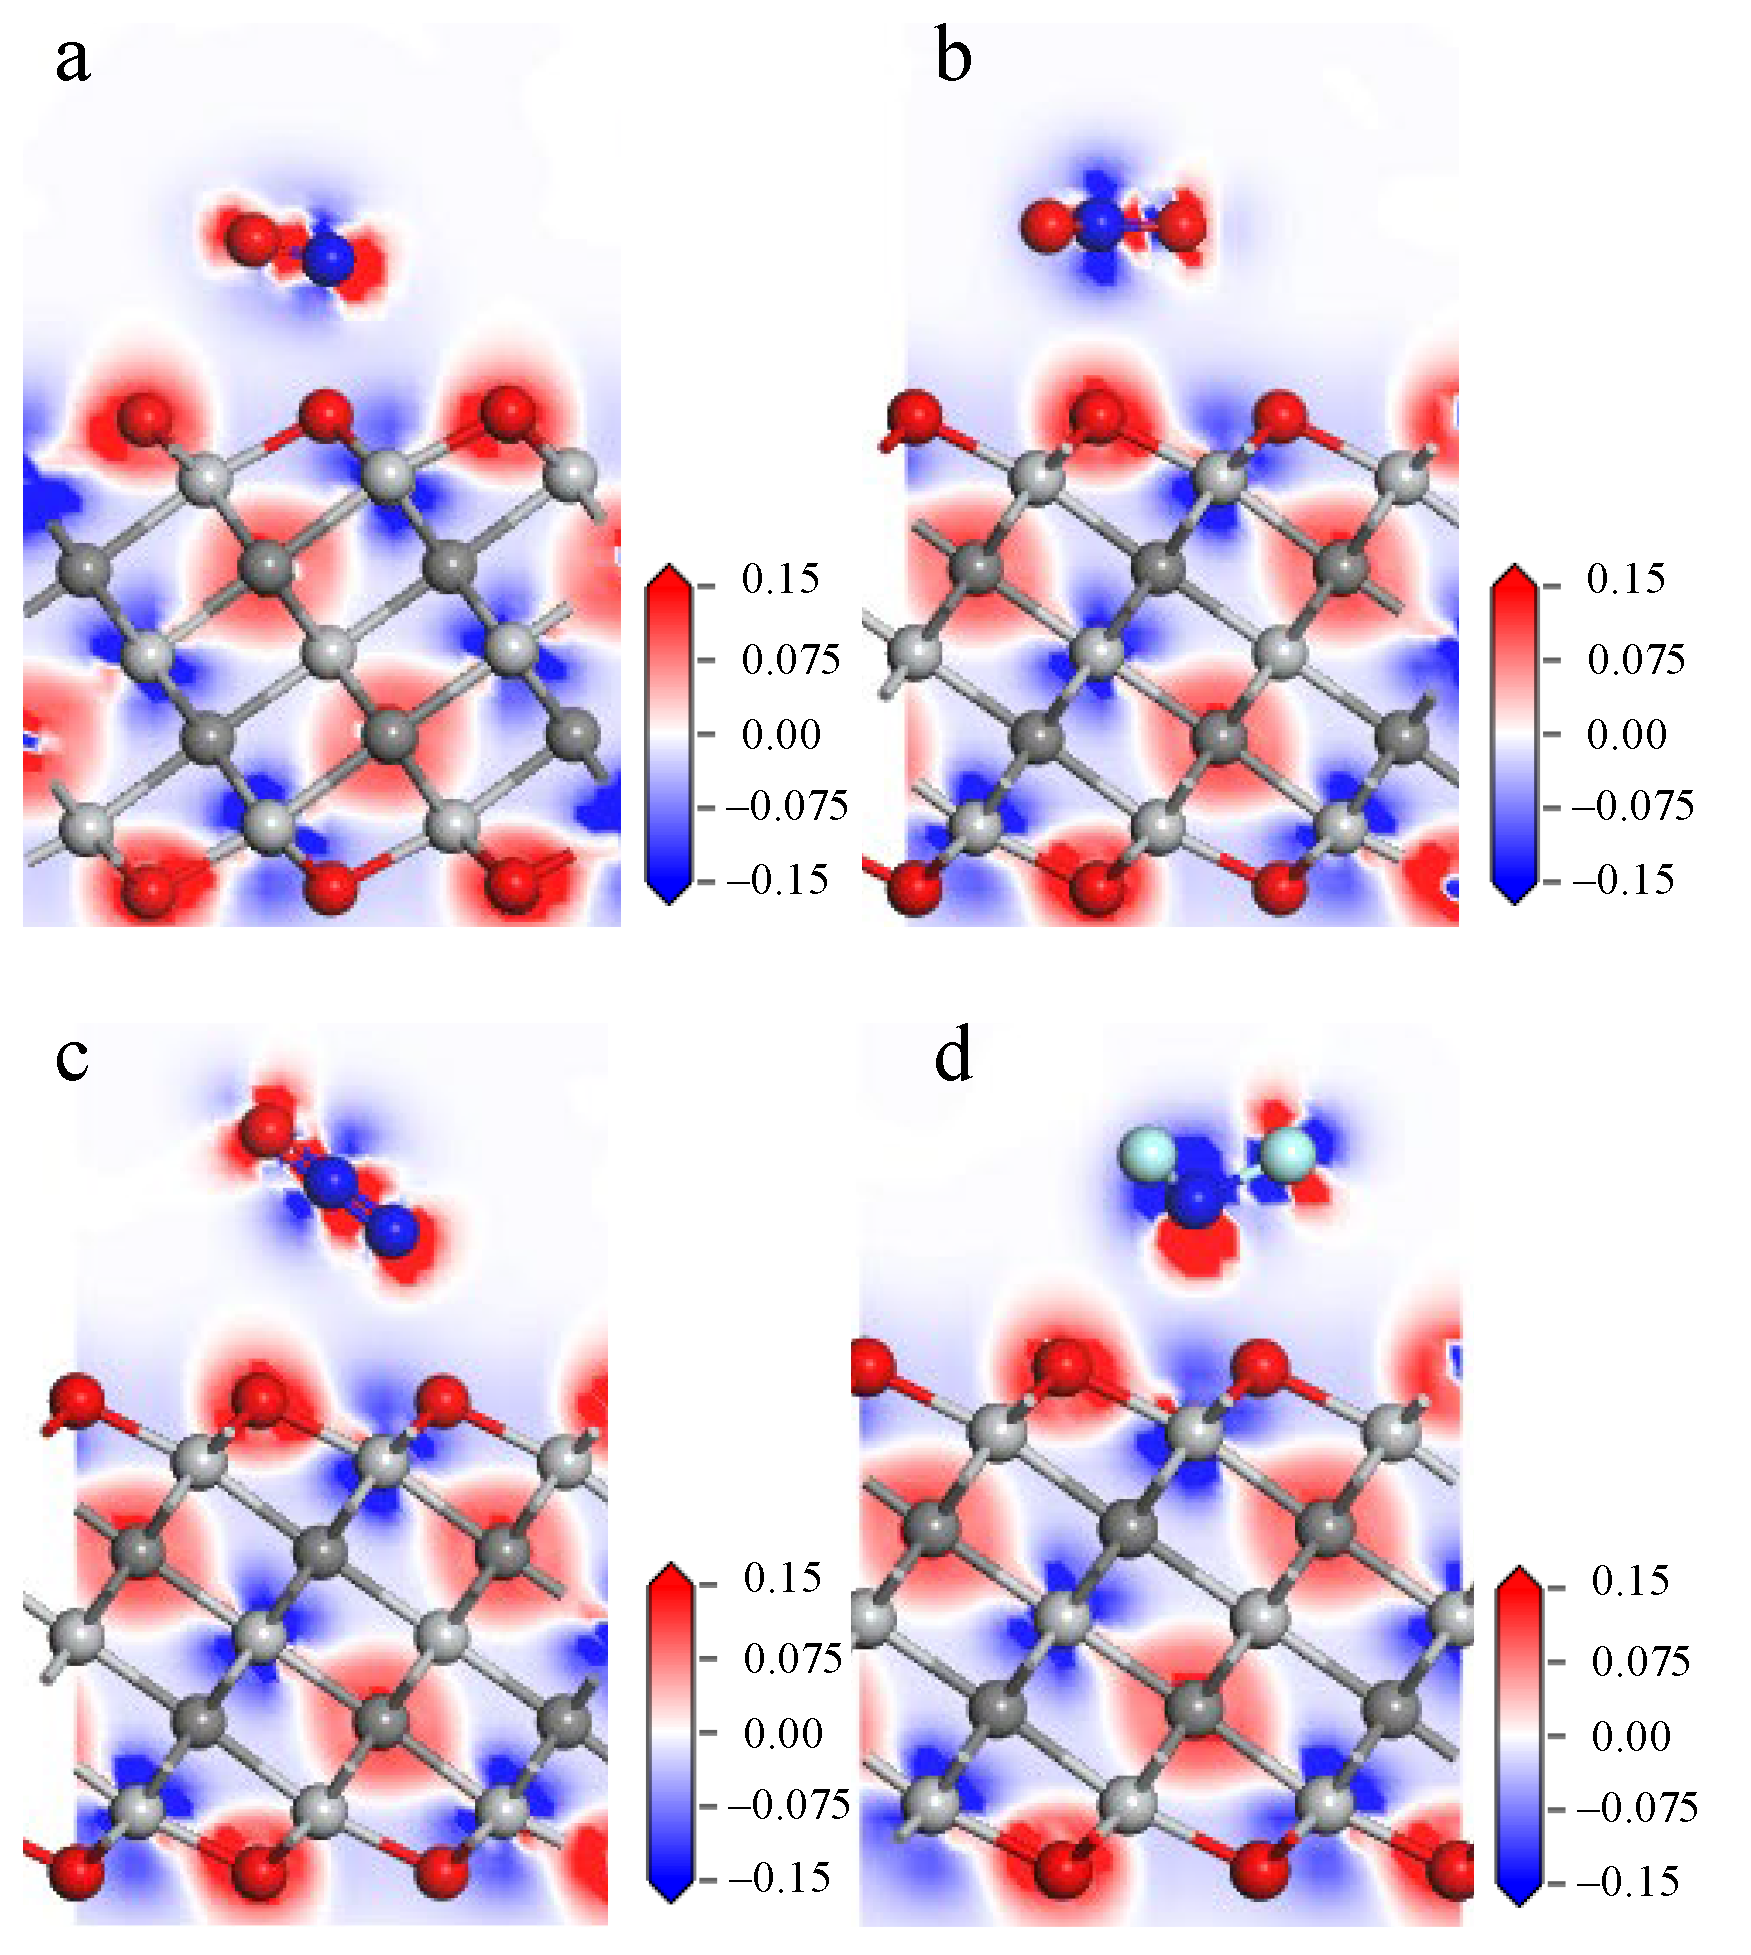
3.1. Gas Adsorption on Ti3C2F2

When gas molecules make contact with Ti3C2F2 surface, adsorption may occur at different sites. The most stable adsorption sites of gas molecules and the orientation of adsorption on Ti3C2F2 were selected according to the value of adsorption energy, as shown in Figure 1, where Figure 1a–h show the top and side views of the gas after adsorption. The structure after adsorption shows that no significant changes occur in the gases as well as the substrate material during the adsorption process. The adsorption distances of gas molecules with Ti3C2F2 are all between 2.8 Å and 3.0 Å, as shown in Table 1. After measurement and comparison, the bond length of the adsorbed gas molecules does not change significantly, and the specific values of the bond length change are shown in Table 1 (The original bond lengths of the four gas molecules are shown in Figure S1). Table 2 gives the adsorption energies of the four gas molecules on the best adsorption sites of Ti3C2F2, and the adsorption energies of NO, NO2, N2O, and NF3 are −0.216 eV, −0.213 eV, −0.273 eV, and −0.323 eV, respectively. The negative adsorption energies indicate that the adsorption of gases does not require external energy.
Electron density represents the probability of finding electrons at specific locations around atoms or molecules. The deformation charge density is the difference between the electron density after bonding and the atomic charge density at the corresponding point. By calculating and analyzing the deformation charge density, one can understand the bonding of the atoms in the system and the charge transfer during the bonding process. Figure 2 lists the deformation charge density diagrams for the NO, NO2, N2O, and NF3 adsorption models (red represents electron gain, and blue represents electron loss). There is not much charge aggregation between the gas molecules and the atoms on the material surface, as shown in the four pictures below, indicating a weak bonding behavior between them. In addition, the charge transfer values in the adsorption structure are given in Table 2. NO, N2O, and NF3 lose 0.111 e, 0.008 e, and 0.014 e, respectively, while NO2 gains 0.129 e from the surface of Ti3C2F2, and NO and NO2 have a large charge transfer in the process of adsorption.
To further clarify the electronic structure characteristics of the adsorption systems, the total density of states (TDOS) and partial density of states (PDOS) of all adsorption systems are analyzed. The TDOS plots of Ti3C2F2 after gas adsorption are shown in Figure 3. The density of states of the whole system after the adsorption of NO and NO2 experiences a significant increase near the Fermi energy level, indicating that the adsorption of these two gases enhances the conductivity of the material. This phenomenon does not occur after the adsorption of N2O and NF3. As seen from the figure, the effects of N2O and NF3 on the whole adsorption system are below −3 eV, and the density of states of the whole system does not change greatly after adsorption. So, the adsorption of these two gases does not significantly enhance the conductivity of the material. These findings are consistent with the value of the charge transfer reflected in Table 2.
In the PDOS of Figure 4, only a small part of the orbital overlaps between the atoms of NO, NO2, and N2O and the atoms of the material surface, indicating that the interactions between the atoms are not strong. The F 2p orbital of NF3 has a partial overlap with the F 2p orbital of the surface around −7 eV, indicating that there are some interactions between them but not the formation of a strong chemical bond. Taking all the analyses together, the adsorption of the gases on the Ti3C2F2 surface is a physical adsorption, and there is no new chemical bond formed between the atoms composing the gas molecules and the atoms on the material surface.

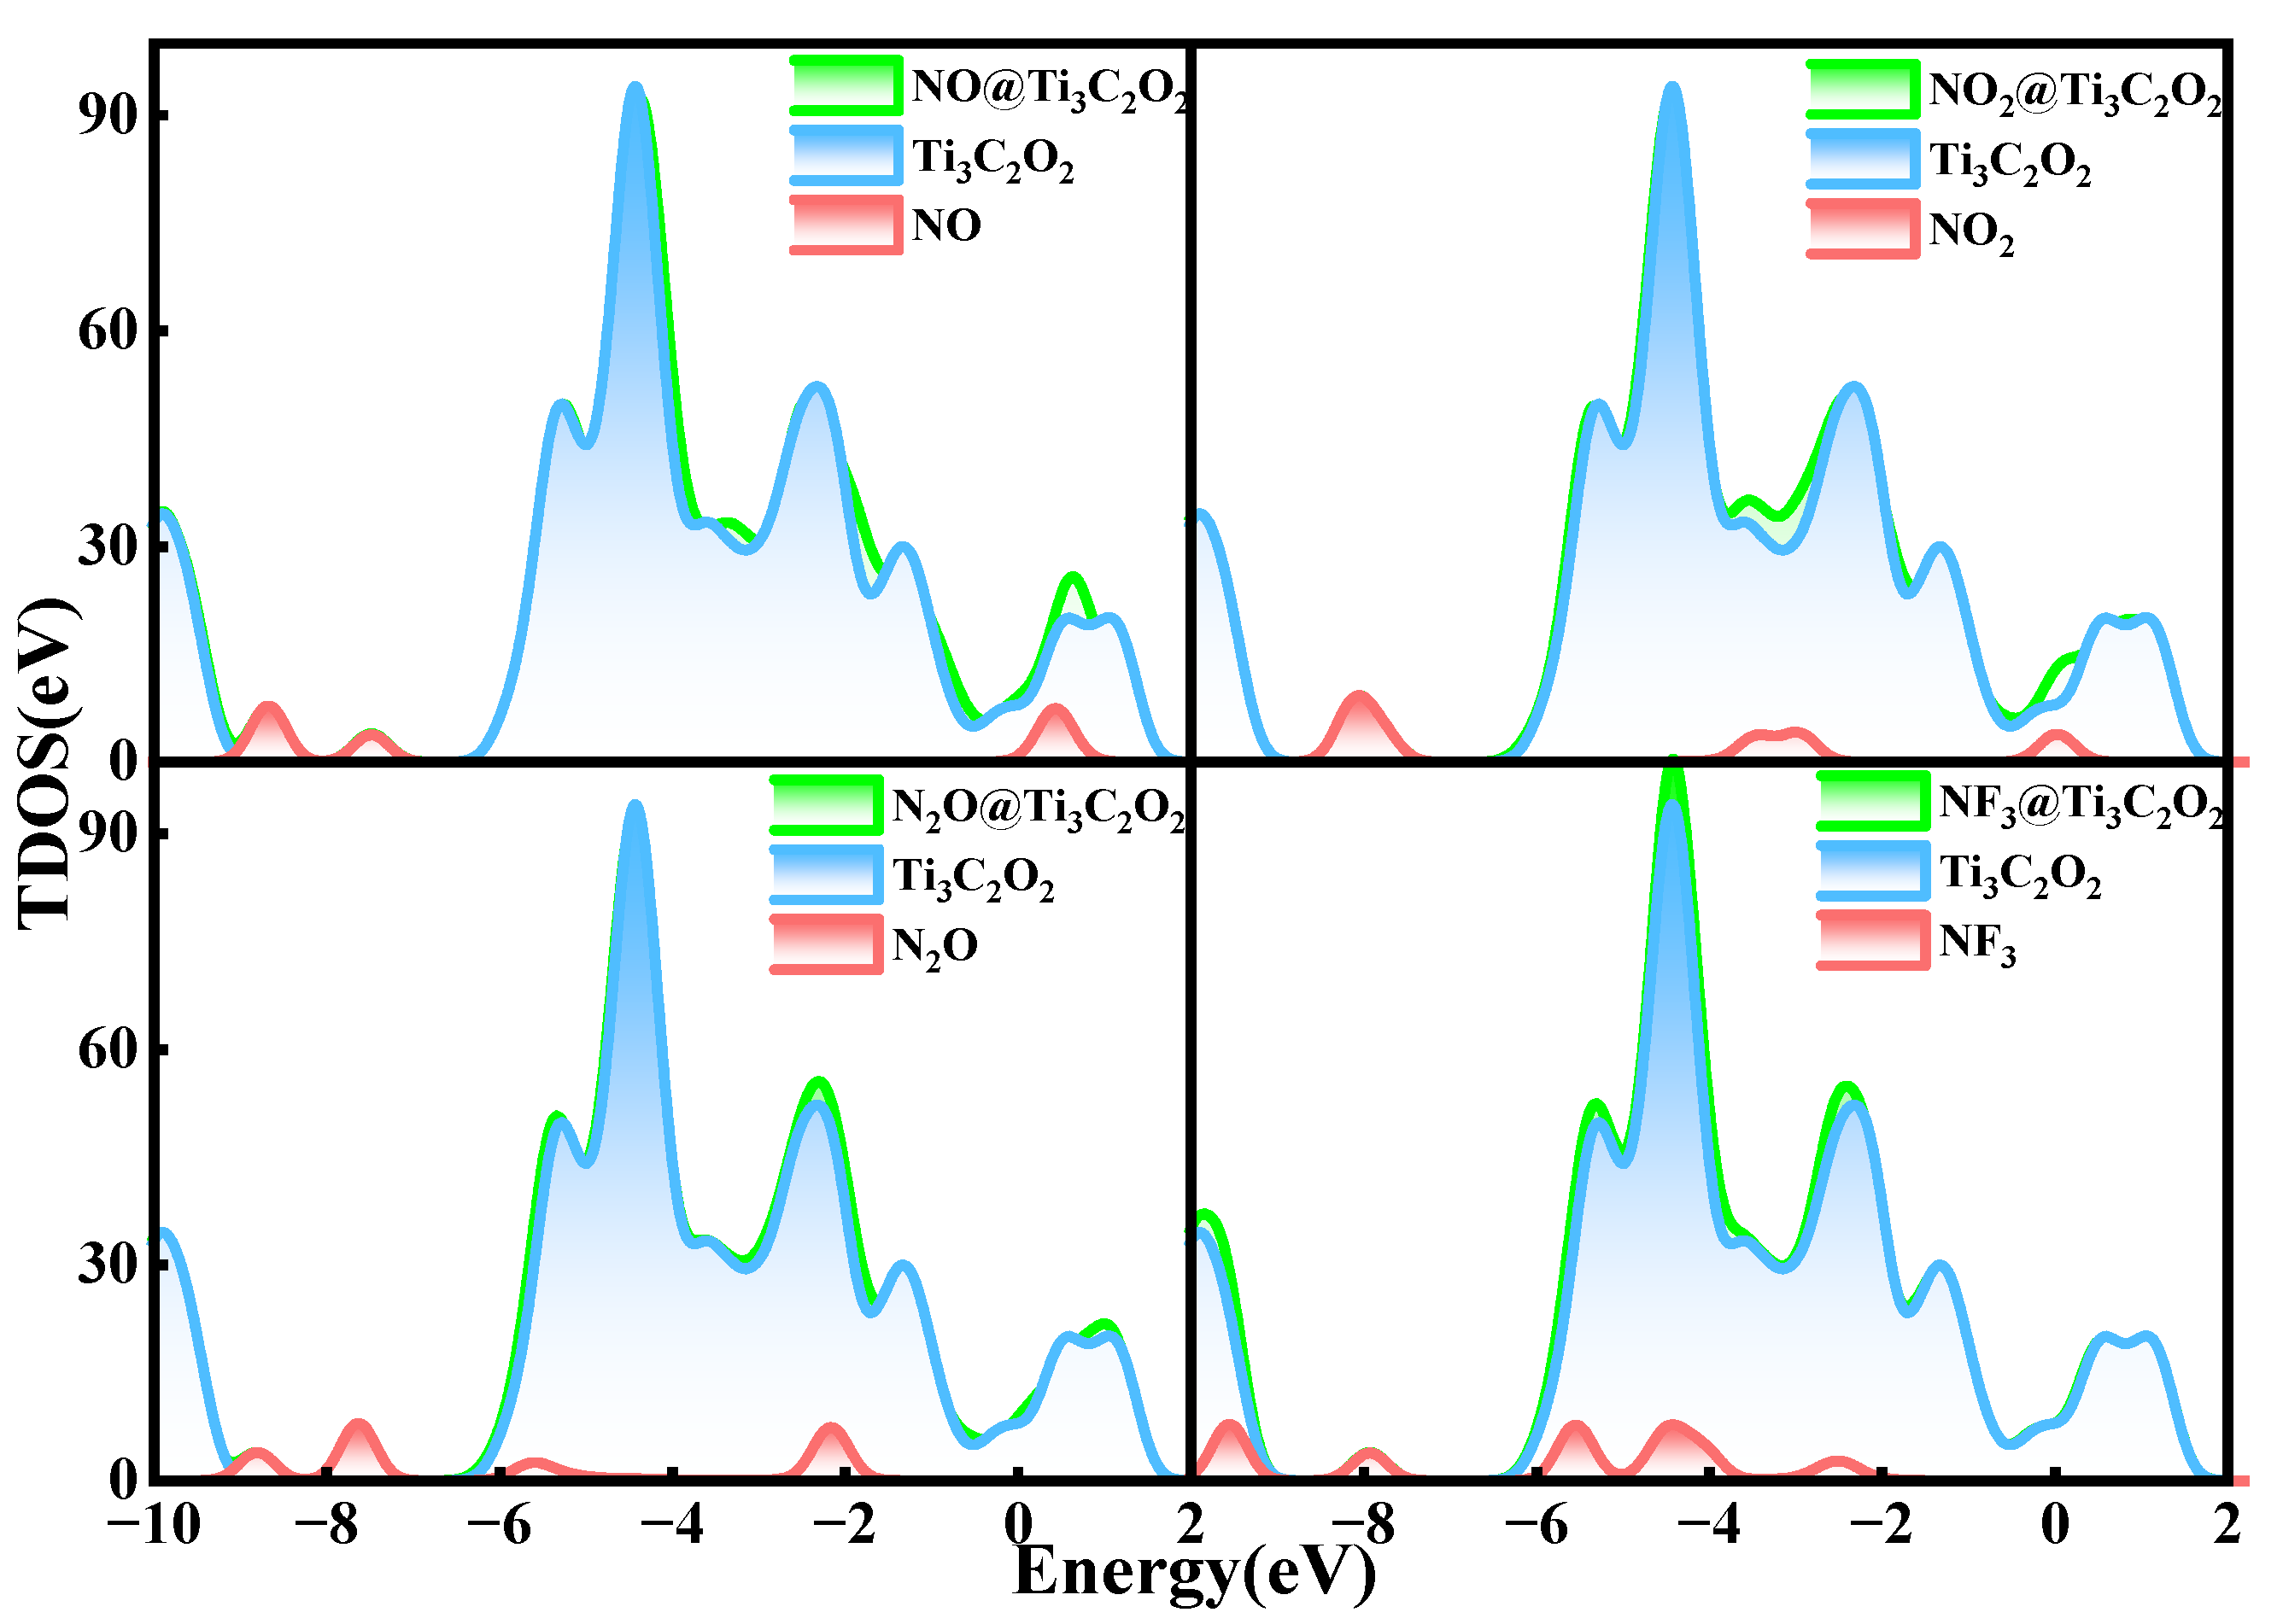
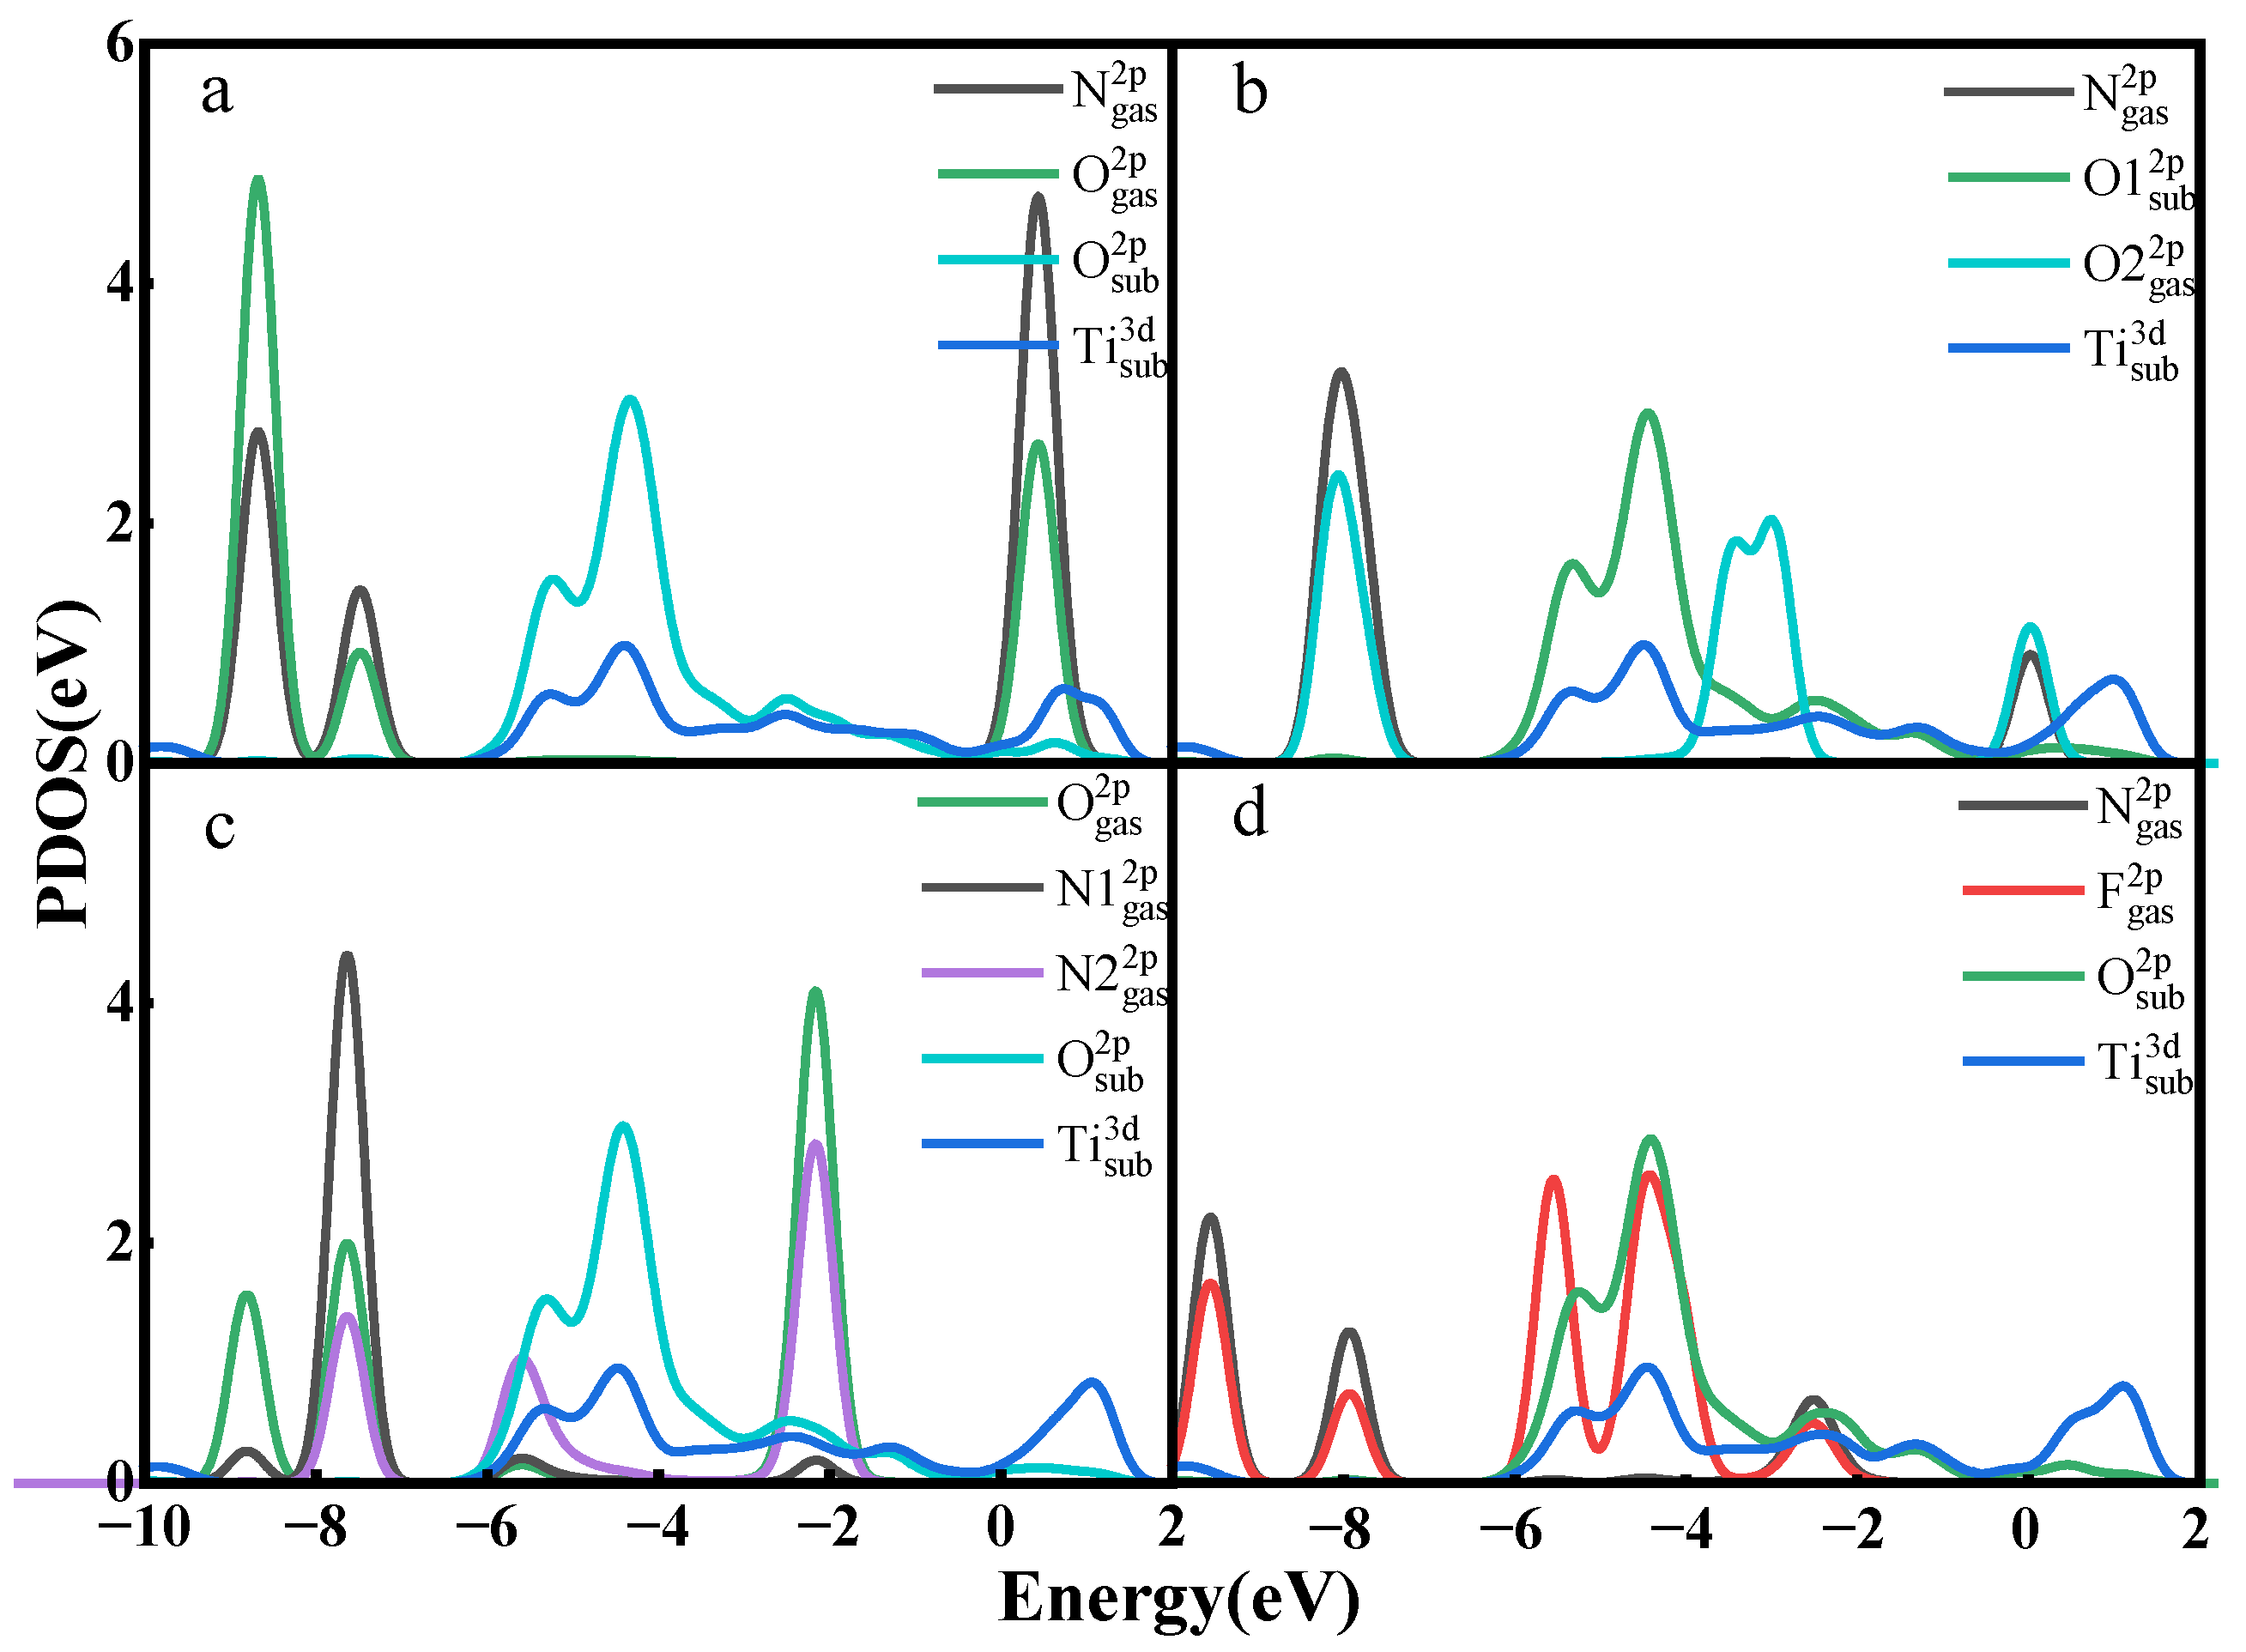
3.2. Gas Adsorption on Ti3C2O2

Figure 1i–p are top and side views of the four gas molecules after adsorption on the Ti3C2O2 surface. The pictures show that there is no significant structural change in the gas and the substrate material after adsorption occurs, and the bond length changes of the gas molecules are measured, as shown in Table 1, which further confirms that there is only a slight change in the molecular structure after adsorption. Table 1 also shows that the gas adsorption distances are all within the range of 2.7 Å–3.1 Å. From the slight structural changes and large adsorption distances, it can be assumed that the adsorption of gases on Ti3C2O2 is a physical adsorption. The adsorption energies of the four gases on the Ti3C2O2 surface are given in Table 2 (−0.507 eV, −0.115 eV, −0.240 eV, and −0.386 eV for NO, NO2, N2O, and NF3, respectively). All have negative adsorption energies, as in the case of adsorption on the Ti3C2F2 surface, indicating that the adsorption of the gases does not require energy from outside.
The deformation charge density plots of the four adsorption systems are shown in Figure 5, which shows that the aggregation of electrons between the atoms of the four gases and the material surface is difficult due to the long adsorption distance, indicating that they have difficulty in forming chemical bonds with strong interactions. The charge transfer given in Table 2 shows that 0.284e is transferred from NO to Ti3C2O2 surface, 0.077 e from NO2 to Ti3C2O2 surface, 0.008 e from Ti3C2O2 surface to N2O, and 0.036 e from NF3 to Ti3C2O2 surface. Compared with adsorption on Ti3C2F2 surface, the changes of NO and NO2 charge transfer are more obvious, with enhanced adsorption of NO and more charge transfer, and weakened adsorption of NO2 and less charge transfer.
Figure 6 shows the TDOS of the whole adsorption system of Ti3C2O2 after gas adsorption. Similar to Ti3C2F2, after the adsorption of NO and NO2, the density of states of the system experiences a significant increase near the Fermi energy level, which indicates that the adsorption of these two gases enhances the electrical conductivity of the material. Meanwhile, the adsorption of N2O and NF3 only makes the density of electronic states at some lower energy levels increase a little, and the effect on the density of states of the system is not great, which also reflects that NO and NO2 have a larger charge transfer, and N2O and NF3 have a lower charge transfer. In the PDOS of Figure 7, only a small part of the orbital overlap between the atoms of NO, NO2, and N2O and the atoms of the material surface occurs at some energy levels, indicating a weak interaction between the atoms, while the F 2p orbital of NF3 has a partial overlap with the O 2p orbital of the surface at around −4.5 eV, indicating some interaction between them. In general, the adsorption of all the four gases on the Ti3C2O2 surface is a physical adsorption.

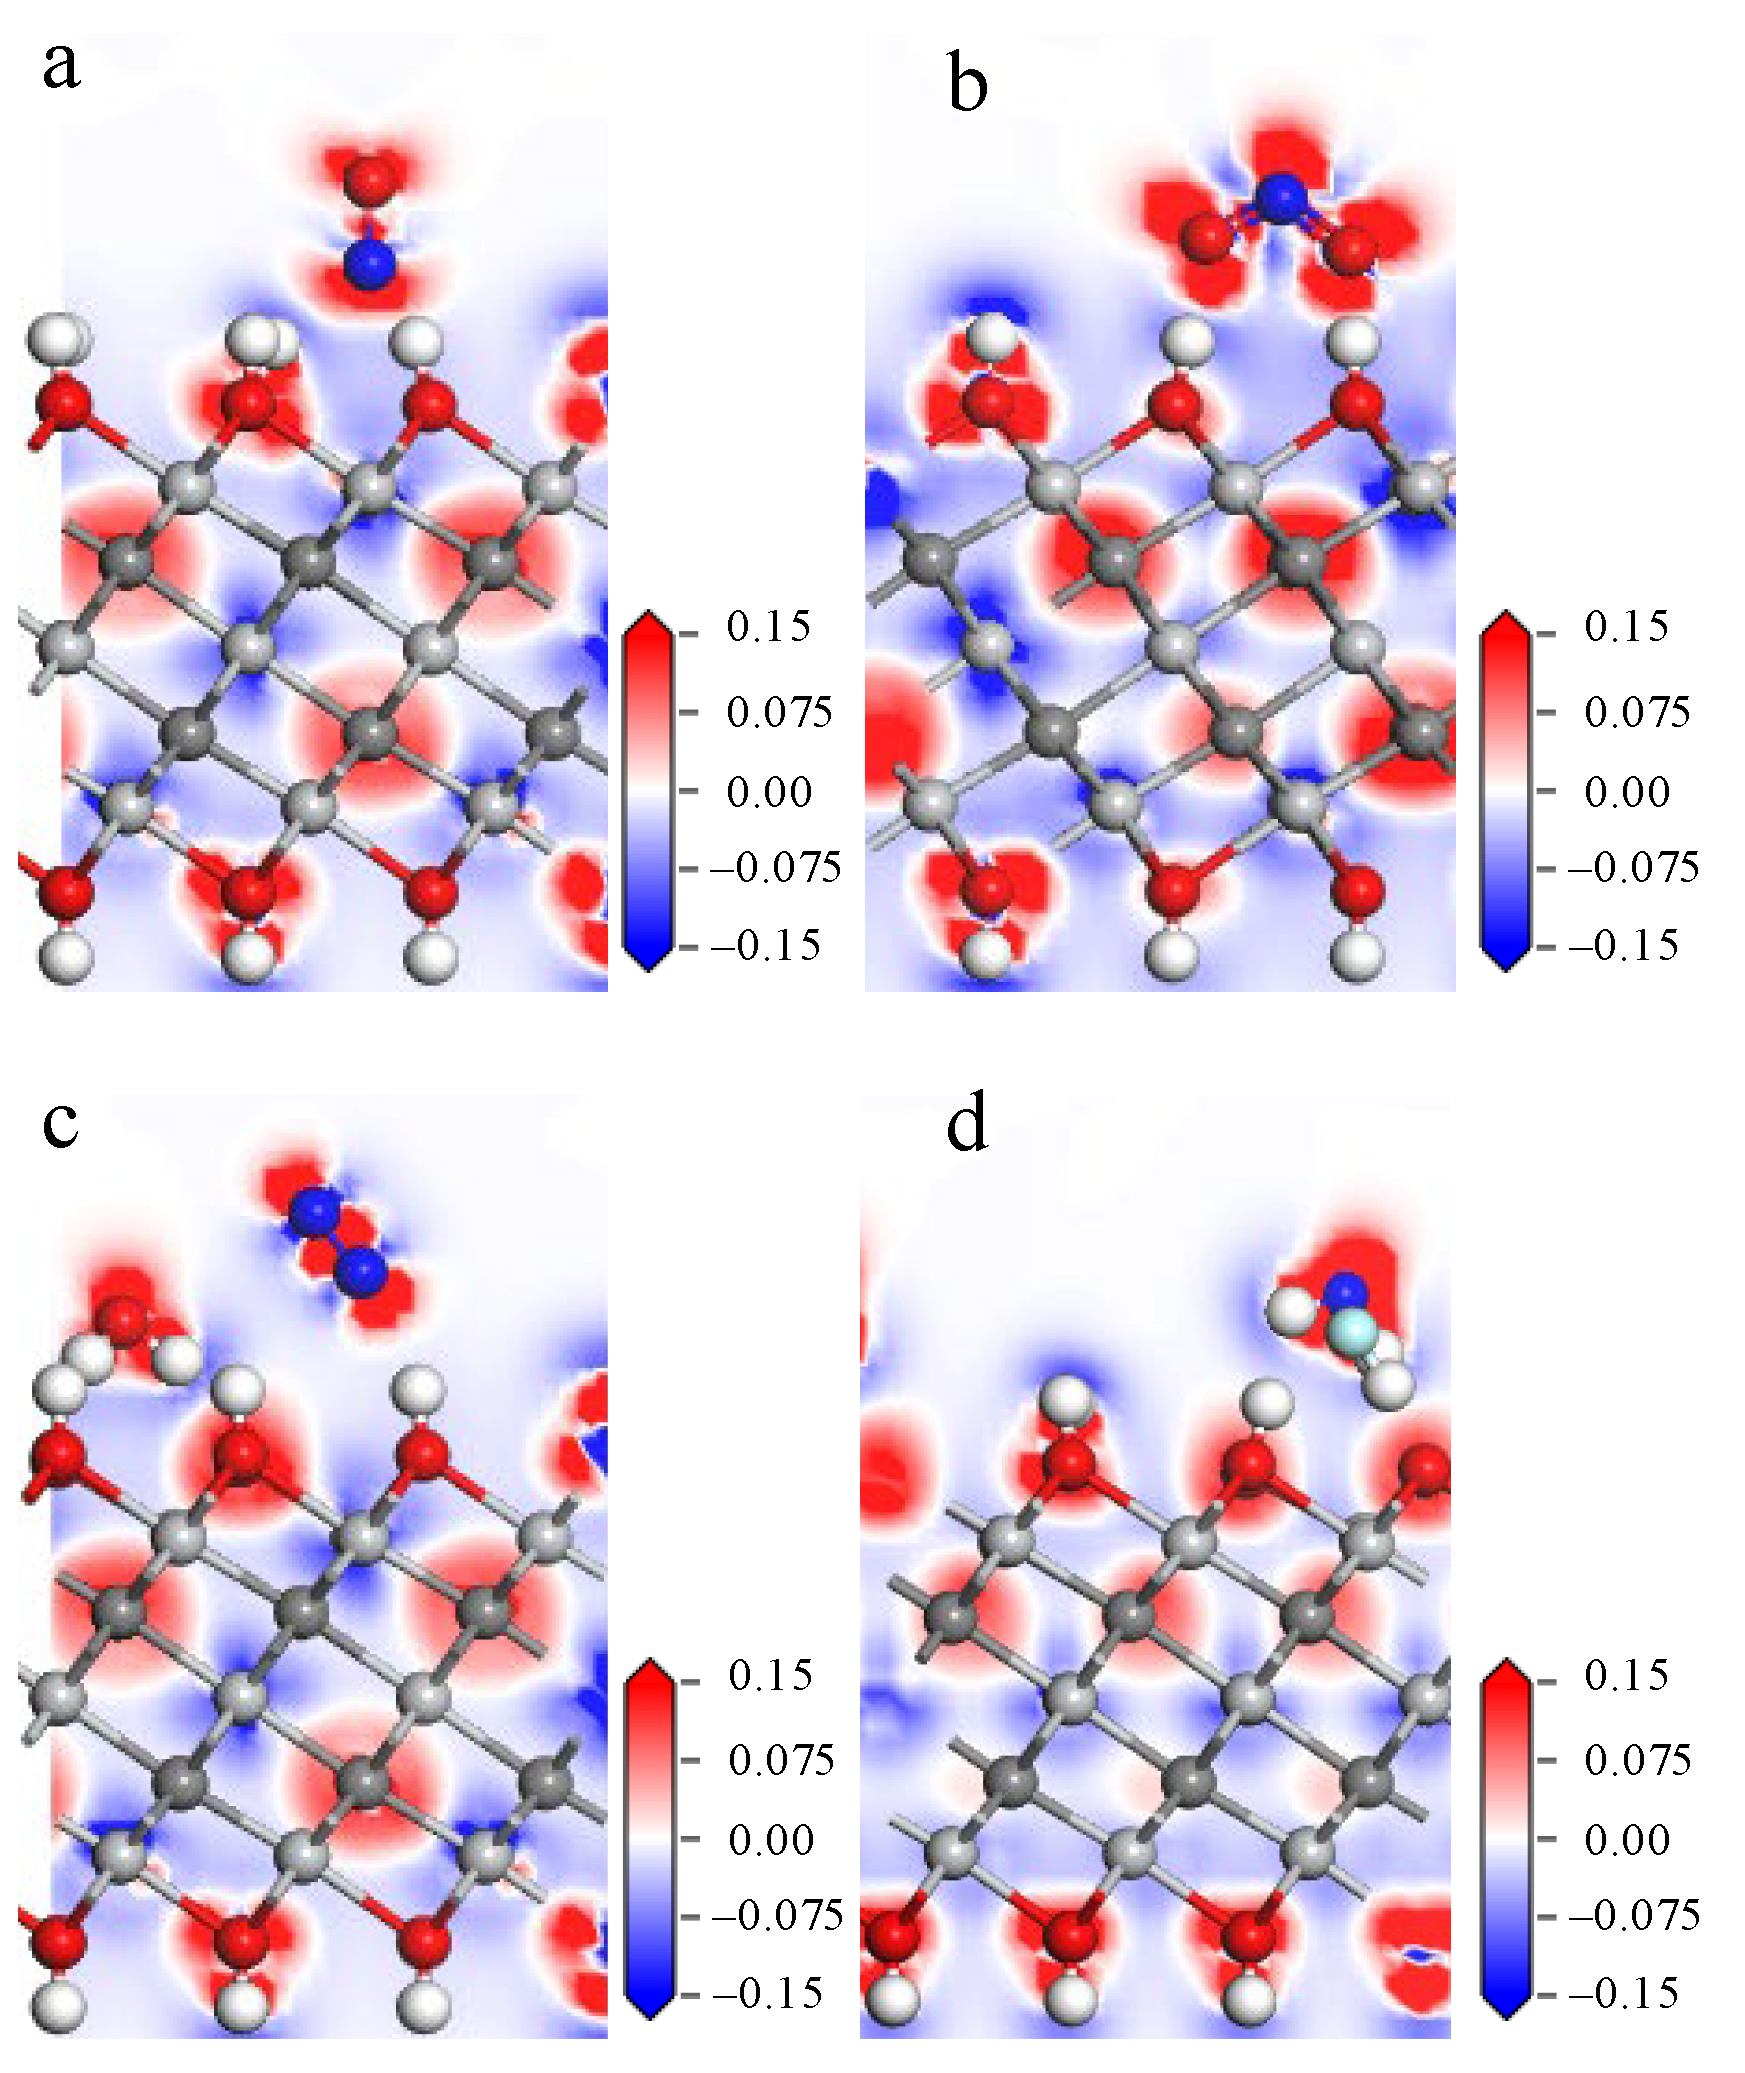
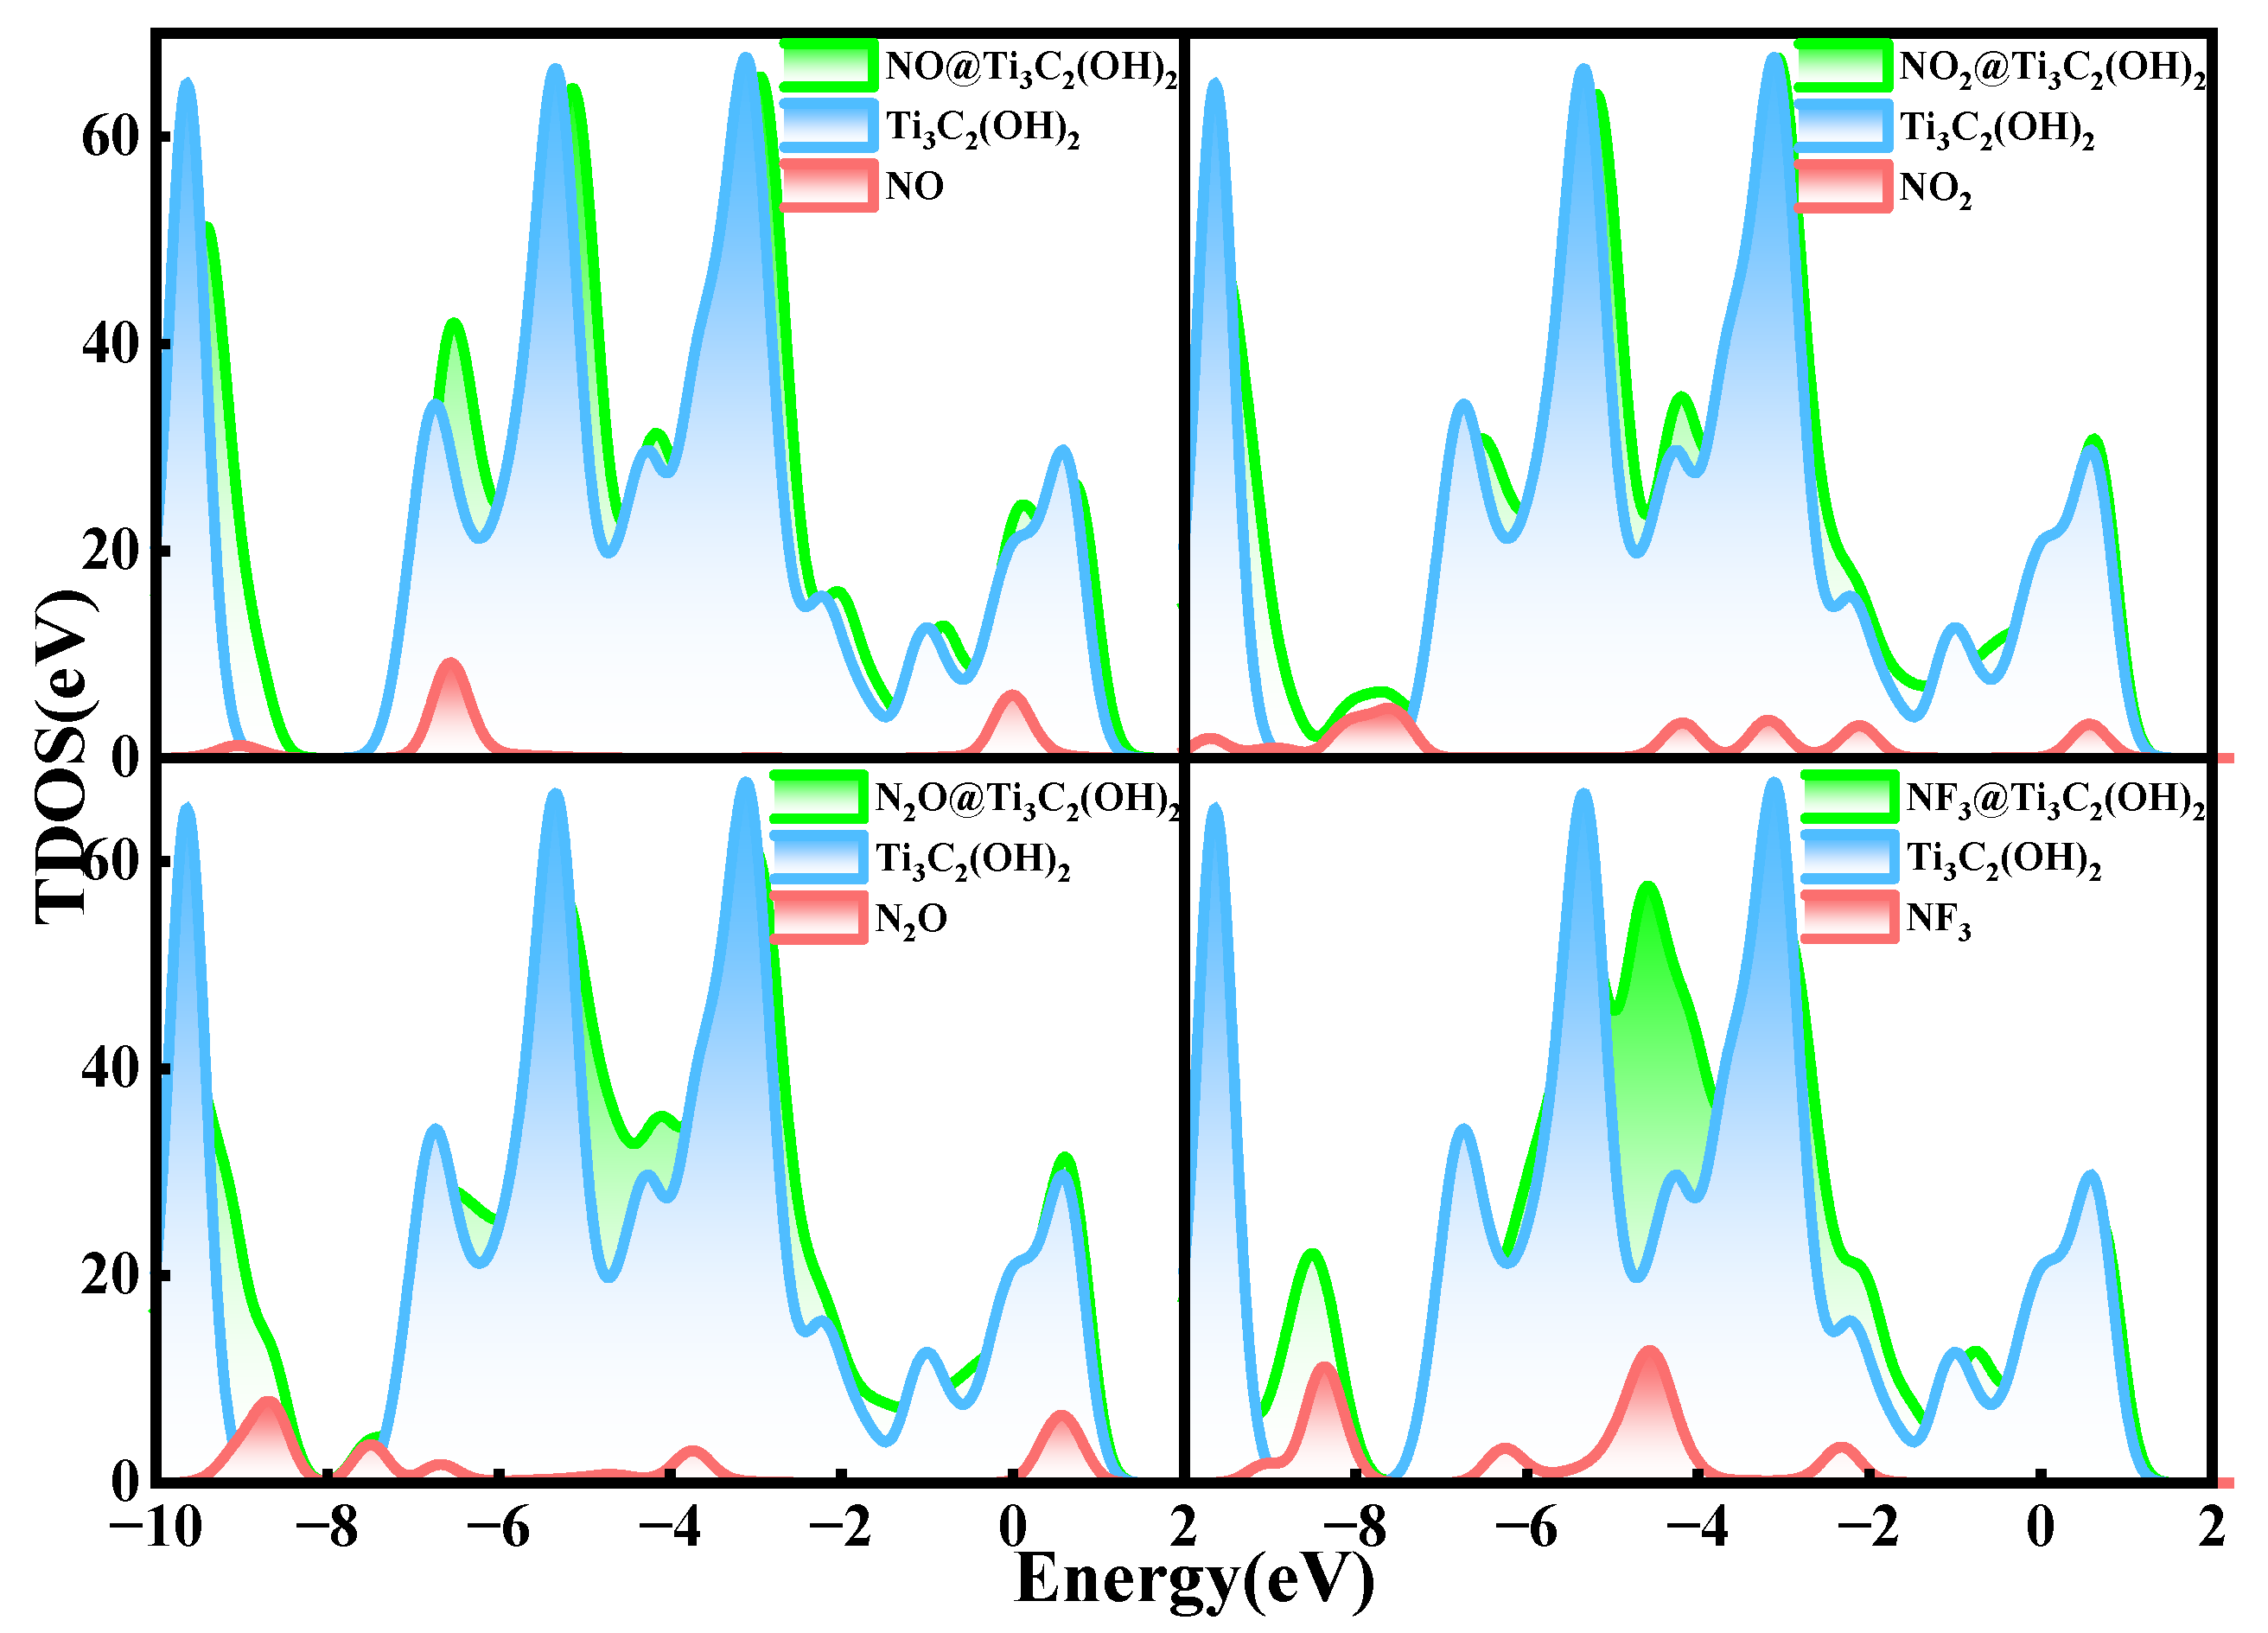
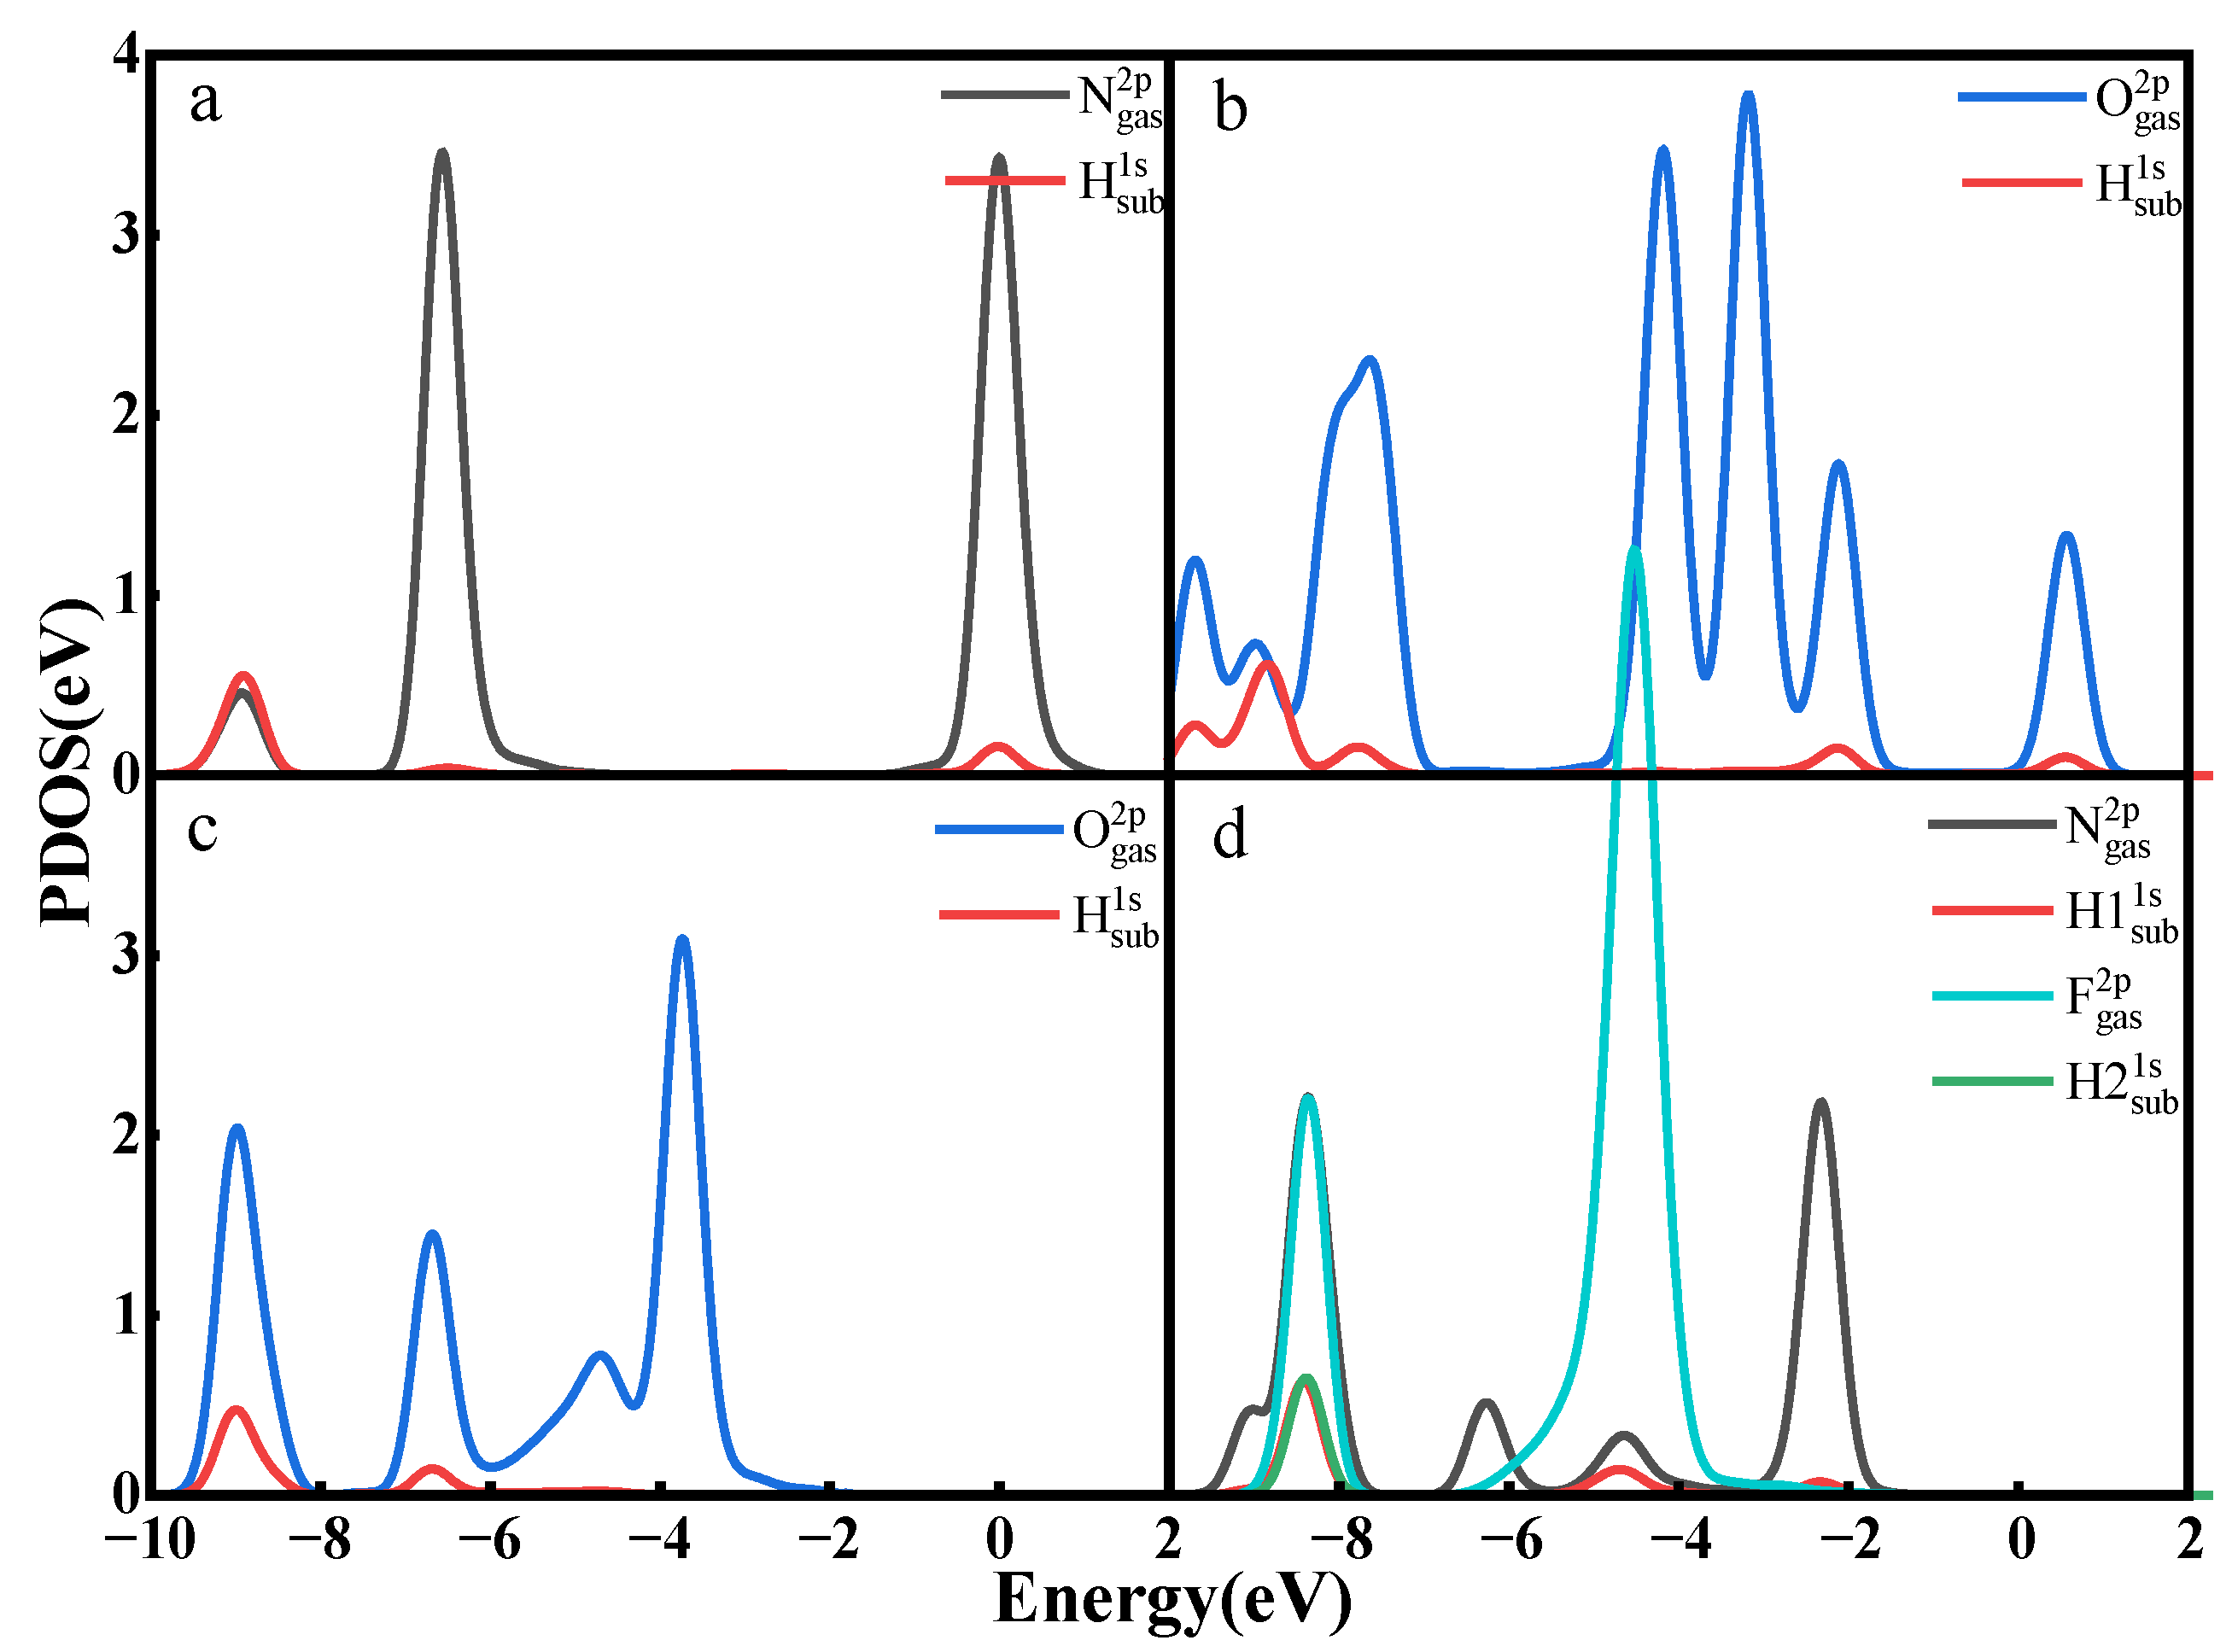
3.3. Gas Adsorption on Ti3C2(OH)2

The top and side views of the gases after adsorption on the best adsorption site on Ti3C2(OH)2 are shown in Figure 1q–x. Unlike the adsorption on Ti3C2F2 and Ti3C2O2, it can be seen that after the adsorption of NO and NO2, some H atoms around the gas molecules significantly deflect due to the attraction of the gas molecules. Other H atoms of the surface have different degrees of movement. The N atom of NO is attracted to the H on the surface in Figure 1r, and the O of NO2 is attracted to the H on the surface in Figure 1t, and the bond angle has an obvious change. So, the adsorption distances of these two gases with the Ti3C2(OH)2 surface shown in Table 1 are significantly smaller than those of Ti3C2F2 and Ti3C2O2. In addition, the bond length changes of the gases in Table 1 are also greater due to the stronger interactions between the gas and the surface. This strong adsorption is even more significant after the adsorption of N2O and NF3. Figure 1u,w show that the H atoms on the Ti3C2(OH)2 surface are stripped from the surface and form new chemical bonds with the atoms of gases. The N2O reacts with the H atoms of the surface to form H2O and N2. After NF3 adsorbs on the surface, two HF molecules form. All these figures indicate a stronger chemisorption occurring among them. The adsorption energies in Table 2 also reflect the phenomena above. It shows NF3 having the strongest interaction with the surface, with an adsorption energy of −9.065 eV, followed by N2O with an adsorption energy of −5.461 eV, and finally NO2 and NO with adsorption energies of −3.806 eV and −1.709 eV, respectively. Compared to the previous two materials with different terminal groups, the adsorption between four gases and Ti3C2(OH)2 is enhanced in different degrees.
The interaction of the gas molecules with the Ti3C2(OH)2 surface is further analyzed by deformation charge density, and the deformation charge density diagram of the adsorption system is shown in Figure 8. The N atom of NO in Figure 8a is closer to the H atom on the surface, and the red charge aggregation shown between them indicates a stronger interaction. Combined with Table 2, 0.607 e is transferred from the Ti3C2(OH)2 surface to NO. There is also more charge aggregation between the O atom of NO2 and the H atom on the surface in Figure 8b, with 0.753 e transferred from the Ti3C2(OH)2 surface to NO2. In Figure 8c,d, it can be seen that a large amount of charge aggregates between the H atoms, which are removed from the surface, and the atoms of the gas, further demonstrating the formation of chemical bonds between them, accompanied by 0.707 e and 1.428 e transferring from Ti3C2(OH)2 to N2O and NF3.
The TDOS of Ti3C2(OH)2 after gas adsorption is shown in Figure 9. Apparently, the density of states of the whole system before and after the adsorption of NO, NO2, N2O, and NF3 experiences a great change. It can be clearly seen that all the TDOS show a right shift, and the electronic states of the system move to higher energy levels after the adsorption of these gases, indicating that the adsorption of the gases has a relatively large effect on the adsorption system, and the densities of states all increase around the Fermi energy level, meaning that the conductivity of the material is enhanced. All these changes are consistent with the large charge transfer between the gases and Ti3C2(OH)2. In addition, after the adsorption of NF3, a new peak at −4.5 eV clearly appears, which changes the whole system the most, which also reflects the strongest interaction of NF3 with Ti3C2(OH)2.
Figure 10 shows the PDOS for some gas atoms and surface atoms. The N 2p orbital of NO and the H 1s orbital from the surface have the same density of state peaks at 0 eV, −9 eV in Figure 10a, which indicates a resonance of the electrons in the orbital, a manifestation of a stronger interaction. The O 2p orbital of NO2 and the H 1s orbital at 0 eV, −2 eV, −8 eV, −9 eV have an overlap in Figure 10b, which likewise indicates a stronger interaction between them, and the O 2p orbital of N2O and the H 1s orbital of the surface have the same density of state peaks at −6.5 eV, −9 eV in Figure 10c, demonstrating that O–H bonds are indeed formed between O and H. The N 2p and F 2p orbitals of NF3 and the H1 1s and H2 1s of the surface likewise show multiple overlaps in Figure 10d, representing the formation of N–H bonds and F–H bonds.
In summary, the adsorption that occurs on the Ti3C2(OH)2 surface is significantly different from that of Ti3C2F2 and Ti3C2O2, which has greater adsorption energy, more charge transfer, and stronger interactions. The reason is that the hydroxyl groups on the surface are more chemically active than oxygen and fluorine atoms, and the gas molecules interact more strongly with the OH surface. When NO and NO2 make contact with the Ti3C2(OH)2 surface, N and O are attracted by OH and form O–H···N and O–H···O hydrogen bonds, respectively. When N2O and NF3 make contact with the Ti3C2(OH)2 surface, O atoms, N atoms, and F atoms are attracted by OH, forming O–H···O, O–H···N, and O–H···F hydrogen bonds and approaching to the surface, which eventually leads to H atom stripping from surface and forming new chemical bonds.

3.4. Ti3C2Tx Gas Sensing Performance Evaluation

An important parameter reflecting the sensing performance is the recovery time τ, which represents the time required to remove the adsorbed gas molecules from the material surface, defined as [30]
τ = v 0 1 e ( E a d s k T )  
v 0 indicates the attempt frequency, assuming that all gases have the same order of magnitude as that of NO2 (1.0 × 10¹² s−1) [31]; Eads is the energy barrier for desorption, which is set equal to the adsorption energy; k is the Boltzmann constant (8.62 × 10⁻⁵ eV·K−1); and T is the Kelvin temperature. It can be seen from the equation that the larger the adsorption energy is for a gas molecule, the more difficult its desorption will become accordingly. The recovery time of each gas on Ti3C2Tx at room temperature is given in Table 3. The adsorption energies on Ti3C2F2 and Ti3C2O2 are generally small, so they reflect a fast recovery time, and the slowest is 0.37 ms for NO adsorption on Ti3C2O2, and the very short recovery time may not achieve effective detection in the actual sensing detection. In contrast, the adsorptions of four gases on Ti3C2(OH)2 have a large adsorption energy and exhibit a long recovery time. It is difficult for gas molecules to desorb from the material surface at room temperature, which is not conducive to the reuse of the sensor but has potential value as a gas adsorbent. The desired sensor performance can be achieved by surface modification. There are many ways of surface modification, such as controlling the ratio of surface F, O and OH groups, doping with other metals and their compounds, adding atomic vacancies, adding other terminal groups, etc. [32,33,34,35,36].

4. Conclusions

In this paper, the adsorption process of gases on the surface of these materials was studied by constructing the adsorption models of NO, NO2, N2O, and NF3 on Ti3C2Tx with three terminal groups of F, O, and OH, and the adsorption behavior of gases was analyzed according to adsorption energy, charge density, and density of states through DFT calculations:
(1)
The adsorption energies of NO on Ti3C2F2, Ti3C2O2, and Ti3C2(OH)2 are −0.216eV, −0.507 eV, and −1.709 eV, respectively, and the charge transfers are 0.111 e, 0.284 e, and −0.607 e, respectively. After NO adsorption, the density of states of the adsorbed systems all increase near the Fermi energy level, and conductivity is enhanced.
(2)
The adsorption energies of NO2 on Ti3C2F2, Ti3C2O2, and Ti3C2(OH)2 are −0.213 eV, −0.115 eV, and −3.806 eV, respectively, and the charge transfer is −0.129 e, 0.077 e, and −0.753 e, respectively, and the adsorption of NO2 leads to the enhancement of electrical conductivity of the materials.
(3)
The adsorption energies of N2O on Ti3C2F2, Ti3C2O2, and Ti3C2(OH)2 are −0.273 eV, −0.240 eV, and −5.461 eV, respectively, with charge transfer of 0.008 e, −0.008 e, and -0.707e. After the adsorption of N2O, only Ti3C2(OH)2 exhibits an increase in electrical conductivity, and it is the chemisorption that occurs with strong interactions.
(4)
The adsorption energies of NF3 on Ti3C2F2, Ti3C2O2, and Ti3C2(OH)2 are −0.323 eV, −0.386 eV, and −9.065 eV, respectively, and the charge transfers are 0.014 e, 0.036 e, and −1.428 e, respectively. NF3 exhibits strong chemisorption only on Ti3C2Tx terminated with -OH, accompanied by a large amount of charge transfer.
(5)
The adsorption of all four gases on the surface of Ti3C2F2 and Ti3C2O2 exhibits short recovery times, while the adsorption on the surface of Ti3C2(OH)2 makes it difficult to achieve desorption at room temperature due to the stronger adsorption effect.
Combining all the analyses, Ti3C2Tx with three terminal groups has good sensing ability for NO and NO2, while Ti3C2Tx with -OH surface has great adsorption energy and significant charge transfer for NO, NO2, N2O, NF3, which makes it easy to achieve gas detection, but it is also found to have the disadvantage of long recovery time, so the performance of the material needs to be improved by further methods.

Supplementary Materials

The following are available online at https://www.mdpi.com/article/10.3390/nano12132311/s1. Figure S1. Molecule structures of NO, NO2, N2O and NF3.

Author Contributions

F.Z.: Conceptualization, Project administration, Computational resources, Funding acquisition. H.Q.: Formal analysis, Data Curation, Writing—original draft, Visualization. X.F.: Methodology, Investigation, Writing—review and editing. X.C.: Validation, Writing—review and editing. L.D.: Writing—review and editing. Q.Y.: Formal analysis, Visualization. J.T.: Computational resources, Funding acquisition. F.Z. and H.Q. contributed equally to this work. All authors have read and agreed to the published version of the manuscript.

Funding

This work was funded by the National Natural Science Foundation of China [Grant No. 51877157] and Hubei Science Fund for Distinguished Young Scholars [Grant No. 2020CFA097].

Conflicts of Interest

The authors declare that they have no known competing financial interests or personal relationships that could have appeared to influence the work reported in this paper.

References

  1. Maiss, M.; Brenninkmeijer, C.A.M. Atmospheric SF6: Trends, Sources, and Prospects. Environ. Sci. Technol. 1998, 32, 3077–3086. [Google Scholar] [CrossRef]
  2. Li, X.W.; Zhao, H.; Murphy, A.B. SF6-Alternative Gases for Application in Gas-insulated Switchgear. J. Phys. D Appl. Phys. 2018, 51, 19. [Google Scholar] [CrossRef]
  3. Ko, M.K.W.; Sze, N.D.; Wang, W.C.; Shia, G.; Goldman, A.; Murcray, F.J.; Murcray, D.G.; Rinsland, C.P. Atmospheric Sulfur-hexafluoride Sources, Sinks and Greenhouse Warming. J. Geophys. Res. Atmos. 1993, 98, 10499–10507. [Google Scholar] [CrossRef]
  4. Zhou, A.; Gao, L.; Ji, X.; Zhang, M. Research and Application of SF6/N2 Mixed Gas Used in GIS Bus. Power Syst. Technol. 2018, 42, 3429–3435. [Google Scholar]
  5. Zhang, B.; Xiong, J.; Chen, L.; Li, X.; Murphy, A.B. Fundamental physicochemical properties of SF6-alternative gases: A review of recent progress. J. Phys. D Appl. Phys. 2020, 53, 173001. [Google Scholar] [CrossRef]
  6. Qiu, Y.; Kuffel, E. Comparison of SF6/N2 and SF6/CO2 gas mixtures as alternatives to SF6 gas. IEEE Trans. Dielectr. Electr. Insul. 1999, 6, 892–895. [Google Scholar] [CrossRef]
  7. Zeng, F.P.; Li, H.T.; Cheng, H.T.; Tang, J.; Liu, Y.L. SF6 Decomposition and Insulation Condition Monitoring of GIE: A Review. High Volt. 2021, 6, 955–966. [Google Scholar] [CrossRef]
  8. Yang, J.; Ma, F.; Yu, K.; Su, Z.; Xiu, S. Experimental Study on Gas Decomposition Characteristics of SF6/N2 Mixed Gas under Breaking Current. High Volt. Eng. 2019, 45, 1616–1623. [Google Scholar]
  9. Li, C.; Tang, J.; Zhao, Z.; Li, H.; Miao, Y.; Zeng, F. Decomposition Characteristics of SF6/N2 under Partial Discharge of Different Degrees. IEEE Access 2020, 8, 192312–192319. [Google Scholar] [CrossRef]
  10. Casanovas, A.M.; Casanovas, J. Decomposition of High-pressure (400 kPa) SF6/CO2, SF6/CO, SF6/N2/CO2 and SF6/N2/CO Mixtures under Negative DC Coronas. J. Phys. D Appl. Phys. 2005, 38, 1556. [Google Scholar] [CrossRef]
  11. Zeng, F.P.; Lei, Z.C.; Yang, X.; Tang, J.; Yao, Q.; Miao, Y.L. Evaluating DC Partial Discharge with SF6 Decomposition Characteristics. IEEE Trans. Power Deliv. 2019, 34, 1383–1392. [Google Scholar] [CrossRef]
  12. Zeng, F.P.; Wu, S.Y.; Lei, Z.C.; Li, C.; Tang, J.; Yao, Q.; Miao, Y.L. SF6 Fault Decomposition Feature Component Extraction and Triangle Fault Diagnosis Method. IEEE Trans. Dielectr. Electr. Insul. 2020, 27, 581–589. [Google Scholar] [CrossRef]
  13. Shengxue, Y.; Chengbao, J.; Huai, W.S. Gas Sensing in 2D Materials. Appl. Phys. Rev. 2017, 4, 021304. [Google Scholar]
  14. Venkateshalu, S.; Grace, A.N. MXenes—A New Class of 2D Layered Materials: Synthesis, Properties, Applications as Supercapacitor Electrode and Beyond. Appl. Mater. Today 2020, 18, 100509. [Google Scholar] [CrossRef]
  15. Anasori, B.; Lukatskaya, M.R.; Gogotsi, Y. 2D Metal Carbides and Nitrides (MXenes) for Energy Storage. Nat. Mater. 2017, 16, 34–50. [Google Scholar] [CrossRef]
  16. Pang, J.B.; Mendes, R.G.; Bachmatiuk, A.; Zhao, L.; Ta, H.Q.; Gemming, T.; Liu, H.; Liu, Z.F.; Rummeli, M.H. Applications of 2D MXenes in Energy Conversion and Storage Systems. Chem. Soc. Rev. 2019, 48, 72–133. [Google Scholar] [CrossRef]
  17. Mohammadi, A.V.; Rosen, J.; Gogotsi, Y. The World of Two-dimensional Carbides and Nitrides (MXenes). Science 2021, 372, eabf1581. [Google Scholar]
  18. Lee, E.; VahidMohammadi, A.; Prorok, B.C.; Yoon, Y.S.; Beidaghi, M.; Kim, D.J. Room Temperature Gas Sensing of Two-Dimensional Titanium Carbide (MXene). ACS Appl. Mater. Interfaces 2017, 9, 37184–37190. [Google Scholar] [CrossRef]
  19. Chen, W.Y.; Jiang, X.; Lai, S.N.; Peroulis, D.; Stanciu, L. Nanohybrids of A MXene and Transition Metal Dichalcogenide for Selective Detection of Volatile Organic Compounds. Nat. Commun. 2020, 11, 1302. [Google Scholar] [CrossRef] [Green Version]
  20. Wu, M.; He, M.; Hu, Q.; Wu, Q.; Sun, G.; Xie, L.; Zhang, Z.; Zhu, Z.; Zhou, A. Ti3C2 MXene-Based Sensors with High Selectivity for NH3 Detection at Room Temperature. ACS Sens. 2019, 4, 2763–2770. [Google Scholar] [CrossRef]
  21. Kong, L.; Liang, X.; Deng, X.; Guo, C.; Wu, C.-M.L. Adsorption of SF6 Decomposed Species on Ti3C2O2 and Ti3C2F2 with Point Defects by DFT Study. Adv. Theory Simul. 2021, 4, 2100074. [Google Scholar] [CrossRef]
  22. Zeng, F.; Feng, X.; Chen, X.; Yao, Q.; Miao, Y.; Dai, L.; Li, Y.; Tang, J. First-principles Analysis of Ti3C2Tx MXene as A Promising Candidate for SF6 Decomposition Characteristic Components Sensor. Appl. Surf. Sci. 2022, 578, 152020. [Google Scholar] [CrossRef]
  23. Delley, B. From Molecules to Solids with the DMol3 Approach. J. Chem. Phys. 2000, 113, 7756–7764. [Google Scholar] [CrossRef]
  24. Perdew, J.P.; Burke, K.; Ernzerhof, M. Generalized Gradient Approximation Made Simple. Phys. Rev. Lett. 1996, 77, 3865–3868. [Google Scholar] [CrossRef] [PubMed] [Green Version]
  25. Mardirossian, N.; Head-Gordon, M. ωB97X-V: A 10-parameter, Range-separated Hybrid, Generalized Gradient Approximation Density Functional with Nonlocal Correlation, Designed by a Survival-of-the-fittest Strategy. Phys. Chem. Chem. Phys. 2014, 16, 9904–9924. [Google Scholar] [CrossRef] [Green Version]
  26. Delley, B. Hardness Conserving Semilocal Pseudopotentials. Phys. Rev. B 2002, 66, 155125. [Google Scholar] [CrossRef]
  27. Grimme, S.; Antony, J.; Ehrlich, S.; Krieg, H. A Consistent and Accurate ab Initio Parametrization of Density Functional Dispersion Correction (DFT-D) for the 94 Elements H-Pu. J. Chem. Phys. 2010, 132, 19. [Google Scholar] [CrossRef] [Green Version]
  28. Grimme, S. Semiempirical GGA-type Density Functional Constructed with a Long-range Dispersion Correction. J. Comput. Chem. 2006, 27, 1787–1799. [Google Scholar] [CrossRef]
  29. Yong, Y.; Cui, H.; Zhou, Q.; Su, X.; Kuang, Y.; Li, X. C2N monolayer as NH3 and NO sensors: A DFT study. Appl. Surf. Sci. 2019, 487, 488–495. [Google Scholar] [CrossRef]
  30. Kong, J.; Franklin, N.R.; Zhou, C.W.; Chapline, M.G.; Peng, S.; Cho, K.J.; Dai, H.J. Nanotube Molecular Wires as Chemical Sensors. Science 2000, 287, 622–625. [Google Scholar] [CrossRef]
  31. Hong, S.N.; Kye, Y.H.; Yu, C.J.; Jong, U.G.; Ri, G.C.; Choe, C.S.; Kim, K.H.; Han, J.M. Ab initio thermodynamic study of the SnO2(110) surface in an O2 and NO environment: A fundamental understanding of the gas sensing mechanism for NO and NO2. Phys. Chem. Chem. Phys. 2016, 18, 31566–31578. [Google Scholar] [CrossRef] [PubMed] [Green Version]
  32. Khakbaz, P.; Moshayedi, M.; Hajian, S.; Soleimani, M.; Narakathu, B.B.; Bazuin, B.J.; Pourfath, M.; Atashbar, M.Z. Titanium Carbide MXene as NH3 Sensor: Realistic First-Principles Study. J. Phys. Chem. C 2019, 123, 29794–29803. [Google Scholar] [CrossRef]
  33. Tai, H.; Duan, Z.; He, Z.; Li, X.; Xu, J.; Liu, B.; Jiang, Y. Enhanced Ammonia Response of Ti3C2Tx Nanosheets Supported by TiO2 Nanoparticles at Room Temperature. Sens. Actuators B Chem. 2019, 298, 126874. [Google Scholar] [CrossRef]
  34. Yang, Z.; Liu, A.; Wang, C.; Liu, F.; He, J.; Li, S.; Wang, J.; You, R.; Yan, X.; Sun, P.; et al. Improvement of Gas and Humidity Sensing Properties of Organ-like MXene by Alkaline Treatment. ACS Sens. 2019, 4, 1261–1269. [Google Scholar] [CrossRef]
  35. Kamysbayev, V.; Filatov, A.S.; Hu, H.; Rui, X.; Lagunas, F.; Wang, D.; Klie, R.F.; Talapin, D.V. Covalent Surface Modifications and Superconductivity of Two-dimensional Metal Carbide MXenes. Science 2020, 369, 979–983. [Google Scholar] [CrossRef]
  36. Xu, Q.; Zong, B.; Li, Q.; Fang, X.; Mao, S.; Ostrikov, K.K. H2S Sensing under Various Humidity Conditions with Ag Nanoparticle Functionalized Ti3C2Tx MXene Field-effect Transistors. J. Hazard. Mater. 2022, 424, 127492. [Google Scholar] [CrossRef]
Figure 1. The most stable adsorption structures of NO, NO2, N2O, and NF3 on (ah) Ti3C2F2, (ip) Ti3C2O2, and (qx) Ti3C2(OH)2. (Light gray–Ti, dark grey–C, cyan–F, red–O, blue–N, white–H).
Nanomaterials 12 02311 g001
Figure 2. Deformation charge density diagrams of (a) NO, (b) NO2, (c) N2O, (d) NF3 on Ti3C2F2 surface.
Nanomaterials 12 02311 g002
Figure 3. Total electron density of states of Ti3C2F2 adsorbing NO, NO2, N2O, and NF3.
Nanomaterials 12 02311 g003
Figure 4. Partial electron density of states of Ti3C2F2 adsorbing (a) NO, (b) NO2, (c) N2O, (d) NF3.
Nanomaterials 12 02311 g004
Figure 5. Deformation charge density diagram of (a) NO, (b) NO2, (c) N2O, (d) NF3 on Ti3C2O2 surface.
Nanomaterials 12 02311 g005
Figure 6. Total electron density of states of Ti3C2O2 adsorbing NO, NO2, N2O, and NF3.
Nanomaterials 12 02311 g006
Figure 7. Partial electron density of states of Ti3C2O2 adsorbing (a) NO, (b) NO2, (c) N2O, (d) NF3.
Nanomaterials 12 02311 g007
Figure 8. Deformation charge density diagram of (a) NO, (b) NO2, (c) N2O, (d) NF3 on Ti3C2(OH)2 surface.
Nanomaterials 12 02311 g008
Figure 9. Total electron density of states of Ti3C2(OH)2 adsorbing NO, NO2, N2O, and NF3.
Nanomaterials 12 02311 g009
Figure 10. Partial electron density of states of Ti3C2(OH)2 adsorbing (a) NO, (b) NO2, (c) N2O, (d) NF3.
Nanomaterials 12 02311 g010
Table 1. Adsorption distance and bond length change of gas molecules on Ti3C2Tx.
Ti3C2TxGasD(Å) aL(Å) b
FNO2.978−0.012
NO22.8070.011
N2O2.979−0.002
NF32.8490
ONO2.769−0.028
NO22.8060.005
N2O3.021−0.001
NF32.842−0.002
OHNO1.8090.08
NO21.6660.073
N2O-- c--
NF3----
a The adsorption distance D refers to the shortest distance between the atom of gas and atom of substrate. b The bond length change L, L = L2−L1, L1 and L2 represents the chemical bond of gas before and after adsorption. A negative value indicates that the molecular bond length becomes shorter. c The -- symbol indicates that the chemical bond of the gas is broken and is not included in the measurement.
Table 2. Adsorption energy and charge transfer of gas molecules on Ti3C2Tx.
Ti3C2TxGasEads(eV)Qta
FNO−0.2160.111
NO2−0.213−0.129
N2O−0.2730.008
NF3−0.3230.014
ONO−0.5070.284
NO2−0.1150.077
N2O−0.240−0.008
NF3−0.3860.036
OHNO−1.709−0.607
NO2−3.806−0.753
N2O−5.461−0.707
NF3−9.065−1.428
a A positive Qt means that the gas molecule loses electrons, and a negative Qt means that it gains electrons.
Table 3. Recovery time at room temperature (25 °C).
Ti3C2Txτ(NO)/sτ(NO2)/sτ(N2O)/sτ(NF3)/s
F 4.4 × 10⁻⁹ 3.9 × 10⁻⁹ 4.1 × 10⁻⁸ 2.8 × 10⁻⁷
O 3.7 × 10⁻⁴ 8.8 × 10⁻¹¹ 1.1 × 10⁻⁸ 3.3 × 10⁻⁶
OH 7.8 × 10¹⁶ 2.2 × 1052 2.1 × 1080 1.8 × 10141
Publisher’s Note: MDPI stays neutral with regard to jurisdictional claims in published maps and institutional affiliations.

