
Influence of Ink Properties on the Morphology of Long-Wave Infrared HgSe Quantum Dot Films


Abstract
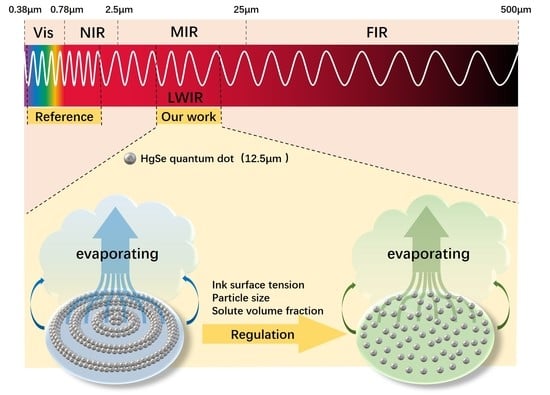
1. Introduction
2. Materials and Methods
3. Results
3.1. Influence of Ink Surface Tension on FILM Morphology
3.2. Effect of Particle Size on Film Morphology
3.3. Effect of Solute Volume Fraction on Film Morphology
3.4. Infrared Transmittance Analysis of Thin Films
4. Conclusions
Author Contributions
Funding
Data Availability Statement
Acknowledgments
Conflicts of Interest
References
- Han, J.; Ko, D.; Park, M.; Roh, J.; Jung, H.; Lee, Y.; Kwon, Y.; Sohn, J.; Bae, W.K.; Chin, B.D.; et al. Toward high-resolution, inkjet-printed, quantum dot light-emitting diodes for next-generation displays. J. Soc. Inf. Disp. 2016, 24, 545–551. [Google Scholar] [CrossRef]
- Haverinen, H.M.; Myllyla, R.A.; Jabbour, G.E. Inkjet printed RGB quantum dot-hybrid LED. J. Disp. Technol. 2010, 6, 87–89. [Google Scholar] [CrossRef]
- Hu, Z.; Yin, Y.; Ali, M.U.; Peng, W.; Zhang, S.; Li, D.; Zou, T.; Li, Y.; Jiao, S.; Chen, S.-J.; et al. Inkjet printed uniform quantum dots as color conversion layers for full-color OLED displays. Nanoscale 2020, 12, 2103–2110. [Google Scholar] [CrossRef] [PubMed]
- Roh, H.; Ko, D.; Shin, D.Y.; Chang, J.H.; Hahm, D.; Baet, W.K.; Lee, C.; Kim, J.Y.; Kwalk, J. Enhanced performance of pixelated quantum dot light-emitting diodes by inkjet printing of quantum dot–polymer composites. Adv. Opt. Mater. 2021, 9. [Google Scholar] [CrossRef]
- Burns, S.E.; Cain, P.; Mills, J.; Wang, J.; Sirringhaus, H. Inkjet printing of polymer thin-film transistor circuits. MRS Bull. 2011, 28, 829–834. [Google Scholar] [CrossRef]
- Godard, N.; Glinsek, S.; Defay, E. Inkjet-printed silver as alternative top electrode for lead zirconate titanate thin films. J. Alloy Compd. 2019, 783, 801–805. [Google Scholar] [CrossRef]
- Rahumi, O.; Sobolev, A.; Rath, M.K.; Borodianskiy, K. Nanostructured engineering of nickel cermet anode for solid oxide fuel cell using inkjet printing. J. Eur. Ceram. Soc. 2021, 41, 4528–4536. [Google Scholar] [CrossRef]
- Secor, E.B.; Prabhumirashi, P.L.; Puntambekar, K.; Geier, M.L.; Hersam, M.C. Inkjet printing of high conductivity, flexible graphene patterns. J. Phys. Chem. Lett. 2013, 4, 1347–1351. [Google Scholar] [CrossRef]
- Wang, C.T.; Huang, K.Y.; Lin, D.T.; Liao, W.C.; Lin, H.W.; Hu, Y.C. A flexible proximity sensor fully fabricated by inkjet printing. Sensors 2010, 10, 5054–5062. [Google Scholar] [CrossRef]
- Yin, Z.; Huang, Y.; Bu, N.; Wang, X.; Xiong, Y. Inkjet printing for flexible electronics: Materials, processes and equipments. Chin. Sci. Bull. 2010, 55, 3383–3407. [Google Scholar] [CrossRef]
- Bleuel, M.; Carpenter, J.M.; Micklich, B.J.; Geltenbort, P.; Mishima, K.; Shimizu, H.M.; Iwashita, Y.; Hirota, K.; Hino, M.; Kennedy, S.J.; et al. A small angle neutron scattering (SANS) experiment using very cold neutrons (VCN). Phys. B Condens. Matter 2009, 404, 2629–2632. [Google Scholar] [CrossRef]
- Ciftja, O. Generalized description of few-electron quantum dots at zero and nonzero magnetic fields. J. Phys. Condens. Matter 2007, 19, 046220. [Google Scholar] [CrossRef]
- Ciftja, O.; Faruk, M.G. Two-dimensional quantum-dot helium in a magnetic field: Variational theory. Phys. Rev. B 2005, 72, 1–10. [Google Scholar] [CrossRef]
- Ciftja, O. Understanding electronic systems in semiconductor quantum dots. Phys. Scr. 2013, 88, 8302. [Google Scholar] [CrossRef]
- Ezaki, T.; Mori, N.; Hamaguchi, C. Electronic structures in circular, elliptic, and triangular quantum dots. Phys. Rev. B 1997, 56, 6428–6431. [Google Scholar] [CrossRef]
- Harju, A.; Sverdlov, V.; Barbiellini, B.; Nieminen, R.M. Variational wave function for a two-electron quantum dot. Phys. B Condens. Matter 1998, 255, 145–149. [Google Scholar] [CrossRef]
- Wagner, M.; Merkt, U.; Chaplik, A.V. Spin-singlet–spin-triplet oscillations in quantum dots. Phys. Rev. B Condens. Matter 1992, 45, 1951–1954. [Google Scholar] [CrossRef]
- Merkt, U.; Huser, J.; Wagner, M.J. Energy spectra of two electrons in a harmonic quantum dot. Phys. Rev. B 1991, 43, 7320–7323. [Google Scholar] [CrossRef]
- Pfannkuche, D.; Gerhardts, R.R. Quantum-dot helium: Effects of deviations from a parabolic confinement potentia. Phys. Rev. B 1991, 44, 13132–13135. [Google Scholar] [CrossRef]
- Pfannkuche, D.; Gerhardts, R.R.; Maksym, P.A.; Gudmundsson, V. Theory of quantum dot helium. Phys. B Condens. Matter 1993, 189, 6–15. [Google Scholar] [CrossRef]
- Pfannkuche, D.; Gerhardts, R.R.; Maksym, P.A. Comparison of a Hartree, a Hartree-Fock, and an exact treatment of quantum-dot helium. Phys. Rev. B Condens. Matter 1993, 47, 2244–2250. [Google Scholar] [CrossRef] [PubMed]
- Cheng, C.; Cheng, X. Quantum Dot Nanophotonics and Applications; Science Press: Beijing, China, 2018. [Google Scholar]
- Kang, Z.; Liu, Y.; Mao, B. Synthesis and Application of Quantum Dots; Science Press: Beijing, China, 2018. [Google Scholar]
- Bao, J.; Bawendi, M.G. A colloidal quantum dot spectrometer. Nature 2015, 523, 67–70. [Google Scholar] [CrossRef] [PubMed]
- Khan, S.A.; Ellerbee Bowden, A.K. Colloidal quantum dots for cost-effective, miniaturized, and simple spectrometers. Clin. Chem. 2016, 62, 548–550. [Google Scholar] [CrossRef] [PubMed][Green Version]
- Yang, Z.; Albrow-Owen, T.; Cui, H.; Alexander-Webber, J.; Gu, F.; Wang, X.; Wu, T.-C.; Zhuge, M.; Williams, C.; Wang, P.; et al. Single-nanowire spectrometers. Science 2019, 365, 1017–1020. [Google Scholar] [CrossRef]
- Zhu, X.; Bian, L.; Fu, H.; Wang, L.; Zou, B.; Dai, Q.; Zhang, J.; Zhong, H. Broadband perovskite quantum dot spectrometer beyond human visual resolution. Light Sci. Appl. 2020, 9, 73. [Google Scholar] [CrossRef]
- Li, H.; Bian, L.; Gu, K.; Fu, H.; Yang, G.; Zhong, H.; Zhang, J. A Near-infrared miniature quantum dot spectrometer. Adv. Opt. Mater. 2021, 9, 1–8. [Google Scholar] [CrossRef]
- Wang, S.; Zhang, X.; Sun, Z.; Yang, J.; Guo, T.; Ding, X. Methods of detection multiple chemical substances based on near-infrared colloidal quantum dot arry and spectral restruction algorithm. Spectrosc. Spectr. Anal. 2021, 41, 3370–3376. [Google Scholar]
- Harris, D.J.; Lewis, J.A. Marangoni effects on evaporative lithographic patterning of colloidal films. Langmuir 2008, 24, 3681–3685. [Google Scholar] [CrossRef]
- Bhardwaj, R.; Fang, X.; Attinger, D. Pattern formation during the evaporation of a colloidal nanoliter drop: A numerical and experimental study. New J. Phys. 2009, 11, 075020. [Google Scholar] [CrossRef]
- de Gans, B.J.; Schubert, U.S. Inkjet printing of well-defined polymer dots and arrays. Langmuir 2004, 20, 7789–7793. [Google Scholar] [CrossRef]
- Pesach, D.; Marmur, A. Marangoni effects in the spreading of liquid mixtures on a solid. Langmuir 1986, 3, 514–519. [Google Scholar] [CrossRef]
- Park, J.; Moon, J. Control of colloidal particle deposit patterns within picoliter droplets ejected by ink-jet printing. Langmuir 2006, 22, 3506–3513. [Google Scholar] [CrossRef] [PubMed]
- Still, T.; Yunker, P.J.; Yodh, A.G. Surfactant-induced marangoni eddies alter the coffee-rings of evaporating colloidal drops. Langmuir 2012, 28, 4984–4988. [Google Scholar] [CrossRef]
- Deegan, R.D.; Bakajin, O.; Dupont, T.F.; Huber, G.; Nagel, S.R.; Witten, T.A. Capillary flow as the cause of ring stains fromdried liquid drops. Nature 1997, 389, 827–829. [Google Scholar] [CrossRef]
- Bansal, L.; Seth, P.; Murugappan, B.; Basu, S. Suppression of coffee ring: (Particle) size matters. Appl. Phys. Lett. 2018, 112, 211605. [Google Scholar] [CrossRef]
- Kim, D.O.; Pack, M.; Hu, H.; Kim, H.; Sun, Y. Deposition of colloidal drops containing ellipsoidal particles: Competition between capillary and hydrodynamic forces. Langmuir 2016, 32, 11899–11906. [Google Scholar] [CrossRef]
- Shen, X.; Ho, C.M.; Wong, T.S. Minimal size of coffee ring structure. J. Phys. Chem. B 2010, 114, 5269–5274. [Google Scholar] [CrossRef]
- Saroj, S.K.; Panigrahi Kumar, P. Drying pattern and evaporation dynamics of sessile ferrofluid droplet on a PDMS substrate. Colloids Surf. A Physicochem. Eng. Asp. 2019, 580, 123672. [Google Scholar] [CrossRef]
- Ahmad, I.; Hussain, A.; Ali, A.; Jan, R. Energetically and sterically favorable assembly of identical gold nanorods with varying concentrations of nanospheres. Surf. Rev. Lett. 2021, 28, 2150028. [Google Scholar] [CrossRef]
- Lhuillier, E.; Scarafagio, M.; Hease, P.; Nadal, B.; Aubin, H.; Xu, X.Z.; Lequeux, N.; Patriarche, G.; Ithurria, S.; Dubertret, B. Infrared photodetection based on colloidal quantum-dot films with high mobility and optical absorption up to THz. Nano Lett. 2016, 16, 1282–1286. [Google Scholar] [CrossRef]
- Yang, T. An essay on the cohesion of fluids. Philos. Trans. R. Soc. 1805, 95, 65. [Google Scholar]
- Fu, X.; Shen, W.; Yao, T.; Hou, W. Physical Chemistry; Higher Education Press: Beijing, China, 2006. [Google Scholar]


| Type of QD Filter Array | Operating Range | Reference |
|---|---|---|
| CdS, CdSe QD filter array | Vis: 390–690 nm | [13,14] |
| CdSxSe1−x nanowire filter array | Vis: 500–630 nm | [15] |
| Perovskite QD filter array | Vis–NIR: 250–1000 nm | [16] |
| PbS, PbSe QD filter array | NIR: 900–1700 nm | [17,18] |
| QD Solution (μL) | Toluene (μL) | N-Octane (μL) | Ratio of Toluene to N-Octane |
|---|---|---|---|
| 10 | 40 | 50 | 5:5 |
| 10 | 30 | 60 | 4:6 |
| 10 | 20 | 70 | 3:7 |
| 10 | 10 | 80 | 2:8 |
| 10 | 0 | 90 | 1:9 |
| Solvent | Isopropanol | N-Octane | Ethanol | Ethyl Acetate | Butyl Acetate | Acetone | Chloroform | Toluene |
|---|---|---|---|---|---|---|---|---|
| Surface tension (mN/m) | 24.10 | 24.86 | 25.63 | 26.53 | 26.73 | 27.29 | 28.02 | 28.83 |
| Radius R (mm) | 2.33 | 2.17 | 2.16 | 2.11 | 2.07 | 1.98 | 1.79 | 1.62 |
| Contact angle (°) | 2.89 | 3.55 | 3.63 | 3.88 | 4.11 | 4.67 | 6.38 | 8.50 |
| Wa (J/m2) | 48.16 | 49.68 | 51.22 | 52.99 | 53.39 | 54.50 | 55.87 | 57.35 |
| Wi (J/m2) | −24.06 | −24.82 | −25.58 | −26.46 | −26.66 | −27.20 | −27.85 | −28.52 |
| S | 0.03 | 0.05 | 0.05 | 0.06 | 0.07 | 0.09 | 0.17 | 0.32 |
| Volume Ratio of Toluene to N-Octane | 5:5 | 4:6 | 3:7 | 2:8 | 1:9 |
|---|---|---|---|---|---|
| Surface tension (mN/m) | 24.86 | 24.49 | 24.36 | 23.15 | 22.85 |
| Size (nm) | 38.79 | 106.31 | 151.78 | 183.27 | 294.89 |
| Coffee ring width (μm) | 31.41 | 38.76 | 50.42 | 53.23 | - |
Publisher’s Note: MDPI stays neutral with regard to jurisdictional claims in published maps and institutional affiliations. |
© 2022 by the authors. Licensee MDPI, Basel, Switzerland. This article is an open access article distributed under the terms and conditions of the Creative Commons Attribution (CC BY) license (https://creativecommons.org/licenses/by/4.0/).
Share and Cite
Wang, S.; Zhang, X.; Wang, Y.; Guo, T.; Cao, S. Influence of Ink Properties on the Morphology of Long-Wave Infrared HgSe Quantum Dot Films. Nanomaterials 2022, 12, 2180. https://doi.org/10.3390/nano12132180
Wang S, Zhang X, Wang Y, Guo T, Cao S. Influence of Ink Properties on the Morphology of Long-Wave Infrared HgSe Quantum Dot Films. Nanomaterials. 2022; 12(13):2180. https://doi.org/10.3390/nano12132180
Chicago/Turabian StyleWang, Suhui, Xu Zhang, Yi Wang, Tengxiao Guo, and Shuya Cao. 2022. "Influence of Ink Properties on the Morphology of Long-Wave Infrared HgSe Quantum Dot Films" Nanomaterials 12, no. 13: 2180. https://doi.org/10.3390/nano12132180
APA StyleWang, S., Zhang, X., Wang, Y., Guo, T., & Cao, S. (2022). Influence of Ink Properties on the Morphology of Long-Wave Infrared HgSe Quantum Dot Films. Nanomaterials, 12(13), 2180. https://doi.org/10.3390/nano12132180