
Fabrication and Characterization of Nanostructured Rock Wool as a Novel Material for Efficient Water-Splitting Application

 ,
,  ,
, 
Abstract
1. Introduction
2. Experimental Work
2.1. Raw Materials
2.2. Synthesis of RW Nanostructure
2.3. Samples Characterization
2.4. Photoelectrochemical (PEC) Measurements
3. Results and Discussion
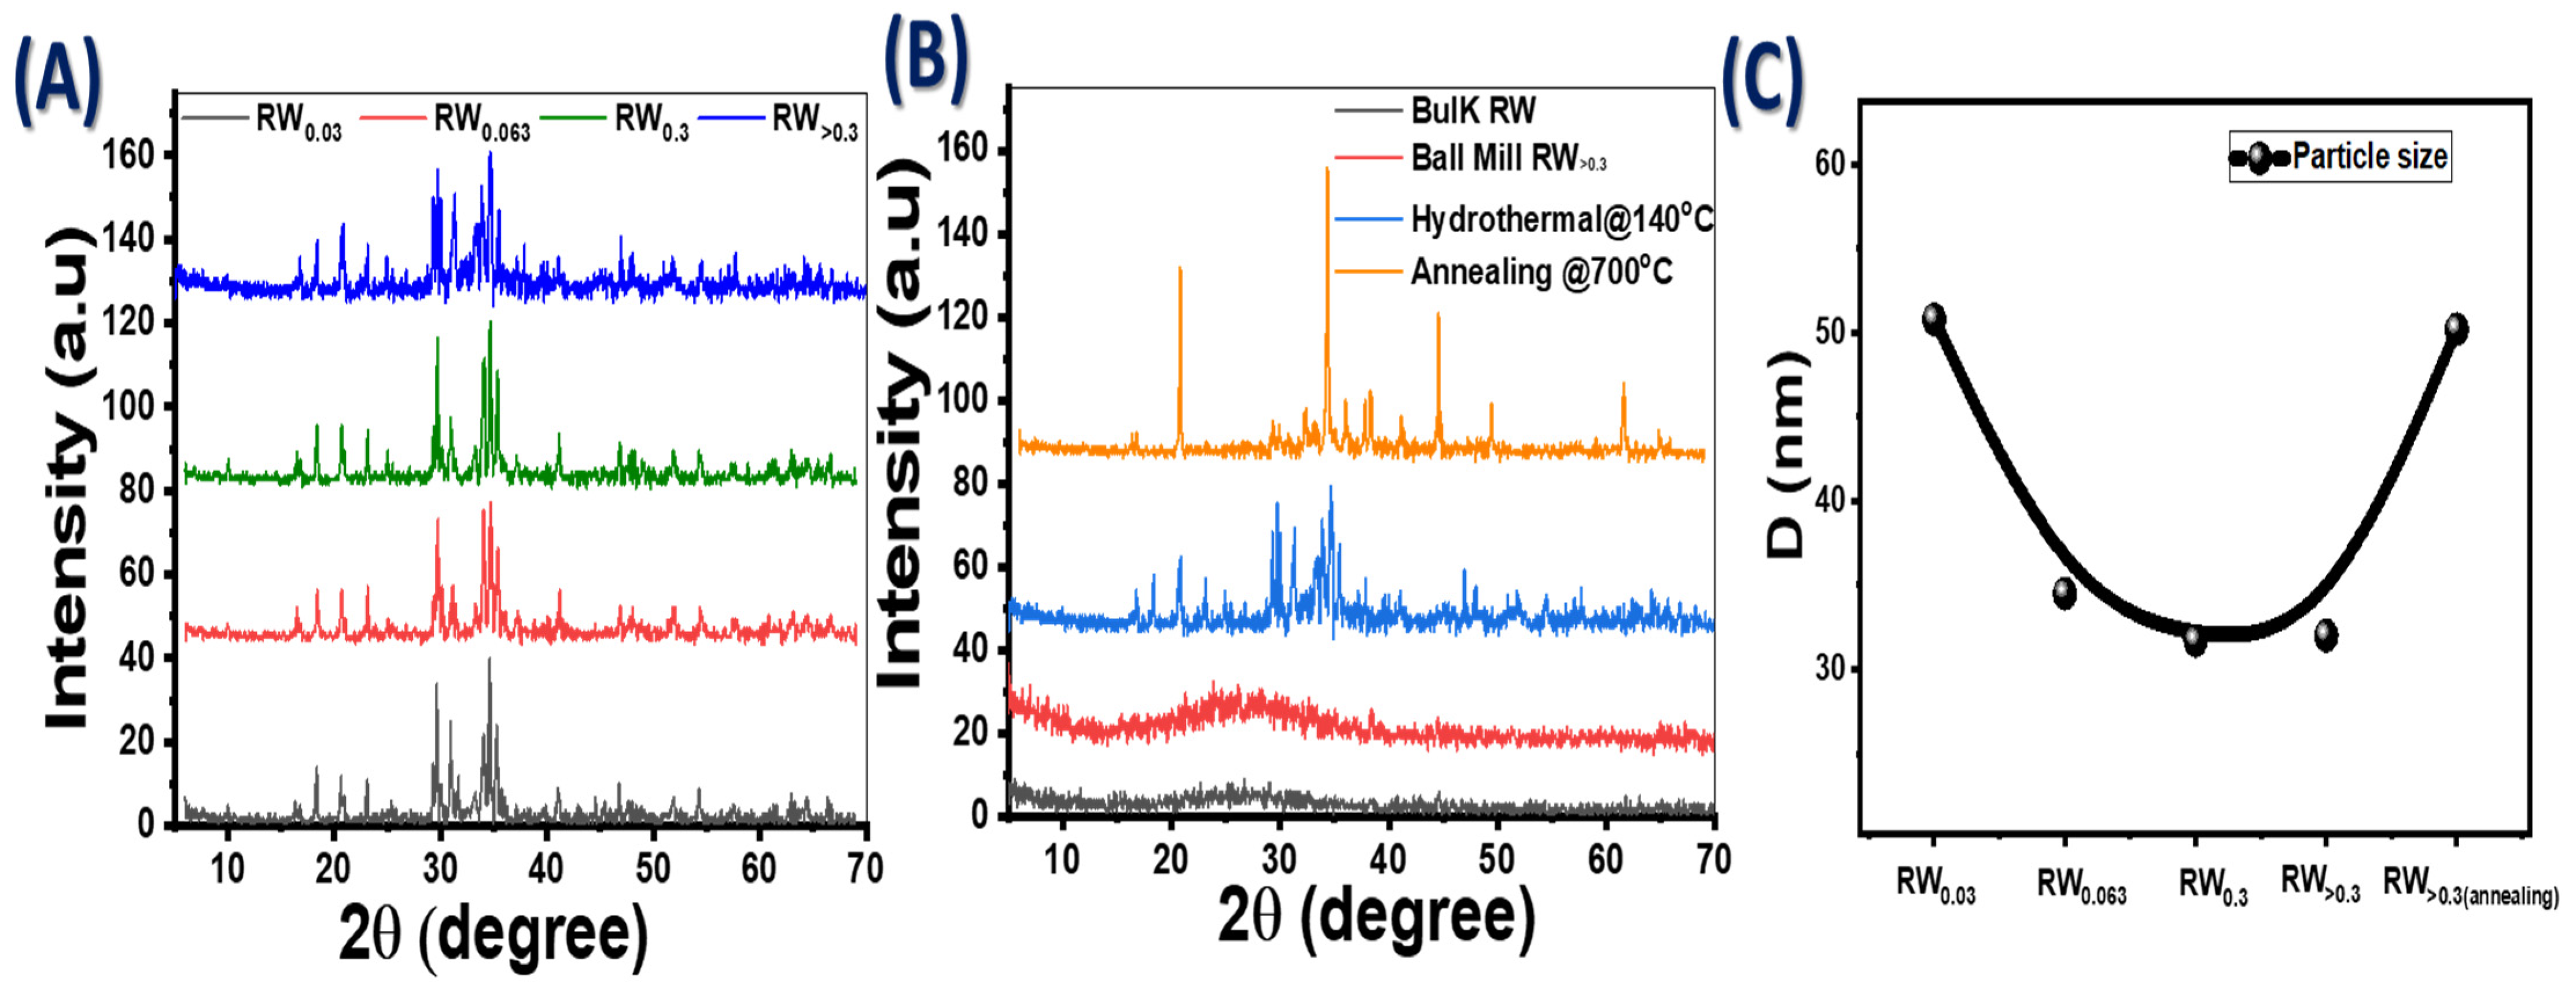
3.1. XRD Structure Analysis
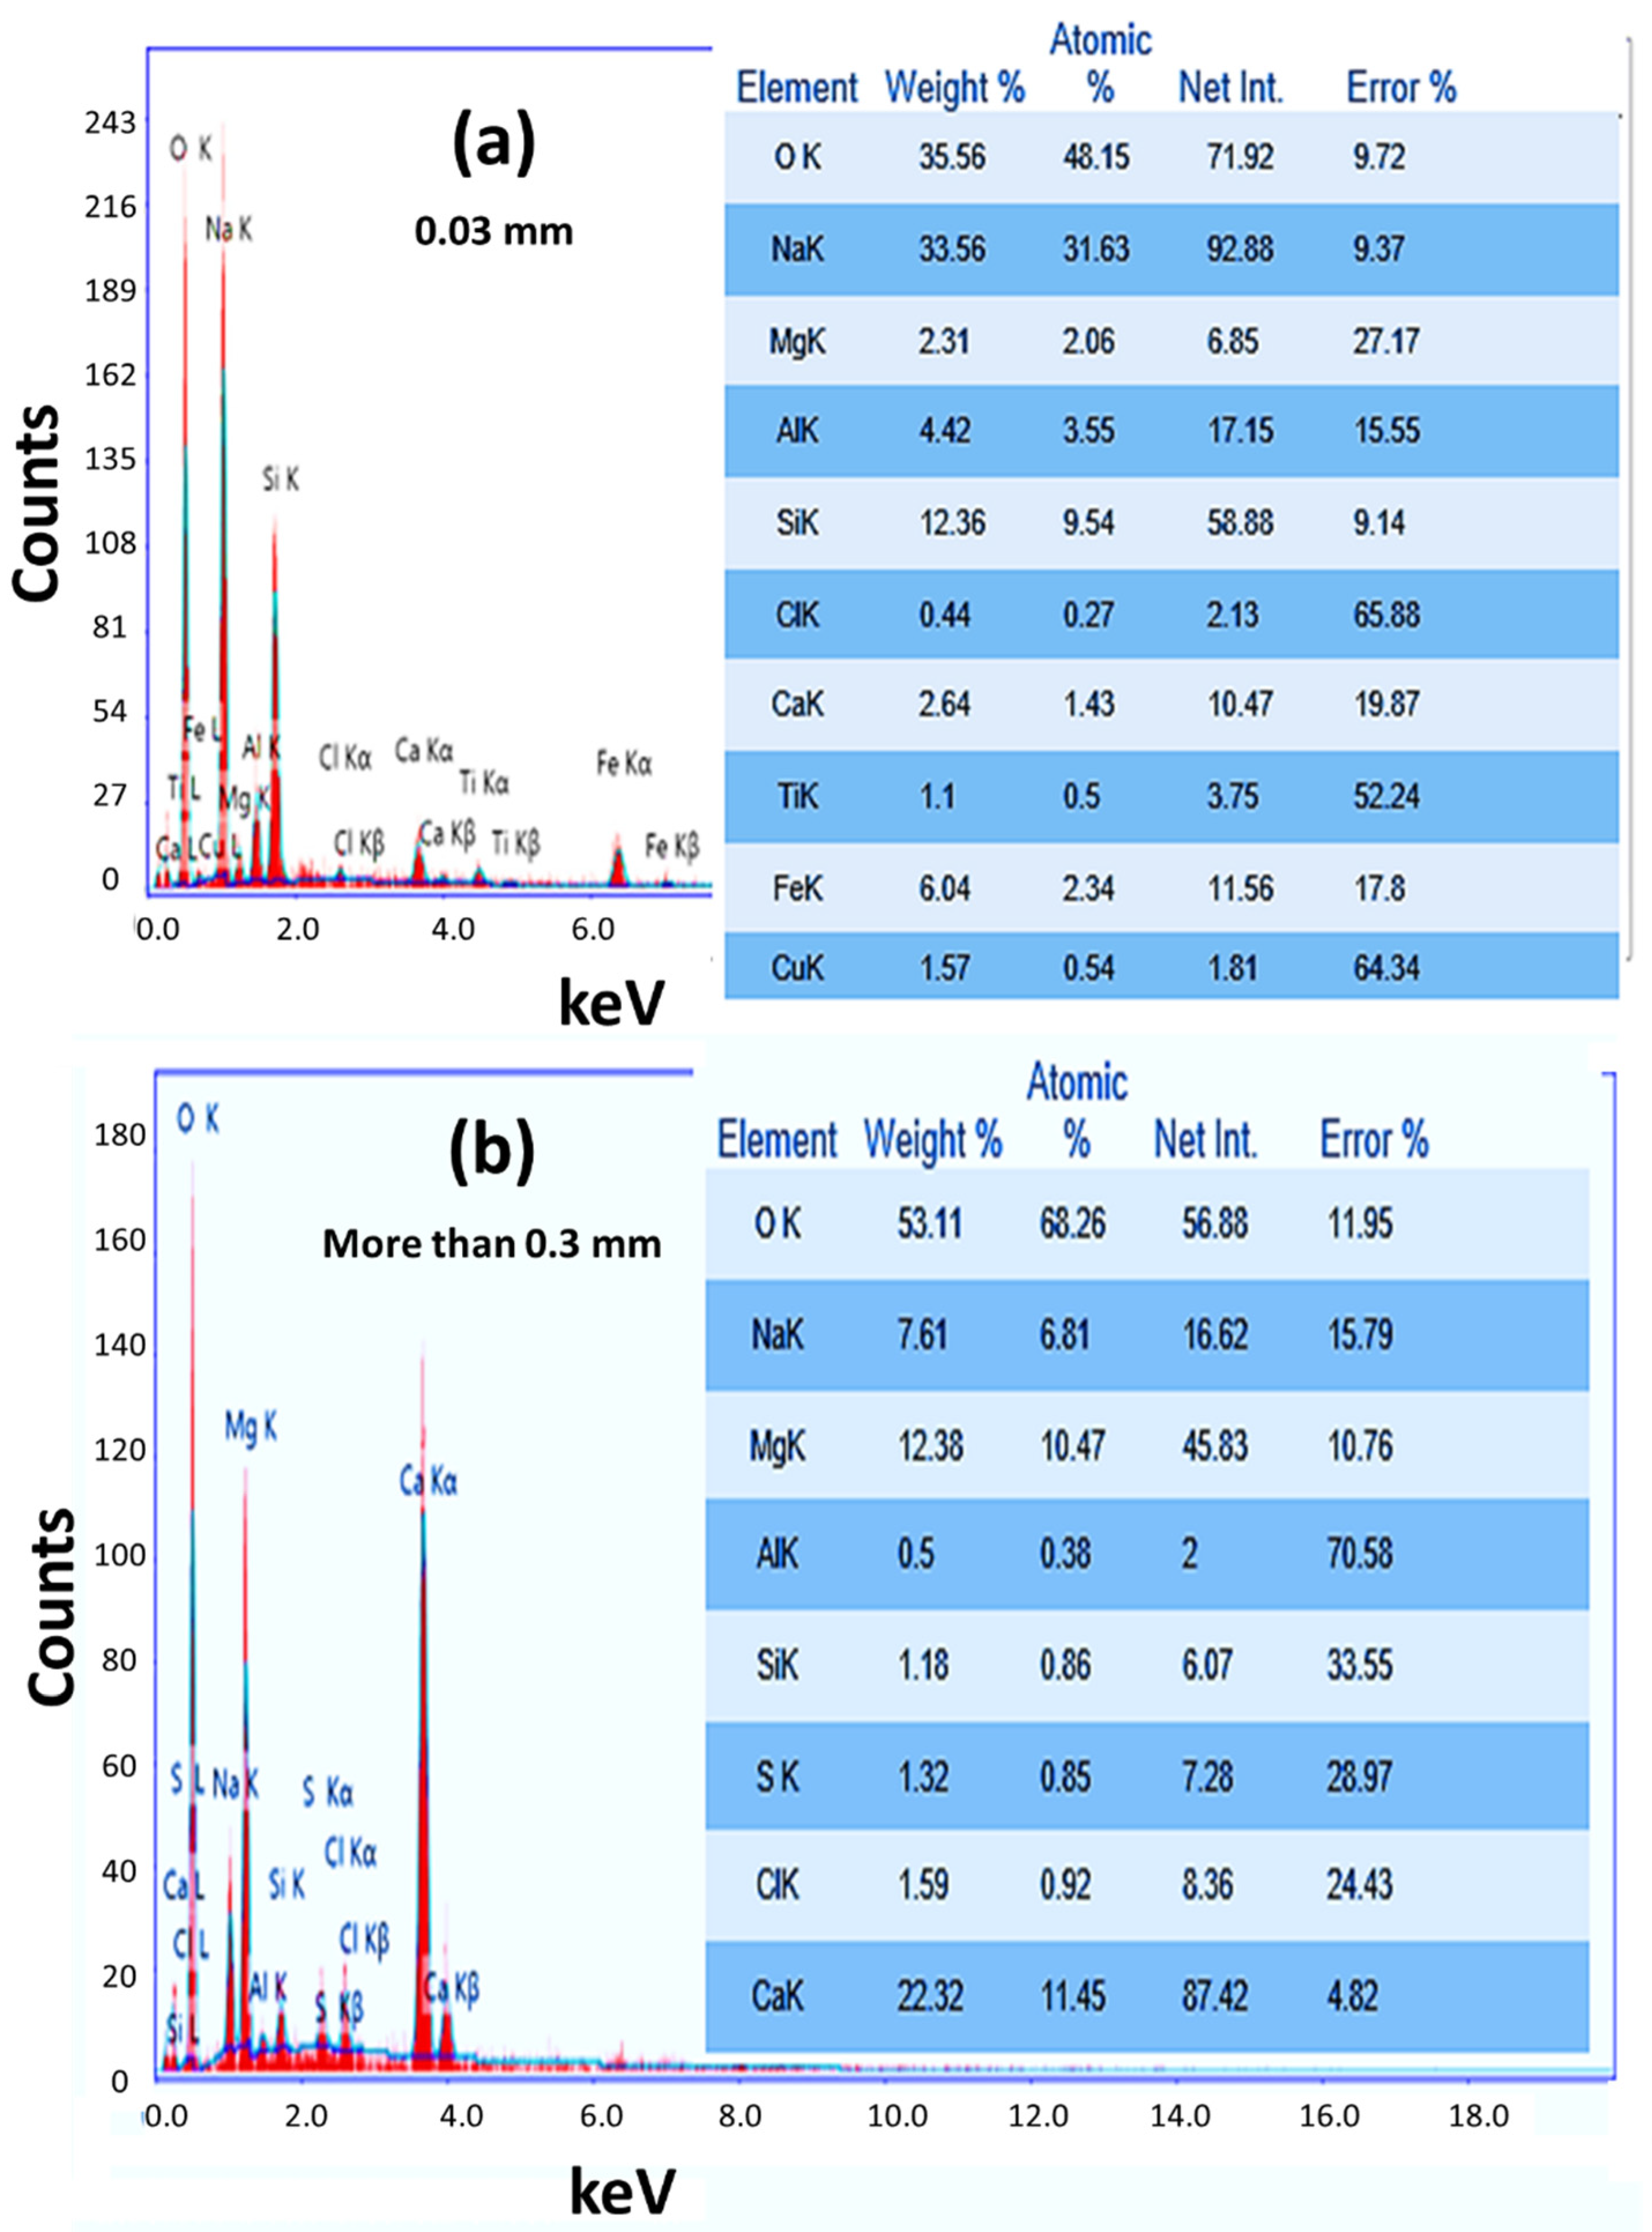
3.2. Chemical Composition
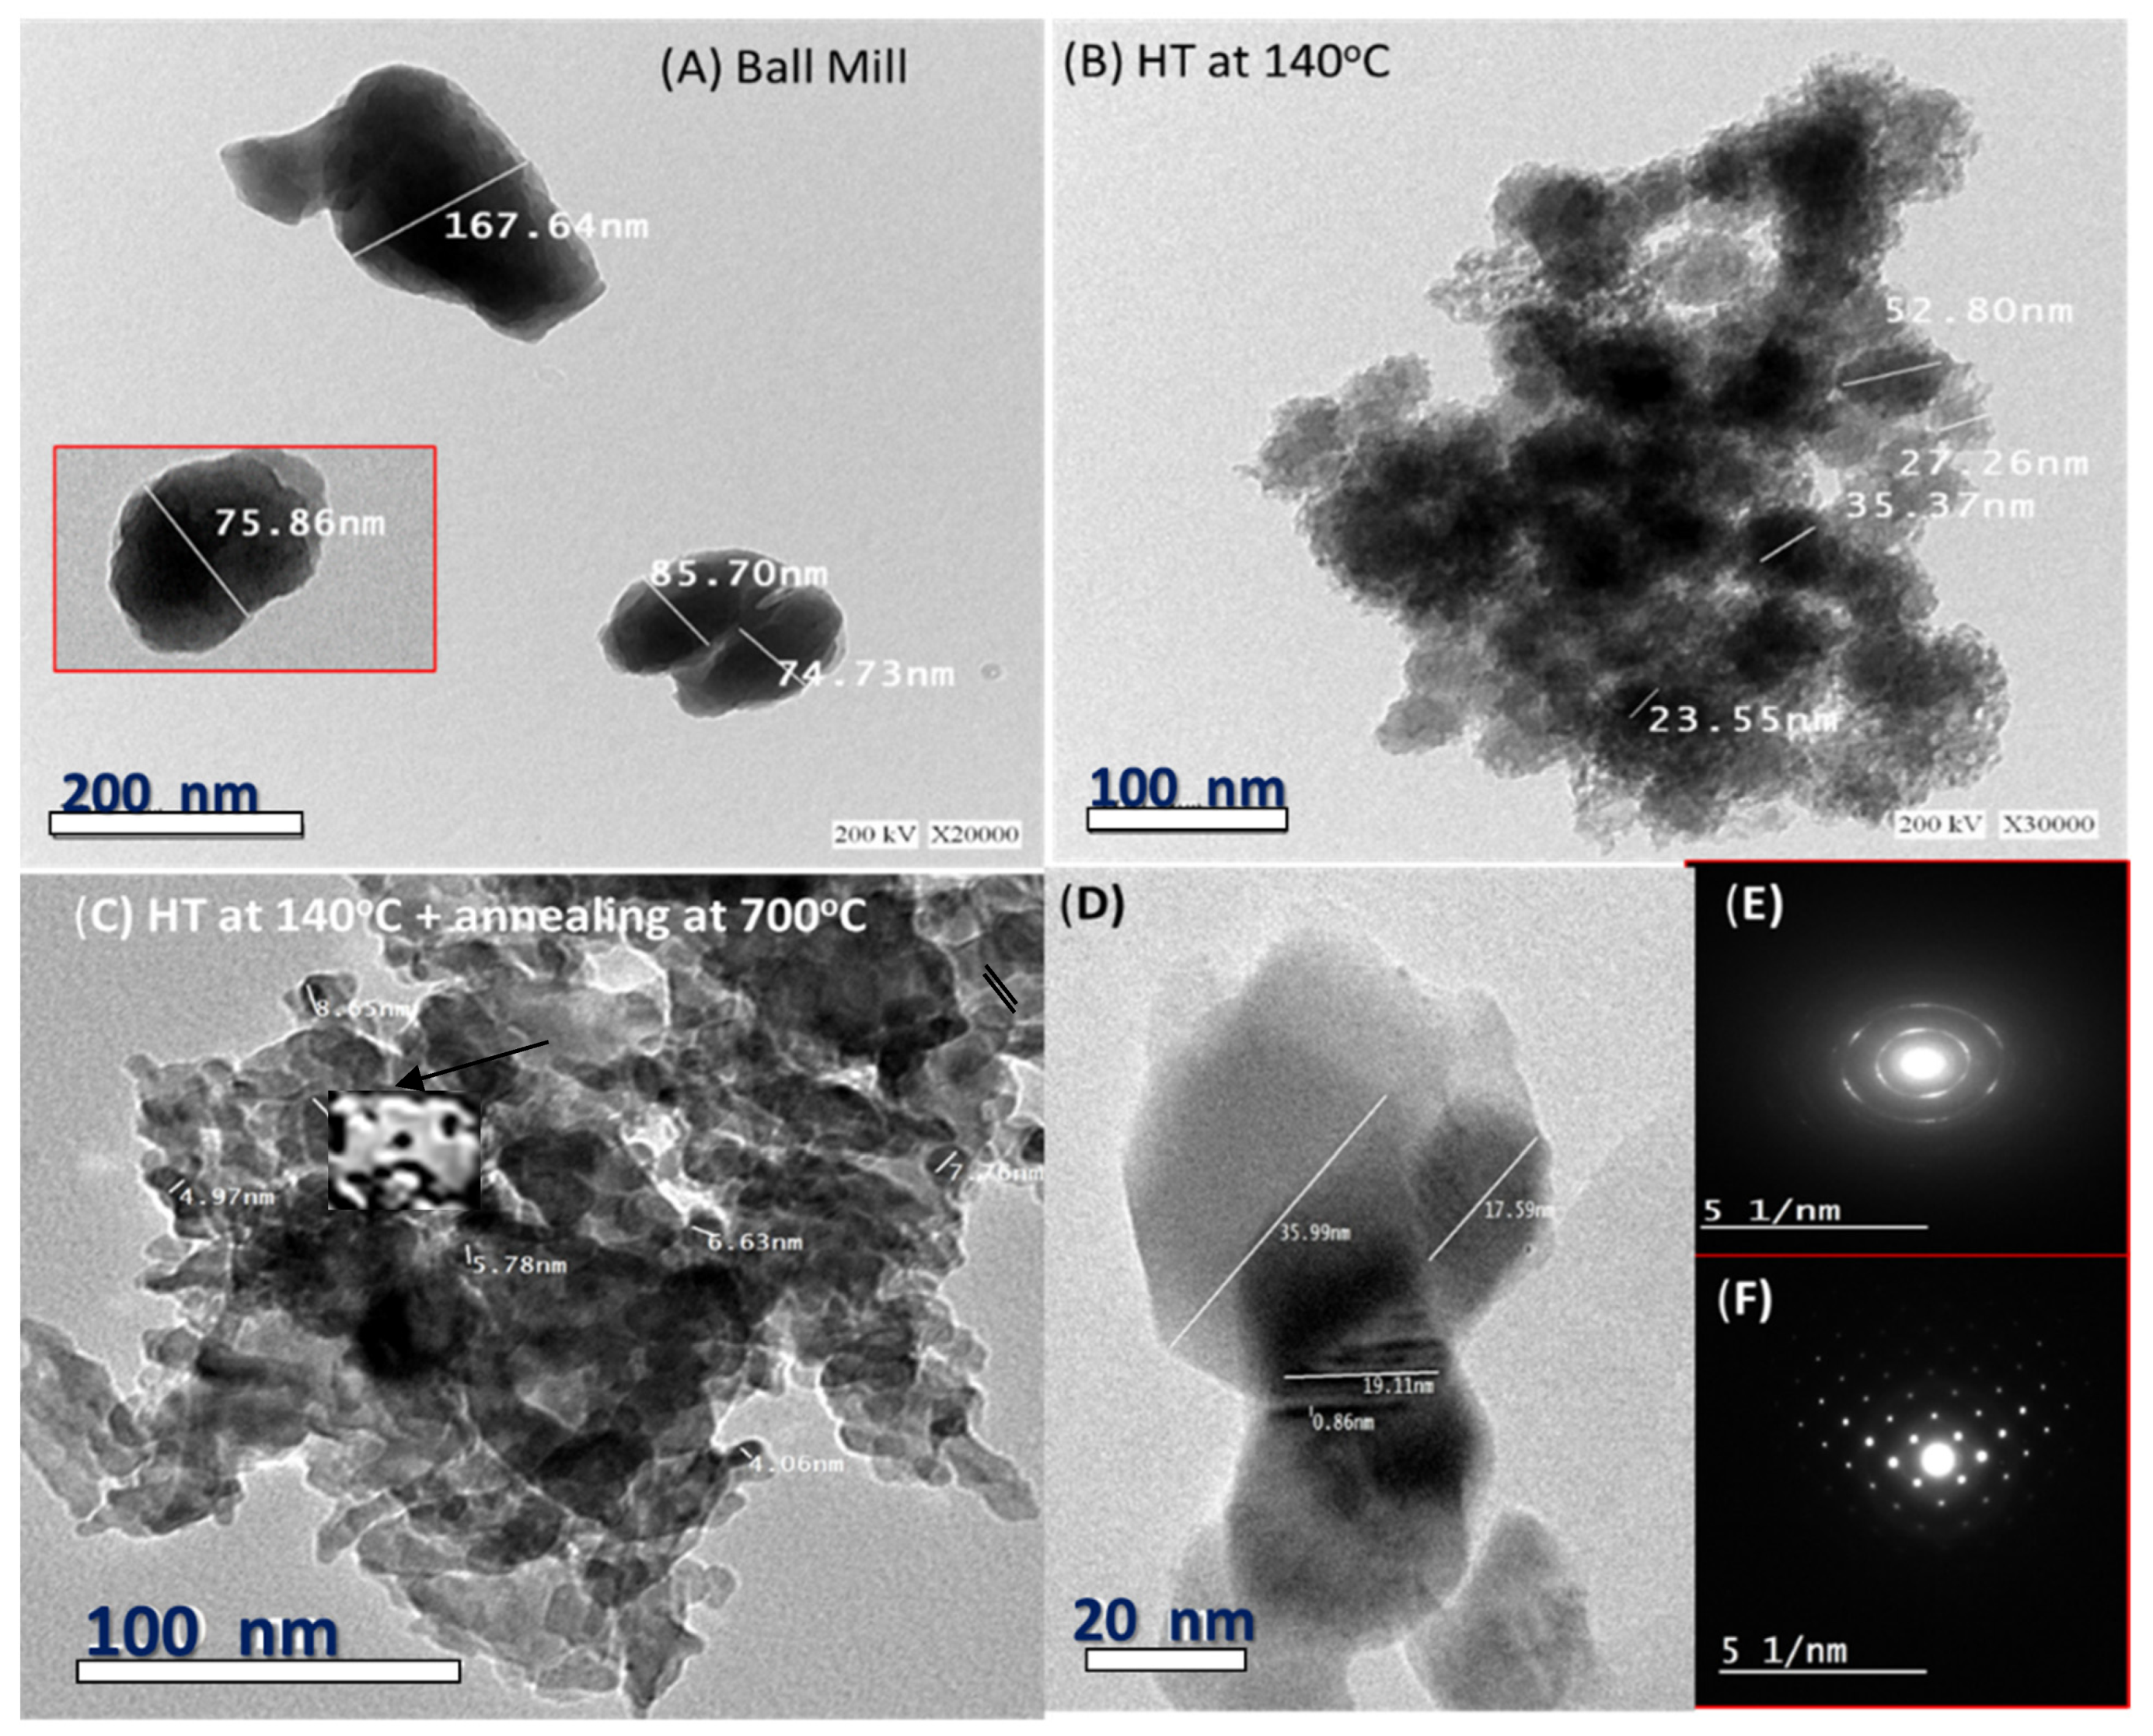
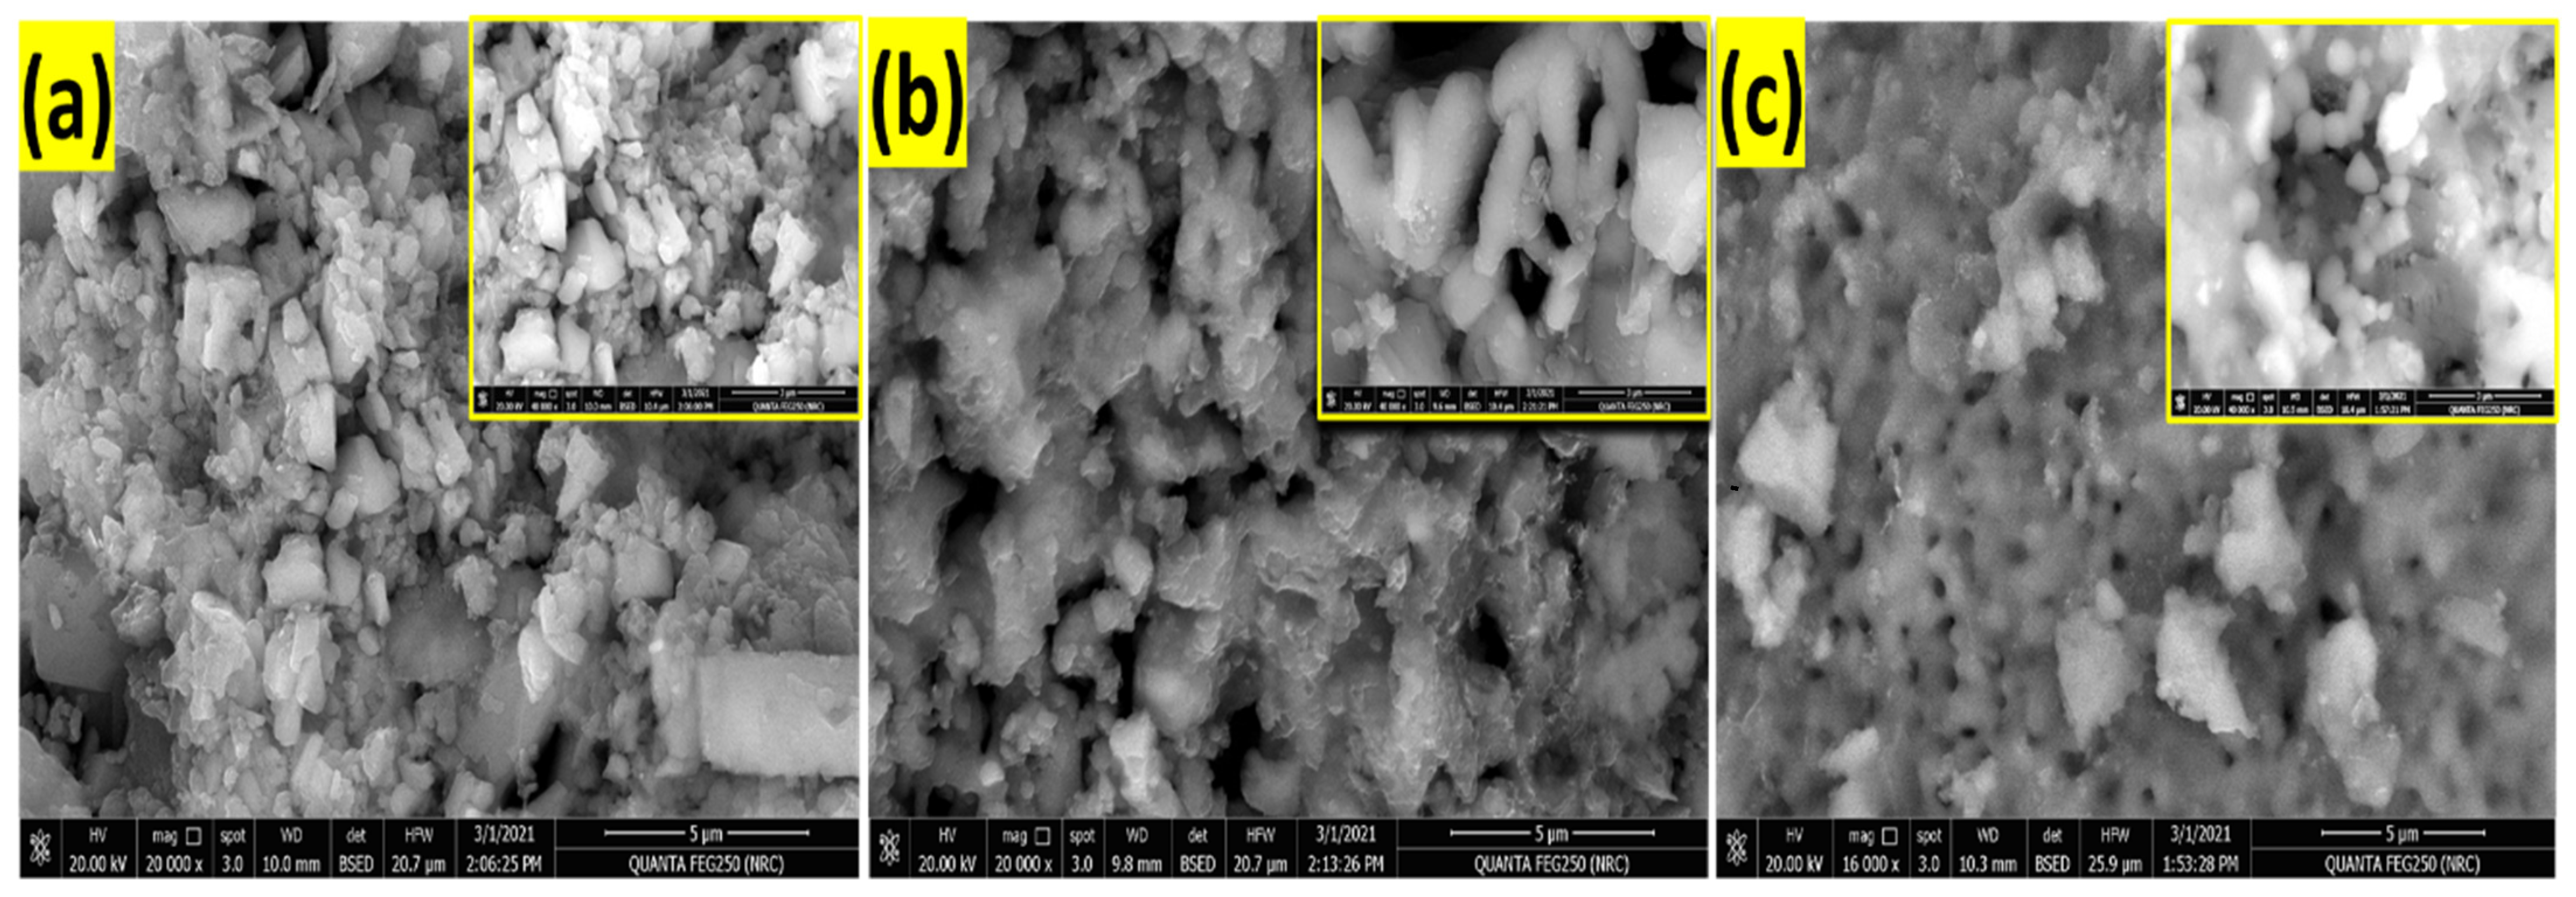
3.3. Surface Morphology
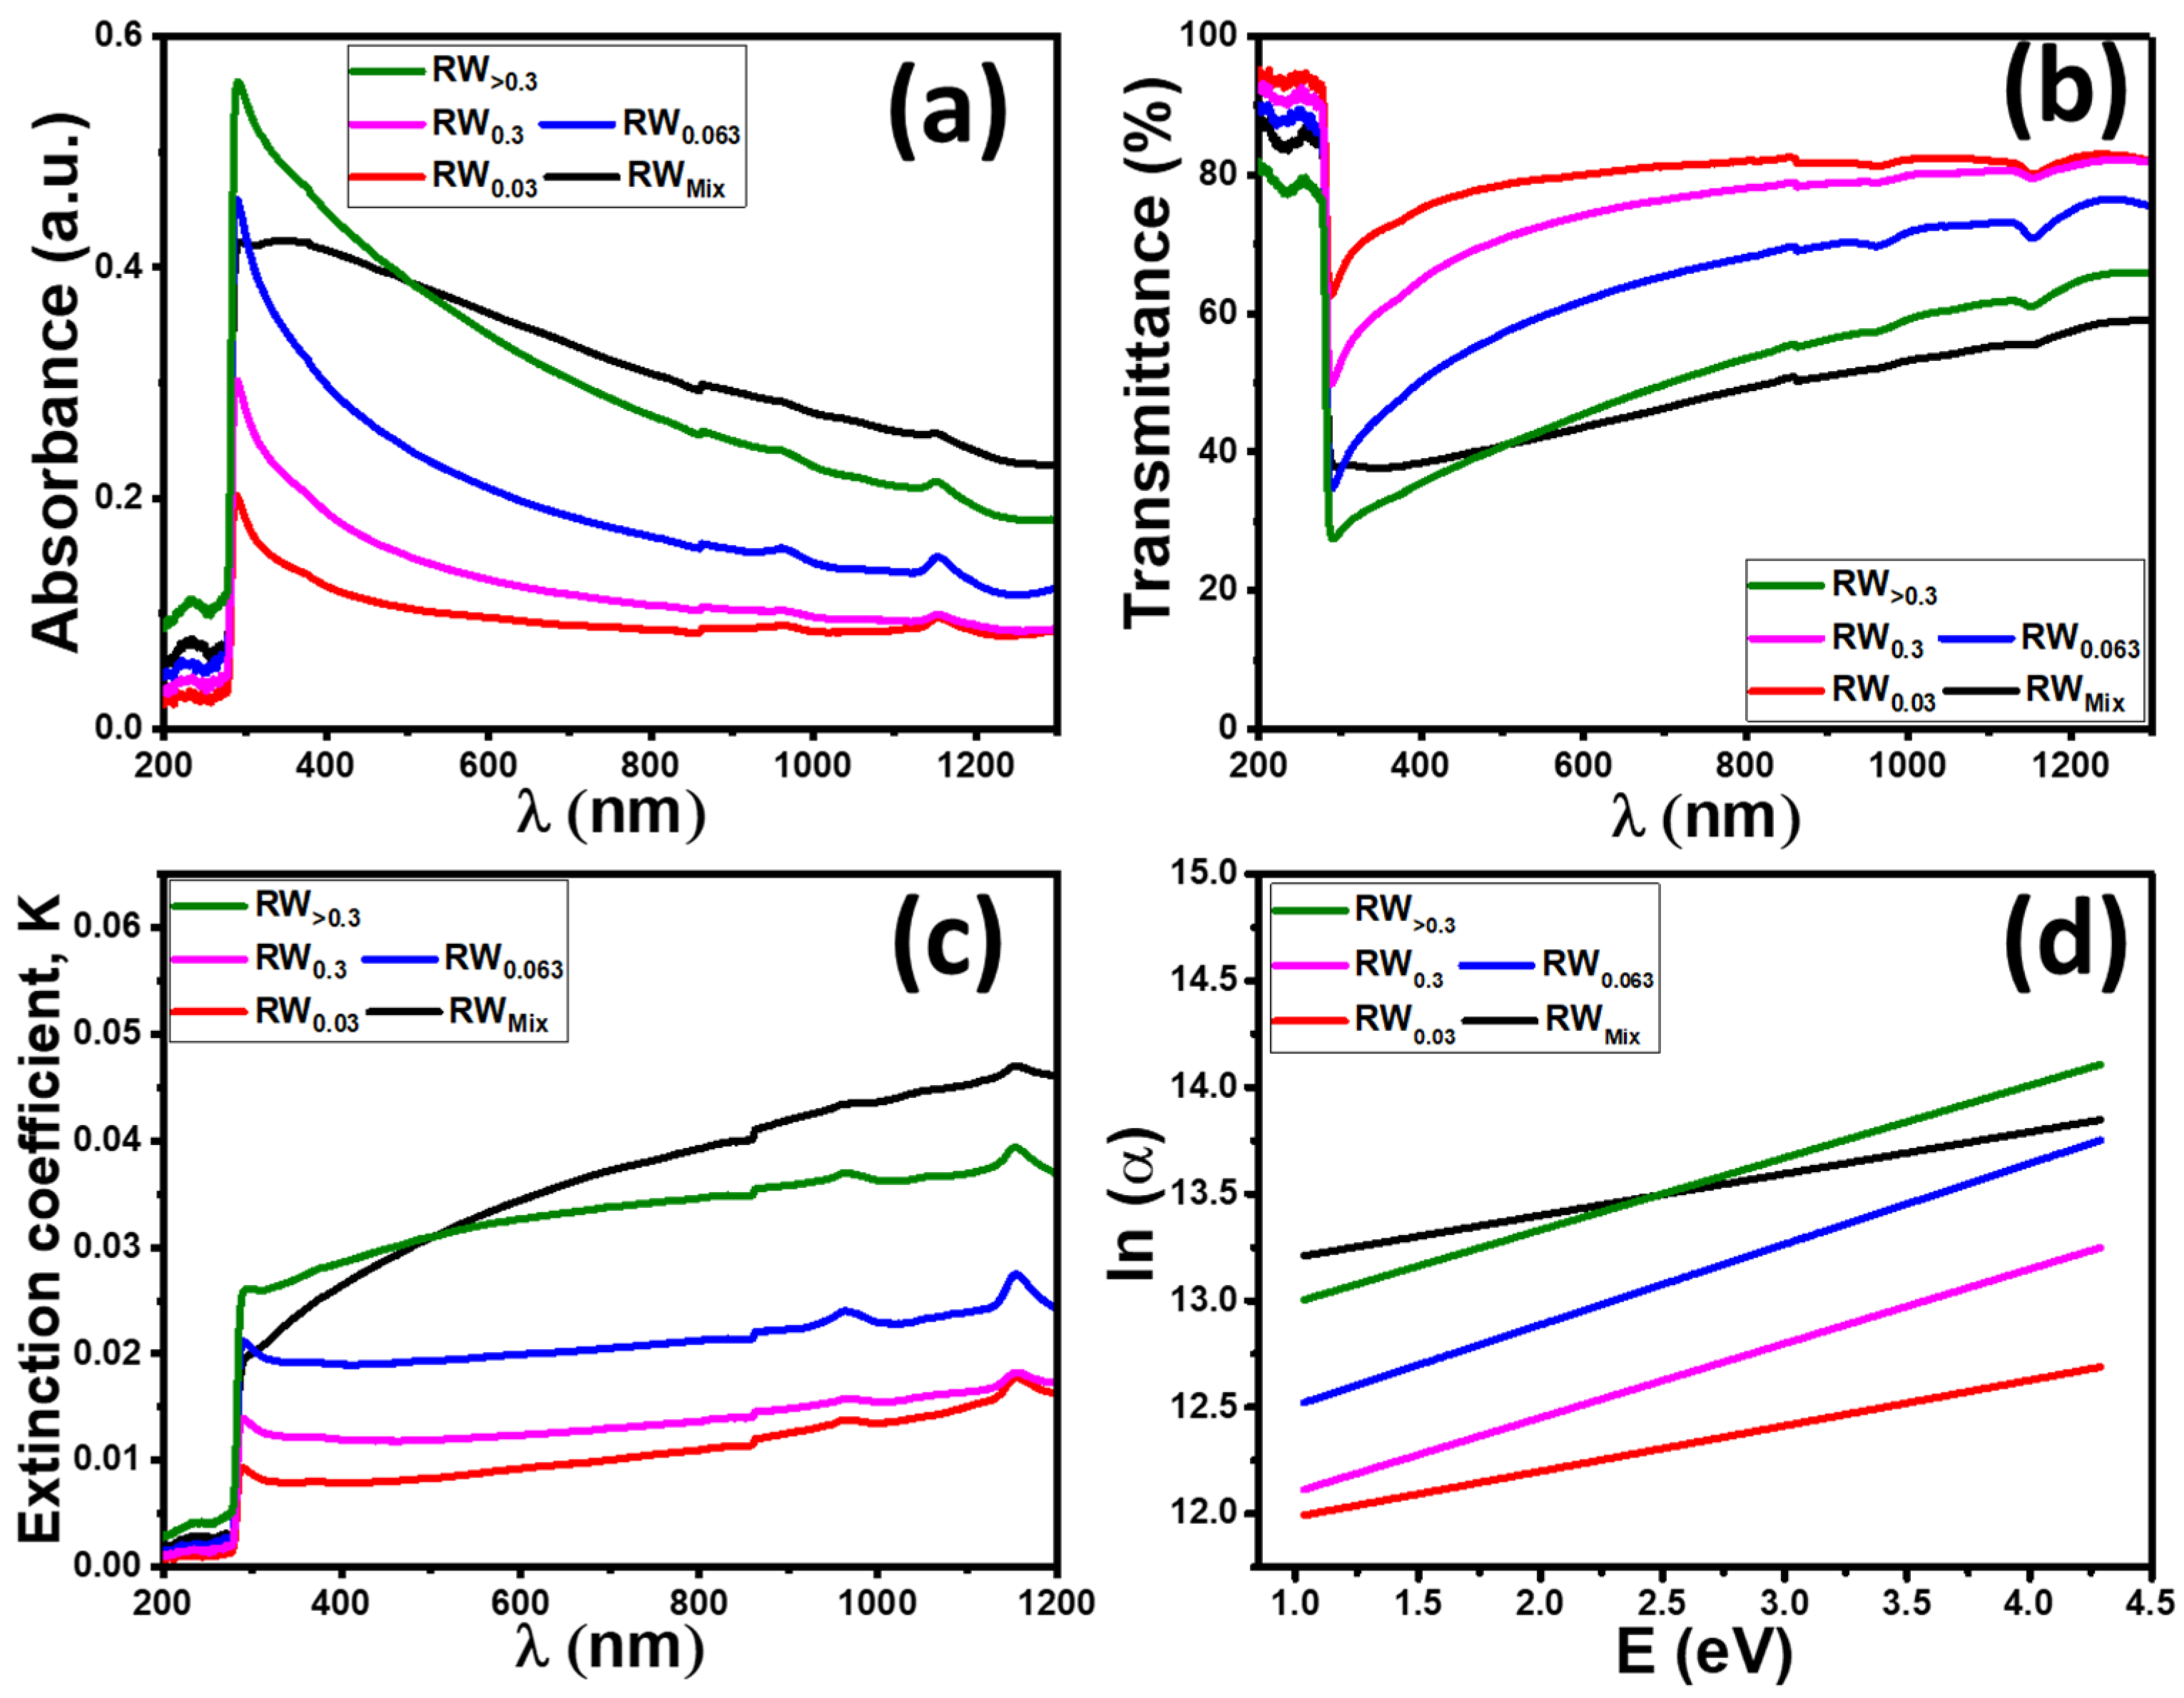
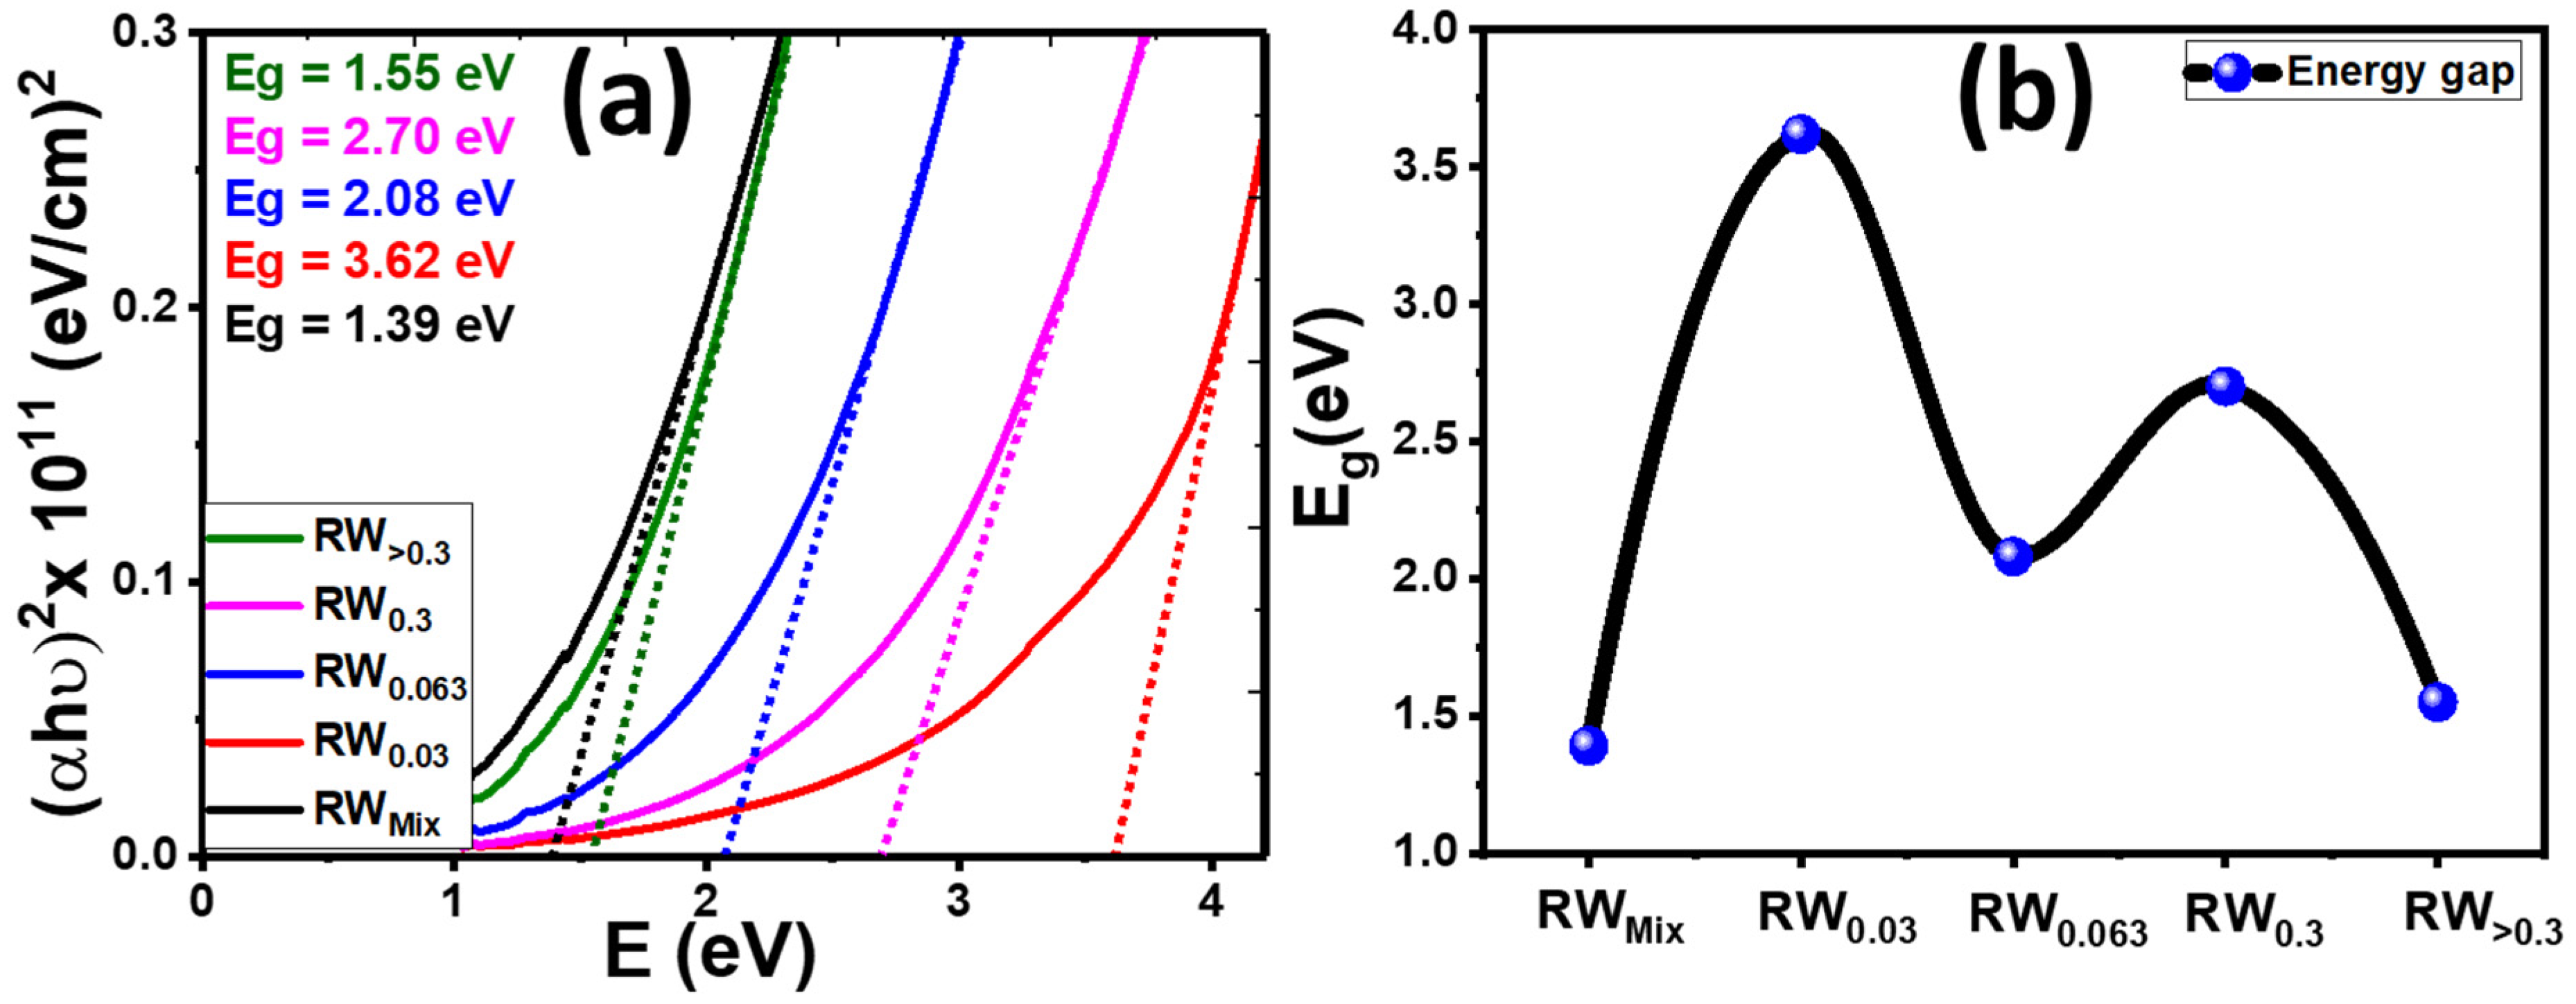
3.4. Optical Analysis
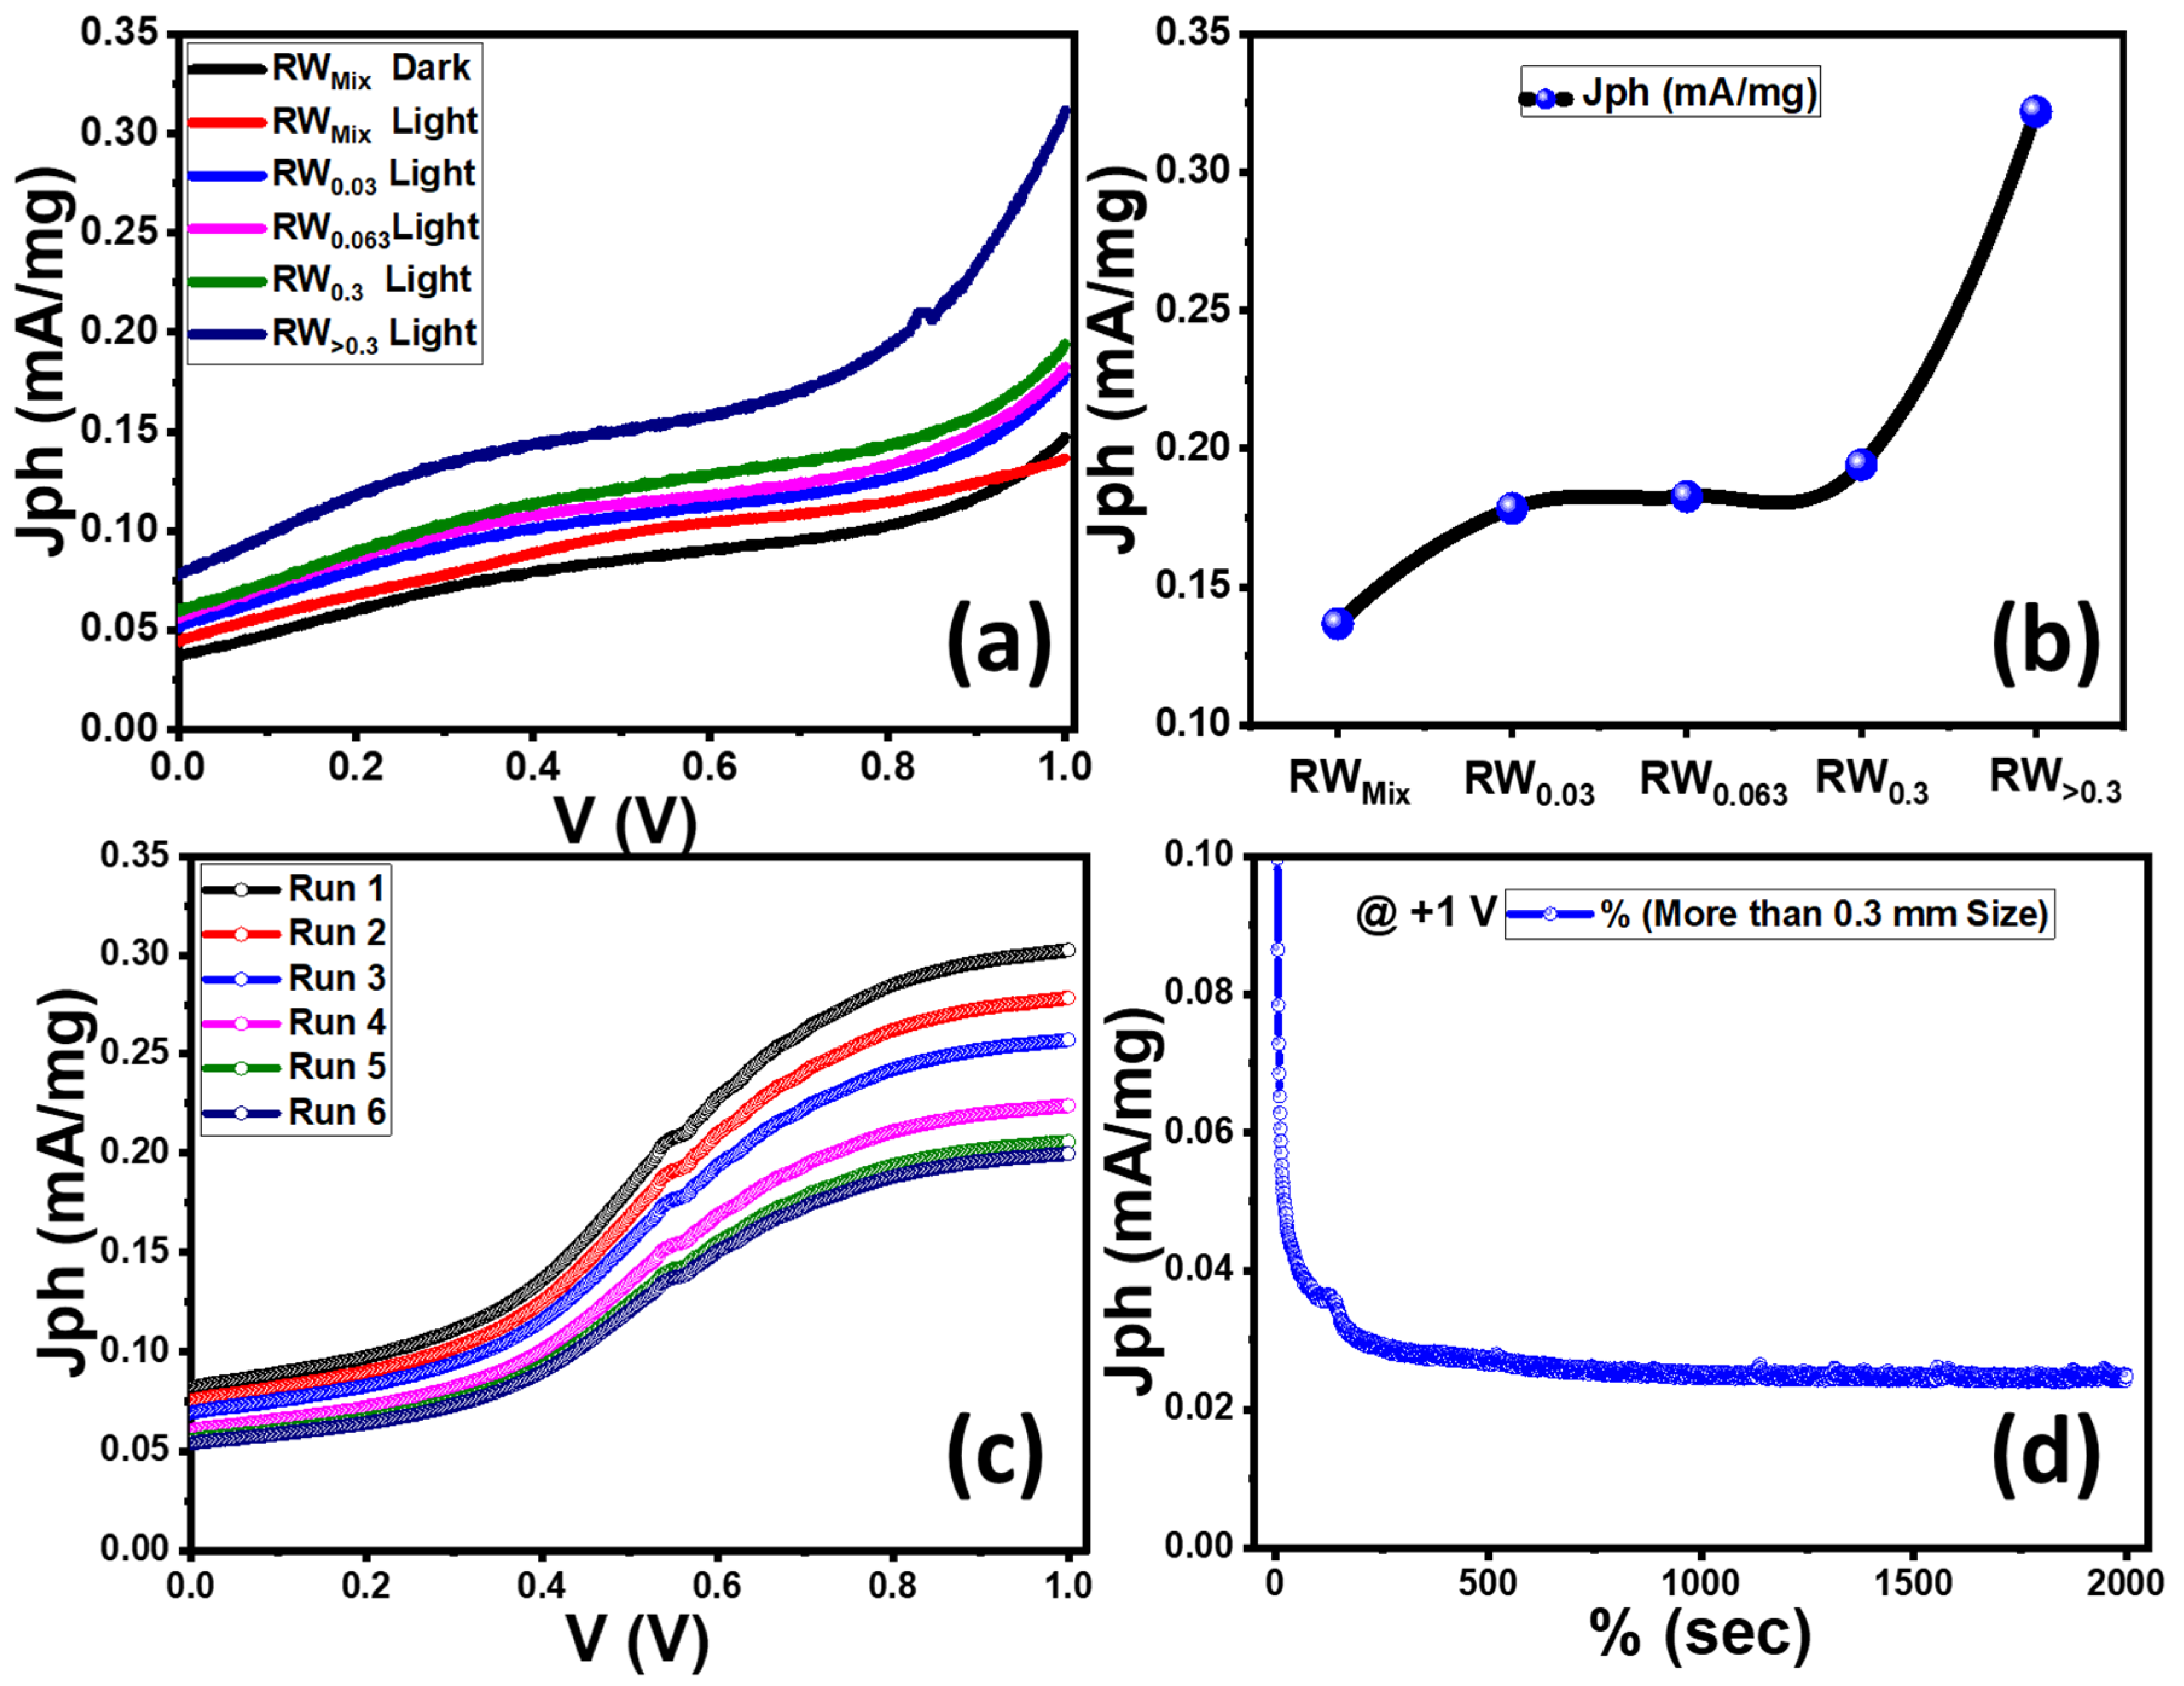
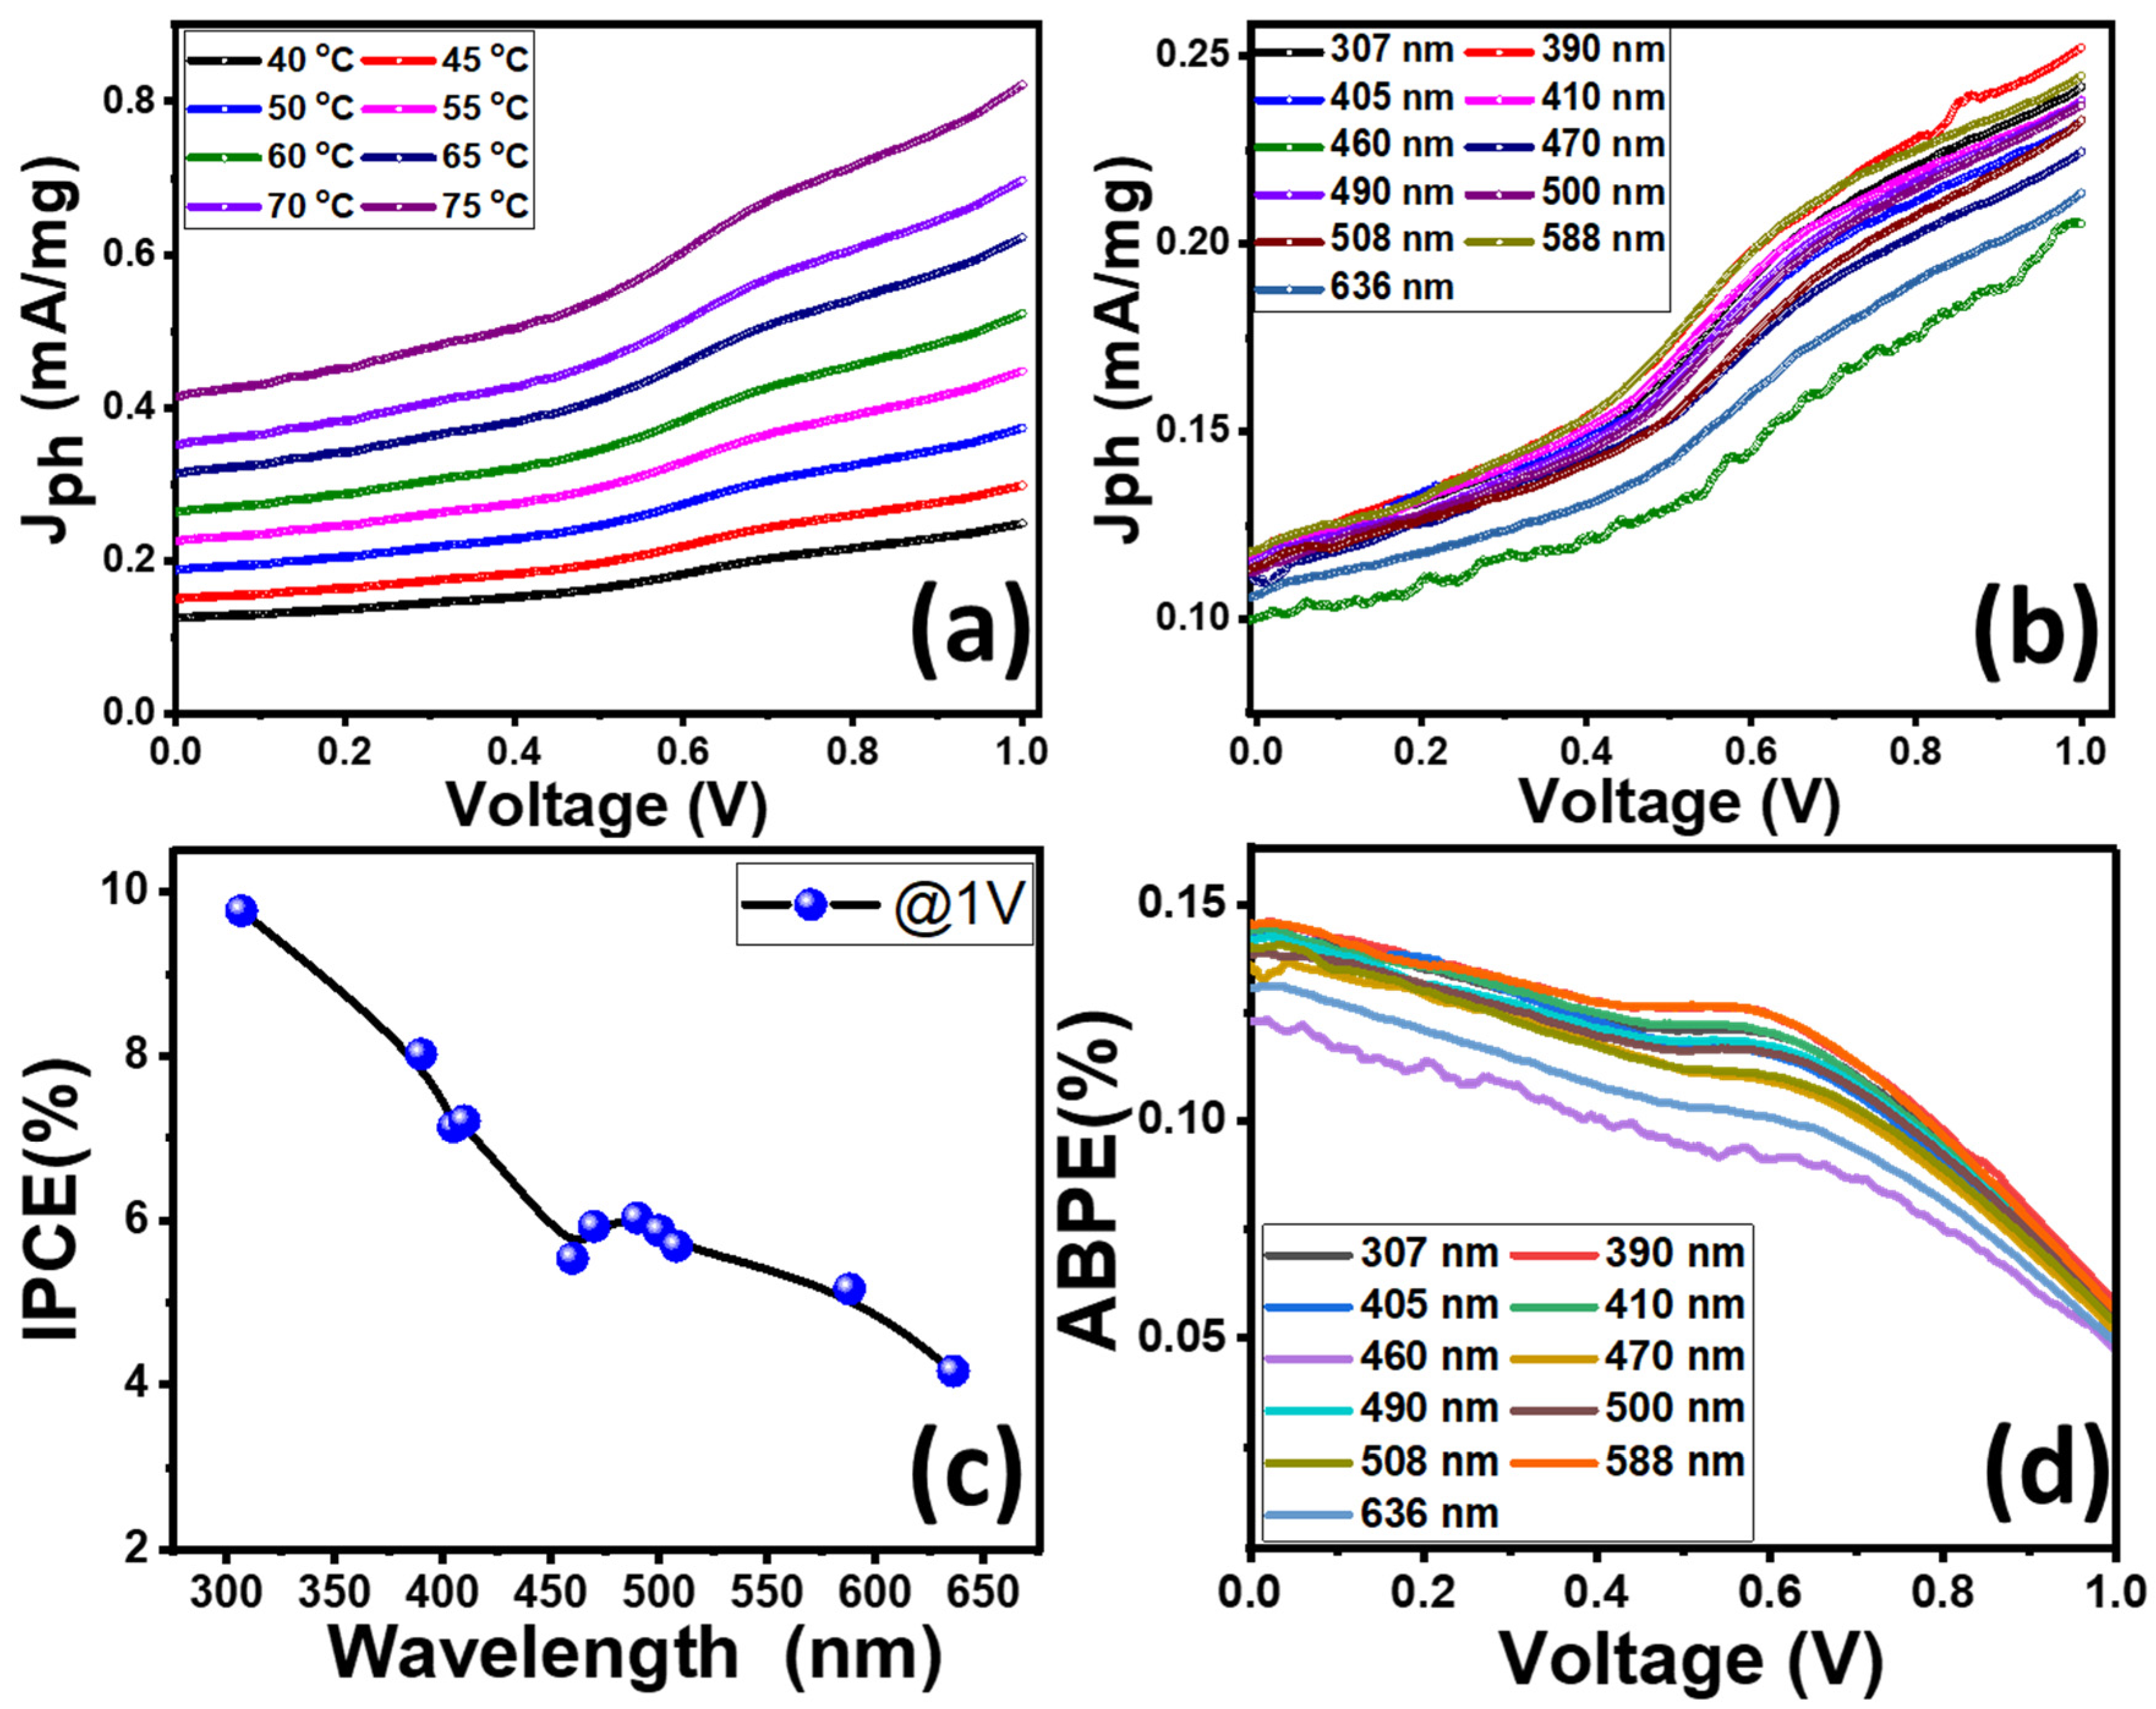
3.5. Photoelectrochemical (PEC) Performance of the Samples
4. Conclusions
Supplementary Materials
Author Contributions
Funding
Institutional Review Board Statement
Informed Consent Statement
Data Availability Statement
Acknowledgments
Conflicts of Interest
References
- Abbasi, T.; Abbasi, S. Decarbonization of fossil fuels as a strategy to control global warming. Renew. Sustain. Energy Rev. 2011, 15, 1828–1834. [Google Scholar] [CrossRef]
- Omri, A.; Nguyen, D.K. On the determinants of renewable energy consumption: International evidence. Energy 2014, 72, 554–560. [Google Scholar] [CrossRef]
- Zuo, Y.; Liu, Y.P.; Li, J.S.; Du, R.F.; Han, X.; Zhang, T.; Arbiol, J.; Divins, N.J.; Llorca, J.; Guijarro, N.; et al. In situ electrochemical oxidation of Cu2S into CuO nanowires as a durable and efficient electrocatalyst for oxygen evolution reaction. Chem. Mater. 2019, 31, 7732–7743. [Google Scholar] [CrossRef]
- Li, D.; Shi, J.Y.; Li, C. Transition-metal-based electrocatalysts as cocatalysts for photoelectrochemical water splitting: A mini re-view. Small 2018, 14, 1704179. [Google Scholar] [CrossRef]
- Luo, J.; Steier, L.; Son, M.-K.; Schreier, M.; Mayer, M.T.; Grätzel, M. Cu2O nanowire photocathodes for efficient and durable solar water splitting. Nano Lett. 2016, 16, 1848–1857. [Google Scholar] [CrossRef]
- Berglund, S.P.; Abdi, F.F.; Bogdanoff, P.; Chemseddine, A.; Friedrich, D.; van de Krol, R. Comprehensive evaluation of CuBi2O4 as a photocathode material for photoelectrochemical water splitting. Chem. Mater. 2016, 28, 4231–4242. [Google Scholar] [CrossRef]
- Li, J.; Yan, M.; Zhou, X.; Huang, Z.Q.; Xia, Z.; Chang, C.R.; Ma, Y.; Qu, Y. Mechanistic insights on ternary Ni2_xCoxP for hydrogen evolution and their hybrids with graphene as highly efficient and robust catalysts for overall water splitting. Adv. Funct. Mater. 2016, 26, 6785–6796. [Google Scholar] [CrossRef]
- Zhou, H.; Yufeng, H.; Huang, Y.; Sun, J.; Zhu, Z.; Nielsen, R.J.; He, R.; Bao, J.; Iii, W.A.G.; Chen, S.; et al. Efficient hydrogen evolution by ternary molybdenum sulfoselenide particles on self-standing porous nickel diselenide foam. Nat. Commun. 2016, 7, 12765. [Google Scholar] [CrossRef]
- de Brito, J.F.; Tavella, F.; Genovese, C.; Ampelli, C.; Zanoni MV, B.; Centi, G.; Perathoner, S. Role of CuO in the modification of the photocatalytic water splitting behavior of TiO2 nanotube thin films. Appl. Catal. B Environ. 2018, 224, 136–145. [Google Scholar] [CrossRef]
- Shaban, M.; Rabia, M.; El-Sayed, A.M.A.; Ahmed, A.; Sayed, S. Photocatalytic properties of PbS/graphene oxide/polyaniline electrode for hydrogen generation. Sci. Rep. 2017, 7, 14100. [Google Scholar] [CrossRef]
- Fujishima, A.; Honda, K. Electrochemical photolysis of water at a semiconductor electrode. Nature 1972, 238, 37–38. [Google Scholar] [CrossRef] [PubMed]
- Chang, Y.H.; Lin, C.T.; Chen, T.Y.; Hsu, C.L.; Lee, Y.H.; Zhang, W.; Wei, K.H.; Li, L.J. Highly efficient electrocatalytic hydrogen production by MoSx grown on graphene-protected 3D Ni foams. Adv. Mater. 2013, 25, 756–760. [Google Scholar] [CrossRef] [PubMed]
- Yu, P.; Wang, F.; Shifa, T.A.; Zhan, X.; Lou, X.; Xia, F.; He, J. Earth abundant materials beyond transition metal dichalcogenides: A focus on electrocatalyzing hydrogen evolution reaction. Nano Energy 2019, 58, 244–276. [Google Scholar] [CrossRef]
- Qarechalloo, S.; Naseri, N.; Salehi, F.; Moshfegh, A.Z. Simply tuned and sustainable cobalt oxide decorated titania nanotubes for photoelectrochemical water splitting. Appl. Surf. Sci. 2019, 464, 68–77. [Google Scholar] [CrossRef]
- Chakraborty, D.; Shyamal, S.; Bhaumik, A. A New Porous Ni-W Mixed Metal Phosphonate Open Framework Material for Efficient Photoelectrochemical OER. ChemCatChem 2020, 12, 1504–1511. [Google Scholar] [CrossRef]
- Yan, D.; Fu, X.; Shang, Z.; Liu, J.; Luo, H.A. A BiVO4 film photoanode with re-annealing treatment and 2D thin Ti3C2TX flakes decoration for enhanced photoelectrochemical water oxidation. Chem. Eng. J. 2019, 361, 853–861. [Google Scholar] [CrossRef]
- Turner, J.A. Sustainable hydrogen production. Science 2004, 305, 972–974. [Google Scholar] [CrossRef]
- Tan, L.; Yang, N.; Huang, X.; Peng, L.; Tong, C.; Deng, M.; Tang, X.; Li, L.; Liao, Q.; Wei, Z. Synthesis of ammonia via electrochemical nitrogen reduction on high-index faceted Au nanoparticles with a high faradaic efficiency. Chem. Commun. 2019, 55, 14482–14485. [Google Scholar] [CrossRef]
- Jamesh, M.I. Recent progress on earth abundant hydrogen evolution reaction and oxygen evolution reaction bifunctional electrocatalyst for overall water splitting in alkaline media. J. Power Source 2016, 333, 213–236. [Google Scholar] [CrossRef]
- Wang, W.; Chen, M.; Huang, D.; Zeng, G.; Zhang, C.; Lai, C.; Zhou, C.; Yang, Y.; Cheng, M.; Hu, L.; et al. An overview on nitride and nitrogen-doped photocatalysts for energy and environmental applications. Compos. Part B Eng. 2019, 172, 704–723. [Google Scholar] [CrossRef]
- Luo, J.; Zhang, S.; Sun, M.; Yang, L.; Luo, S.; Crittenden, J.C. A Critical Review on Energy Conversion and Environmental Remediation of Photocatalysts with Remodeling Crystal Lattice, Surface, and Interface. ACS Nano 2019, 13, 9811–9840. [Google Scholar] [CrossRef] [PubMed]
- Chiu, Y.-H.; Lai, T.-H.; Kuo, M.-Y.; Hsieh, P.-Y.; Hsu, Y.-J. Photoelectrochemical cells for solar hydrogen production: Challenges and opportunities. APL Mater. 2019, 7, 080901. [Google Scholar] [CrossRef]
- Peerakiatkhajohn, P.; Yun, J.-H.; Wang, S.; Wang, L. Review of recent progress in unassisted photoelectrochemical water splitting: From material modification to configuration design. J. Photon. Energy 2016, 7, 012006. [Google Scholar] [CrossRef]
- Zou, Z.; Ye, J.; Sayama, K.; Arakawa, H. Direct splitting of water under visible light irradiation with an oxide semiconductor photocatalyst. Nature 2001, 414, 625–627. [Google Scholar] [CrossRef]
- Hassan, M.A.; Johar, M.A.; Waseem, A.; Bagal, I.V.; Ha, J.-S.; Ryu, S.-W. Type-II ZnO/ZnS core-shell nanowires: Earth-abundant photoanode for solar-driven photoelectrochemical water splitting. Opt. Express 2019, 27, A184–A196. [Google Scholar] [CrossRef]
- Bonomo, M.; Naponiello, G.; Venditti, I.; Zardetto, V.; Di Carlo, A.; Dini, D. Electrochemical and Photoelectrochemical Properties of Screen-Printed Nickel Oxide Thin Films Obtained from Precursor Pastes with Different Compositions. J. Electrochem. Soc. 2017, 164, H137–H147. [Google Scholar] [CrossRef]
- Ali, H.; Brahimi, R.; Outemzabet, R.; Bellal, B.; Trari, M. Comparative analysis of structural and photoelectrochemical properties of pure and Sb doped SnO2 functional electrode. Thin Solid Films 2018, 649, 225–231. [Google Scholar] [CrossRef]
- Govatsi, K.; Seferlis, A.; Yannopoulos, S.N.; Neophytides, S.G. The photo-electrokinetics of the O2 evolution reaction on ZnO nanorods. Electrochim. Acta 2019, 298, 587–598. [Google Scholar] [CrossRef]
- Barakat, N.A.; Erfan, N.A.; Mohammed, A.A.; Mohamed, S.E. Ag-decorated TiO2 nanofibers as Arrhenius equation-incompatible and effective photocatalyst for water splitting under visible light irradiation. Colloids Surf. A Physicochem. Eng. Asp. 2020, 604, 125307. [Google Scholar] [CrossRef]
- Ng, J.; Xu, S.; Zhang, X.; Yang, H.Y.; Sun, D.D. Hybridized Nanowires and Cubes: A Novel Architecture of a Heterojunctioned TiO2/SrTiO3 Thin Film for Efficient Water Splitting. Adv. Funct. Mater. 2010, 20, 4287–4294. [Google Scholar] [CrossRef]
- Ma, X.-X.; Chen, L.; Zhang, Z.; Tang, J.-L. Electrochemical Performance Evaluation of CuO@Cu2O Nanowires Array on Cu Foam as Bifunctional Electrocatalyst for Efficient Water Splitting. Chin. J. Anal. Chem. 2020, 48, e20001–e20012. [Google Scholar] [CrossRef]
- Vidyarthi, V.S.; Hofmann, M.; Savan, A.; Sliozberg, K.; König, D.; Beranek, R.; Schuhmann, W.; Ludwig, A. Enhanced photoelectrochemical properties of WO3 thin films fabricated by reactive magnetron sputtering. Int. J. Hydrogen Energy 2011, 36, 4724–4731. [Google Scholar] [CrossRef]
- Rahman, G.; Najaf, Z.; Shah, A.U.H.A.; Mian, S.A. Investigation of the structural, optical, and photoelectrochemical properties of α-Fe2O3 nanorods synthesized via a facile chemical bath deposition. Optik 2020, 200, 163454. [Google Scholar] [CrossRef]
- Luo, H.; Mueller, A.H.; Mccleskey, T.; Burrell, A.K.; Bauer, A.E.; Jia, Q. Structural and Photoelectrochemical Properties of BiVO4 Thin Films. J. Phys. Chem. C 2008, 112, 6099–6102. [Google Scholar] [CrossRef]
- Takahara, Y.; Kondo, J.; Takata, T.; Lu, A.D.; Domen, K. Mesoporous Tantalum Oxide. Characterization and Photocatalytic Activity for the Overall Water Decomposition. Chem. Mater. 2001, 13, 1194–1199. [Google Scholar] [CrossRef]
- Cook, T.R.; Dogutan, D.K.; Reece, S.Y.; Surendranath, Y.; Teets, T.S.; Nocera, D.G. Solar Energy Supply and Storage for the Legacy and Nonlegacy Worlds. Chem. Rev. 2010, 110, 6474–6502. [Google Scholar] [CrossRef]
- Gao, M.-R.; Liang, J.-X.; Zheng, Y.-R.; Xu, Y.-F.; Jiang, J.; Gao, Q.; Li, J.; Yu, S.-H. An efficient molybdenum disulfide/cobalt diselenide hybrid catalyst for electrochemical hydrogen generation. Nat. Commun. 2015, 6, 5982. [Google Scholar] [CrossRef]
- Esposito, D.V.; Hunt, S.T.; Stottlemyer, A.L.; Dobson, K.D.; McCandless, B.E.; Birkmire, R.W.; Chen, J.G. Low-cost hydrogen-evolution catalysts based on monolayer platinum on tungsten monocarbide substrates. Angew. Chem. Int. Ed. Engl. 2010, 49, 9859–9862. [Google Scholar] [CrossRef]
- Sheng, W.; Myint, M.; Chen, J.G.; Yan, Y. Correlating the hydrogen evolution reaction activity in alkaline electrolytes with the hydrogen binding energy on monometallic surfaces. Energy Environ. Sci. 2013, 6, 1509–1512. [Google Scholar] [CrossRef]
- Cao, Z.; Chen, Q.; Zhang, J.; Li, H.; Jiang, Y.; Shen, S.; Fu, G.; Lu, B.-A.; Xie, Z.; Zheng, L. Platinum-nickel alloy excavated nano-multipods with hexagonal close-packed structure and superior activity towards hydrogen evolution reaction. Nat. Commun. 2017, 8, 15131. [Google Scholar] [CrossRef]
- Gong, M.; Zhou, W.; Tsai, M.-C.; Zhou, J.; Guan, M.; Lin, M.-C.; Zhang, B.; Hu, Y.; Wang, D.-Y.; Yang, J.; et al. Nanoscale nickel oxide/nickel heterostructures for active hydrogen evolution electrocatalysis. Nat. Commun. 2014, 5, 4695. [Google Scholar] [CrossRef] [PubMed]
- Faber, M.S.; Dziedzic, R.; Lukowski, M.A.; Kaiser, N.S.; Ding, Q.; Jin, S. High-Performance Electrocatalysis Using Metallic Cobalt Pyrite (CoS2) Micro- and Nanostructures. J. Am. Chem. Soc. 2014, 136, 10053–10061. [Google Scholar] [CrossRef] [PubMed]
- Basu, M.; Nazir, R.; Fageria, P.; Pande, S. Construction of CuS/Au heterostructure through a simple photoreduction route for enhanced electrochemical hydrogen evolution and photocatalysis. Sci. Rep. 2016, 6, 34738. [Google Scholar] [CrossRef] [PubMed]
- Yin, J.; Jin, J.; Lin, H.; Yin, Z.; Li, J.; Lu, M.; Guo, L.; Xi, P.; Tang, Y.; Yan, C. Optimized metal chalcogenides for boosting water splitting. Adv. Sci. 2020, 7, 1903070. [Google Scholar] [CrossRef]
- Jasion, D.; Barforoush, J.M.; Qiao, Q.; Zhu, Y.; Ren, S.; Leonard, K.C. Low-dimensional hyperthin FeS2 nanostructures for efficient and stable hydrogen evolution electrocatalysis. ACS Catal. 2015, 5, 6653–6657. [Google Scholar] [CrossRef]
- Long, X.; Li, G.; Wang, Z.; Zhu, H.; Zhang, T.; Xiao, S.; Guo, W.; Yang, S. Metallic iron–nickel sulfide ultrathin nanosheets as a highly active electrocatalyst for hydrogen evolution reaction in acidic media. J. Am. Chem. Soc. 2015, 137, 11900–11903. [Google Scholar] [CrossRef] [PubMed]
- Faber, M.S.; Lukowski, M.A.; Ding, Q.; Kaiser, N.S.; Jin, S. Earth-abundant metal pyrites (FeS2, CoS2, NiS2, and Their Alloys) for highly efficient hydrogen evolution and polysulfide reduction electrocatalysis. J. Phys. Chem. C 2014, 118, 21347–21356. [Google Scholar] [CrossRef]
- Zhang, H.; Yang, B.; Wu, X.; Li, Z.; Lei, L.; Zhang, X. Polymorphic CoSe2 with mixed orthorhombic and cubic phases for highly efficient hydrogen evolution reaction. ACS Appl. Mater. Interfaces 2015, 7, 1772–1779. [Google Scholar] [CrossRef]
- Dubale, A.A.; Tamirat, A.G.; Chen, H.-M.; Berhe, T.A.; Pan, C.-J.; Su, W.-N.; Hwang, B.-J. A highly stable CuS and CuS–Pt modified Cu2O/CuO heterostructure as an efficient photocathode for the hydrogen evolution reaction. J. Mater. Chem. A 2016, 4, 2205–2216. [Google Scholar] [CrossRef]
- Ambrosi, A.; Sofer, Z.; Pumera, M. 2H→ 1T phase transition and hydrogen evolution activity of MoS2, MoSe2, WS2 and WSe2 strongly depends on the MX2 composition. Chem. Commun. 2015, 51, 8450–8453. [Google Scholar] [CrossRef]
- Moriya, M.; Minegishi, T.; Kumagai, H.; Katayama, M.; Kubota, J.; Domen, K. Stable hydrogen evolution from CdS-modified CuGaSe2 photoelectrode under visible-light irradiation. J. Am. Chem. Soc. 2013, 135, 3733–3735. [Google Scholar] [CrossRef] [PubMed]
- Amir, N.; Roslan, M.; Ahmad, F. Fire resistance of glass wool and rockwool hybrid fibre reinforced intumescent coating. J. Adv. Res. Mater. Sci. 2015, 12, 24–32. [Google Scholar]
- Müller, A.; Leydolph, B.; Stanelle, K. Recycling mineral wool waste: Technologies for the conversion of the fiber structure, Part 1. Interceram 2009, 58, 378–381. [Google Scholar]
- Wakili, K.G.; Binder, B.; Zimmermann, M.; Tanner, C. Efficiency verification of a combination of high performance and conventional insulation layers in retrofitting a 130-year old building. Energy Build. 2014, 82, 237–242. [Google Scholar] [CrossRef]
- Siligardi, C.; Miselli, P.; Francia, E.; Gualtieri, M.L. Temperature-induced microstructural changes of fiber-reinforced silica aerogel (FRAB) and rock wool thermal insulation materials: A comparative study. Energy Build. 2017, 138, 80–87. [Google Scholar] [CrossRef]
- Miskinis, K.; Dikavicius, V.; Buska, A.; Banionis, K. Influence of EPS, mineral wool and plaster layers on sound and thermal insulation of a wall: A case study. Appl. Acoust. 2018, 137, 62–68. [Google Scholar] [CrossRef]
- Campopiano, A.; Cannizzaro, A.; Angelosanto, F.; Astolfi, M.L.; Ramires, D.; Olori, A.; Canepari, S.; Iavicoli, S. Dissolution of glass wool, rock wool and alkaline earth silicate wool: Morphological and chemical changes in fibers. Regul. Toxicol. Pharmacol. 2014, 70, 393–406. [Google Scholar] [CrossRef]
- Bahrami, A.; Nematzadeh, M. Effect of rock wool waste on compressive behavior of pumice lightweight aggregate concrete after elevated temperature exposure. Fire Technol. 2021, 57, 1425–1456. [Google Scholar] [CrossRef]
- Stonys, R.; Kuznetsov, D.; Krasnikovs, A.; Škamat, J.; Baltakys, K.; Antonovič, V.; Černašėjus, O. Reuse of ultrafine mineral wool production waste in the manufacture of refractory concrete. J. Environ. Manag. 2016, 176, 149–156. [Google Scholar] [CrossRef]
- Jelle, B.P. Traditional, state-of-the-art and future thermal building insulation materials and solutions—Properties, requirements and possibilities. Energy Build. 2011, 43, 2549–2563. [Google Scholar] [CrossRef]
- Ahmed, M.; Tawfik, W.Z.; Elfayoumi, M.; Abdel-Hafiez, M.; El-Dek, S. Tailoring the optical and physical properties of La doped ZnO nanostructured thin films. J. Alloys Compd. 2019, 791, 586–592. [Google Scholar] [CrossRef]
- Ahmed, A.M.; Rabia, M.; Shaban, M. The structure and photoelectrochemical activity of Cr-doped PbS thin films grown by chemical bath deposition. RSC Adv. 2020, 10, 14458–14470. [Google Scholar] [CrossRef] [PubMed]
- Ahmed, A.M.; Abdalla, E.M.; Shaban, M. Simple and Low-Cost Synthesis of Ba-Doped CuO Thin Films for Highly Efficient Solar Generation of Hydrogen. J. Phys. Chem. C 2020, 124, 22347–22356. [Google Scholar] [CrossRef]
- Shaban, M.; Abdelkarem, K.; El Sayed, A.M. Structural, optical and gas sensing properties of Cu2O/CuO mixed phase: Effect of the number of coated layers and (Cr + S) co-Doping. Phase Transit. 2019, 92, 347–359. [Google Scholar] [CrossRef]
- Mohamed, H.S.; Soliman, N.; Moustafa, A.; Abdel-Gawad, O.F.; Taha, R.R.; Ahmed, S.A. Nano metal oxide impregnated Chitosan-4-nitroacetophenone for industrial dye removal. Int. J. Environ. Anal. Chem. 2019, 101, 1850–1877. [Google Scholar] [CrossRef]
- Zaki, S.E.; Basyooni, M.A.; Shaban, M.; Rabia, M.; Eker, Y.R.; Attia, G.F.; Yilmaz, M.; Ahmed, A.M. Role of oxygen vacancies in vanadium oxide and oxygen functional groups in graphene oxide for room temperature CO2 gas sensors. Sens. Actuators A Phys. 2019, 294, 17–24. [Google Scholar] [CrossRef]
- Ahmed, A.M.; Mohamedab, F.; Ashrafab, A.M.; Shabana, M.; Khan, A.A.P.; Asiri, A.M. Enhanced photoelectrochemical water splitting activity of carbon nanotubes@TiO2 nanoribbons in different electrolytes. Chemosphere 2020, 238, 124554. [Google Scholar] [CrossRef]
- Zhou, L.; Li, R.; Zhang, G.; Wang, D.; Cai, D.; Wu, Z. Zero-valent iron nanoparticles supported by functionalized waste rock wool for efficient removal of hexavalent chromium. Chem. Eng. J. 2018, 339, 85–96. [Google Scholar] [CrossRef]
- Xie, S.; Yang, Y.; Hou, G.; Wang, J.; Ji, Z. Development of layer structured wave absorbing mineral wool boards for indoor electromagnetic radiation protection. J. Build. Eng. 2016, 5, 79–85. [Google Scholar] [CrossRef]
- Lemougna, P.N.; Yliniemi, J.; Adediran, A.; Luukkonen, T.; Tanskanen, P.; Finnilä, M.; Illikainen, M. Synthesis and characterization of porous ceramics from spodumene tailings and waste glass wool. Ceram. Int. 2021, 47, 33286–33297. [Google Scholar] [CrossRef]
- Al-Atia, M.H.J.; Saeed, H.K.; Fliayh, A.R.; Addie, A.J. Investigating the effects of calcination temperatures on the structure of modified nanosilica prepared by sol–gel. Colloids Surf. A Physicochem. Eng. Asp. 2017, 520, 590–596. [Google Scholar] [CrossRef]
- Fang, Z.Z.; Wang, H.; Kumar, V. Coarsening, densification, and grain growth during sintering of nano-sized powders—A perspective. Int. J. Refract. Met. Hard Mater. 2017, 62, 110–117. [Google Scholar] [CrossRef]
- Mostafaei, A.; De Vecchis, P.R.; Nettleship, I.; Chmielus, M. Effect of powder size distribution on densification and microstructural evolution of binder-jet 3D-printed alloy. Mater. Des. 2019, 162, 375–383. [Google Scholar] [CrossRef]
- Shaban, M.; Zayed, M.; Hamdy, H. Nanostructured ZnO thin films for self-Cleaning applications. RSC Adv. 2017, 7, 617–631. [Google Scholar] [CrossRef]
- Khmissi, H.; El Sayed, A.M.; Shaban, M. Structural, morphological, optical properties and wettability of spin-coated copper oxide; influences of film thickness, Ni, and (La, Ni) co-doping. J. Mater. Sci. 2016, 51, 5924–5938. [Google Scholar] [CrossRef]
- El Sayed, A.; Shaban, M. Structural, optical and photocatalytic properties of Fe and (Co, Fe) co-doped copper oxide spin coated films. Spectrochim. Acta Part A Mol. Biomol. Spectrosc. 2015, 149, 638–646. [Google Scholar] [CrossRef] [PubMed]
- El Sayed, A.M.; Ibrahim, A. Structural and optical characterizations of spin coated cobalt-doped cadmium oxide nanostructured thin films. Mater. Sci. Semicond. Process. 2014, 26, 320–328. [Google Scholar] [CrossRef]
- Shaban, M.; Mustafa, M.; El Sayed, A.M. Structural, optical, and photocatalytic properties of the spray deposited nanoporous CdS thin films; influence of copper doping, annealing, and deposition parameters. Mater. Sci. Semicond. Process. 2016, 56, 329–343. [Google Scholar] [CrossRef]
- Aïnouche, L.; Hamadou, L.; Kadri, A.; Benbrahim, N.; Bradai, D. Ti3+ states induced band gap reduction and enhanced visible light absorption of TiO2 nanotube arrays: Effect of the surface solid fraction factor. Sol. Energy Mater. Sol. Cells 2016, 151, 179–190. [Google Scholar] [CrossRef]
- Rao, L.S.; Rao, T.V.; Naheed, S.; Rao, P.V. Structural and optical properties of zinc magnesium oxide nanoparticles synthesized by chemical co-precipitation. Mater. Chem. Phys. 2018, 203, 133–140. [Google Scholar] [CrossRef]
- Bhushan, M.; Jha, R.; Bhardwaj, R. Reduced band gap and diffusion controlled spherical n-type ZnS nanoparticles for absorption of UV-Vis region of solar spectrum. J. Phys. Chem. Solids 2019, 135, 109021. [Google Scholar] [CrossRef]
- Ping, T.; Mihua, S.; Chengwen, S.; Shuaihua, W.; Murong, C. Enhanced Photocatalytic Activity of Cu2O/Cu Heterogeneous Nanoparticles Synthesized in Aqueous Colloidal Solutions on Degradation of Methyl Orange. Rare Met. Mater. Eng. 2016, 45, 2214–2218. [Google Scholar] [CrossRef][Green Version]
- Xu, L.; Zhou, Y.; Wu, Z.; Zheng, G.; He, J.; Zhou, Y. Improved photocatalytic activity of nanocrystalline ZnO by coupling with CuO. J. Phys. Chem. Solids 2017, 106, 29–36. [Google Scholar] [CrossRef]
- Chen, D.; Zhang, H.; Hu, S.; Li, J. Preparation and Enhanced Photoelectrochemical Performance of Coupled Bicomponent ZnO−TiO2 Nanocomposites. J. Phys. Chem. C 2008, 112, 117–122. [Google Scholar] [CrossRef]
- Sambandam, B.; Michael, R.J.V.; Manoharan, P.T. Oxygen vacancies and intense luminescence in manganese loaded Zno microflowers for visible light water splitting. Nanoscale 2015, 7, 13935–13942. [Google Scholar] [CrossRef]
- Ojha, G.P.; Muthurasu, A.; Tiwari, A.P.; Pant, B.; Chhetri, K.; Mukhiya, T.; Dahal, B.; Lee, M.; Park, M.; Kim, H.-Y. Vapor solid phase grown hierarchical CuxO NWs integrated MOFs-derived CoS2 electrode for high-performance asymmetric supercapacitors and the oxygen evolution reaction. Chem. Eng. J. 2020, 399, 125532. [Google Scholar] [CrossRef]
- Mishra, P.; Stockmal, K.; Ardito, G.; Tao, M.; Van Dessel, S.; Granados-Focil, S. Thermo-optically responsive phase change materials for passive temperature regulation. Sol. Energy 2020, 197, 222–228. [Google Scholar] [CrossRef]
- Fang, N.; Ding, Y.; Liu, C.; Chen, Z. Effect of crystalline/amorphous structure on light absorption and carrier separationof CeO2-TiO2 heterojunctions. Appl. Surf. Sci. 2018, 452, 49–57. [Google Scholar] [CrossRef]
- Luo, Z.; Li, C.; Liu, S.; Wang, T.; Gong, J. Gradient doping of phosphorus in Fe2O3 nanoarray photoanodes for enhanced charge separation. Chem. Sci. 2017, 8, 91–100. [Google Scholar] [CrossRef]
- Jafari, T.; Moharreri, E.; Amin, A.S.; Miao, R.; Song, W.; Suib, S.L. Photocatalytic water splitting—The untamed dream: A review. Recent Adv. Mol. 2016, 21, 900. [Google Scholar]
- Du, L.; Shi, G.; Zhao, Y.; Chen, X.; Sun, H.; Liu, F.; Cheng, F.; Xie, W. Plasmon-promoted electrocatalytic water splitting on metal–semiconductor nanocomposites: The interfacial charge transfer and the real catalytic sites. Chem. Sci. 2019, 10, 9605–9612. [Google Scholar] [CrossRef] [PubMed]
- Zayed, M.; Nasser, N.; Shaban, M.; Alshaikh, H.; Hamdy, H.; Ahmed, A.M. Effect of Morphology and Plasmonic on Au/ZnO Films for Efficient Photoelectrochemical Water Splitting. Nanomaterials 2021, 11, 2338. [Google Scholar] [CrossRef] [PubMed]
- Mohamed, F.; Rabia, M.; Shaban, M. Synthesis and characterization of biogenic iron oxides of different nanomorphologies from pomegranate peels for efficient solar hydrogen production. J. Mater. Res. Technol. 2020, 9, 4255–4271. [Google Scholar] [CrossRef]
- Shi, M.; Hu, N.; Liu, H.; Qian, C.; Lv, C.; Wang, S. Controlled synthesis of Pt-loaded yolk-shell TiO2@SiO2 nanoreactors as effective photocatalysts for hydrogen generation. Front. Mater. Sci. 2022, 16, 220591. [Google Scholar] [CrossRef]
- Irfan, M.; Shukrullah, S.; Naz, M.Y.; Ahmad, I.; Shoukat, B.; Legutko, S.; Petrů, J.; Rahman, S.; Alsaiari, M.A. Si/SiO2/Al2O3 Supported Growth of CNT Forest for the Production of La/ZnO/CNT Photocatalyst for Hydrogen Production. Materials 2022, 15, 3226. [Google Scholar] [CrossRef]
- Ahmad, I.; Shukrullah, S.; Naz, M.Y.; Ahmed, E.; Ahmad, M.; Akhtar, M.S.; Ullah, S.; Farooq, M.U.; Iqbal, S.; Assiri, M.A.; et al. Microwave-assisted one-pot hydrothermal synthesis of V and La co-doped ZnO/CNTs nanocomposite for boosted photocatalytic hydrogen production. Int. J. Hydrogen Energy 2022, 47, 15505–15515. [Google Scholar] [CrossRef]
- Feng, Y.J.; Wang, Y.; Wang, K.W.; Ma, J.P.; Duan, Y.Y.; Liu, J.; Lu, X.; Zhang, B.; Wang, G.Y.; Zhou, X.Y. Ultra-fine Cu clusters decorated hydrangea-like titanium dioxide for photocatalytic hydrogen production. Rare Metals 2022, 41, 385–395. [Google Scholar] [CrossRef]
- Liao, Y.W.; Yang, J.; Wang, G.H.; Wang, J.; Wang, K.; Yan, S.D. Hierarchical porous NiO as a noble-metal-free cocatalyst for enhanced photocatalytic H2 production of nitrogen-deficient g-C3N4. Rare Metals 2022, 41, 396–405. [Google Scholar] [CrossRef]
- Gunjal, A.R.; Sethi, Y.A.; Kawade, U.V.; Panmand, R.P.; Ugale, C.K.; Ambekar, J.D.; Nagawade, A.V.; Kale, B.B. Unique hierarchical SiO2@ZnIn2S4 marigold flower like nanoheterostructure for solar hydrogen production. RSC Adv. 2021, 11, 14399–14407. [Google Scholar] [CrossRef]
- Ho, W.-K.; Chen, J.-S.; Wu, J.-J. Epitaxial, Energetic, and Morphological Synergy on Photocharge Collection of the Fe2TiO5/ZnO Nanodendrite Heterojunction Array Photoelectrode for Photoelectrochemical Water Oxidation. ACS Sustain. Chem. Eng. 2021, 9, 8868–8878. [Google Scholar] [CrossRef]
- Hadia, N.M.A.; Abdelazeez, A.A.A.; Alzaid, M.; Shaban, M.; Mohamed, S.H.; Hoex, B.; Hajjiah, A.; Rabia, M. Converting Sewage Water into H2 Fuel Gas Using Cu/CuO Nanoporous Photocatalytic Electrodes. Materials 2022, 15, 1489. [Google Scholar] [CrossRef] [PubMed]
- Abdelazeez, A.A.A.; Hadia, N.M.A.; Mourad, A.-H.I.; Shaban MCherupurakal, N.; Rabia, M. Effect of Au Plasmonic Material on Poly M-Toluidine for Photoelectrochemical Hydrogen Generation from Sewage Water. Polymers 2022, 14, 768. [Google Scholar] [CrossRef] [PubMed]
- Shaban, M.; Almohammedi, A.; Saad, R.; Sayed, A.M.E. Design of SnO2:Ni,Ir Nanoparticulate Photoelectrodes for Efficient Photoelectrochemical Water Splitting. Nanomaterials 2022, 12, 453. [Google Scholar] [CrossRef] [PubMed]
- Hadia, N.M.A.; Khalafalla, M.A.H.; Abdel Salam, F.M.; Ahmed, A.M.; Shaban, M.; Almuqrin, A.H.; Hajjiah, A.; Hanafi, H.A.; Alruqi, M.; Mourad, A.-H.I.; et al. Conversion of Sewage Water into H2 Gas Fuel Using Hexagonal Nanosheets of the Polyaniline-Assisted Deposition of PbI2 as a Nanocomposite Photocathode with the Theoretical Qualitative Ab-Initio Calculation of the H2O Splitting. Polymers 2022, 14, 2148. [Google Scholar] [CrossRef]


| Samples | D (nm) | TC | Eg (eV) | EU (meV) | K | ||
|---|---|---|---|---|---|---|---|
| (hkl) | Value | λ = 287 nm | λ = 500 nm | ||||
| RWMix | 70.1 | (200) | 2.36 | 1.39 | 195.75 | 0.018 | 0.029 |
| RW0.03 | 50.8 | (200) | 1.13 | 3.62 | 213.47 | 0.009 | 0.008 |
| RW0.063 | 34.5 | (200) | 1.07 | 2.08 | 377.69 | 0.02 | 0.019 |
| RW0.3 | 31.7 | (200) | 1.06 | 2.7 | 348.18 | 0.013 | 0.011 |
| RW>0.3 | 50.2 | (021) | 1.17 | 1.55 | 358.72 | 0.025 | 0.03 |
| Photocatalyst | Electrolyte | Light Power | Performance | Ref. |
|---|---|---|---|---|
| Pt-loaded yolk–shell TiO2@SiO2 nanoreactors (50 mg) | 80 mL mixture of methanol (40 mL) and water (40 mL) | 300 mW/cm–2 (Simulated sunlight) | H2 moles = 24.56 mmol·g−1·h−1 | [94] |
| ZnO (5 mg) La/ZnO (5 mg) La/ZnO/CNTs (5 mg) | 80 mL aqueous solution containing 10% of glycerol | 300 W Xe light source | H2 moles = 10.2 mmol/h H2 moles = 145.9 mmol/h H2 moles = 184.8 mmol/h | [95] |
| V and La co-doped ZnO/CNTs nanocomposite (10 mg) | 100 mL water and methanol | 300 W Xe lamp | H2 moles = 267 μmol·h−1·g−1 | [96] |
| Ultra-fine Cu (6 wt%) decorated hydrangea-like TiO2 (20 mg) | 100 mL 10 vol% aqueous solution methanol | 300 W Xe lamp | H2 moles = 3.7 mmol·h−1·g−1 | [97] |
| Hierarchical porous NiO anchored on graphitic carbon nitride with nitrogen vacancies | 10 mL sacrificial reagent triethanolamine and 90 mL H2O | 420-nm (3 W) LED light illumination | H2 moles = 170.60 μmol·g−1·h−1 | [98] |
| Hierarchical e 0.75% SiO2@ZnIn2S4 marigold flower like nano heterostructure (0.5 g) | 700 mL 0.5 M aqueous KOH and purged with Argon for 30 min | - | H2 moles = 6730 μmol/h·g | [99] |
| -Fe2TiO5/ZnO Nanodendrite Heterojunction Array -Co-Pi/Fe2TiO5/ZnO ND heterojunction array | 0.3 M Na2SO4 in K3PO4 buffer solution at pH 7.5 | 500 W xenon lamp | Jph = 1.04 mA cm–2 at 1.23 V vs. RHE Jph = 2.14 mA cm–2 at 1.23 V vs. RHE | [100] |
| Cu/CuO Nanoporous photoelectrode | Sewage water | 400 W Newport Xenon lamp | IPCE = 14.6% Jph = 4.7 mA·cm−2 | [101] |
| Au/Poly M-Toluidine | Na2S2O3 and sewage water | 400 W Newport Xenon lamp | IPCE = 2.3 and 3.6% at 390 nm H2 moles = 8.4 and 33.1 mmol·h−1·cm−2 | [102] |
| SnO2:Ni,Ir Nanoparticulate photoelectrode | 0.5 M HCl | 400 W Newport Xenon lamp | Jph = 46.38 mA/cm2 IPCE% = 17.43% at 307 nm H2 moles = 52.22 mmol·h−1·cm−2 at −1 V | [103] |
| Polyaniline/PbI2 nanocomposite | Sewage water | 400 W Newport Xenon lamp | Jph= 0.077 mA.cm−2 at 390 nm H2 moles = 6 µmole·h−1·cm−1 | [104] |
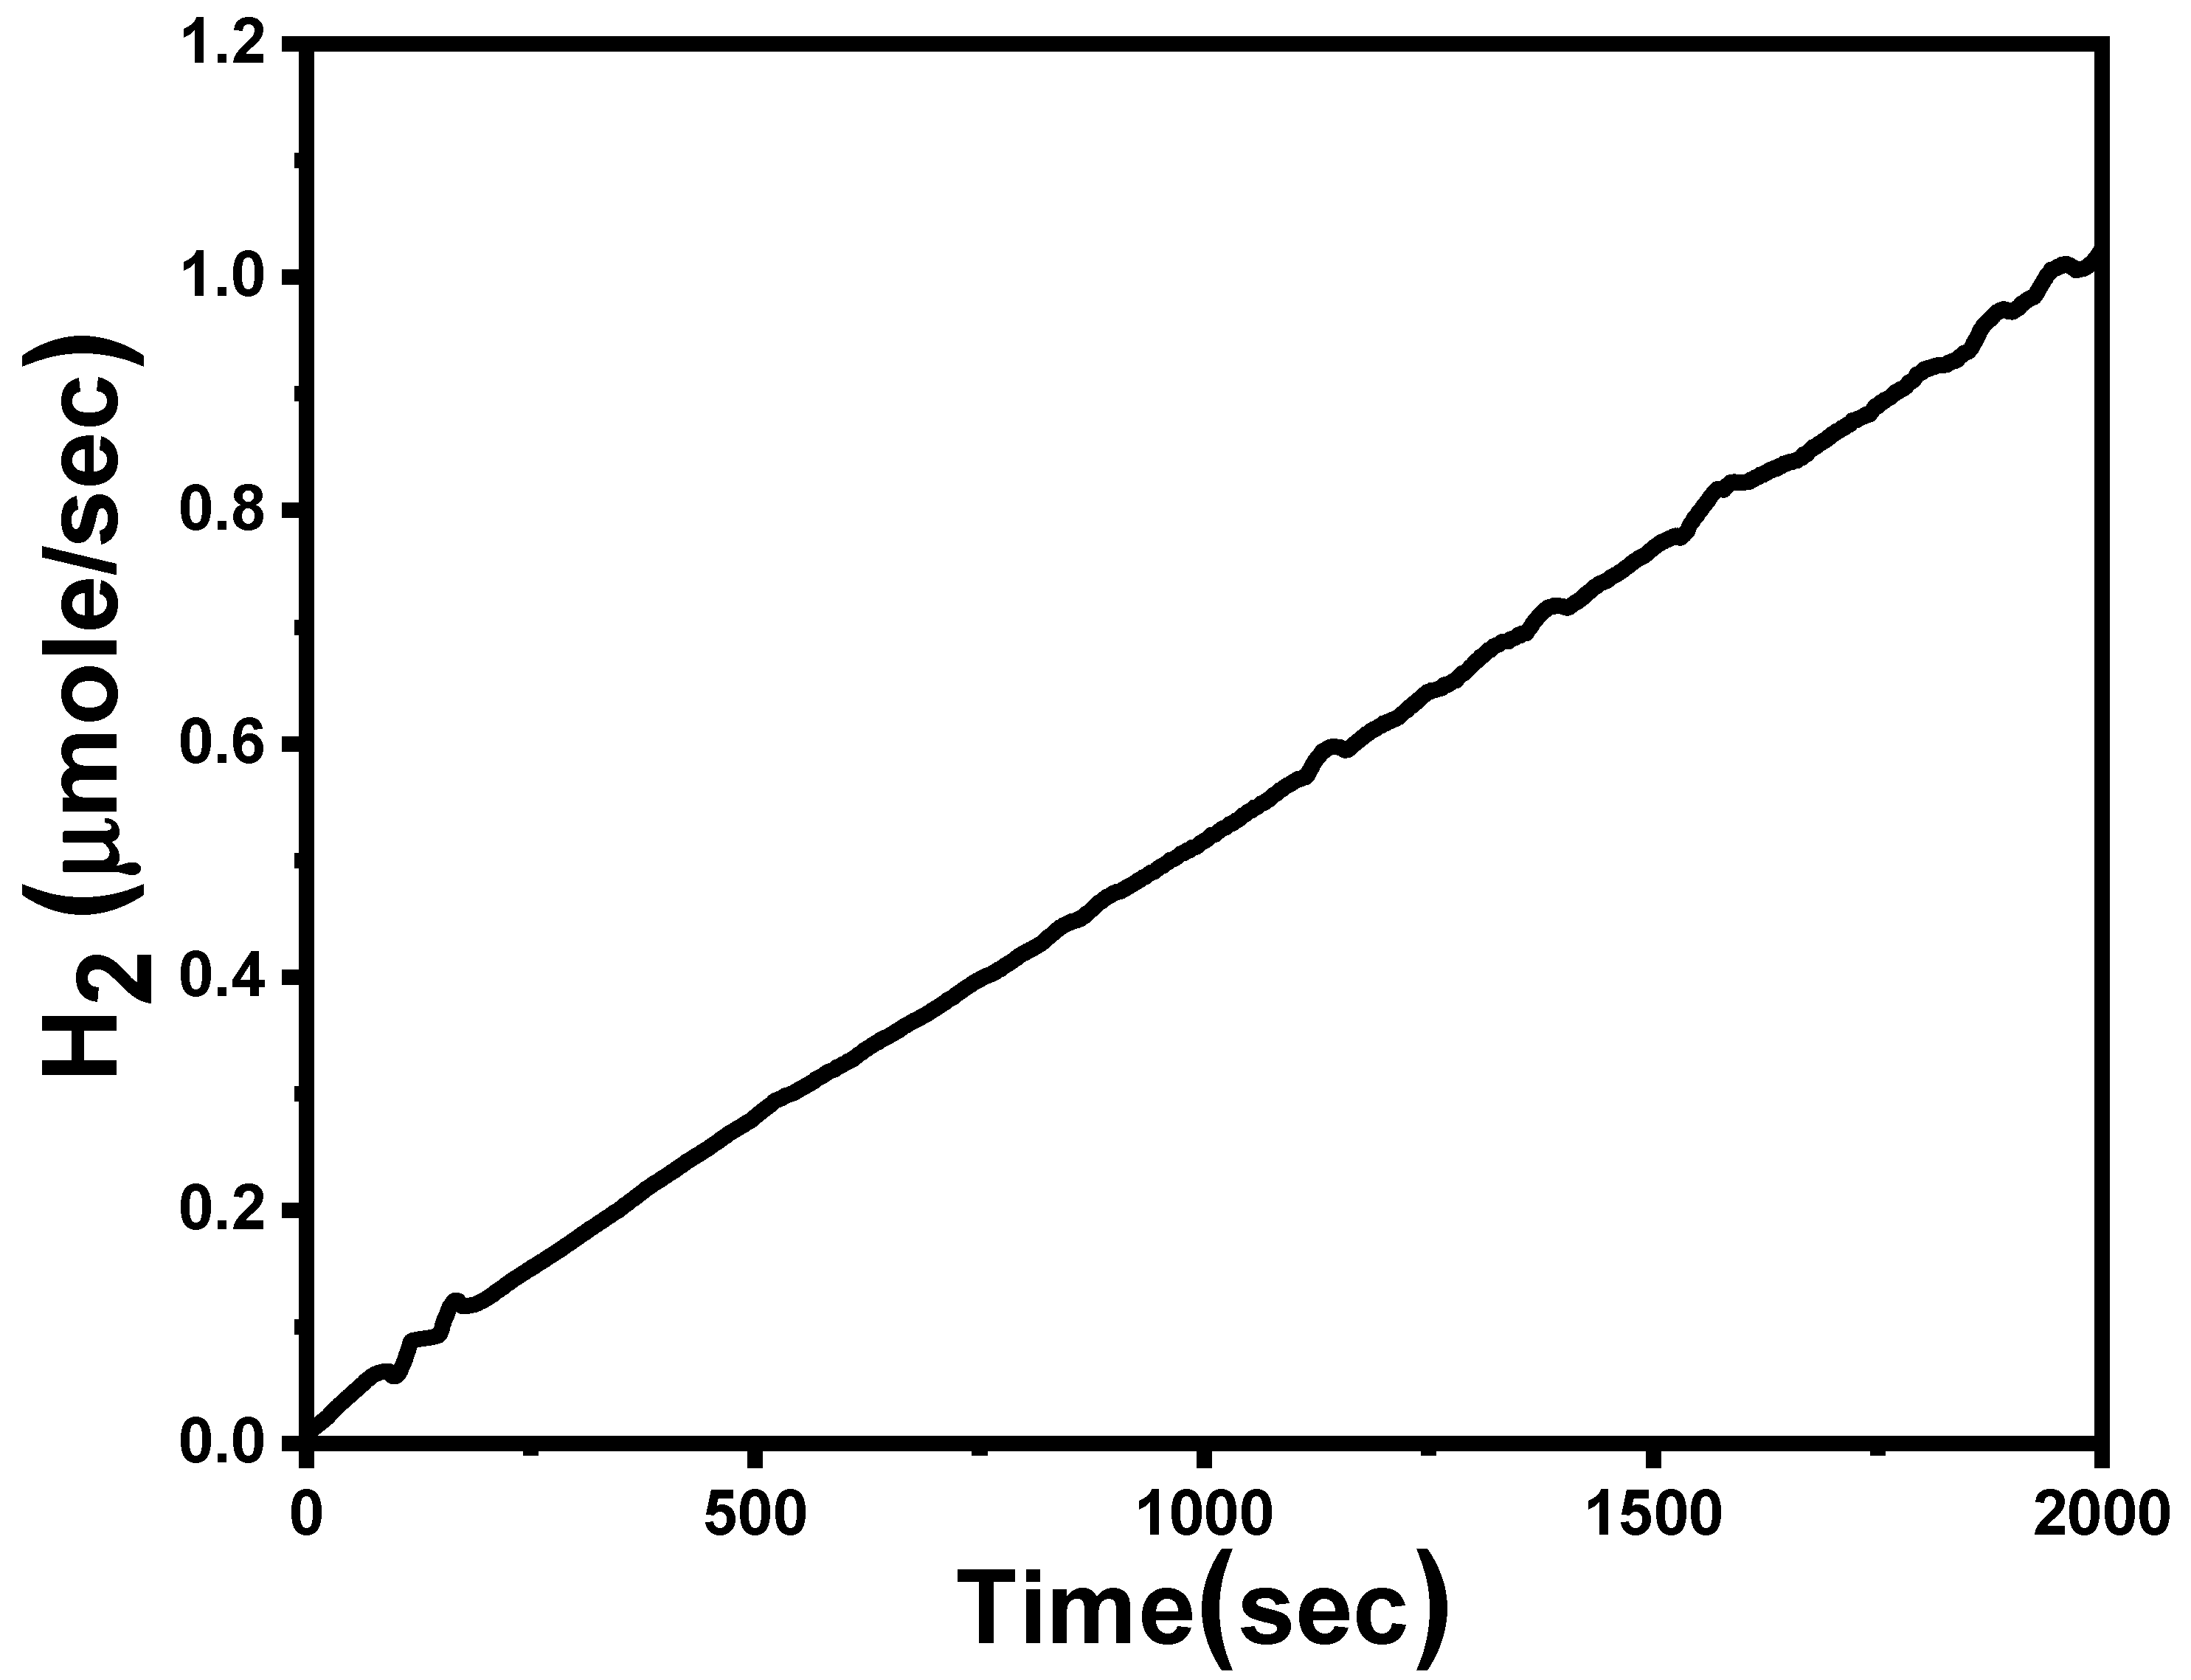
| Nanostructured Rock Wool (5 mg) | 0.3 M Na2SO4 (pH = 7) aqueous solution | 400 W Newport Xenon lamp | H2 moles = 1040.423 μmol/h·mg Jph = 0.25 to 0.20 mA/mg IPCE = 9.77% @ 307 nm | This work |
Publisher’s Note: MDPI stays neutral with regard to jurisdictional claims in published maps and institutional affiliations. |
© 2022 by the authors. Licensee MDPI, Basel, Switzerland. This article is an open access article distributed under the terms and conditions of the Creative Commons Attribution (CC BY) license (https://creativecommons.org/licenses/by/4.0/).
Share and Cite
El-Gharbawy, S.A.; Al-Dossari, M.; Zayed, M.; Saudi, H.A.; Hassaan, M.Y.; Alfryyan, N.; Shaban, M. Fabrication and Characterization of Nanostructured Rock Wool as a Novel Material for Efficient Water-Splitting Application. Nanomaterials 2022, 12, 2169. https://doi.org/10.3390/nano12132169
El-Gharbawy SA, Al-Dossari M, Zayed M, Saudi HA, Hassaan MY, Alfryyan N, Shaban M. Fabrication and Characterization of Nanostructured Rock Wool as a Novel Material for Efficient Water-Splitting Application. Nanomaterials. 2022; 12(13):2169. https://doi.org/10.3390/nano12132169
Chicago/Turabian StyleEl-Gharbawy, Sahar A., Mawaheb Al-Dossari, Mohamed Zayed, Heba A. Saudi, Mohamed Y. Hassaan, Nada Alfryyan, and Mohamed Shaban. 2022. "Fabrication and Characterization of Nanostructured Rock Wool as a Novel Material for Efficient Water-Splitting Application" Nanomaterials 12, no. 13: 2169. https://doi.org/10.3390/nano12132169
APA StyleEl-Gharbawy, S. A., Al-Dossari, M., Zayed, M., Saudi, H. A., Hassaan, M. Y., Alfryyan, N., & Shaban, M. (2022). Fabrication and Characterization of Nanostructured Rock Wool as a Novel Material for Efficient Water-Splitting Application. Nanomaterials, 12(13), 2169. https://doi.org/10.3390/nano12132169